Investigating the Electrolytic Properties of Salt (NaCl) in Gelatine for Conductive Gels in Electrocardiograms
Karen Attri
Grade 10
Presentation
Hypothesis
As we all know from videos of lightning striking sea water, water containing dissolved salts has electrolytic properties. This electrolytic conductivity comes from freed ions from the salt particles (NaCl) breaking off into positive cations of Na+ and negative anions of Cl- . Therefore, if we increase the concentration of salt in the gelatine solution, then the resistance of the gelatine will decrease because there will be more freed cations and anions to conduct the electrons.
Research
*See Attachments for formatted research portion
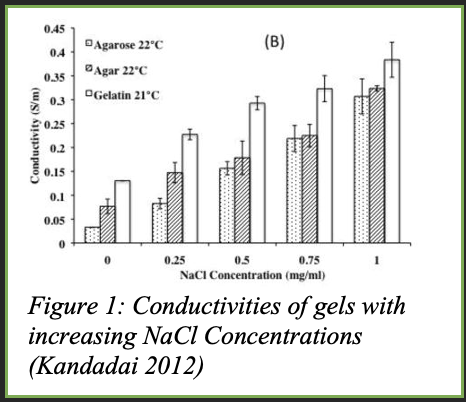
Commercial surface electrodes typically contain an electrode gel as a conductive medium to reduce electrical impedance/resistance between the skin and the Ag/AgCl electrode. This increases the accuracy of the electrode’s reading and minimizes the loss of electrical signals from the patient’s heart. Many of these commercial conductive gels are made of water, polymers like PVA or polyethylene glycol and gummy materials, and sodium chloride. Could I make my own electrode gel using household ingredients? After researching solid conductive gels, I came across a paper that was using gelatine and salt to mimic brain tissue as seen in Figure 1 illustrating how gelatine had the highest conductivity in comparison to Agarose and Agar samples. From here I decided to create the gels out of gelatine and use the electrolytic properties of salt for a conductive medium between the electrode and the skin.
Salt’s electrolytic properties comes from its ability to dissolve in water and separate into its component ions, in this case the positive cation (Na+) and negative anion (Cl-) as described in the following reaction:
NaCl(s) → Na+(aq) + Cl-(aq)
This process frees ions in the solution which ultimately carry electricity through the water, making the solution conductive.
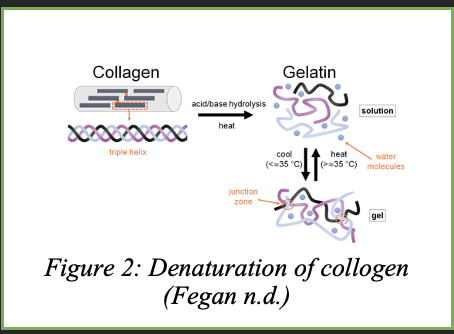
Gelatin is made up of collagen, a protein that is found in processed animal bones, cartilage, and skin. Collagen is made up of three polypeptide chains in a helical structure as shown in Figure 2, and when it is hydrolysed under heat, the collagen strands separate. As the solution cools, the chains try to regain their original structure but end up randomly coiling and trap water molecules in its gelatin network. In this experiment, the gelatin structure will trap the electrolyte solution in its network which will allow for the freed ions to transfer electricity as shown in the zwitter ion structure proposed by Thimann for this experiment:
protein + NaCl = Na protein + Cl-
protein + NaCl = protein Cl + Na+
After the gelatine solution has set, we can use a multimeter device to test the resistivity of the gels. The multimeter measures resistance by putting a small amount of current into the circuit, in our case the electrolyte gel, and measuring the voltage difference between the two probes. The device calculates resistance using Ohm’s Law, V = IR. The greater the resistance, the less conductive the gel.
Variables
|
Independent Variable |
Salt Ratio/Mass |
Range: equal, half, double, and triple the mass of gelatine powder Instrument: Electronic Balance (±0.01g) To test the effect of varying concentrations of salt on the resistance of gelatine different variations of the solutions will be created. |
|
Dependant Variable |
Resistance |
Instrument: Multimeter (±0.001ohms) The electrical resistance of the gel allows the investigation to quantify the relationship of salt concentration to resistance. |
|
Controlled Variable |
Reason for Control |
Method to Control |
|
Gelatine Ratio/Mass |
A different mass/ratio of gelatine would affect the resistance of the gels as well as diluting or increasing the concentration of salt. |
The mass of the gelatine will be measured out with an electric balance and the ratio of salt to gelatine determined by this mass |
|
Surface Area & Volume of Gels |
The distance between the probes and the volume of what it’s measuring influences resistivity readings. |
The surface area, size and volume of the gels will be kept consistent by measuring the volume of gelatine solution before setting and with the silicone molds. During the readings, the method for obtaining resistivity readings from the gels must remain consistent. |
|
Volume of Water |
The volume of water influences how the gelatine will set, with more water making the gelatine wetter. This can influence its resistivity. |
Measuring 50mL of water with a syringe for each variation of the conductive gel. |
|
Dissolution of Salt |
If the salt isn’t completely dissolved in the water prior to putting the gelatin powder, it will have less conductivity |
Stirring the boiled water and ensuring all salt crystals are dissolved and the solution is transparent before adding gelatin power. |
Procedure
Procedure and Methodology for the Conductive Gels
Materials
- Hot Water Kettle
- Electronic Balance
- Knox Unflavoured Gelatine
- Table Salt
- Water
- Digital Multimeter
- Pan/Mixing Bowl
- Measuring cup
- 10mL syringe
- Wisk
- Silicone Ice cube mold
- Food colouring
Methodology/Procedure (For Conductive Gels):
-
Obtain all materials.
- Record and measure mass of 4 different quantities of gelatine and approximately equal, half, double, and triple the amount of salt in comparison to the gelatine masses.
- Boil water from the tap in the kettle.
- Use syringe to measure 50mL of boiling water and transfer to a mixing bowl.
- Dissolve salt completely in the hot water and add food colouring to the solution.
- Add unflavoured gelatine powder to the solution and quickly stir until all the powder has dissolved and solution is transparent.
- Use syringe to measure out 10mL of solution and pour into silicone molds. Repeat until all the solution is in the molds.
- Rest in the fridge for at least 24 hours.
- Carefully remove gels from molds.
- Measure and record resistance after approximately 60 seconds with a multimeter by gently inserting tips of the probes at opposite ends of the gel.
- Repeat steps 3-10 for each variation of the salt-to-gelatine ratio.
Observations
Table 1: Mass of gelatine and salt as a function of gel resistance for various versions of conductive gels after being set in a fridge for 24 hours.
|
Version |
Mass of Gelatine (±0.01g) |
Mass of Salt (±0.01g) |
Gel Resistance (±0.001kiloohms) |
||
|
Trial 1 |
Trial 2 |
Trial 3 |
|||
|
A |
2.95 |
3.14 |
231.4 |
233.4 |
181.6 |
|
B |
4.10 |
2.30 |
192.5 |
184.2 |
181.6 |
|
C |
3.25 |
6.38 |
163.2 |
159.6 |
161.5 |
|
D |
5.53 |
16.02 |
|
|
|
|
E |
3.36 |
0.00 |
221.5 |
260.4 |
258.7 |
*Blacked out portion indicates gelatin did not set
Table 2: Qualitative observations of various gelatin gels after being set in a fridge for 24 hours.
|
Version |
Observations |
|
A |
Gel has set, is transparent/clear and jiggles. This version is less firm than the other versions and prone to breaking. When left in room temperature it “sweats” and releases some water. |
|
B |
Gel has set, is cloudy but still translucent, and is significantly firmer than version A and C. This version does not release water when left in room temperature conditions. |
|
C |
Gel has set, cloudier than version A but more translucent than version B. It is also firmer than version A but not as firm as version B and is still prone to breakage. Version C releases some water when left in room temperature. |
|
D |
Before adding gelatine to the mixture, it was observed that the salt did not completely dissolve. Gel did not set. Gelatine clumped up immediately and did not combine with the saltwater solution. After 24 hours the gelatine and water remained separate with gelatine clumping together at the bottom. |
|
E |
Gel has set, is clear and jiggles. Prone to breakage. The least firm of the gels, "sweats" in room temperature and releases water. |
General Observations: There was quite a bit of variation in the resistance readings for each of the gels in the first 60 seconds of placing the multimeter’s probes. The resistance readings would gradually climb and suddenly plummet as time went on, stabilizing after about 60s. This is why I decided to do 3 trials per resistance reading to get an average resistance.
Analysis
Analysis
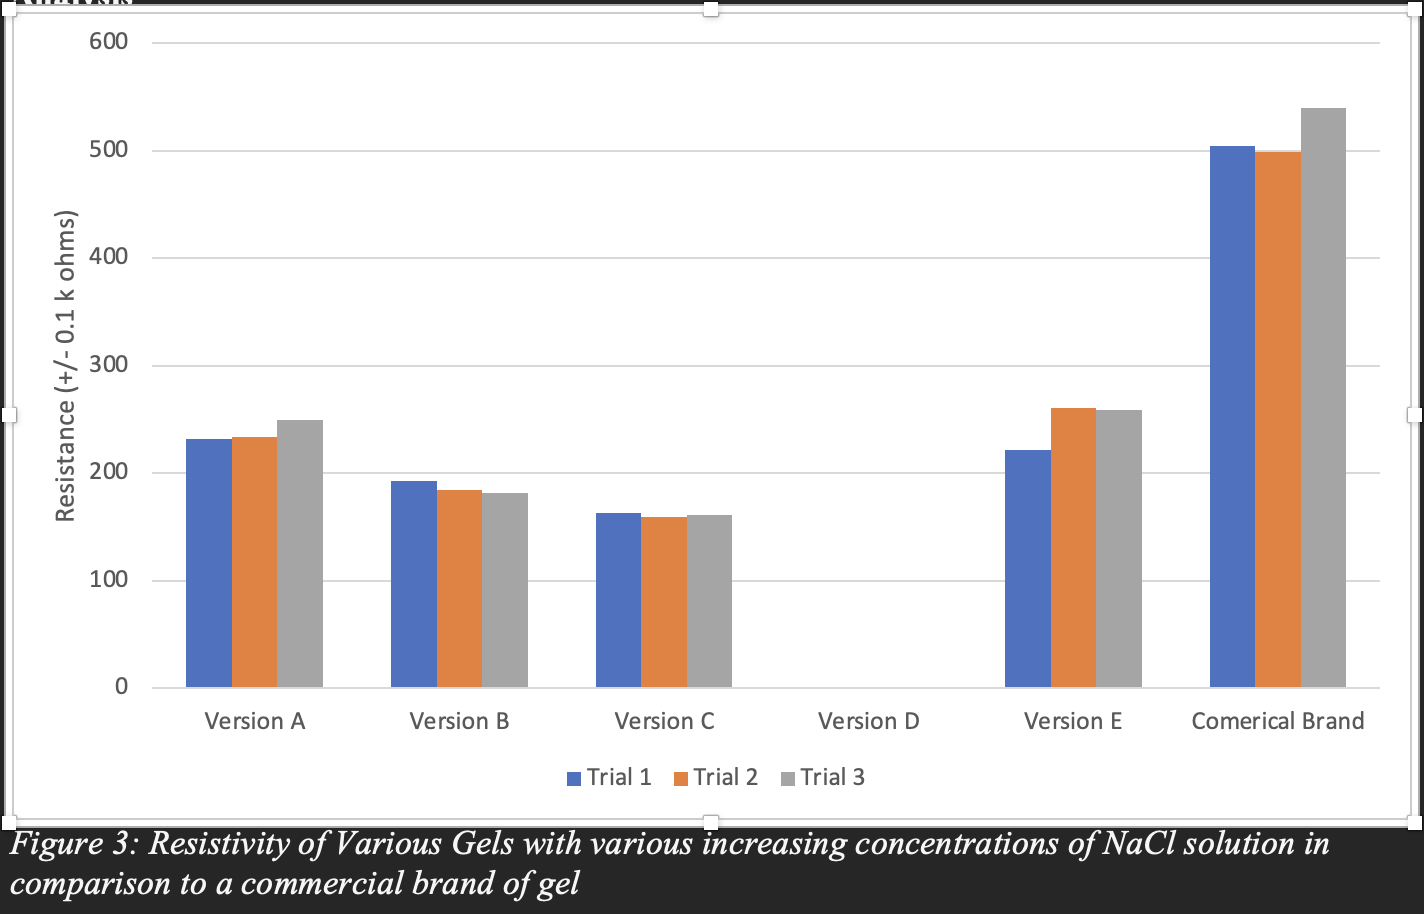
As observed in Figure 3, there is a general decrease in resistivity of the gel as the mass of the salt increases, supporting my hypothesis that increasing the concentration of salt decreases resistance in the gel. For example, as compared to the gel with 2.30g of salt (version A), the gel with 6.38g of salt (Version C) had less resistance, measuring to a difference of almost 100kW. A clear downward trend in resistance is also visible with Figure 3.
This supports the idea that gelatin’s conductivity increases with the concentration of dissolved salt particles that are trapped within its gelatinous network. Gelatin is ideal as it holds its shape while also allowing for the water and some of the freed NaCl ions to move around and conduct electricity.
However, Version D, with 16.03g (3:1 for salt to gelatine ratio) of salt doesn’t support my hypothesis, in fact, it didn’t even form a gelatine structure! After doing some more research on how and why gelatin sets, I realized that there may be a certain limit to the amount of salt that can be added to the gelatin before the structure collapses. Like how the enzyme in pineapples breaks down collagen and prevents the gelatin from setting, an overly high concentration of salt can also breakdown the collagen structure and bond with it. This is likely why version D did not form a gel. Qualitative observations found in Table 2 also support the idea that the more salt added to the gelatin the waterier it becomes. Using Figure 3 I can predict the ideal amount of salt being at around 5.00g, the point where its resistance is the lowest and the gel isn’t being broken down by salt particles.
As for the variation in the resistance readings, I later discovered after doing some research that I may have been essentially creating a small battery! The small amount of voltage discharged from the multimeter’s probes was probably building up in the ions, and because I had a negative electrode and a positive one in a electrolytic solution, the charge was gradually building up. This is likely why the resistance would gradually increase and suddenly decrease as time went on. In my experiment I noticed this and made sure to wait approximately 60 seconds before getting a reading when the resistance was most consistent.
Conclusion
Evidently, my hypothesis is supported by my findings in this investigation and supports the idea that the electrolytic properties of salt in gelatine can conductive gels that could potentially act as a replacement for surface ECG electrode pads. As the mass and concentration of salt increases, it’s resistance decreases, at least to the point where the salt doesn’t hinder the gelatine’s ability to form its gelatinous structure. This is supported by research done prior, however, none of those papers referenced how too much salt can affect the formation of gelatin. Ultimately, it can be concluded from this investigation that an increased concentration of salt decreases resistance.
Application
I originally decided to do this project for its application and use in electrocardiograms (ECG) devices. As someone who had just started to use an ECG device, I was shocked at the amount of used electrode pads I was accumulating as I would need at least 3 pads per reading. There was also a time where I ran out of the surface pads and while waiting for them to get delivered, and I tried to get a reading using aloe vera gel and salt (which I highly doubted the accuracy of). This was the impetus of my project and where I would want to apply it to. As seen in Figure 3 three out of four of my homemade gels performed better than the commercial brand with an overall lower resistivity. While my homemade gelatin gels probably won’t replace commercial surface electrode pads, they are a great environmentally friendly alternative. Gelatine, unlike the plastic padding from commercial surface electrodes can decompose naturally in approximately 7 weeks (Chen et al., 2022) in comparison to polyethene products that can take hundreds of years to degrade. Furthermore, these conductive gels were made with readily available household ingredients which could lower the healthcare disparity for 3rd world countries who may not have access to commercial surface electrode pads. Who would have thought that salty gelatine could have such a significant application in healthcare!
Sources Of Error
|
Source and Type of Error |
Effect on Results |
Possible Improvement |
|
Systematic Error: mass of gelatin |
Imperfect ratios and slightly different masses of gelatin throughout the trails and variations introduces extra variation into resistance readings |
Keeping the mass of gelatine the exact same throughout every trial instead of using a ratio |
|
Systematic Error: variation in resistance readings |
As time went on, the resistance fluctuated and would eventually stabilize but almost never stabilize to one number. This led to less accurate readings. |
Do more trials and take an average of the resistance readings. |
|
Systematic Error: Temperature of Gels |
Gels that rested at room temperature generally had lower resistance than gels taken directly out of the fridge. |
Test resistance inside the fridge to prevent warming of the gels. |
Citations
“Electro-Gel (EEG Electrode Gel).” Safety Data Sheet for Electro-Gel, 2016, www.biopac.com/wp-content/uploads/MSDS_Electro-Gel.pdf.
“Solid Gel EKG Snap Electrodes.” MVAP Medical Supplies > SDS Forms, 2005, www.mvapmed.com/sds-forms.html.
Grassini, S. “Electrochemical Impedance Spectroscopy (EIS) for in-Situ Analysis of Metallic Heritage Artifacts.” ECG Electrode - an Overview | ScienceDirect Topics, 2013, www.sciencedirect.com/topics/materials-science/ecg-electrode#:~:text=Many%20different%20electrode%20systems%20are,by%20a%20surrounding%20adhesive%20flange.
Kwak, Yoon. “US5178143A - Electrically Conductive Gel Composition.” Google Patents, Google, 1992, patents.google.com/patent/US5178143A/en.
Kandadai, Madhuvanthi. “Comparison of Electrical Conductivities of Various Brain Phantom Gels: Developing a ‘Brain Gel Model.’” National Library of Medicine, 2012, www.ncbi.nlm.nih.gov/pmc/articles/PMC3489480/#:~:text=Gelatin%20showed%20the%20highest%20conductivity,increased%20mobility%20of%20charge%20carriers.
Dabrowska, A. “Wiley Online Library | Scientific Research Articles, Journals, ...” Materials Used to Simulate Physical Properties of Human Skin, 2015, onlinelibrary.wiley.com/.
Thimann, Kenneth. “THE EFFECT OF SALTS ON THE IONISATION OF GELATIN.” National Center for Biotechnology Information, U.S. National Library of Medicine, 1930, www.ncbi.nlm.nih.gov/.
Author links open overlay panelLiang Chen a b 1, et al. “Gelatin from Leather Waste to Tough Biodegradable Packaging Film: One Valuable Recycling Solution for Waste Gelatin from Leather Industry.” Waste Management, Pergamon, 28 Apr. 2022, www.sciencedirect.com/science/article/abs/pii/S0956053X2200191X#:~:text=Owing%20to%20the%20water%20resistance,soil%20in%20approximately%207%20weeks.
Acknowledgement
Thank you to my parents for buying all of my materials and putting up with the rediculous amount of gelatine I left in the fridge!
I'd also like to thank Capstone Engineering Academy for letting me use thier equipment and lab to put the arduino device together, as well as mentorship throughout the process.
Finally - to all my buddies that helped me learn arduino programming and fritzing, understand the chemistry behind this project (as well as the 3 hour lecture on redox reactions) and encouragement through all my setbacks - couldn't have done it without you!