PoachPatrol: An AI Based Smart Wildlife Monitoring System For Reporting Suspicious Activity Related To Poaching For Wildlife Conservation
Grade 9
Presentation
No video provided
Problem
Introduction To The Project:
Wildlife conservation faces significant challenges, particularly in regions where endangered species are threatened by human activities such as poaching. With advancements in technology, there is potential to combat these threats through innovative tools designed to protect animals.
What Is Poaching, and Why Is It An Issue?:
Poaching, the illegal hunting or capturing of animals, is a severe and ongoing problem that jeopardizes wildlife populations worldwide.
Poaching remains a dire threat to biodiversity, and it is responsible for the illegal killing of millions of animals each year. As of 2023, experts estimate that 100 African elephants are killed daily for their ivory. This equates to around 36,500 elephants lost each year, severely undermining the survival of this species. Poaching also poses a major risk to the survival of other species, such as rhinos, tigers, and pangolins.
Many species, particularly large animals such as elephants, rhinos, and tigers, are pushed to the brink of extinction due to poaching. For instance, the top five animals that poachers are hunting into extinction include elephants, rhinos, tigers, pangolins, and sea turtles (Save the Rhino International, 2025).
The illegal wildlife trade is a multi-billion-dollar industry. This illegal trade fuels organized criminal networks, which in turn fund other illicit activities, such as arms and drug trafficking. As a result, poaching is not just an environmental issue, it also has wide-ranging socio-economic and security implications.
In 2024, poaching remains a severe global problem, with many species being hunted for their tusks, skins, horns, and other body parts, contributing to a drastic decline in biodiversity (Poaching by Country, 2025).
The poaching crisis is further amplified by several factors:
- Demand for Animal Products: There is significant global demand for products like elephant ivory, rhino horns, tiger skins, and pangolin scales. In some regions, these products are seen as symbols of wealth or status. Additionally, in traditional medicine markets, items like rhino horns are believed to have medicinal properties, further driving the illegal trade.
- Weak Enforcement of Wildlife Protection Laws: In many regions, especially in developing countries, the enforcement of wildlife protection laws is often inadequate. Rangers are under-resourced and sometimes poorly trained, leaving vast protected areas vulnerable to poaching. As of 2019, the International Union for Conservation of Nature (IUCN) reported that nearly 40% of protected areas had inadequate monitoring or enforcement, leaving many wildlife species exposed to poachers.
- Economic Incentives: Poaching is often driven by high financial incentives. For example, the black market price of rhino horn can reach up to $60,000 per kilogram, making it more valuable than gold. This economic lure makes poaching attractive even to local communities that may be struggling financially, despite the risks involved.
Geographical Challenges: Many poaching hotspots are located in vast, remote, and often hostile environments, such as African savannas, Southeast Asian rainforests, and South American jungles. Monitoring and patrolling these large areas is a formidable challenge. As of 2022, 60% of the world’s protected areas for wildlife are in regions that are difficult to access and monitor effectively.
Efforts to combat poaching have been hindered by a lack of sufficient surveillance, slow response times, and the vastness of wildlife habitats, particularly in regions like Africa, Southeast Asia, and South America. Poachers often use sophisticated methods to avoid detection, including using firearms, snares, and traps that are hard to trace. This underscores the need for more efficient and technologically advanced solutions to protect endangered species from human threats.
Poaching In Canada + Stats:
Wildlife poaching in Canada poses significant threats to biodiversity, targeting species such as polar bears and black bears. Between 2002 and 2021, over 4,000 polar bear hides were exported from Canada, with annual exports peaking at approximately 300-400 in 2012-2013 and averaging 150 hides from 2015 to 2021 (The Guardian, 2025). In 2019, Canada participated in Operation Thunderball, a global enforcement effort involving 109 countries, which led to the interception of items like pangolin carcasses and black bear parts within Canada (Government of Canada, 2019). These incidents highlight the ongoing challenges in fighting wildlife crime and the necessity for continued international collaboration to protect Canada's wildlife.
The illegal wildlife trade is a significant global issue, ranking as the fourth-largest criminal enterprise worldwide, with an estimated annual value of $175 billion (Canadian Geographic, 2022). Canada plays a notable role in this trade, both as an importer and exporter. Between 2014 and 2019, the country imported at least 1.8 million wild animals, with less than 8% subjected to permits from agencies like the Canadian Food Inspection Agency (CFIA) or the Convention on International Trade in Endangered Species of Wild Fauna and Flora (CITES) (World Animal Protection Canada, 2021). Notably, in 2019, approximately 80% of the 320,000 wild animals imported were destined for the exotic pet trade (World Animal Protection Canada, 2021). This extensive trade not only threatens global biodiversity but also raises concerns about biosecurity and the potential spread of zoonotic diseases (a disease which is transmitted from an animal to a human, like Covid-19) within Canada.
Current Poaching Detection Devices and Their Limitations:
Current methods to detect poaching typically involve a combination of human patrols, surveillance cameras, infrared technology, and even drones. Each of these solutions has its strengths but also faces notable challenges:
-
Human Patrolling: Ranger patrols are one of the most common approaches to detecting and preventing poaching. Furthermore, ranger teams can be few in number and under-resourced, limiting their effectiveness in real-time intervention. Rangers often operate in remote and difficult terrains, which makes it difficult to monitor large areas of land, especially during the night when poaching often takes place. They are often outnumbered and overworked, and its clear that the sheer size of protected areas makes it almost impossible for patrol teams to cover all areas effectively. According to the World Wildlife Fund (WWF), there are an estimated one to two rangers per 100,000 square kilometers of protected areas in many regions, making it difficult to respond rapidly to poaching events.

Ranger In Field
-
Surveillance Cameras: Remote surveillance cameras (often infrared) are commonly used in protected areas. They can capture footage of animals and poachers at night or in dense areas.
While surveillance cameras include infrared and motion-activated cameras, and are widely used in conservation, they have several limitations:
- Cameras are expensive to install and maintain, particularly in remote areas.
- They are prone to failure due to environmental conditions (e.g., harsh weather, animal interference).
- Surveillance footage often requires time-consuming human review, which leads to delayed responses.
- Coverage is often limited to specific, fixed locations rather than offering real-time updates across large areas.

-
Drones: Drones are increasingly used in wildlife conservation for aerial surveillance, especially in large or difficult-to-reach areas. They can monitor vast areas in real time, detect movement, and send alerts. Drones offer many benefits, including the ability to cover large areas and collect real-time data.
However, they come with several challenges:
-
Cost: High-end drones with thermal or infrared capabilities can be prohibitively expensive, making them out of reach for many wildlife protection organizations.
-
Battery Life: Drones are limited by battery life, often offering only 30-60 minutes of flight time before needing to recharge.
-
Weather Sensitivity: Drones can struggle in adverse weather conditions, such as heavy rain, wind, or fog, which limits their effectiveness in certain environments.

The drones operate autonomously, are able to identify illegal activity
-
Radio Collar/Tracking Technology: Some wildlife organizations have used GPS collars or radio transmitters to track endangered species. While these devices provide real-time location data, they are typically used for monitoring animal movements rather than detecting poaching. They can help researchers locate animals, but they do not actively respond to or detect poaching events. Moreover, such devices are vulnerable to tampering or removal by poachers.

Thanda Safari Big Five game reserve in KwaZulu Natal has announced its AI-driven technology to safely counter rhino poaching.
*Despite these technologies, a gap still exists in terms of affordability, real-time, and autonomous detection and response to poaching.
The Main Problem With Using Such Means For Poaching Detection:
As explained, current means and technologies (see above) for detecting suspicious activity linked to poaching are either very expensive to operate or are easily detectable by poachers, making it easier to bypass such security systems and devices, and therfore hunt endangered animals. Poachers often exploit these devices weaknesses by jamming or hacking radio signals used by surveillance drones, and identifying blind spots in cameras that are physically very large and visible. Additionally, they may move at night to avoid detection, disable or destroy visible security equipment (like large cameras or drones), and use silenced weapons to avoid triggering sound-based alerts. Its clear that there is a very crucial need for a new system/design to detect and alert athorities of suspicous activity.
Identified Aspects Needed For A More Succesful Design:
I identified that there were 3 aspects that current technologies/means for anti-poaching efforts were missing, and decided to incorporate these 3 aspects into my device.
- The first aspect was to make a device that was discreet, meaning undetectable to poachers visibly. Using drones, or large surveillance cameras (like current technologies) make it super easy to track down and avoid/destroy. For this purpose, I could use very small cameras that could be hidden in tree trunks, or foliage.
- The second aspect was to make this device/system more efficient. This could be done so by leveraging detection technology to identify suspicious activity and alert authorities to check live footage from the camera. This would be great as authorities wouldnt have to scroll manually through footage to find a particular point, and would instantly be notified and provided with live footage instead.
- The last aspect is to make the final product cost-effective. It is important to note that cost-effectiveness is crucial for poaching detection systems because conservation organizations often operate with limited funding, making it difficult to sustain expensive surveillance technologies over long periods. Current technologies, such as satellite monitoring, thermal imaging drones, and advanced sensor networks, are not only costly to purchase but also require significant maintenance, specialized training, and operational expenses. This financial burden limits their widespread deployment, especially in remote or resource-constrained areas where poaching mostly occurs. As a result, many protected areas remain in threat due to the lack of affordable, scalable solutions, allowing poachers to exploit gaps in surveillance and continue their illegal activities unchecked.
So, to summarize it is crucial to develop a more discreet, intelligent, and cost-effective device.
Additional Design Objectives:
This project also aims to create an easily deployable, scalable solution that can be utilized in regions where resources for wildlife protection are limited. The goal is to make this solution accessible to a wide range of conservationists, poaching prevention agencies, and wildlife protection organizations, enhancing their ability to protect endangered species while minimizing the risk of poaching. The design should be easy to build, and have a relatively simple design/construction process, so others, whether at home or not, can experiment with further improving this technology, thus making it more scalable/accessible. To improve device efficacy in protecting wildlife, camera placement could be prioritized on loactions where poaching mainly happens, or where most animals meet.
Method
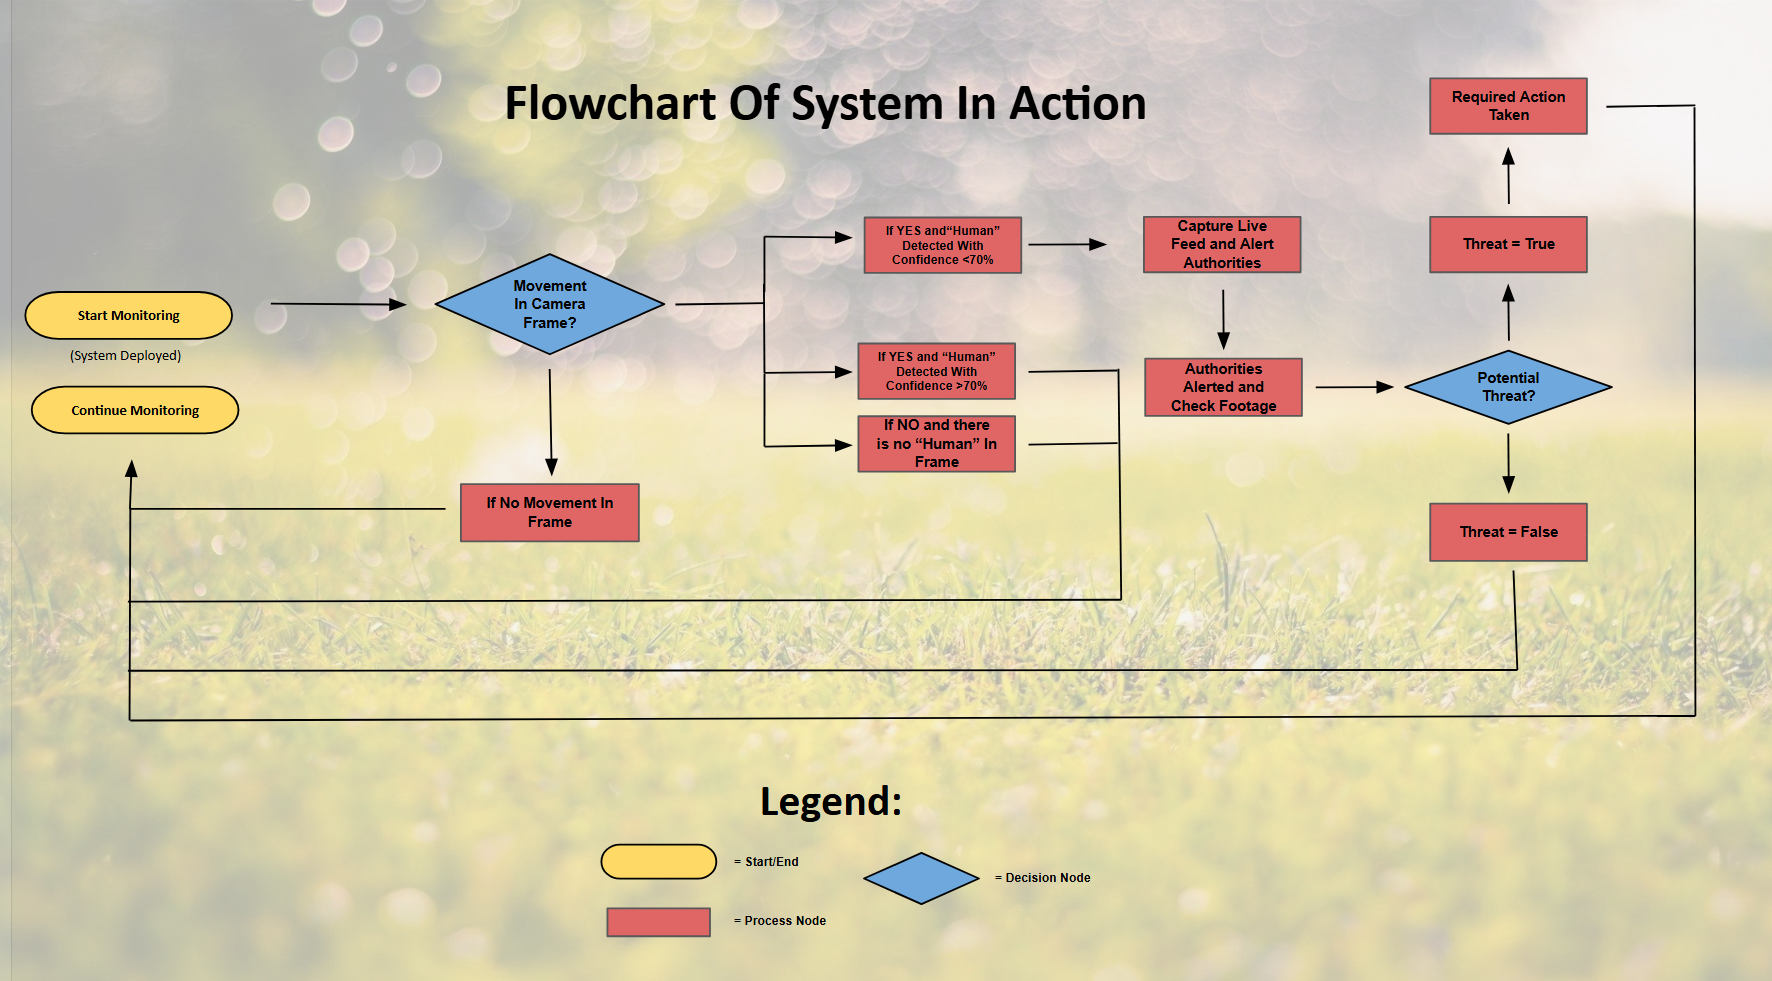
Flowchart Of Planned System In Action:
What I Need To Do To Create The System:
1. Train Model
- Test Model
- Gather Info on Performance
2. Add Notification System
- For Detecting Suspicous Activity and Alerts "Authorities"
- Test/Run
3. Build and Test Physical Device
- Gather Components For Device
- Test Functionality
1. Microcontroller
ESP32 is affordable and versatile, and it supports both Wi-Fi and Bluetooth.
- Raspberry Pi Zero is another option, pretty good for linux.
Where to potentially buy:
- ESP32:
- Amazon Canada Price: $12 - $20 CAD
- RobotShop Canada Price: $12 - $17 CAD
- Raspberry Pi Zero W (with Wi-Fi):
- The Pi Hut Price: $16 - $20 CAD
- Amazon Canada Price: $18 - $30 CAD
2. GPS Module:
GPS modules like the Neo-6M GPS works well for outdoor tracking.
Where to buy:
- RobotShop Canada: Ublox NEO-6M GPS Module Price: $15 - $30 CAD
- Amazon Canada: Neo-6M GPS Module Price: $10 - $25 CAD
3. Low-Power Camera (Ideally ESP32-CAM or similar)
- The ESP32-CAM module has a small camera, built-in Wi-Fi, and can be used for capturing images or video.
Where to buy:
- Amazon Canada: ESP32-CAM Price: $10 - $15 CAD
- RobotShop Canada: ESP32-CAM Module Price: $10 - $12 CAD
4. Communication Module (LoRa or GSM)
- LoRa is great for long-range communication, and GSM can work for areas with mobile coverage.
- LoRa Module (ex model: SX1278)
- GSM Module (ex model: SIM800L)
Where to buy:
- LoRa Module:
- Amazon Canada: LoRa SX1278 Module Price: $10 - $15 CAD
- RobotShop Canada: LoRa SX1278 Module Price: $10 - $15 CAD
- GSM Module:
- Amazon Canada: SIM800L GSM Module Price: $5 - $15 CAD
5. Power Supply (Rechargeable LiPo Battery + Solar Panel)
- A LiPo battery with solar charging would provide continuous power for outdoor use.
Where to buy:
- LiPo Battery:
- Amazon Canada: LiPo Battery Price: $8 - $15 CAD
- Solar Panel (for outdoor charging):
- Amazon Canada: Solar Charging Panel Price: $10 - $25 CAD
- RobotShop Canada: LiPo Battery and Solar Charger Kit Price: $15 - $25 CAD
6. Weatherproof Enclosure (for Electronics If Needed)
- A small waterproof case for housing the components is necessary for outdoor durability.
Where to buy:
- Amazon Canada: Weatherproof Enclosure Price: $8 - $15 CAD
Estimated Total Cost:
Here’s a rough estimate of the total cost of materials, based on the components mentioned:
- Microcontroller (ESP32 or Raspberry Pi Zero): $12 - $30
- GPS Module: $10 - $30
- Low-Power Camera: $10 - $15
- Communication Module (LoRa/GSM): $10 - $15
- Power Supply (LiPo or Solar Panel): $15 - $40
- Weatherproof Enclosure: $8 - $15
Total Estimated Cost: $65 - $155 CAD
Training the YOLO Object Detection Model:
First though…what even is YOLO?
YOLO (You Only Look Once) is a real-time object detection algorithm used in computer vision projects to identify and classify objects in images and videos. Unlike traditional methods that analyze an image in multiple stages, YOLO processes the entire image/video in a single pass using a convolutional neural network (CNN), making it significantly faster and more efficient. It is widely used in applications like surveillance, autonomous driving, and monitoring due to its ability to detect multiple objects with high speed and accuracy.
Additional Info:
A CNN (Convolutional Neural Network) is a type of deep learning model specifically designed for processing visual data, such as images and videos. It mimics how the human brain recognizes patterns by using layers of filters (kernels) to automatically detect features like edges, textures, shapes, and objects. CNNs consist of multiple layers, including:
- Convolutional layers – Extract important features from the image.
- Pooling layers – Reduce the size of feature maps to make the model more efficient.
- Fully connected layers – Make final predictions based on extracted features.
CNNs are widely used in tasks like image classification, object detection (such as YOLO), facial recognition, and medical imaging because of their ability to detect complex patterns with high accuracy.
In my project, I will be using YOLOv8 to detect humans which could potentially be poachers and cause harm to animals.
1. Finding and Annotating Dataset:
To start with, I had to find/collect images of people, specifically in a wildlife environment. I collected images with people in the daytime and nighttime. I chose to do this as most poaching and illegal activity tends to happen at night, where visibility is lower, which is why it was important to train my model based off of such images that would replicate real life scenarios. I used open source images and datasets from roboflow universe.

Annotating The Datset:
Annotating a dataset is basically the process of labeling data (such as images, videos, or text) with relevant information to train machine learning models. In computer vision, this typically involves drawing bounding boxes, polygons, or segmentation masks around objects in images and assigning them category labels (e.g "elephant," "human," "vehicle").
These annotations help the model learn to recognize and differentiate objects during training. High-quality annotations are crucial for accurate object detection, classification, and segmentation in AI applications like YOLO-based poacher detection systems.
There are many ways we can label a dataset. In this case, I decided to use roboflows universe open source computer vision datasets. I was able to find a prelabeled dataset of people for my project.
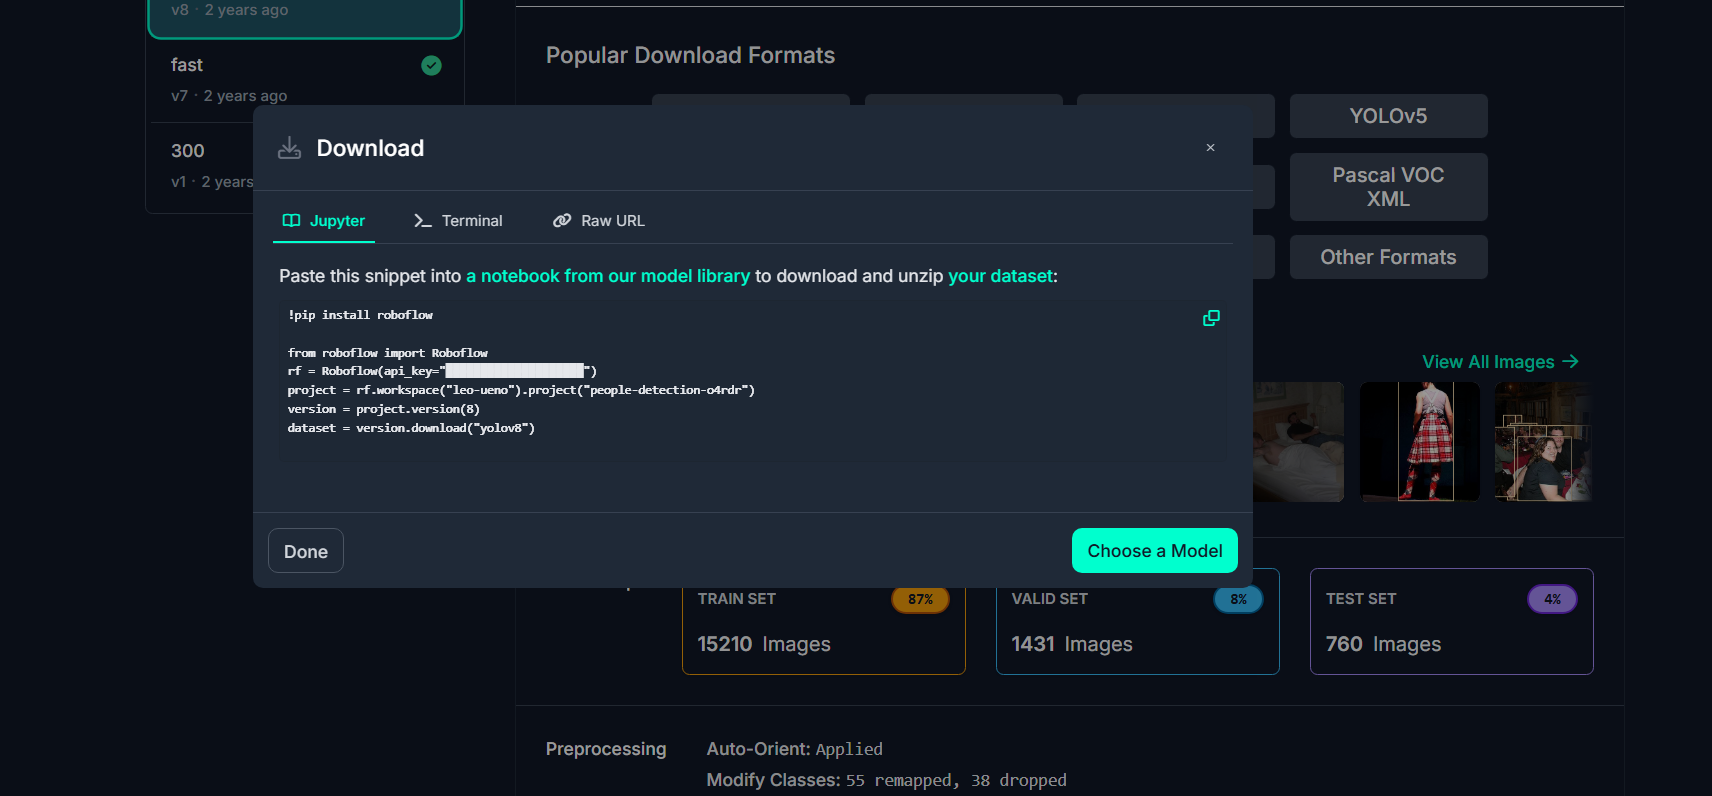
The dataset was split into 3 categories: Train, Valid, and Test.In machine learning, especially for tasks like object detection, splitting the dataset into Train, Validation (Valid), and Test sets is crucial for building an effective model. The training dataset had 15120 images, the valid dataset had 1431 and the Test dateset had 760 after pre-processing and augmentations were applied (see below for more information on what this is).
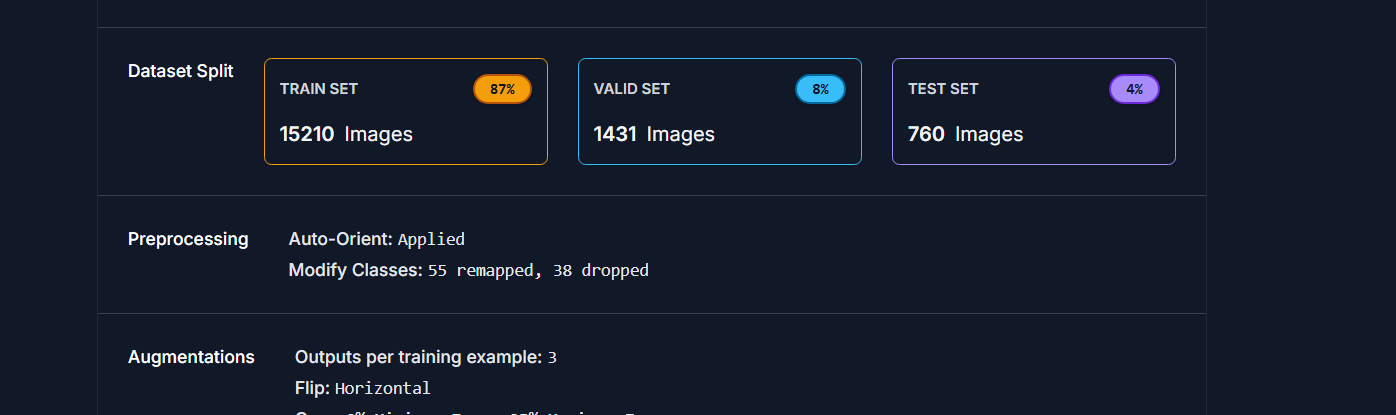
Before I got the download code of this dataset, I had to do some pre-processing and augmentation of the dataset. For the pre-processing the options selected were auto-orient and other options. For the augmentation, I selected the horizontal flip option, along with many others (see below).
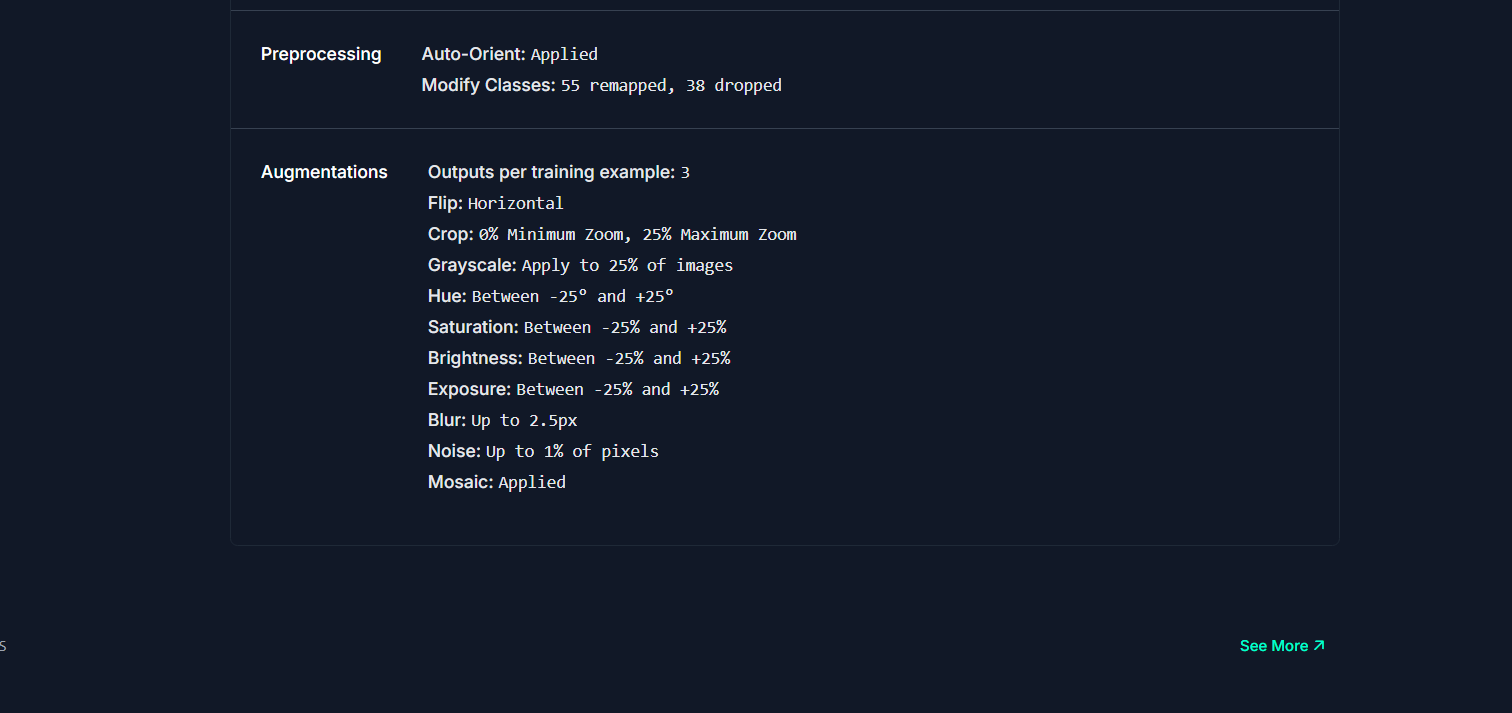
Brief Overview of Preprocessing and Augmenation:
Preprocessing:
This step ensures your images are standardized and optimized for my model.
One example could be applying the auto-orient option.
- Auto-Orient Option:
- Automatically corrects the orientation of images based on their metadata.
- Ensures that images aren’t accidentally rotated or flipped incorrectly during training, which helps the model learn correctly
Augmentation:
Augmentation artificially increases the diversity of the dataset, helping the model generalize better.
An example would be applying the horizontal flip option.
- Horizontal Flip:
- Flips images horizontally, creating a mirrored version of the original.
- Helps the model recognize objects (like humans) in different orientations or perspectives.
- Useful for scenarios where directionality/position isn’t fixed (like detecting humans facing left or right)
Once that was done, I selected the download dataset button. Then i got the download code for this specific dataset under the format of yolov8.
The download code, is a snippet code which can be used for custom training your dataset in a notebook. In my case, I will be using google collaboration.
Snippet Code: A small reusable piece of code.
Using Google Collabs For Training The Model (Step By Step Process):
For this next part, I wil be using a roboflow google notebook for training.
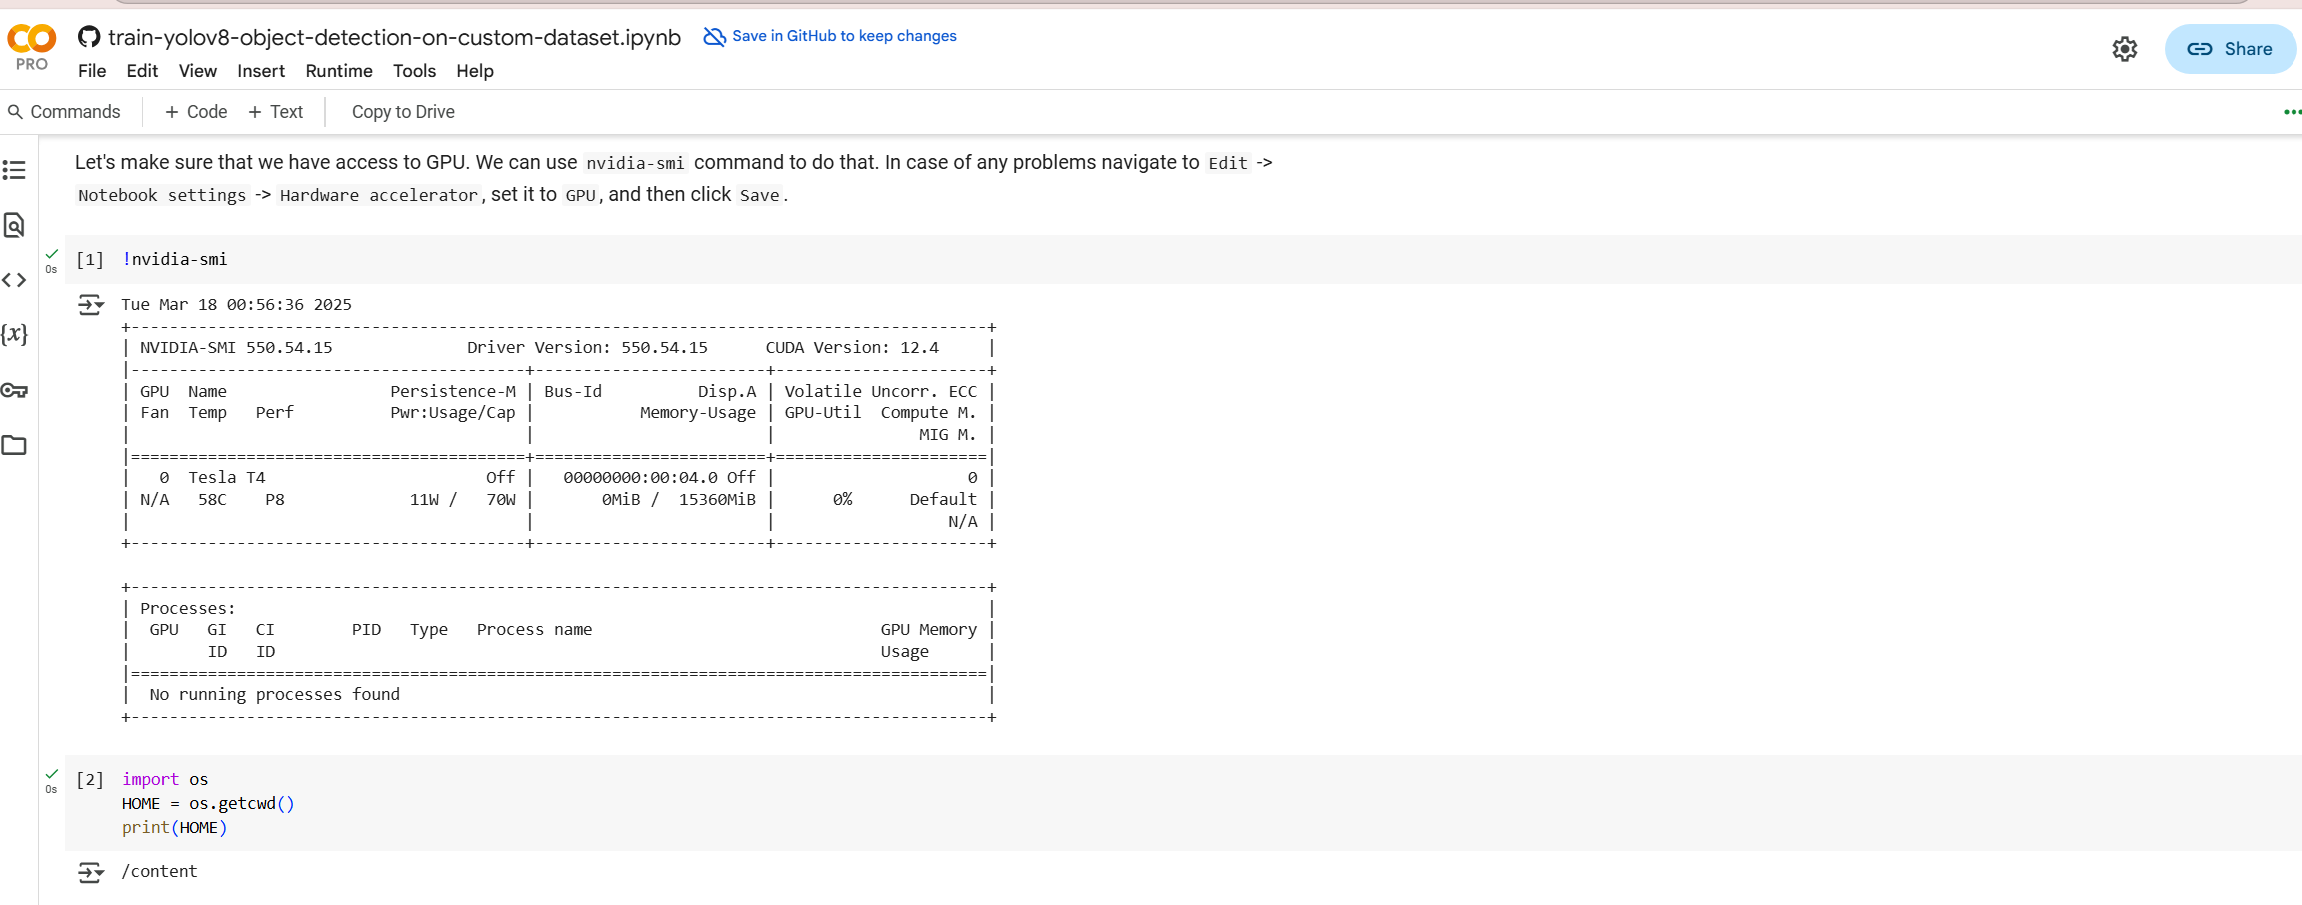
1. Check to make sure GPU is running correctly.
A GPU (Graphics Processing Unit) is a specialized processor designed to handle complex mathematical calculations quickly, especially those related to graphics and parallel processing tasks.
- Unlike a CPU (Central Processing Unit), which handles general tasks sequentially, a GPU can process thousands of tasks simultaneously.
- This makes it ideal for machine learning tasks, like training neural networks, where massive amounts of data and calculations are processed in parallel.
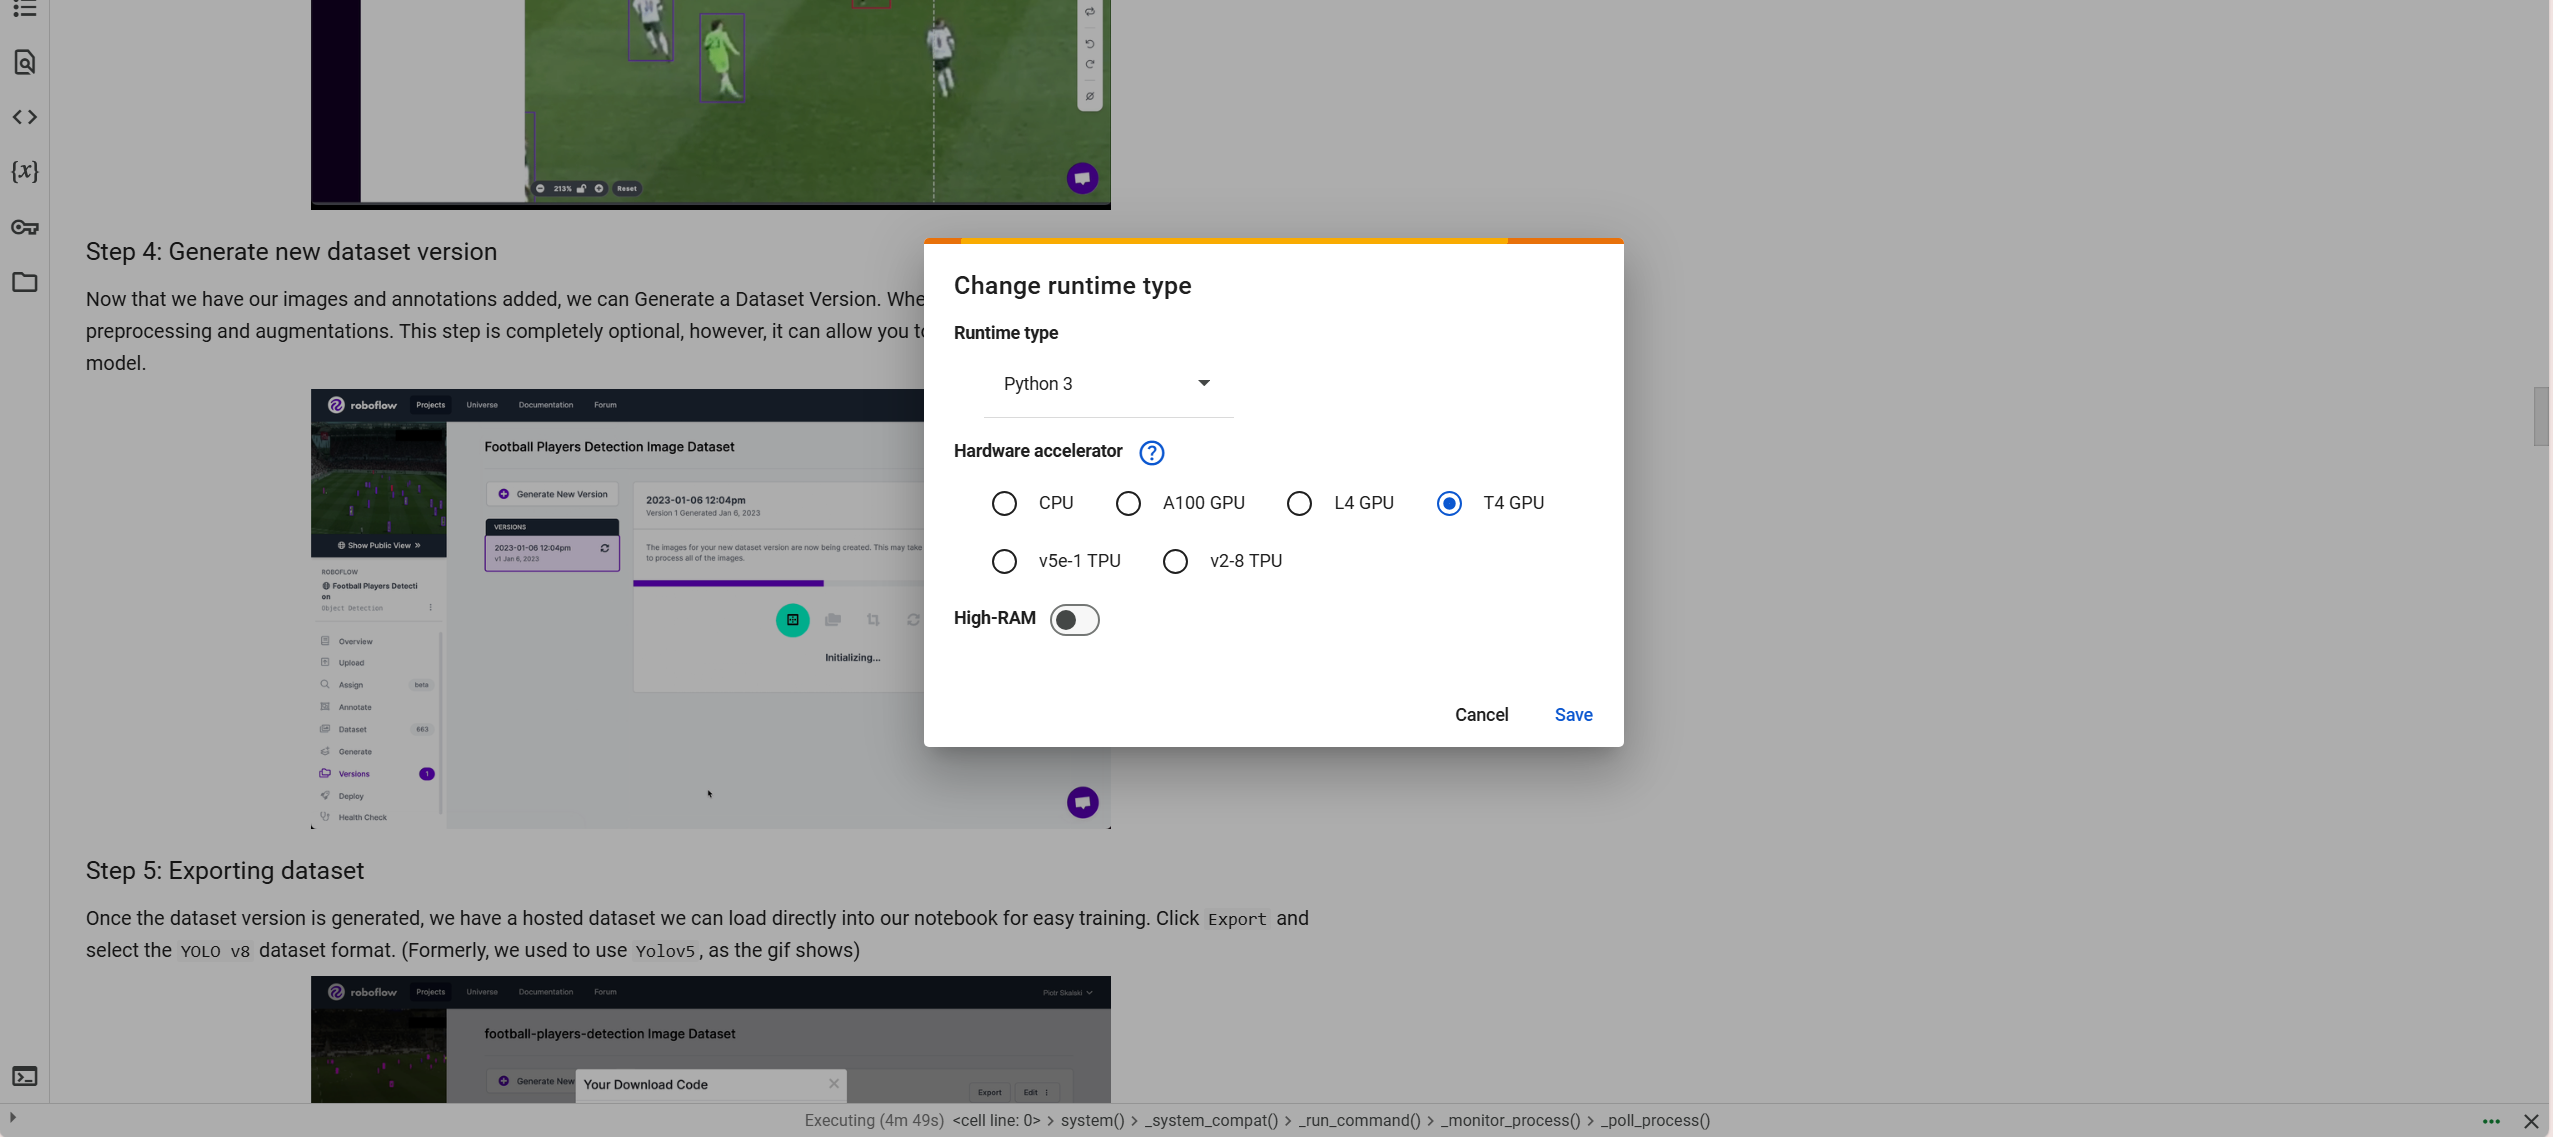
In my project as you can see above, ill be using a T4 GPU.
Playing the first cell block of code confirms I have access to the GPU.
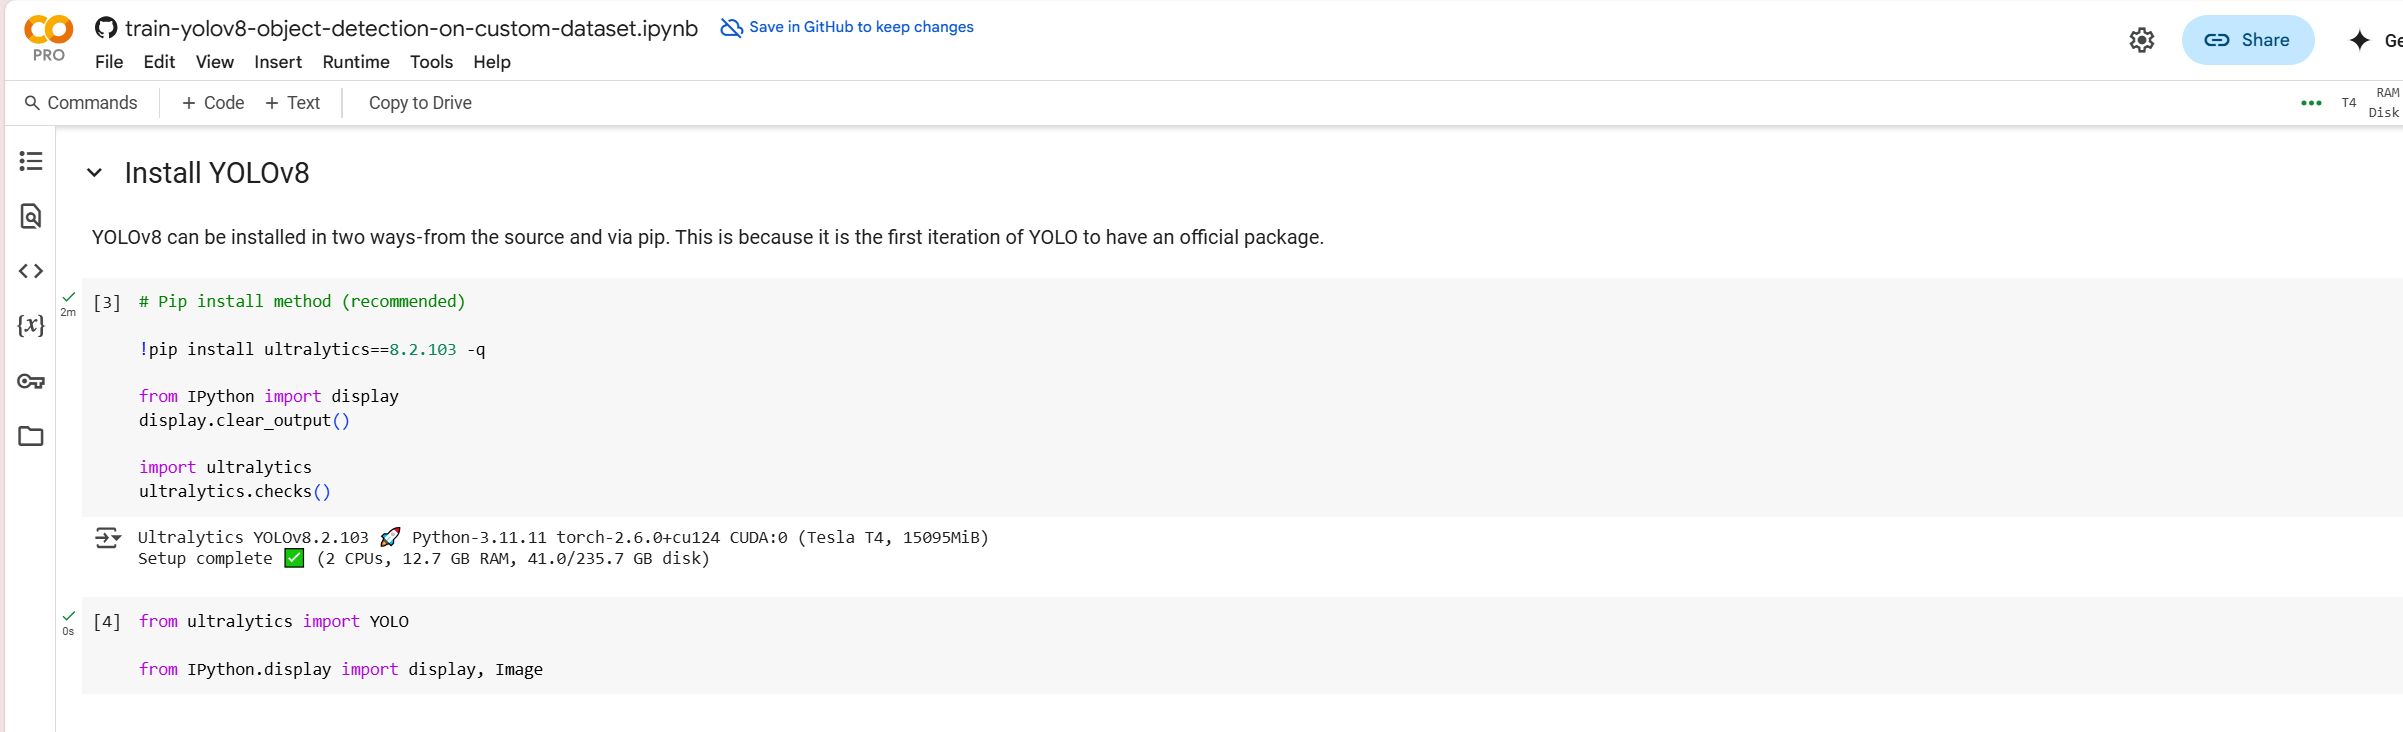
2. Setting Up Python Envorinment + Install Pacakges
When working on a project in Google Colab, you need a workspace where your code runs. This workspace is your Python environment, which is a place where Python understands commands, runs code, and manages files and libraries.
- In Google Colab, this environment is created fresh every time you open a new notebook.
- If you close and reopen the notebook, you may need to reinstall packages and reload your model.
Python has thousands of useful libraries (pre-written code) that help with different tasks like:
- Object detection (YOLO, OpenCV)
- Machine learning (Torch, TensorFlow)
- Data handling (NumPy, Pandas)
- Sending alerts (Requests, Twilio)
But not all of these come pre-installed in Google Colab. So, before using them, you must install them manually, which is why we use the pip install command.
3. Input Snippet Code Of Database
When you upload, process, and train a dataset on Roboflow (like how I am), it gives you a code snippet (a small piece of code) to load the dataset into Google Colab or another Python environment. Instead of manually downloading and organizing images, the snippet automatically fetches your dataset from Roboflow. Roboflow provides this code snippet to make it easier to fetch, manage, and update datasets for training YOLO models. This speeds up the setup process in Google Colab and ensures consistency across training sessions.
Below, you can see the snippet code I was talking about on Roboflow:
Now, Input Snippet Code Onto Collabs:
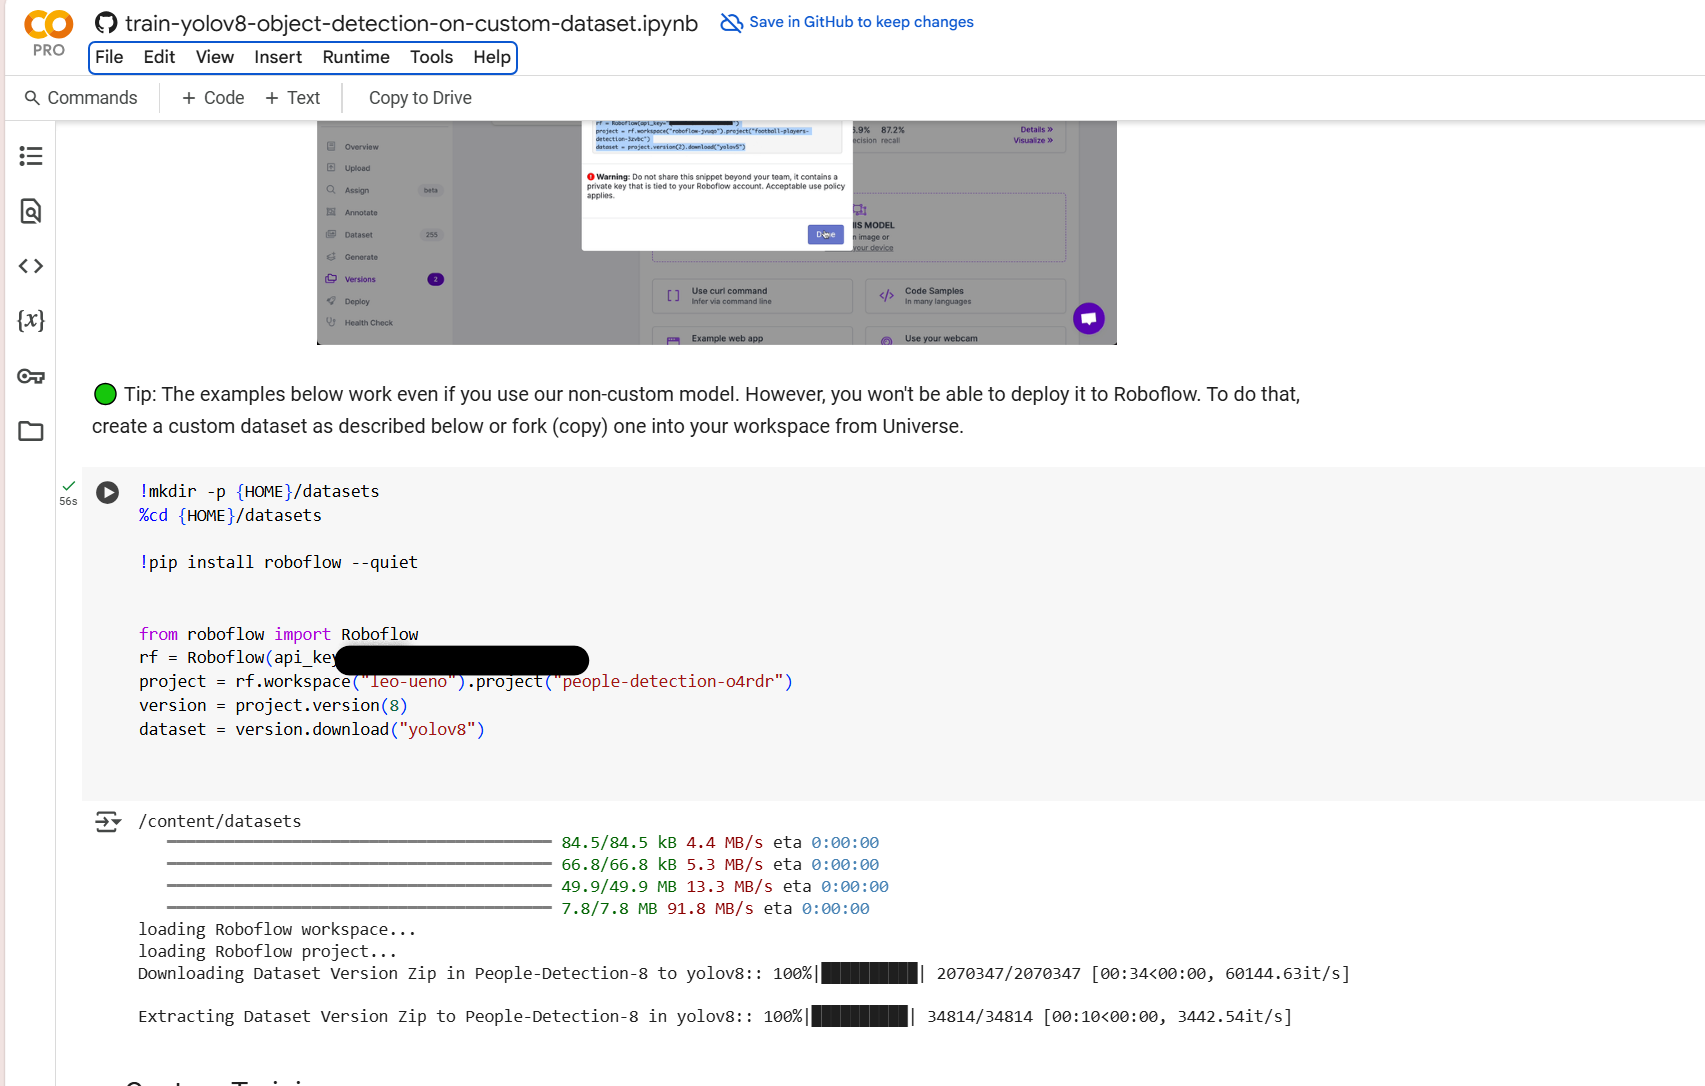
*IMPORTANT NOTE: When you paste this code onto google collabs, your API key is visible, be sure to NOT share this information with anyone.
Your API key is like a password for accessing your Roboflow dataset and project. If someone else gets it, they can:
Steal Your Dataset : They can download, modify, or even delete your dataset.
4. Select Training Parameters.
In order to start training, I need to set some parameters. For those viewing who have no idea what this means: In machine learning, training parameters are key elements that define how a model learns from data. These parameters help control the process of optimization and model training!
In my example, I decided to set my training epochs at 25, and increase gradually after each session:
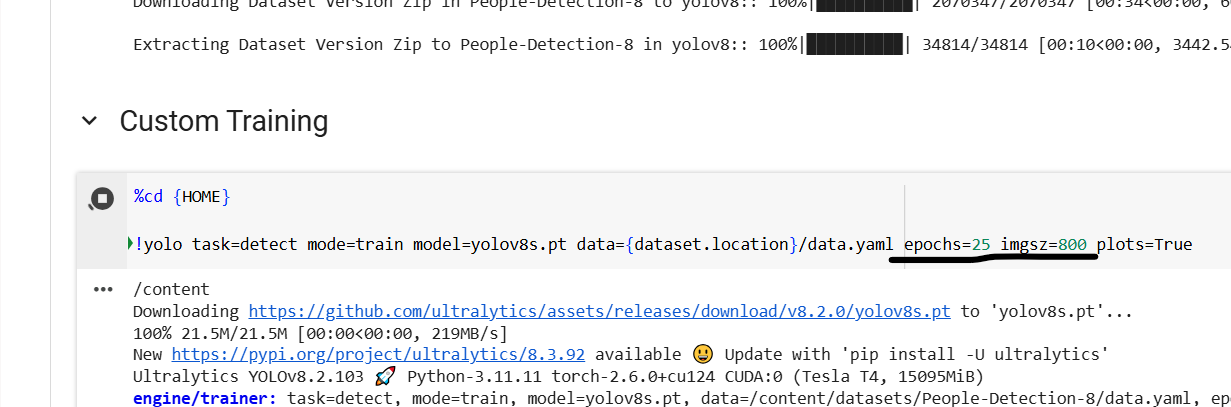
Epochs: An epoch refers to one complete pass through the entire training dataset. During an epoch, the model makes predictions, calculates the error, and adjusts its weights using the optimizer. After one epoch, the model will have seen every training example once.
- Typically, a model goes through multiple epochs during training. Each epoch helps the model learn and improve its accuracy.
- More epochs can lead to better training results, but after a certain point, you might experience overfitting, where the model starts to memorize the training data instead of generalizing to unseen data.
5. Train Model and Export Confusion Matrix and Performance Of Model Charts:
Now, after I let the model train, which for 25 epochs took around 3 hours (very slow for some reason), I was able to see the training results, and was able to calculate this models performance after the FIRST run.
These two blocks of code below, export data into the forms of graphs based on this models performance:
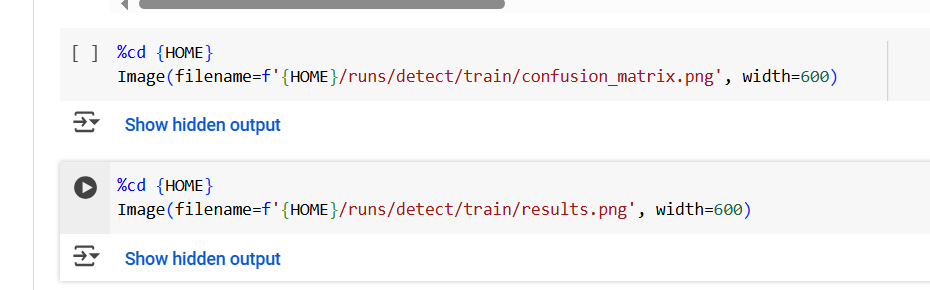
The first block of code in the image would give me my results using a confusion matrix chart, while the second would give me other information about my models training performance.
Before I delved into the charts directly, it was very important to understand what these graphs were, and how they conveyed data to the viewer. This was crucial if I wanted to truly understand how well my model performed.
The graphs and charts for the perfromance model will be looked at in depth in the analysis section of my project. I decided to give a brief overview on how to decipher data from these charts here
SO...
What Are Confusion Matrixs?
A confusion matrix is a table used to evaluate the performance of a classification model. It compares the model’s predictions with the actual labels and provides insight into how well the model is distinguishing between different classes.
It is typically used in binary classification and multi-class classification problems.
Structure Of A Confusion Matrix:

- True Positive (TP) – The model correctly predicted the positive class. Typically the top left corner of the matrix if a binary classification (like my project).
- True Negative (TN) – The model correctly predicted the negative class. Typically the bottom right corner of the matrix if a binary classification (like my project).
- False Positive (FP) (Type I Error) – The model incorrectly predicted positive when it was actually negative. Typically the bottom left corner of the matrix if a binary classification (like my project).
- False Negative (FN) (Type II Error) – The model incorrectly predicted negative when it was actually positive. Typically the top right corner of the matrix if a binary classification (like my project).
How Do You Read Data Conveyed From A Confusion Matrix Chart?
A confusion matrix provides important metrics for evaluating a classification model:
1. Accuracy: Measures overall correctness.
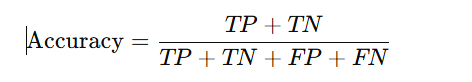
- High accuracy means the model is making mostly correct predictions.
- However, accuracy can be misleading if the dataset is imbalanced (e.g., 90% of samples belong to one class if there are more than one class in dataset)
2. Precision: Measures how many of the predicted positives are actually correct.
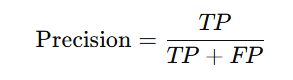
- A high precision means fewer false positives.
- Useful when false positives are costly (e.g., medical diagnoses, fraud detection).
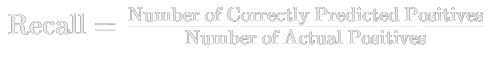
3. Recall (Sensitivity): Measures how many actual positives the model correctly identified.
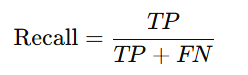
- A high recall means fewer false negatives.
- Useful when false negatives are costly (e.g., cancer detection, security alerts, or in my project for detecting suspicous activty related to poaching).
4. F1 Score: Balances precision and recall.
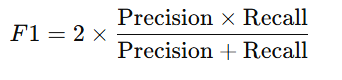
- Useful when both precision and recall are important.
How To Read A Training and Validation Performance Chart:
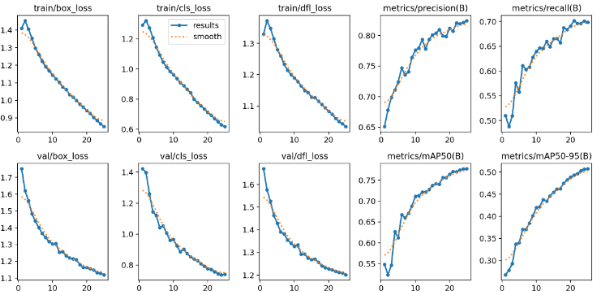
When evaluating an object detection model, several key metrics provide valuable insights into its performance. train/dfl_loss and val/dfl_loss focus on Distribution Focal Loss, helping the model learn to focus on difficult-to-classify objects. Precision and Recall are critical for measuring the accuracy of the model’s predictions, with precision tracking false positives and recall focusing on detecting true objects. Box loss and cls loss evaluate how well the model predicts object locations and classifies them. mAP50 measures average precision at an IoU threshold of 50%, while mAP50-95 gives a more comprehensive evaluation by measuring precision across a range of overlap thresholds.
The most important metric for analyzing object detection performance is often metrics/mAP50-95 (B), as it provides a detailed assessment of the model's accuracy across various levels of overlap between predicted and true bounding boxes. While mAP50 also matters, mAP50-95 gives a broader view of model performance. Precision and Recall help balance false positives and false negatives, and Box loss and cls loss are essential for understanding the spatial accuracy and classification capabilities of the model. In summary, mAP50-95 is generally the best indicator of overall performance.
When analyzing a model’s performance using a graph with metrics like train/dfl_loss, val/box_loss, val/cls_loss, and val/dfl_loss, the goal is to track how the loss values change during training and validation. Loss curves on the graph usually show the model's performance on both the training set (train loss) and the validation set (validation loss). Ideally, both losses should decrease over time, indicating the model is improving. However, if the validation loss increases while the training loss decreases, it may signal overfitting, where the model memorizes the training data but struggles to generalize to unseen data.
For metrics like precision and recall, the graph shows how well the model detects and classifies objects. Precision measures how many of the predicted objects were correct, while recall measures how many of the actual objects in the image were detected. In a well-performing model, both precision and recall should increase as the model trains. Increasing precision means fewer false positives, and increasing recall means fewer false negatives, both of which are signs of better detection performance.
Finally, mAP50 and mAP50-95 are key metrics that evaluate overall object detection performance. The mAP50 measures average precision at a 50% intersection over union (IoU) threshold, while mAP50-95 gives a more thorough evaluation across multiple IoU thresholds. These metrics should steadily increase during training, with mAP50-95 being particularly important for assessing generalization. Overall, a well-performing model will show decreasing losses and increasing precision, recall, and mAP scores, signaling that it is learning to detect and classify objects accurately.
What I Will Complete Before In-Person Fair:
- Building and testing the physical device
- Testing of the device could include testing durability, and ability to withstand weather conditions, and many other aspects needed in order to have a good device.
- Gathering More Data and Graphs, Also Re-Training Model.
- Coding In The Notification Trigger Alarm To Authorities (What I am Currently Doing).
Analysis
Quick Notes:
I ran these model training sessions a couple of times, with different datasets. Unfortunately, I wasn't able to run some of these sessions more times than I wanted to since my runtime would disconnect (on google collabs) and therefore lose tens of hours of progress which was a painstaking process to deal with. I will start out by showing charts and graphs from my very first runs/training models, explain what went wrong and how I dealt with such results. Further down, I will then reveal my charts and graphs after trying ways to improve the efficiency of the model itself, as well as some future improvements to definitely incorporate to furthermore get the model to where i want it to be ideally. I was originally supposed to also have a testing of the physical device, but then once again as mentioned in the beginning, some parts of this project will be found on my trifold. Please do not be confused if you see different graphs online vs. in person, I will most likely still be tweaking parts of this project, and constantly improving it as that's the nature of a true innovation project.
Also, I have not included all training sessions, as some were failures due to software disconnecting and not saving, meaning I had to restart the session from scratch. The attempts below were the 3 main training sessions I would like to share.
Attempt 1 at Training The Model:
Training and Validation Performance Chart:

Confusion Matrix Of Attempt 1 Performance:

Train/Valid Test Images Set and Model Confidence On Unseen Images:

Analyzing the Performance of Attempt 1:
For the train/dfl loss and val/dfl loss:
train/dfl loss and val/dfl loss: Measures the loss related to Distribution Focal Loss, which helps in focusing on difficult-to-classify objects.
Trends for all losses should generally decrease steadily. In my graph, you can see that the graphs for these losses do decrease, however not continually or steadily. This could be because during training, the model might face fluctuations due to the learning rate or optimizer. A high learning rate can cause the model's weights to update too aggressively, leading to some instability in the loss and metric curves (spiking up and down).
Extra Note: Early in training, the model may overfit to the training data, which can cause the metrics to spike because the model is learning very quickly but might not generalize well. This also applies to the precision, recall, mAP50, and mAP50-95 charts. Instead of decreasing in slope however, these classes(precision, recall, mAP50, and mAP50-95), should gradually increase which would indicate good performance of model. In this case, the same fluctuations could be caused by the reasons explained above.
Confusion Matrix Analysis:
This model had a precision of 91.4% and a recall of around 78%.

The data from the confusion matrix never included any of the TN (True Negatives, meaning I could not calculate the accuracy based off of the confusion matrix, but the other pieces of data provided should give us a general idea of how well this performed.
SO, the results are good, but why does the valid/train set of images that the model had never seen before perform so poorly/not with high confidence? The reason why all lies in the dataset I used.
How my dataset was like (Issue To Improve On):
Included only 200 images, all way too specific, and did not have any pre-processing or augmentations applied to improve efficiency. Humans are directional, and if I dont flip/add different directions humans could face, then the model would not be able to identify if the class is human due to the way it faced. The dataset also had a ton of repeated images, as well as most images were set in one particular place, and barely any variations in terms of settings, or lighting. Mainly, the issue was that the dataset was not large, or diverse enough (As a beginner, I did not realize this).
F1 Score is approx. 0.842 (but remember, dataset wasnt diverse, and this is not an accurate score given that if this were to be deployed in the wild, it would be ineffective, as explained above).
F1 Score of 1.0 is a “perfect model”, and F1 Score of 0.0 is worst possible mode
Attempt 2 At training The Model:
Confusion Matrix Chart For Attempt 2:

Training and Validation Performance Chart:

Train/Valid Test Images Set and Model Confidence On Unseen Images:

Originally, I attempted to train my model based off of images of only people/rangers during the daytime but I decided to generate and label a dataset of humans, in mainly night settings. Images I used were once again not as diverse as it should have been (another mistake I repeated AGAIN).
Analyzing the Performance of Attempt 2:
Validation and Performance Charts: Chart trends are followed, kind of gradually increase, and decrease when needed. Refer to previous multimetrics graph analysis to learn more about how this would be anyalzed.
Confusion Matrix (No True Negative):
This model had a precision of 10.1% and a recall of around 4.8%.
F1 Score For This Was Around 0.144 (very low)
F1 Score of 1.0 is a “perfect model”, and F1 Score of 0.0 is worst possible model
Identified Issue:
The model was confusing the background as people since in some of the images, people were blended in with background shadows, and once again the dataset was not as diverse as it was supposed to be. Also around 200-300 images. Also, only augmentation and pre-processing applied was a horizontal flip, and stretch to 640x640 option. Please refer to the method section to learn more about terminology if unsure what is meant.
Analyzing the Performance of Attempt 3 (Much Better):
After running into such bad performance from attempt 2, I decided to gather a much larger dataset, apply much more preprocessing and augmentations to the dataset.
The Options Selected:

Analyzing the Performance of Attempt 3:
NOW, Lets take a look at the Confusion Matrix After The Training (No TN).
Training and Validation Performance Chart:
Confusion Matrix from Attempt 3

Validation and Performance Charts:
Chart trends are followed, gradually increase smoothly, and decreases in losses sections. Refer to previous graph analysis, and method to learn more about how this would be anyalzed.
Analyzing The Confusion Matrix:
This model had a precision of 75.5% and a recall of around 77.1%.
F1 Score is approx. 0.763 in attempt 3.
F1 Score of 1.0 is a “perfect model”, and F1 Score of 0.0 is worst possible model.
Overall, this model's recall and precision dramatically increased when compared to attempt 2. This is probably because the dataset I used was very large, and had pre-processing and augmentation applied. This dataset was so much more diverse and mixed, compared to the other datasets and attempts that were used.
Comparing Attempt 2 and 3:
Attempt 3, with a precision of 75.5% and recall of 77.1%, is significantly better than Attempt 2, which has precision of 10.1% and recall of 4.8%. Attempt 3 is quite accurate when predicting "human," with a good balance between precision and recall. It correctly predicts 75.5% of the time when it says "human," and it successfully identifies 77.1% of actual humans. In contrast, Attempt 2 struggles greatly, in correctly identifying humans only 10.1% of the time and missing 95.2% of the humans it should detect.
Overall, Attempt 3 performs much better in both detecting humans and making accurate predictions. Attempt 2 is underperforming severely, with low precision and recall, making it ineffective for its intended task.
Comparing Attempt 3 and 1:
So, according to the confusion matrix, attempt 1 performed “better”, however it only did due to the very specialized, and undiversified range of dataset images used. This is proved when we look at the train/valid set of images, images the model has never seen, and its low confidence rates.
Now, I'm not saying attempt 3 is the best performing model, I will still need to try and bring the precision and recall value higher. For now though, as a beginner, and with the limited help/guidance and resources I have had for this project, I would say this is a solid model for predicting humans.
*Testing Of The Physical Device Will be Included On Trifold, aswell as I may countinue training my model to improve its precision and recall.
Conclusion
Future Improvements:
- If selected for CWSF 2025, I will try my best to find the guidance needed in training a more efficient model, and in overall just testing different aspects of my project.
- Interview real park rangers about their experience and difficulties with dealing with poachers.
- Ask them to give me some feedback on my design of the anti-poacher system device or for ideas that would greatly improve functionality when actually deployed.
- The Device may not be cost effective at first, but my main goal is to first work on bringing up the efficiency and performance as high as possible, and then see if I am able to cut down on prices.
Conclusion:
In conclusion, in my project I worked on creating a new, innovative poaching detection system using AI-powered surveillance that was specially designed to address the major issues all current poaching detection devices have. I trained a YOLO-based model to detect “poachers” in wildlife areas, refining it through multiple attempts, while also adding a trigger notification alarm to alert authorities about suspicious activity related to poaching, while taking the proper action needed to address the issue. I used open-source tools and datasets, as well as trained the model on Google Collab. I enhanced the dataset with more variations, evaluated and fine-tuned the model. Additionally, I plan to collaborate with experts in wildlife conservation and AI to improve my system's/physical device effectiveness (when built).
Citations
Here is the citation list of all resources I used, formatted in APA style:
-
AP News. (2025, March 20). Many Senegalese seek to tap the power of animals by wearing them. Lions pay a heavy price. Retrieved from https://www.apnews.com
-
Canada.ca. (2019, July 22). Canada participates in largest-ever international enforcement operation to crack down on wildlife crime. Retrieved from https://www.canada.ca/en/environment-climate-change/news/2019/07/canada-participates-in-largest-ever-international-enforcement-operation-to-crack-down-on-wildlife-crime.html
-
Canadian Geographic. (2025, March 20). The illegal wildlife trade is a biodiversity apocalypse. Retrieved from https://canadiangeographic.ca/articles/the-illegal-wildlife-trade-is-a-biodiversity-apocalypse
-
Conservation. (2024, March 20). Poaching numbers. Save the Rhino International. Retrieved from https://www.savetherhino.org
-
Datature. (2025, March 20). How to interpret training graphs to understand and improve model performance. Retrieved from https://www.datature.io/blog/how-to-interpret-training-graphs-to-understand-and-improve-model-performance
-
Evidently AI. (2025, March 20). Confusion matrix: A classification metric for evaluating model performance. Retrieved from https://www.evidentlyai.com/classification-metrics/confusion-matrix
-
Frontiers. (2020). Warm beach, warmer turtles: Using drone-mounted thermal infrared sensors to monitor sea turtle nesting activity. Retrieved from https://www.frontiersin.org/articles/10.3389/fevo.2020.563998/full
-
Gavi. (2025, March 20). What are zoonotic diseases and how dangerous are they? Retrieved from https://www.gavi.org/vaccineswork/what-are-zoonotic-diseases-and-how-dangerous-are-they
-
Guardian. (2025, February 15). WWF helping facilitate trade in polar bear fur, investigation reveals. Retrieved from https://www.theguardian.com/environment/2025/feb/15/wwf-helping-facilitate-trade-in-polar-bear-fur-investigation-reveals
-
Getaway. (2025, March 20). Thanda Safari recruits AI technology to combat rhino poaching. Retrieved from https://www.getaway.co.za/travel-news/thanda-safari-recruits-ai-technology-to-combat-rhino-poaching/
-
Medium. (2025, March 20). Interpreting training & validation accuracy and loss. Retrieved from https://medium.com/@frederik.vl/interpreting-training-validation-accuracy-and-loss-cf16f0d5329f
-
NASA Spinoff. (2025, March 20). Satellites 'See' Sea Turtles, Ocean Threats. Retrieved from https://www.nasa.gov/aeroresearch/weather-impacts-on-uavs/
-
Poaching by Country. (2025). Poaching statistics & facts in 2024. Retrieved from https://www.worldwildlife.org/stories/how-drones-are-helping-save-rhinos
-
Poaching Detection Technologies—A Survey. (2020). PubMed Central (PMC). Retrieved from https://pmc.ncbi.nlm.nih.gov/articles/PMC8232034/
-
Rhino conservation: AI collars & drones to the rescue. (2025, March 20). Anti-poaching; rhino conservation; AI; technology; ankle collar; drone; drones; South Africa. Retrieved from https://www.droneii.com/
-
Roboflow. (2025, March 20). Training Custom Dataset Yolo v8 Segmentation | Roboflow | Google Colaboratory. Retrieved from https://www.roboflow.com
-
Roboflow Universe. (2025, March 20). People Detection Dataset by Leo Ueno. Retrieved from https://universe.roboflow.com/leo-ueno/people-detection-o4rdr/dataset/8
-
Save the Rhino International. (2025, March 20). Poaching numbers. Retrieved from https://www.savetherhino.org
-
The Things Network. (2025, March 20). What are LoRa and LoRaWAN? Retrieved from https://www.thethingsnetwork.org
-
University of Oxford. (2025, March 20). Tracking endangered sea turtles with hardware the size of a pound coin. Retrieved from https://www.ox.ac.uk
-
Validation Learning Curve. (2025, March 20). Overfitting and underfitting: Understanding model performance. CodingNomads. Retrieved from https://codingnomads.com/validation-learning-curve-overfitting-and-underfitting
-
World Animal Protection Canada. (2025, March 20). Trading animals and diseases: Canada's role in the global commercial wildlife trade. Retrieved from https://www.worldanimalprotection.ca/our-work/wildlife/trading-animals-and-diseases-canadas-role-in-the-global-commercial-wildlife-trade
-
WWF. (2016). WWF introduces innovative technologies to combat poaching in Kenya. Retrieved from https://www.worldwildlife.org/magazine/issues/fall-2016/articles/wwf-introduces-innovative-technologies-to-combat-poaching-in-kenya
-
YOLOv8: How to Train for Object Detection on a Custom Dataset. (2025, March 20). YouTube. Retrieved from https://www.youtube.com
-
YOLOv8: How to train YOLOv8 Object Detection on Custom Dataset | step by step Tutorial | Google Colab. (2025, March 20). YouTube. Retrieved from https://www.youtube.com
-
YOLOv8 object tracking 100% native | Object detection with Python | Computer vision tutorial. (2025, March 20). YouTube. Retrieved from https://www.youtube.com
-
YOLOv8 Object Detection on Custom Dataset. (2025, March 20). YouTube. Retrieved from https://www.youtube.com
-
YOLOv5 Model Object Detection Basic Tutorial on Google Colab - Vehicles and People. (2025, March 20). YouTube. Retrieved from https://www.youtube.com
-
YouTube. (2025, March 20). How to evaluate an object detection model using precision-recall curves. Retrieved from https://www.youtube.com/watch?v=p3CcfIjycBA
-
7 High-Tech Tools to Combat Poaching. (2025, March 20). Forestry.com. Retrieved from https://www.forestry.com
-
5 of the Most Commonly Poached Animals. (2025, March 20). Save the Rhino International. Retrieved from https://www.savetherhino.org
-
The Top Five Animals That Poachers Are Hunting Into Extinction. (2025, March 20). Save the Rhino International. Retrieved from https://www.savetherhino.org
-
Rainforest Connection - Phones Turned to Forest Guardians by Topher White — Kickstarter. (2025, March 20). Kickstarter. Retrieved from https://www.kickstarter.com
-
Satellites 'See' Sea Turtles, Ocean Threats. (2025, March 20). NASA Spinoff. Retrieved from https://www.nasa.gov/aeroresearch/weather-impacts-on-uavs/
-
How To Stop Poaching: 9 Ways To Protect Wildlife From Trafficking. (2025, March 20). Forestry.com. Retrieved from https://www.forestry.com
Acknowledgement
I would like to thank:
- Ms. Emilie Ontko (My Science Fair Coordinator) Balmoral School, for giving me a chance to participate in this wonderful event!
- Google Collab Software
- Roboflow (For The Open Source Images)
- My Family.
- The Various Youtube Tutorials That Helped Me Bring This Project To Life