
CropCast: Farming the Future with Machine Learning
Abrielle Li
St. Vincent De Paul Elementary Junior High School
Grade 8
Presentation
No video provided
Hypothesis
By using machine learning models to analyze past key performance indicator (KPI) farming data, we can accurately predict how much a farm is likely to yield.
Research
Machine Learning in Agriculture
The agricultural landscape is undergoing a profound transformation as machine learning (ML) technologies reshape traditional farming practices. This technological revolution comes at a critical time—according to the Food and Agriculture Organization (FAO), with the global population projected to reach 9.7 billion by 2050, agricultural production must increase by approximately 70% to meet growing demand.
At the same time, farmers face growing challenges, such as:
- Resource constraints: With arable land per person decreasing and water scarcity increasing, farming has to become more efficient.
- Climate change: Unpredictable weather patterns and extreme events make farming more uncertain.
- Labor shortages: Many farming regions face declining rural populations and labor shortages.
- Sustainability demands: Consumers and regulators increasingly expect environmentally sustainable and responsible farming practices.
To address these pressures, agriculture must become more precise, efficient, and predictive.
Machine learning offers potential solutions to these challenges. By analyzing historical farming data, ML models can help farmers optimize water, fertilizer, and pesticide use while maintaining and/or improving yields.
This way, instead of reacting to problems, farmers can make proactive, data-driven decisions.
Additionally, a 2022 study published in Nature Sustainability found that farms using ML-guided precision agriculture techniques reduced their environmental footprint by an average of 35% while increasing yields by 10-15% compared to conventional farms of similar size and crop type.
This shows how machine learning is becoming an essential tool in the agriculture industry.
Most Common Machine Learning Algorithms
⭐ = Included in this project
- Linear Regression ⭐
- Logistic Regression
- Decision Tree
- SVM (Support Vector Machine) ⭐
- Naive Bayes
- kNN (k- Nearest Neighbors)
- K-Means
- Random Forest
- Dimensionality Reduction Algorithms
- Gradient Boosting Algorithms
Note: A Neural Network (NN) model was also used in this project. Neural networks are sometimes not included among the most commonly listed algorithms for crop yield prediction because they typically require larger datasets and greater computational resources.
KPIs for Crop Yield Prediction
Features Used in Machine Learning Models for Crop Yield Prediction
(Summarized from ScienceDirect research)
Note: These features are listed for reference to demonstrate the wide range of variables that can influence crop yield prediction. The dataset used in this project included only a subset of these features.
Climate & Weather Variables:
- Temperature
- Rainfall / Precipitation
- Forecasted rainfall
- Humidity
- Wind speed
- Solar radiation / Shortwave radiation
- Photoperiod
- Degree-days
- Atmospheric pressure
- General climate conditions
Soil Properties:
- Soil type
- Soil maps
- pH value
- Organic carbon
- Cation exchange capacity
- Nitrogen
- Phosphorus
- Potassium
- Calcium
- Magnesium
- Zinc
- Boron
- Sulphur
- Manganese
Crop and Field Information:
- Crop type / crop information
- Area of production
- Fertilization levels
- Irrigation practices
- Time (season/year)
Remote Sensing and Vegetation Indices:
- NDVI (Normalized Difference Vegetation Index)
- EVI (Enhanced Vegetation Index)
- MODIS-EVI
- Leaf Area Index
- Satellite images
- Gamma radiometrics
Variables
Controlled Variables: Historical Data, Data Cleaning Process, Train-Test Split Ratio, Evaluation Metrics
Manipulated Variable: Type of Machine Learning Model
Responding Variables: Prediction Accuracy, The Amount of Time Needed to Run, The Amount of Computing Power Needed
Procedure
- Research ML models - I researched different machine learning algorithms commonly used for prediction problems\, including Neural Networks\, Linear Regression\, and Support Vector Machines.
- Define the target variable and features - Target Variable = Crop Yield/Hectare
- Collect historical farming data - I gathered a dataset containing past crop yield and KPI information across multiple agricultural regions.
- Explore, clean, and organize data - I cleaned the data by handling outliers and null values\, standardizing features when necessary\, converting categorical variables into numerical “dummy variables” so they could be used in machine learning models\, and converting total yield into yield per hectare to ensure fair comparisons.
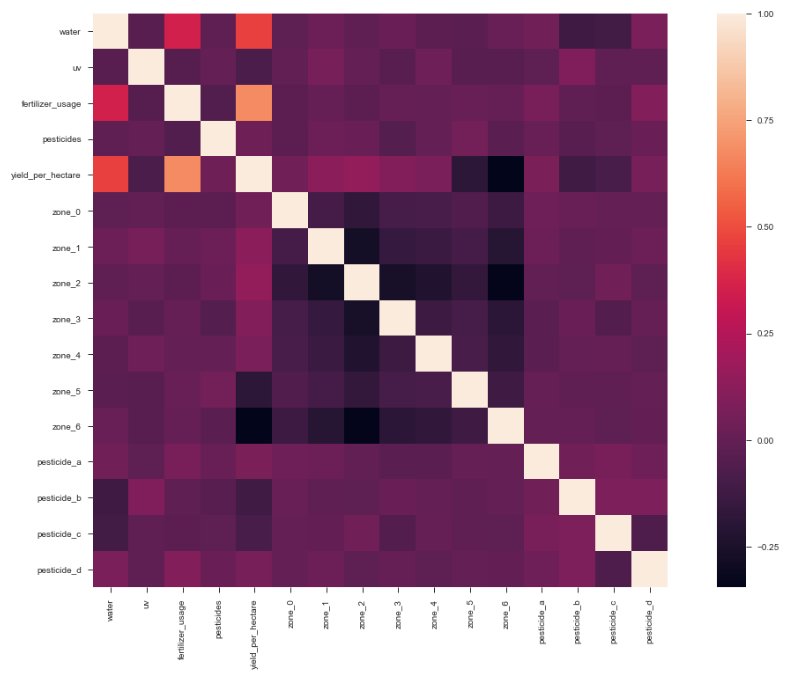
- Find meaningful patterns and correlations by visualizing the data - Using code\, I created graphs\, correlation matrices\, and heat maps to identify meaningful patterns between variables (ex. Which features had strong positive or negative correlations with yield\, whether relationships were linear or nonlinear\, whether certain regions consistently performed better\, etc.).
- Train models, test models, and evaluate model accuracy
- Compare model performance
- Interpret the results - I analyzed which features had the greatest impact on yield\, which model was the most accurate\, and examined how the model could be applied to real-world farming decisions.
Observations
From the correlation patterns and feature characteristics of the crop yield data (visualized using a heat map), we can observe the following:
1. Water and fertilizer have strong positive linear relationships with yield.
- Higher water and fertilizer levels generally increase crop yield, and there is no sign of the correlation turning negative (yet).
2. Zones 1 and 2 show consistently stable yields\, making them strong locations for farming. 3. Zones 5 and 6 show strong negative correlations with yield.
- These areas are warm and may be better suited for high-value, heat-tolerant crops rather than high-yield staple crops.
4. Farming suitability by zone appears to be:
- Best → Zone 2, Zone 1
- Moderate → Zone 3, Zone 4
- Weaker → Zone 0, Zone 4, Zone 3 (likely because of climate and terrain)
5. Zone-specific limitations:
- Zone 0 is too cold.
- Zone 3 is near mountainous terrain, making equipment operation difficult.
6. UV shows little correlation with yield.
- Likely because sunlight hours are already far above minimum plant requirements.
7. Because light is abundant\, crops can be planted more densely if water and fertilizer are sufficient and if equipment access is maintained. 8. Water strongly influences fertilizer effectiveness\, since plants require water to move minerals and nutrients (irrigation).
- Investing in better irrigation could significantly boost yield.
- Slight water restriction during early rooting may improve later wind resistance and crop quality.
- More water is needed during flowering and seeding stages.
9. Zones 0\, 2\, 5\, and 4 receive too much water (rain or groundwater)\, while Zones 1\, 3\, and 6 may need more water (irrigation). 10. Zones 0 and 2 appear to have high-quality soil\, so fertilizer costs can be reduced there. 11. Zones 5 and 6 likely require more fertilizer\, possibly due to sandy soil with low organic matter. 12. All pesticides show a slight positive relationship with yield.
- Zones 0, 3, and 6 need less pesticide due to colder climates, higher elevations, or coastal wind/humidity reducing pests.
13. Pesticides B and C appear overused\, with B showing the strongest correlation to yield. 14. Pesticide D shows the weakest correlation among the four\, while Pesticide A may need increased use. 15. Overuse of chemicals leads to diminishing effectiveness (drug resistance) and long-term soil damage. 16. The optimal pesticide usage level appears to be around 4 units.
- Zones 1 and 4 maintain pesticide levels near this amount.
17. To reduce drug resistance\, rotate pesticide types and consider crop rotation to break pest cycles. 18. Pesticide correlation patterns resemble a power-function shape.
- The relationship might follow something like y = (a·x + b)²
- which suggests that deeper nonlinear analysis may be needed
19. If nonlinear features can be transformed into more linear forms\, linear regression and similar models will perform better. 20. Some features have weaker correlations and may be removed or ranked to improve model efficiency and reduce simulation time.
Heatmap:
Analysis
Here are the comparisons between the 3 different models tested in this experiment:
Neural Network Model:
- Mean Square Error: 0.0059
- Mean Square Error Standard Deviation: 0.0004
- R Squared Value: 0.8605
- Accuracy: 0.9229
NN Model’s Predictions VS. Actual Values:

Linear Regression Model:
- Mean Square Error: 0.006282
- Mean Square Error Standard Deviation: 0.000282
- R Squared Value: 0.861385
- Accuracy: 0.921
Linear Regression Model’s Predictions VS. Actual Values:

Support Vector Regression (SVR) Model:
- Mean Square Error: 0.007156
- Mean Square Error Standard Deviation: 0.000462
- R Squared Value: 0.841562
- Accuracy: 0.9154
SVR Model’s Predictions VS. Actual Values:

Comparing Model Accuracy:

Conclusion
- Crop yields can be accurately predicted using historical farming data.
- By analyzing key performance indicators (KPIs) such as water usage, fertilizer levels, pesticide use, and farming region, machine learning models were able to predict crop yield with over 90% accuracy.
- The NN (Neural Network) Model had the highest accuracy of 92.29%.
- Results showed that water and fertilizer have the strongest impact on crop yield (for this dataset).
- Pesticides affect yield only up to a certain point.
Therefore, my hypothesis was correct; by using machine learning models to analyze past KPI farming data, we can accurately predict how much a farm is likely to yield.
Application
Applications of this project include:
- Farm planning: Farmers can estimate how much food they will produce before planting or harvesting, giving them a clearer plan for the season.
- Better use of resources: By adjusting water, fertilizer, and pesticide levels, farmers can avoid wasting money while still getting high yields.
- Choosing the best location: The model can help identify which regions produce the most reliable crop yields.
- Risk reduction: Predicting low yields early allows farmers to prepare for droughts, pests, or poor growing conditions.
- Environmental benefits: Using only the necessary amount of fertilizer and pesticides reduces pollution and protects soil and water.
- Business and profit decisions: Farmers can combine yield predictions with crop prices to decide what crops to grow and how much to invest.
- Higher yield: Producing more food means that there will be more for people to eat.
By improving planning, resource efficiency, and risk management, crop prediction supports long-term sustainable farming practices that protect the environment while maintaining reliable food production for the future.
Sources Of Error
Sources of error for this project include:
-
Incomplete or Inaccurate Data: If the historical farming data contains missing values, measurement errors, or incorrect records, the model may learn inaccurate patterns.
-
Data Bias: If most of the data comes from one region, one crop type, or one climate condition, the model may not generalize well to other environments.
-
Weather Variability: Unpredictable extreme weather events (ex. droughts, floods, heat waves, etc.) may differ from historical trends, reducing the model's prediction accuracy.
-
Overfitting: The model might perform very well on training data but poorly on new, unseen data if it memorizes patterns instead of learning general trends.
-
Limited Variables: Some important factors may not be included in the dataset, which can reduce prediction accuracy. These can include:
- Sudden pest outbreaks
- Soil nutrient changes
- Farming technique differences
- Equipment efficiency
-
Measurement Differences: Different farms may record data in different ways (units, timing, or methods), leading to inconsistencies in the dataset.
-
Model Assumptions: ML models assume that future conditions will follow patterns similar to the past. If farming practices or climate conditions change significantly in the future, predictions may become less reliable.
-
Human Error: Errors during data cleaning, coding, or model selection could influence the results.
Citations
Reference Links:
https://www.richters.com/hardiness-zones https://www.numberanalytics.com/blog/machine-learning-in-farming-revolutionizing-crop-yields https://www.analyticsvidhya.com/blog/2017/09/common-machine-learning-algorithms/ https://www.sciencedirect.com/science/article/pii/S0168169920302301 https://pubmed.ncbi.nlm.nih.gov/39720079/ https://www.ksolves.com/blog/machine-learning/sustainability-in-agriculture
Header Image: https://www.analyticsvidhya.com/blog/2023/06/crop-yield-prediction-using-machine-learning-and-flask-deployment/ Project Image: https://www.linkedin.com/pulse/revolutionizing-crop-yield-prediction-power-model-adeel-ahmad
Acknowledgement
Thank you to the following people for their support:
- Mrs. Ruzycki, my science fair coordinator, for her guidance, encouragement, and feedback throughout this project.
- My parents, who helped me debug code, review my work, and supported me through every stage of the process.
- CYSF! The website had many helpful tips.
Thank you all for your support, encouragement, and belief in my work. This project would not have been possible without you.