How does sugar affect diabetes?
Puneet Dhillon
Grade 7
Presentation
Hypothesis
If we test for the amount of glucose in a medium-sized raw mango, 1 bar of milk chocolate (100 grams), and 1 can of Coke using a glucose monitoring watch than, milk chocolate would raise the blood glucose levels the most. Milk chocolate has a whopping 52 grams of sugar (glucose and sucrose) whereas an average-sized raw mango has 8.98 grams and a 12 oz can of Coke has 39 grams of sugar. This is only an estimate as many factors apply such as carbohydrates and fats.
These pictures were taken from https://www.freepik.com/, and https://www.shutterstock.com
Research
What is Diabetes
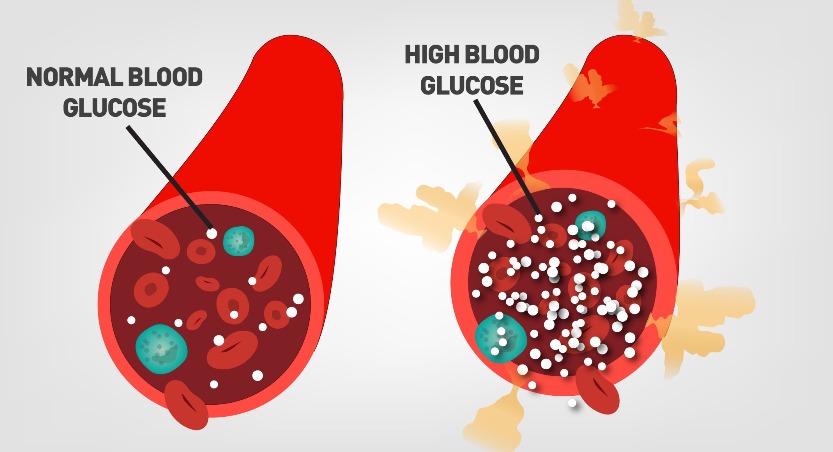
Glucose is engendered through the metabolism of the body, acting as the fuel of the body. A variety of foods that we consume contain glucose. Whether we consume sucrose (table sugar) or foods containing carbohydrates such as starches our body breaks these resources down to glucose. When the body breaks these foods down, insulin is produced by the pancreas. The pancreas plays a crucial role in the body by regulating the breakdown of carbohydrates, fats, and proteins. Additionally, it releases enzymes into the small intestines to aid in the absorption of nutrients from victims. The pancreas releases insulin as it corresponds with the body. The insulin lets glucose reach the bloodstream. It then lets the cells in the body to utilize the glucose. They may utilize the glucose as energy or store the glucose for other times. The body releases glucose when we consume it. For example, the amount of glucose in the body is higher at lunch than in the middle of the night. The amount of glucose is referred to as the blood glucose level. When the glucose is utilized in cells the blood glucose level drops meaning the pancreas stops injecting insulin into the body. With diabetes, the basic definition for it is the pancreas doesn't respond with the body. The pancreas either doesn't inject insulin at all or injects insulin at the wrong times. Due to this the blood glucose level may ascend or decline to hazardous levels. Symptoms of diabetes may range from mild to severe. Some symptoms of diabetes include weakness, urinating more frequently, feeling very thirsty and hungry, feeling very energetic and then followed by tiredness (mood swings), and losing large amounts of weight in a short time.
The following image was taken from Fugentimes News available at https://fugentimes.news/?p=11621
Types of Diabetes
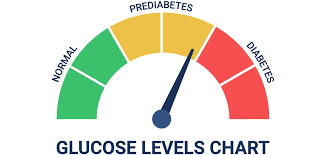
Prediabetes - Diabetes doesn’t just appear in a few days. Diabetes gives an abundance of signals before they genuinely appear in a few days. These signals could take up to 10 years. During this period a person has prediabetes. Prediabetes is when you have a higher blood glucose level than a normal person but not as dangerously high to be relegated as diabetes. A person with prediabetes has a more preponderant chance of developing a heart disease than an average person.
Type 1 diabetes - In type 1 diabetes the pancreas either makes very little insulin or engenders no insulin at all. Insulin is very important as it allows glucose to be stored or utilized for energy by the cells. Unfortunately, there is no cure for type 1 diabetes. 1.25 million people have to deal with type 1 diabetes in the United States alone. Treatment of type 1 diabetes is a lifelong insulin pump and a continuous glucose monitor.
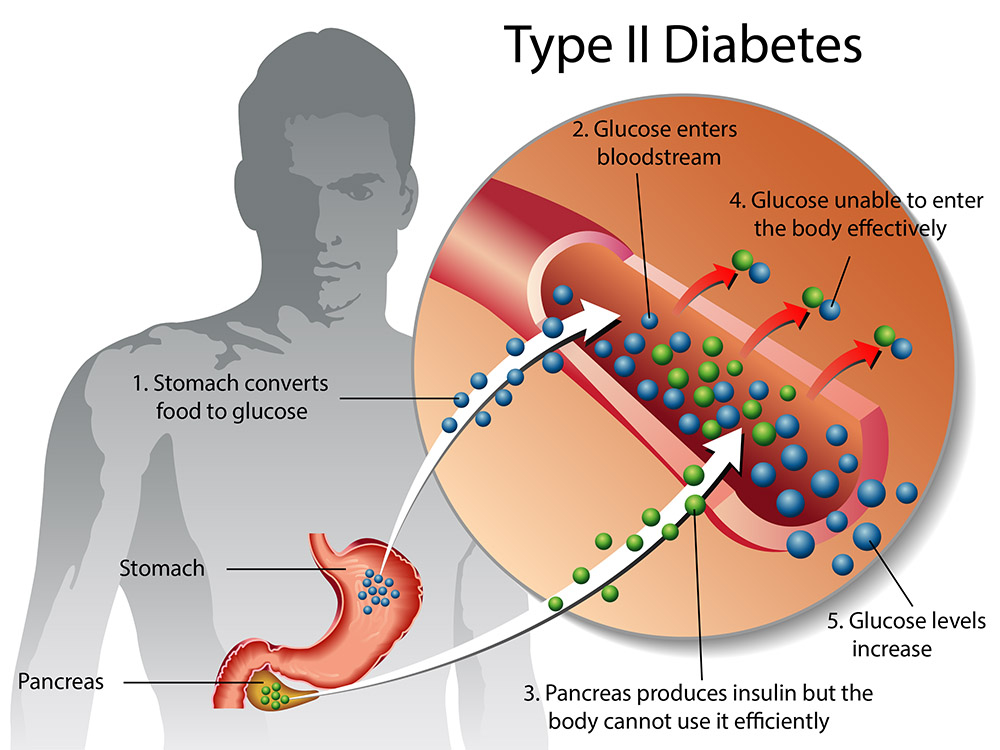
Type 2 diabetes - During type 2 diabetes the pancreas doesn’t properly correspond with the body. This is when the body doesn’t make enough insulin or injects it at the wrong time. In the United States, 38 million people have type 2 diabetes! However, there is no treatment for type 2 diabetes. Diseases such as heart disease, strokes, foot problems, and eye and kidney disease have an increased chance of happening.
The images were taken from the following sites https://hjnutritionist.co.uk/prediabetes/,
https://www.yashodahospitals.com/diseases-treatments/diabetes-symptoms-treatment/, and https://www.healthdirect.gov.au/type-2-diabetes
The model
In this experiment, we will be making a simulation of the human body. In an adult human body, there are 1.2 - 1.5 gallons of blood, making an average of 1.3 gallons. Liters will be used here as it is a whole number. 1.3 gallons = 5 liters. The normal blood glucose levels are approximately 90 mg/dl the same as 5mm (mmol/l.) In 5 liters of blood, there are about 3.3 - 7 grams of glucose (C₆H₁₂O₆) in an adult human body which is an average of 5.1 grams. This experiment will be done at a much smaller scale at 200 ml. Which means everything will be divided by 25. Scale 1:25. This means the amount of glucose in the experiment will be 0.204 grams. In this experiment, we will be making a simulation of the human body. In an adult human body, there are 1.2 - 1.5 gallons of blood, making an average of 1.3 gallons. Liters will be used here as it is a whole number. 1.3 gallons = 5 liters. The normal blood glucose levels are approximately 90 mg/dl the same as 5mm (mmol/l.) In 5 liters of blood, there are about 3.3 - 7 grams of glucose (C₆H₁₂O₆) in an adult human body which is an average of 5.1 grams. This experiment will be done at a much smaller scale at 200 ml. Which means everything will be divided by 25. Scale 1:25. This means the amount of glucose in the experiment will be 0.204 grams.
Variables
Variables Part A
Manipulated variable: My manipulated variable is the type of food tested on a person. (Average-sized mango, 100 grams of milk chocolate, and 222 ml of coke)
Controlled variable: My controlled variable is the watch being used, the time the food is eaten, how constantly the watch measures, and how long the experiment lasts.
Responding variable: Which food will increase the blood glucose levels the most?
Uncontrolled variable: My Uncontrolled variables are the size and mass of the mangoes and the accuracy of the watch.
Variables Part B
Manipulated variable: My second manipulated variable is how the simulator shows the different types of diabetes after digesting food.
Controlled variable: My controlled variable is the way the simulator that is being used is built, the amount of milk, the size of the container, and the conductance sensor.
Responding variable: The blood glucose levels were measured through the voltmeter for different foods.
Uncontrolled variable: My uncontrolled variable for Part B is that the conductance sensor sometimes moved around, and there could have been an error in the making of the circuit or while recording the measurements.
Procedure
Procedure (Glucose Monitoring) Part A
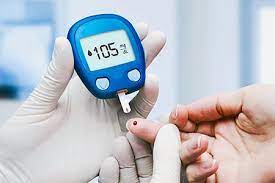
1. For participant number 1 a glucose monitoring watch is worn tight but comfortable.
2. Then at 4:45 AM they are given a mango, and the watch starts recording every ten minutes.
3. The participant is then allowed to go to sleep.
4. The watch is kept on until 12:25 PM.
5. The data is recorded after every 10 minutes.
6. The next two days participant 1 eats milk chocolate and coke using the same procedure.
7. The other 3 participants eat the same 3 foods the following days.
Procedure (Diabetes Simulator) Part B
1. To start, the 5-volt on the Arduino is connected to the positive ground bus on the breadboard using male-to-male jumper wires.
2. Using two jumper wires connect the (+) and (-) ground busses together.
3. Using male-to-male jumper wires the GND on the Arduino is connected to the negative bus on the breadboard.
4. Fourth connect the N-channel MOSFET with it facing upwards to the left. The first pin is in F5, the second in F6, and the last in F7.
5. Add a 100kΩ resistor from H16 to H20.
6. Connect the ∼11 on the Arduino board to G7 on the breadboard.
7. Connect A0 on arduino to F20 of the breadboard.
8. Connect a wire from J5 to the left negative bus on the breadboard using the wires.
9. Connect a wire from J16 to the left positive bus on the breadboard.
10. On the breadboard we connect another wire from J25 to the negative bus.
11. The pump’s positive terminal will be connected to the left positive ground bus on the breadboard.
12. The negative will be connected to J6 on the breadboard.
13. Next make a conductance sensor. Cut 2 perfect pieces of aluminum foil measuring 30 cm and 1.5 cm.
14. Than wrap them around a rectangular prism measuring 10 x 2 x 2 cm and weighing about 30 grams.
15. Connect both ends of the foil to alligator clips.
16. Attach a jumper wire from the positive end to J20.
17. For the negative side connect it to I25
18. Next we prepare a one-molar NaCl solution (salt) by dissolving 11.7 grams of salt into about 200 ml of lukewarm water.
19. Next we connect the Arduino to a computer using a cable.
20. Next we open up the Arduino platform.
21. Then we download the calibration code and upload it to our Arduino. (which I got from science buddies)
22. Then into 2 containers I added 200 ml of milk.
23. Next we put our sensor in one container and open the serial monitor.
24. Next we add a little bit of salt to the same container until it reaches 0.9 volts. On the serial monitor, it will read a number between 0 - 1023. You will have to convert it by dividing the number by 1023 and then multiplying it by 5.
25. Once it reaches 0.9 volts we add our pump one side into the milk with salt and the other one into the regular milk.
26. Then we add 122 ml of the salt solution to represent a person with type 1 diabetes who ate a mango.
27. After 10 minutes the number was recorded.
28. Then for milk chocolate 132.1 ml of the salt solution was added and for coke 136.2 ml of the salt solution was added.
29. Then to represent type 2 diabetes a different code was updated which made the pump work and then stop and wasn’t very continuous.
30. The measurements were recorded.
This is a photo of the circuit needed.
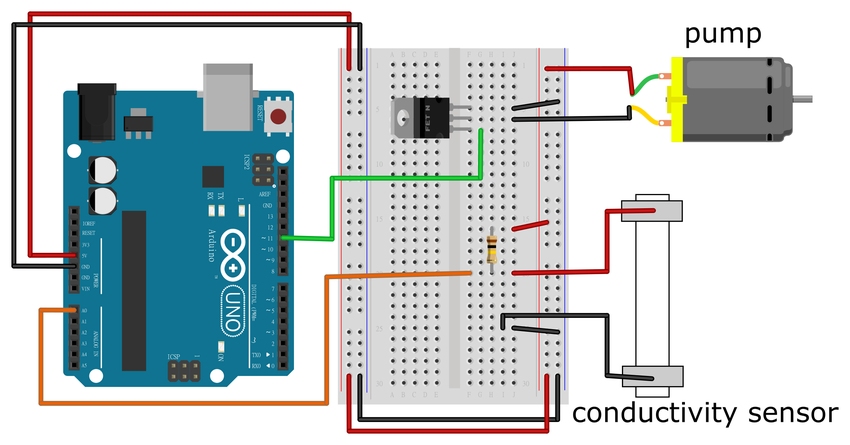
This image was taken from Science Buddies available at https://www.sciencebuddies.org/Files/7660/18/artificial-pancreas-breadboard-diagram.png
Observations
|
Time |
Person 1 |
Person 2 |
Person 3 |
|
Time |
Person 1 |
Person 2 |
Person 3 |
|
Time |
Person 1 |
Person 2 |
Person 3 |
| 4:45 | 4.05 | 3.9 | 4.33 | 4:45 | 4.3 | 4.23 | 4.06 | 4:45 | 4.4 | 4.19 | 4.09 | ||
| 4:55 | 4.2 | 4 | 4.47 | 4:55 | 4.38 | 4.18 | 4.13 | 4:55 | 4.26 | 4.09 | 4.21 | ||
| 5:05 | 4.52 | 4.3 | 4.04 | 5:05 | 4.54 | 4.52 | 4.03 | 5:05 | 4.49 | 4.13 | 4.4 | ||
| 5:15 | 4.62 | 4.43 | 4.61 | 5:15 | 4.07 | 4.42 | 4.58 | 5:15 | 4.57 | 4.21 | 4.49 | ||
| 5:25 | 4.49 | 4.67 | 4.6 | 5:25 | 4.47 | 4.61 | 4.45 | 5:25 | 4.71 | 4.47 | 4.6 | ||
| 5:35 | 4.81 | 4.24 | 4.8 | 5:35 | 4.8 | 4.64 | 4.51 | 5:35 | 4.57 | 4.2 | 4.54 | ||
| 5:45 | 4.78 | 4.21 | 4.78 | 5:45 | 4.76 | 4.76 | 4.87 | 5:45 | 4.75 | 4.25 | 4.56 | ||
| 5:55 | 4.72 | 4.19 | 4.74 | 5:55 | 4.97 | 4.8 | 4.95 | 5:55 | 4.94 | 4.32 | 4.92 | ||
| 6:05 | 4.93 | 4.29 | 4.9 | 6:05 | 4.95 | 4.91 | 4.77 | 6:05 | 4.91 | 4.6 | 4.83 | ||
| 6:15 | 4.99 | 4.3 | 4.81 | 6:15 | 4.98 | 4.98 | 5.02 | 6:15 | 4.8 | 4.53 | 4.96 | ||
| 6:25 | 5 | 4.38 | 4.99 | 6:25 | 5.1 | 4.99 | 4.24 | 6:25 | 5.03 | 4.8 | 5.1 | ||
| 6:35 | 4.78 | 4.39 | 5.01 | 6:35 | 5.03 | 5.18 | 4.76 | 6:35 | 5 | 4.84 | 5.09 | ||
| 6:45 | 5.07 | 4.39 | 4.79 | 6:45 | 4.76 | 5.1 | 4.74 | 6:45 | 4.77 | 4.95 | 5.05 | ||
| 6:55 | 4.75 | 4.4 | 5 | 6:55 | 5.05 | 5.24 | 5.02 | 6:55 | 5.06 | 4.92 | 4.99 | ||
| 7:05 | 4.46 | 4.43 | 4.81 | 7:05 | 4.95 | 5.2 | 4.83 | 7:05 | 4.9 | 4.9 | 4.96 | ||
| 7:15 | 4.9 | 4.42 | 4.97 | 7:15 | 4.7 | 5.5 | 4.97 | 7:15 | 4.8 | 4.94 | 4.9 | ||
| 7:25 | 4.89 | 4.89 | 4.77 | 7:25 | 4.69 | 5 | 4.78 | 7:25 | 4.71 | 4.78 | 4.94 | ||
| 7:35 | 4.86 | 4.94 | 5.26 | 7:35 | 4.88 | 4.9 | 4.86 | 7:35 | 4.96 | 4.65 | 4.84 | ||
| 7:45 | 4.84 | 4.9 | 4.98 | 7:45 | 4.95 | 4.87 | 4.93 | 7:45 | 4.75 | 4.92 | 4.97 | ||
| 7:55 | 4.95 | 4.88 | 4.86 | 7:55 | 4.77 | 5.12 | 4.71 | 7:55 | 4.99 | 4.89 | 4.89 | ||
| 8:05 | 4.73 | 4.98 | 4.75 | 8:05 | 4.92 | 5.35 | 4.77 | 8:05 | 4.96 | 4.5 | 4.99 | ||
| 8:15 | 4.79 | 4.85 | 4.77 | 8:15 | 5.02 | 5.54 | 4.9 | 8:15 | 5.01 | 4.96 | 4.99 | ||
| 8:25 | 5.16 | 5.06 | 4.92 | 8:25 | 4.87 | 5.78 | 4.91 | 8:25 | 5.17 | 4.38 | 5.2 | ||
| 8:35 | 5.24 | 5.31 | 5.22 | 8:35 | 5.07 | 5.98 | 5.32 | 8:35 | 5.13 | 5.03 | 5.25 | ||
| 8:45 | 5.45 | 5.5 | 5.27 | 8:45 | 5.4 | 5.94 | 5.48 | 8:45 | 5.47 | 4.91 | 5.19 | ||
| 8:55 | 5.71 | 5.73 | 5.46 | 8:55 | 5.67 | 6.1 | 5.53 | 8:55 | 5.68 | 5.74 | 5.63 | ||
| 9:05 | 5.99 | 5.91 | 5.9 | 9:05 | 5.95 | 6 | 5.97 | 9:05 | 5.96 | 6 | 6.02 | ||
| 9:15 | 6.38 | 6.14 | 6.4 | 9:15 | 5.47 | 6.13 | 6.27 | 9:15 | 6.18 | 6.3 | 6.11 | ||
| 9:25 | 6.74 | 6.41 | 6.78 | 9:25 | 6.49 | 6.67 | 6.52 | 9:25 | 6.72 | 6.74 | 6.47 | ||
| 9:35 | 7.05 | 6.64 | 6.85 | 9:35 | 7.09 | 7.2 | 6.88 | 9:35 | 7.15 | 6.98 | 7.18 | ||
| 9:45 | 7.41 | 7.33 | 7.35 | 9:45 | 7.55 | 7.34 | 7.33 | 9:45 | 7.28 | 7.34 | 7.47 | ||
| 9:55 | 7.83 | 8.09 | 7.8 | 9:55 | 7.6 | 7.24 | 7.85 | 9:55 | 7.78 | 7.7 | 7.83 | ||
| 10:05 | 7.94 | 7.78 | 7.77 | 10:05 | 7.78 | 8.02 | 7.79 | 10:05 | 7.73 | 7.82 | 7.97 | ||
| 10:15 | 8.07 | 7.91 | 7.86 | 10:15 | 8.1 | 7.55 | 8.05 | 10:15 | 8.08 | 8.09 | 8.22 | ||
| 10:25 | 7.95 | 7.87 | 8.02 | 10:25 | 8.3 | 7.17 | 7.98 | 10:25 | 8.38 | 8.01 | 7.99 | ||
| 10:35 | 7.78 | 7.83 | 7.67 | 10:35 | 7.7 | 7.12 | 7.6 | 10:35 | 7.59 | 7.8 | 7.81 | ||
| 10:45 | 7.43 | 7.7 | 7.69 | 10:45 | 7.09 | 7.04 | 7.36 | 10:45 | 7.18 | 7.43 | 7.45 | ||
| 10:55 | 7.16 | 7.39 | 7.18 | 10:55 | 7.03 | 6.99 | 7.37 | 10:55 | 7.11 | 7.08 | 7.29 | ||
| 11:05 | 6.93 | 7.23 | 6.79 | 11:05 | 6.9 | 6.91 | 6.91 | 11:05 | 7.01 | 7.03 | 6.72 | ||
| 11:15 | 6.04 | 6.98 | 6.52 | 11:15 | 6.78 | 6.83 | 6.58 | 11:15 | 6.92 | 6.57 | 6.38 | ||
| 11:25 | 6.22 | 6.54 | 5.99 | 11:25 | 6.53 | 6.52 | 5.9 | 11:25 | 6.89 | 6.16 | 6.04 | ||
| 11:35 | 5.7 | 6.32 | 5.64 | 11:35 | 6.2 | 6.18 | 5.51 | 11:35 | 6.81 | 5.77 | 5.83 | ||
| 11:45 | 5.42 | 5.86 | 5.3 | 11:45 | 5.8 | 6 | 5.27 | 11:45 | 6.56 | 5.47 | 5.36 | ||
| 11:55 | 5.17 | 5.32 | 4.95 | 11:55 | 5.6 | 5.56 | 5.19 | 11:55 | 6.42 | 5.21 | 4.88 | ||
| 12:05 | 4.98 | 5.12 | 4.5 | 12:05 | 5.44 | 5.21 | 5.04 | 12:05 | 6.21 | 4.91 | 4.69 | ||
| 12:15 | 4.88 | 4.91 | 4.21 | 12:15 | 4.97 | 4.93 | 4.92 | 12:15 | 6.07 | 4.8 | 4.69 | ||
| 12:25 | 4.72 | 4.86 | 4.06 | 12:25 | 4.88 | 4.5 | 4.67 | 12:25 | 5.94 | 4.52 | 4.6 |
Analysis
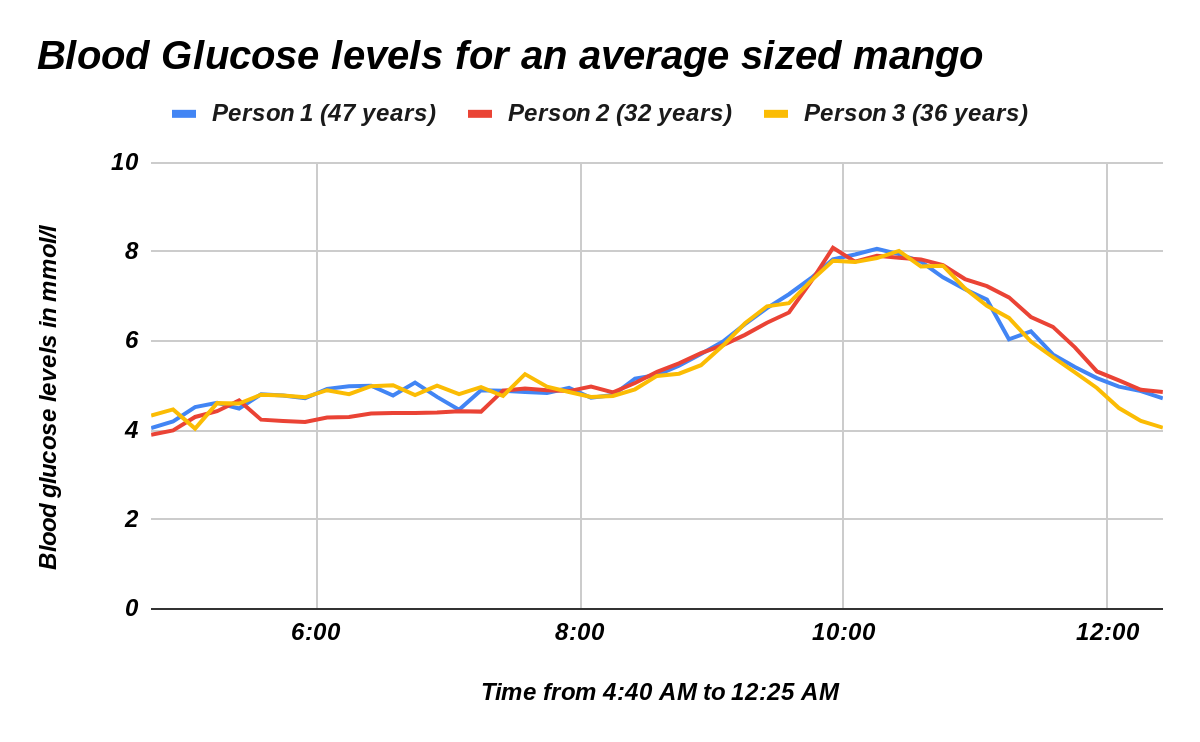
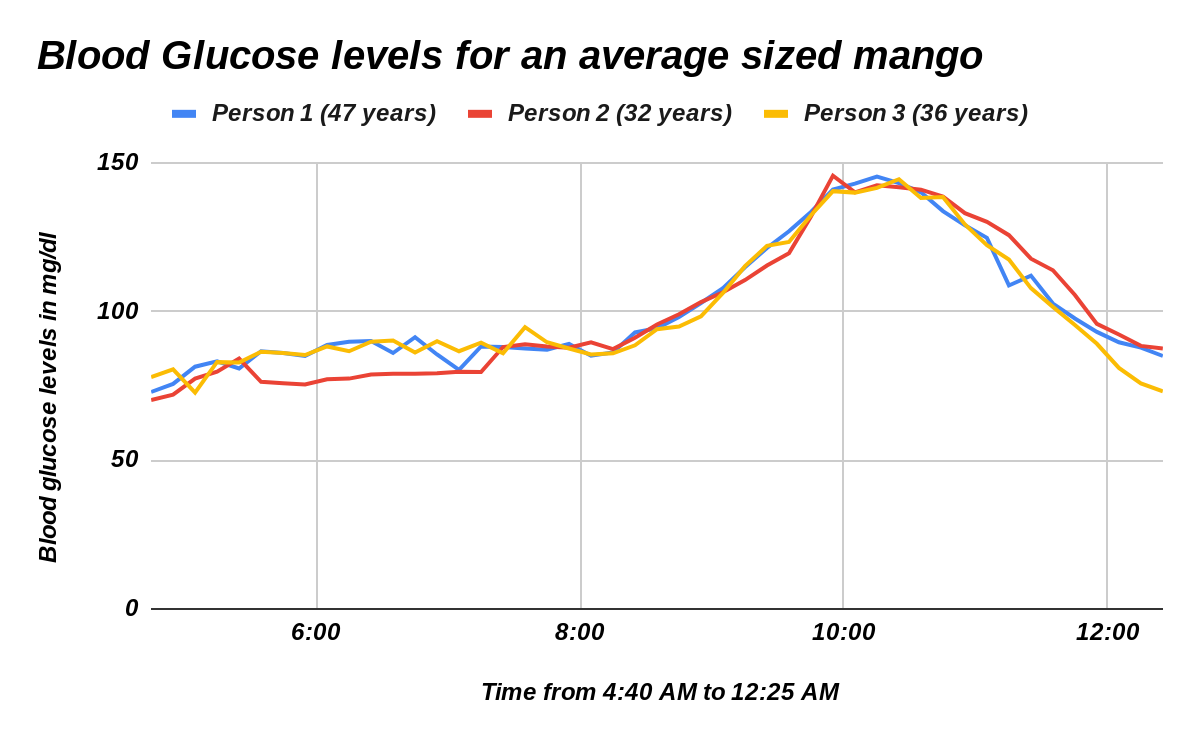
Analysis Mango
For person 1 the highest point in the blood glucose graph was 8.07 mmol/l or 145.3 mg/dl.
8.09 mmol/l or 145.6 mg/dl was the highest blood glucose level for person 2 after consuming a mango.
Person 3’s highest blood glucose level was 8.02 mmol/l or 144.4 mg/dl.
The average for all the participants was 8.06 mmol/l 145.1 mg/dl.
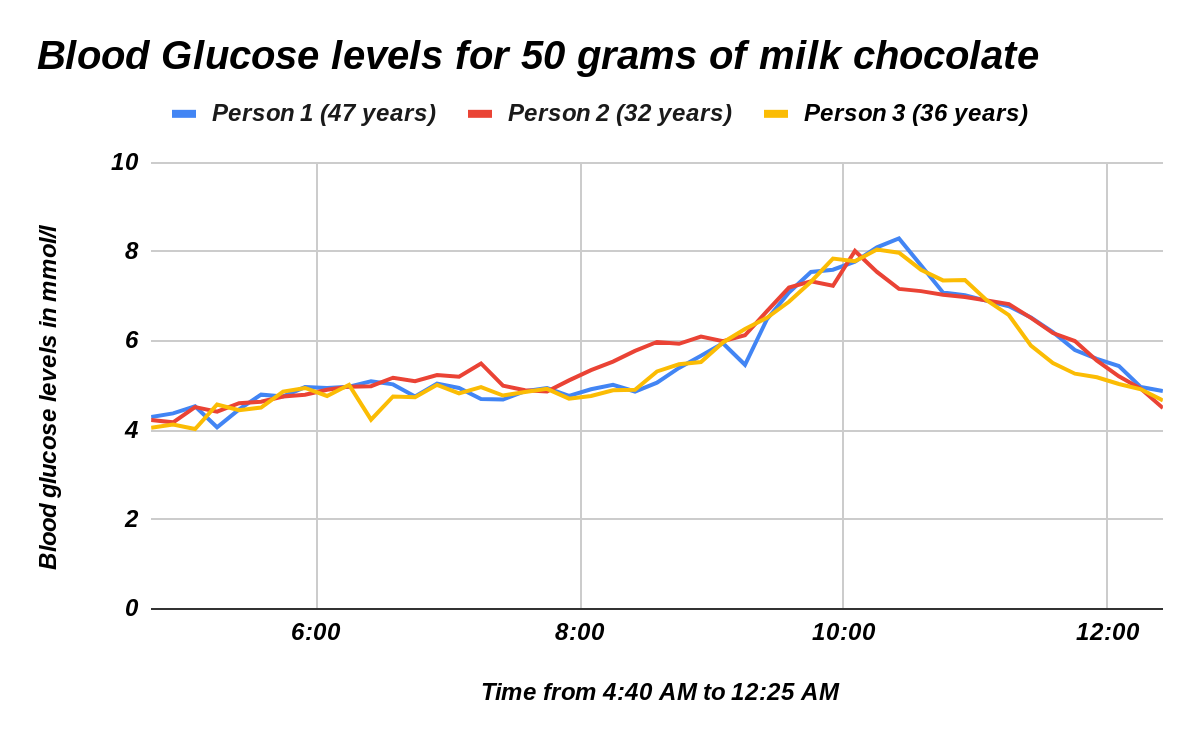
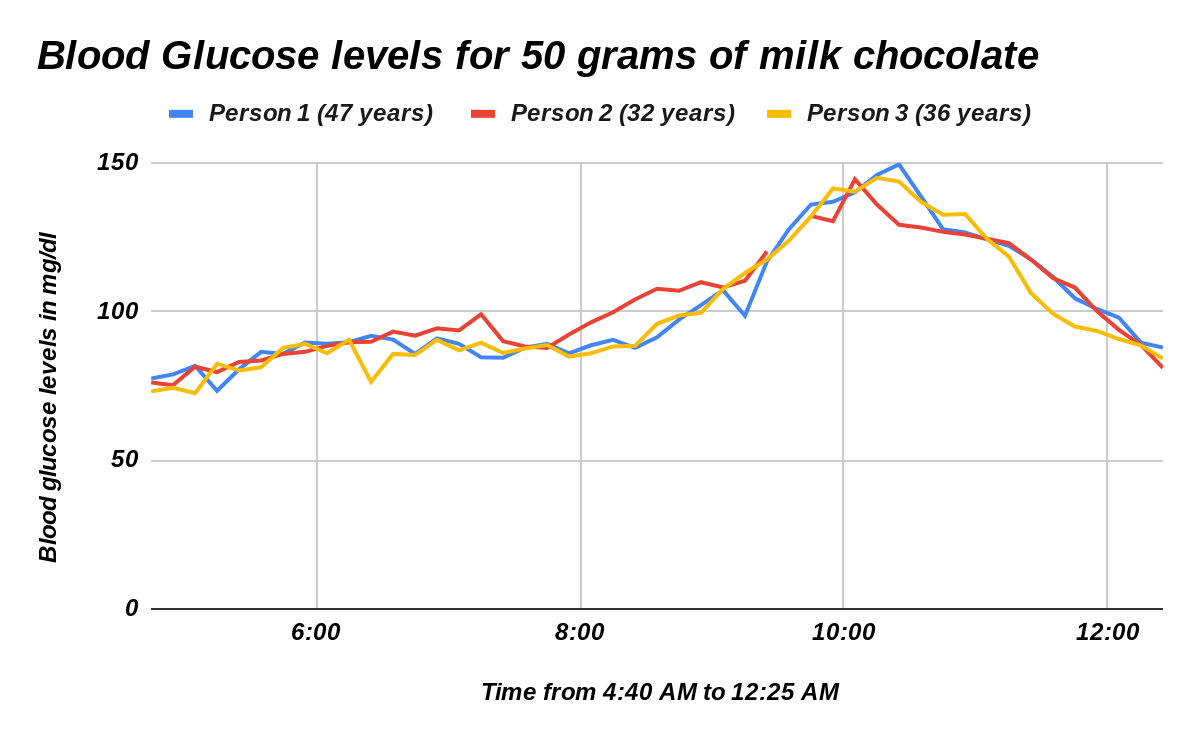
Analysis Chocolate
8.3 mmol/l or 149.4 mg/dl was the highest blood glucose level for person 1 after consuming milk chocolate.
For person 2 the highest point in the blood glucose graph was 8.02 mmol/l or 144.4 mg/dl.
Person 3’s highest blood glucose level was 8.05 mmol/l or 144.9 mg/dl.
The average for all the participants was 8.12 mmol/l 146.2 mg/dl.
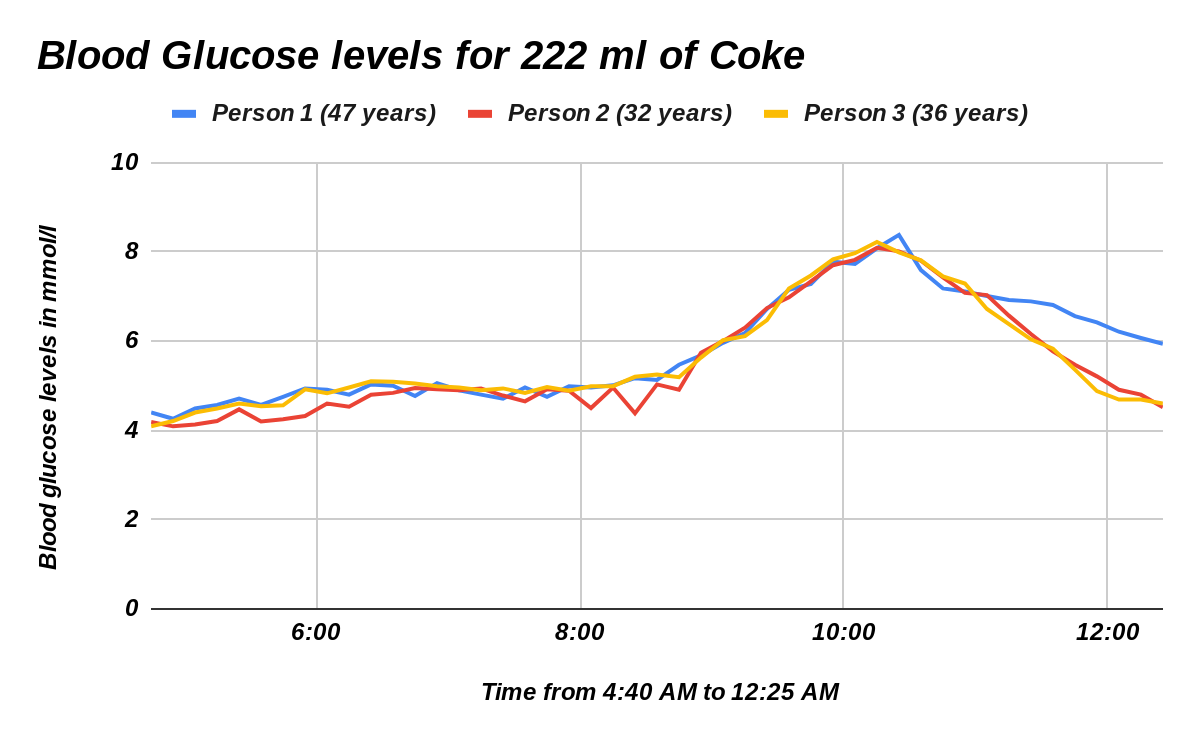
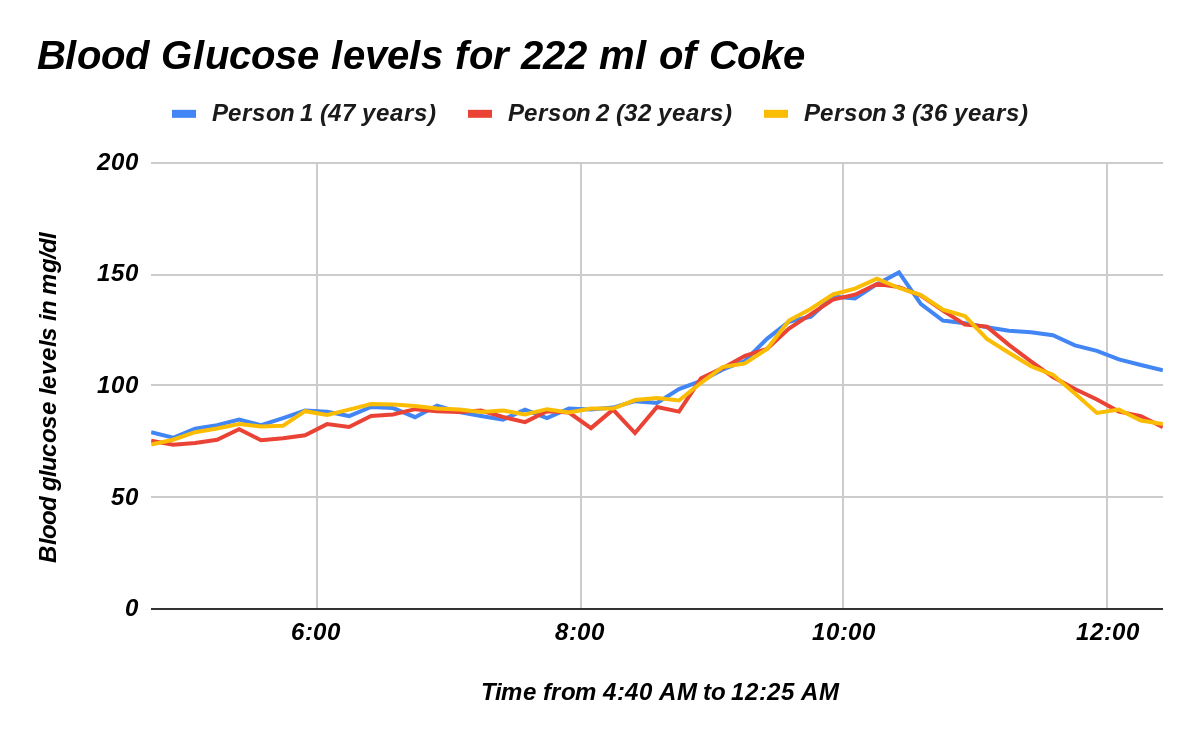
Analysis Coke
Person 1’s highest blood glucose level was 8.38 mmol/l or 150.8 mg/dl
For person 2 the highest point in the blood glucose graph was 8.09 mmol/l or 145.6 mg/dl.
8.22 mmol/l or 148 mg/dl was the highest blood glucose level for person 3 after consuming milk chocolate.
The average for all the participants was 8.23 mmol/l 148.1 mg/dl.
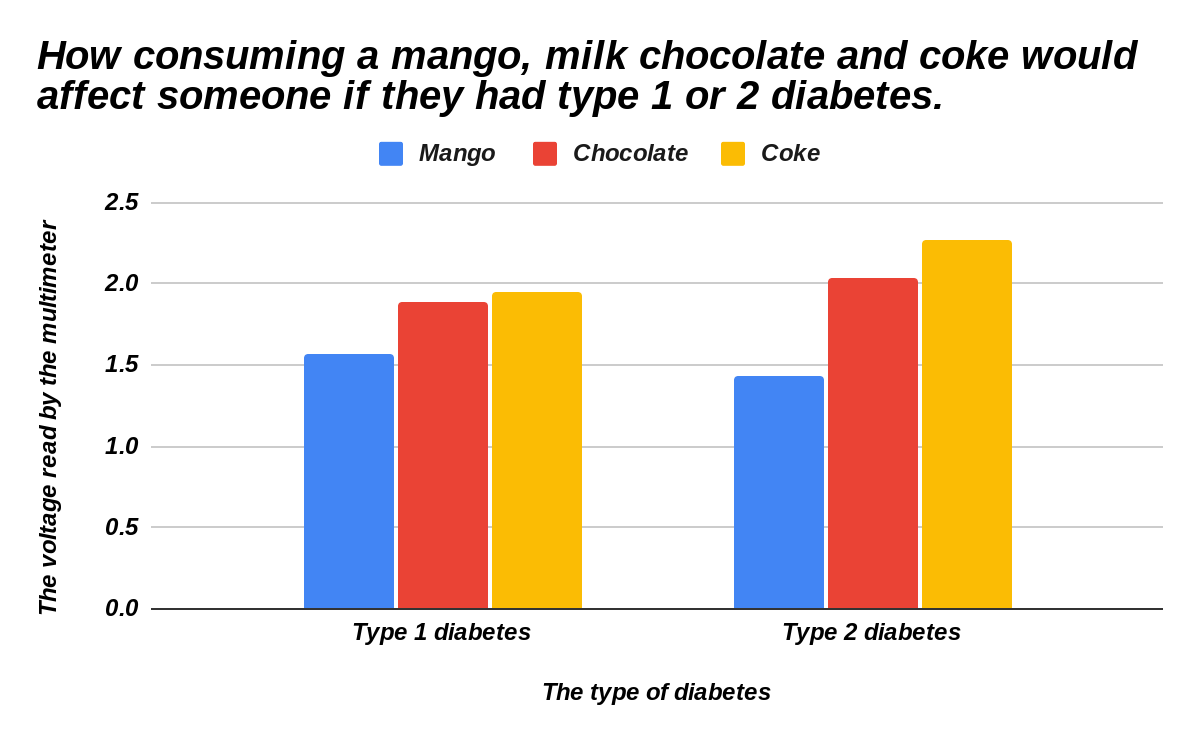
Analysis Type 1 diabetes
For type 1 diabetes after 112 ml of a 1 molar NaCl solution was added to represent a mango, after 10 minutes the multimeter read 1.57 volts.
The multimeter read 1.89 volts ten minutes later after adding 132.1 ml of the 1 molar salt solution to represent milk chocolate.
Ten minutes after adding 136.2 ml of the 1 molar salt solution to represent Coke the voltage on the multimeter read 1.95 volts.
Analysis Type 2 diabetes
The multimeter read 1.43 volts ten minutes later after adding 122 ml of the 1 molar salt solution to represent a mango.
Ten minutes after adding 132.1 ml of the 1 molar salt solution to represent milk chocolate the voltage on the multimeter read 2.03 volts.
For type 1 diabetes 136.2 ml of a 1 molar NaCl solution was added to represent coke, and after 10 minutes the multimeter read 2.27 volts.
Conclusion
The focus of this experiment was to investigate how consuming an average-sized mango, 100 grams of milk chocolate and 222 ml of coke would affect the blood glucose levels. It was hypothesized that the result of this experiment would be that consuming milk chocolate would raise blood glucose levels the most. This was proved wrong because Coke increased blood glucose levels the most. The results of this experiment showed that the highest average point in the graph after consuming a mango was 8.06 mmol/l or 145.1 mg/dl, for milk chocolate it was 8.12 mmol/l or 146.2 mg/dl and lastly for coke, it was 8.23 mmol/l or 148.1 mg/dl. This experiment can be supported by the following research. Glucose is fuel for the body which is obtained from the foods we consume. Our body breaks them down to glucose. When we eat our blood glucose levels increase. To lower them back down a fluid is produced by the pancreas called insulin. The pancreas releases insulin as it corresponds with the body. This helps lower the blood glucose levels and allows the cells to use the glucose. When the insulin doesn’t properly respond to the body a medical condition known as diabetes is formed. There are different types of diabetes but there is no known cure. If a diabetic person consumes food containing high amounts of glucose it can increase their blood glucose levels to a dangerous level which can harm them. From this experiment we can infer that a mango has the least amount of glucose, while milk chocolate has more and coke has the most amount of glucose.
Application
The results of this experiment can help many people out for a variety of reasons. First, it can tell people who are diabetic how different foods will increase their blood glucose level. Second, it can help people who are on a strict diet and don’t want to consume a lot of glucose. Then, they can know which fruits and vegetables are good for them and which aren’t and those foods would increase their blood glucose levels to a certain level. They should also know that it is not only sugar that increases their blood glucose levels, but many other things also can, such as carbohydrates, and fats.
This image was taken from https://medimap.ca/en/the-components-of-a-healthy-diet/
Sources Of Error
My science fair experiment could have been improved because sometimes in the model the conductance sensor would move around not giving me fully precise numbers. In the very first trial for Part A where the participant had to eat a mango, we forgot to connect the watch to the phone so we did not receive the data and had to do it again. Things like gender and age were not taken into consideration. Lastly, sometimes the watch's readings could have fluctuated a little bit.
Citations
Dealing with diabetes: The road to developing an artificial pancreas: Science project (no date) Science Buddies. Available at: https://www.sciencebuddies.org/science-fair-projects/project-ideas/HumBio_p040/human-biology-health/developing-an-artificial-pancreas (Accessed: 21 January 2024).
Type 1 diabetes (2023) Mayo Clinic. Available at: https://www.mayoclinic.org/diseases-conditions/type-1-diabetes/symptoms-causes/syc-20353011 (Accessed: 21 January 2024).
What is diabetes? (2023) Centers for Disease Control and Prevention. Available at: https://www.cdc.gov/diabetes/basics/diabetes.html#:~:text=With%20diabetes%2C%20your%20body%20doesn,vision%20loss%2C%20and%20kidney%20disease (Accessed: 21 January 2024).
What is diabetes? (no date) DiabetesCanadaWebsite. Available at: https://www.diabetes.ca/about-diabetes/what-is-diabetes (Accessed: 21 January 2024).
(No date) Diabetes - StatPearls - NCBI Bookshelf - National Center for ... Available at: https://www.ncbi.nlm.nih.gov/books/NBK551501/ (Accessed: 22 January 2024).
Canada, P.H.A. of (2023) Government of Canada, Canada.ca. Available at: https://www.canada.ca/en/public-health/services/chronic-diseases/diabetes.html (Accessed: 21 January 2024).
Family Medicine, diabetes and Cardiology Centre of Excellence (2023) Reflex Medical Centre. Available at: https://reflexmedical.net/cardiac-diagnostics/stop-diabetes-its-complications/ (Accessed: 21 January 2024).
Garg, P. (2023) Type 2 diabetes - symptoms and causes - redcliffe labs, MyHealth. Available at: https://redcliffelabs.com/myhealth/diabetes/type-2-diabetes-its-symptoms-and-causes/ (Accessed: 21 January 2024).
Bottaro, A. (no date) How are your body organs affected by diabetes?, Verywell Health. Available at: https://www.verywellhealth.com/organs-affected-by-diabetes-5118060 (Accessed: 21 January 2024).
#Publisher (2023) World-first trial finds arthritis drug may help treat type 1 diabetes, Sky News. Available at: https://news.sky.com/story/world-first-trial-finds-arthritis-drug-may-help-treat-type-1-diabetes-13024706 (Accessed: 21 January 2024).
Kuball, E. (2018) Managing type 2 diabetes. Hoboken, NJ: John Wiley & Sons, Inc.
Rubin, A.L. (2015) Diabetes for dummies. Hoboken, NJ: John Wiley & Sons, Inc.
Ford-Martin, P. and Baker, J. (2012) The Everything Guide to Managing Type 2 diabetes: From diagnosis to diet, all you need to live a healthy active life with type 2 diabetes. Avon, MA: Adams Media.
Bottaro, A. (no date) How are your body organs affected by diabetes?, Verywell Health. Available at: https://www.verywellhealth.com/organs-affected-by-diabetes-5118060 (Accessed: 21 January 2024).
Poole, S.B., Riolo, A. and Rubin, A.L. (2023) Diabetes. Hoboken, NJ: John Wiley & Sons, Inc.
Acknowledgement
I would like to thank my parents and my sister for supporting me and helping me out during my science fair. I would also like to thank my teacher and my science fair coordinator. Last but not least I would also like to thank all the participants who chose to participate in my science fair.