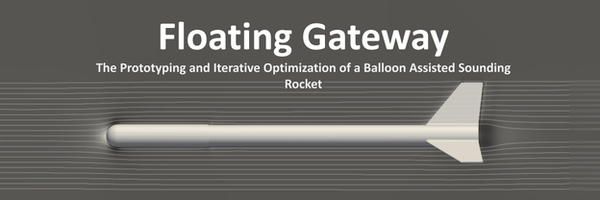
Floating Gateway: The Prototyping and Iterative Optimization of a Balloon Assisted Sounding Rocket
Sylvan Zheng
Western Canada High School
Grade 10
Presentation
No video provided
Problem
Problem This section explores the demands of, and current technology, methods, and solutions in the near-space and suborbital flight markets. Through this exploration, the project’s main focuses and objectives are identified.
Table of Contents
- Background Research
Background Research
To better understand the needs of the near-space and suborbital launch market, this section explores the current clients and solutions that exist in this market.
Applications of Near-Space and Suborbital Rockets
Despite significant advancements in research instrumentation and technologies, some specific environments still cannot be practically reproduced in a lab. In suitable cases, sounding rockets can deliver research payloads to upper-atmospheric or suborbital trajectories, providing access to the required vacuum or microgravity conditions at a fraction of the cost of conventional, orbital flights. Aside from the adjacent fields of aerospace research and astronomy, other fields, including molecular biology and optics, have also benefited from the unique conditions provided by sounding rocket flights. The following three examples showcase the wide range of conditions accessible by sounding rockets, and research that the flights enabled.
Early Upper Atmospheric Meteorology - Nike Smoke
| ______________________________ | |
|---|---|
| The Nike Smoke was a specialized NASA meteorological sounding rocket, in use from the mid to late 1960s to track upper atmospheric winds(Rhyne et al., 1972). The Nike Smoke was fitted with specialized titanium tetrachloride canisters to produce a bright white trail of smoke on ascent, which then could be tracked by cameras on the ground to determine upper atmospheric winds. The upper atmospheric data collected from the 125 (Wikipedia contributors, 2013) Nike Smoke launches eventually went to inform the design of the Saturn family of rockets, including the Saturn V. |  |
Source: (Rhyne et al., 1972), (Wikipedia contributors, 2013)
Imaging of the 1994 Shoemaker Levy-9 Impact
| ______________________________ | |
|---|---|
| Gases in the Earth’s atmosphere, notably ozone and water, produce substantial absorption lines that limit the capabilities of ground-based observation. For this reason, instruments that are intended to observe the gamma ray, x-ray, UV, IR, and microwave spectra often must be operated above the Earth’s atmosphere. Taking advantage of the short development times for sounding rocket payloads, scientists could launch specialized instruments above the atmosphere to observe the brief impact of comet Shoemaker Levy-9 into Jupiter, avoiding detrimental atmospheric interference without the development time and cost associated with an orbital space telescope. In fact, a sounding rocket equipped with a telescope-spectrograph provided the only data documenting the indirect effect of the collision on Io’s plasma torus in the far UV spectrum, a wavelength of light that is usually absorbed by oxygen and ozone in the Earth’s atmosphere (Stern et al., 1995). |  |
Source: (Stern et al., 1995), (Adkins, 2023)
Growth of Protein Crystals in Microgravity
In 1913, the invention of x-ray crystallography provided a revolutionary method to determine the 3d molecular structure of proteins, leading to breakthroughs in our exploration of life. X-ray crystallography involves analyzing the diffraction of x-rays as they pass through a pure crystal of the protein. However, under Earth’s gravity, specific proteins cannot form crystals of sufficient size or quality for x-ray crystallography, or do not crystallize at all. Instead, these particular proteins may need to be crystalized in microgravity, where gravitational forces do not negatively impact crystallization.
| ___________________________________ | |
|---|---|
| Although possible, it is often impractical to keep protein samples under zero gs for more than a few seconds in a lab setting. Instead, protein crystallization experiments often need to be flown aboard the ISS, specialized microgravity aircraft, or on sounding rockets. In particular, when aerodynamic forces are negligible in the upper atmosphere, sounding rockets offer a high quality microgravity environment (VSB 30 rockets used in SSC Space’s MASER program offered 6 minutes of microgravity under 10-4g), without the costs associated with the former two options (ESA, 2023),(SSC Space, 2018). In fact, Ribonuclease A crystals grown as part of the MASER sounding rocket program revealed finer structural features previously unseen in terrestrially grown crystals (Lennart Sjölin et al., 1991). |  |
Source: (McPherson & DeLucas, 2015), (L. Sjölin et al., 1991), (SSC Space, 2018), (Wikipedia Contributors, 2024)
Existing Near-Space and Suborbital Solutions
To take advantage of the benefits of near-space and suborbital research, many companies and organizations have entered the suborbital launch market, each bringing their own solutions and competing for their own niches. Spearheaded by private companies and reusable rockets, the suborbital launch market has grown rapidly at a CAGR of 8.2%, and focuses on cost reduction and rapid flights. The following 10 examples provide an overview of the niches, methods, specific solutions and companies that form the suborbital launch market.

1. Low Power Amateur Rockets
Example: Estes Pro Series II™ So Long Low power amateur rockets, more commonly known as hobby or model rockets, are often sold as relatively low-cost consumer kits, and only carry insubstantial amounts of cargo. They are usually powered by single use black powder solid fuel motors or composite solid fuel motors for higher I_sps. Although they are available to everyone, government regulations restrict their propellant mass and impulse, effectively limiting max altitude to around \~1000 m (\~3280 ft), while most fly lower. Estes’s Mayhem™ rocket is presented here as an example because of its dedicated payload bay, relatively powerful motors, and multi-stage high-altitude flight profile.
| ----------------------------------------------------------------------------- | ---------------------------------------------------------------------------- |
|---|---|
| Approximate Apogee (Maximum Altitude) | 640 m (2100 ft) |
| Payload Mass | \~60 g (one egg) |
| Wet Mass (Total Mass) | 184 g + \~60g payload |
| Length | 0.853 m (33.6 in) |
| Diameter | 4.2 cm (1.64 in) |
| Approximate v (Velocity imparted by vehicle) | 110 m/s |
| Reusability (How much of the vehicle can be reflown) | Full, excluding propellant |
| Initial Cost | $49.99 |
| Additional Cost / Launch | $27.99 |
| Cost / kg of Payload | $466 |
Sources: Estes Rockets (2023), Estes Rockets (2024), Estes Rockets (2025), NASA Glenn Research Center (2025)
2. Meteorological Balloons / High Altitude Balloons
Example: Kaymont HAB-600 Meteorological balloons, or weather balloons, are an established and well tested technology used to effectively observe high altitude temperature, pressure, humidity and windspeed data. Harnessing the buoyancy of low density lifting gases like hydrogen and helium, meteorological balloons can reach around 40km in altitude without any propellant. Weather balloons are often periodically launched by weather stations throughout the day, and are used to enhance their weather, storm, pollution, and satellite data. They are usually launched with a small, expendable electronic payload, known as a radiosonde, but can be adapted to launch other payloads. Kaymont’s HAB-600 is presented here as an example of an intermediate meteorological balloon.
| ----------------------------------------------------------------------------- | ----------------------------------------------------------------------------- |
|---|---|
| Approximate Maximum Altitude | 40 km (24.8 mi) |
| Payload Mass | 0.9 kg (2 lb) |
| Wet Mass | N/A |
| Length | N/A |
| Diameter | 100 - 600 cm, Depending on altitude |
| Approximate v | N/A |
| Reusability | None |
| Cost / Launch | $50 Balloon + $42 Lifting Gas = 92$ |
| Cost / kg of Payload | $102/kg |
Sources: National Weather Service (2025), Kaymont (2024), Vasco (2025)
3. Zero Pressure Research Balloons
Alongside super-pressure balloons (Not mentioned here), zero pressure research balloons are NASA’s Balloon Program Office and other agencies’ goto for transporting scientific payloads to the upper atmosphere. Open envelopes with ambient pressure lifting gas allows these balloons to actively correct their buoyancy and altitude, but also limit their flight time. They are often 6 to 30 times larger than meteorological balloons, and can carry multiple large experiments for weeks, and to specific altitudes.
| ----------------------------------------------------------------------------- | ----------------------------------------------------------------------------- |
|---|---|
| Approximate Maximum Altitude | 30 km (18.6 mi) |
| Approximate Payload Mass | Up to a few tonnes (1000 kg) |
| Wet Mass | N/A |
| Length | N/A |
| Diameter | 60 - 150 m, Depending on balloon |
| Approximate v | N/A |
| Reusability | Full, excluding lifting gas |
| Cost / Launch | No exact numbers, but advertised as cost effective |
Source: Canadian Space Agency (2022), NASA (2015), StratoStar (2025)
4. Super Pressure Research Balloons
Alongside zero pressure balloons, super-pressure research balloons are NASA’s Balloon Program Office and other agencies’ goto for transporting scientific payloads to the upper atmosphere. Unlike zero pressure balloons, no lifting gas is released by their sealed envelopes, allowing them to fly for months instead of weeks. However, since insufficient data is publicly available, a datatable is not provided here.
Source: NASA (2015)
5. High Power Amateur Rockets
Example: USC RPL Aftershock II With the correct certifications, equipment, technology, and funding, an amateur or university can build and launch high-performance rockets that rival some professional designs. The USC Rocket Propulsion Laboratory's Aftershock II, the current recordholder for the highest altitude and speed achieved by an amateur built rocket, is a good example of this. While the Aftershock II used a traditional solid rocket motor, hybrid motor designs are also becoming more popular among amateurs thanks to their improved safety and ability to throttle and shutoff after ignition.
| ----------------------------------------------------------------------------- | ----------------------------------------------------------------------------- |
|---|---|
| Approximate Apogee | 143.3 km (470,400 ft) |
| Payload Mass | Not Flown with Payload, but flight computer estimated to be 500g |
| Wet Mass | 150 kg (330 lb) |
| Length | 4.0 m (13 ft) |
| Diameter | 20 cm (8 in) |
| Approximate v | 1656 m/s |
| Reusability | Full, excluding propellant |
| Initial Cost | Not Publicly Available |
| Additional Cost / Launch | \~10k, from unreliable source |
| Cost/kg Payload | 20k |
Sources: USC Rocket Propulsion Laboratory (2024), Bathurst (2025), Reddit Users (2024)
6. Early Professional Research Sounding Rockets
Example: Magellan Aerospace Black Brant I The Black Brant series of rockets, designed and built in Canada by Magellan Aerospace, have made a reputation as reliable and versatile multi-use suborbital launch vehicles. The Black Brant I was the first rocket in the series, first launching in 1959. While this rocket is no longer in service, it offers insight into early sounding rockets.
| ----------------------------------------------------------------------------- | ----------------------------------------------------------------------------- |
|---|---|
| Approximate Apogee | 143.3 km (470,400 ft) |
| Payload Mass | 68 kg (149 lb) |
| Wet Mass | 730 kg (1,600 lb) |
| Length | 7.41 m (24.31 ft) |
| Diameter | 26 cm (10.2 in) |
| Approximate v | 2068 m/s |
| Reusability | Full, excluding propellant |
| Initial Cost | Not Publicly Available |
| Additional Cost / Launch | Not Publicly Available |
Sources: Black Brant I (2019), Magellan Aerospace (2024)
7. Modern Professional Research Sounding Rockets
Example: Magellan Aerospace Black Brant XII The Black Brant series of rockets, designed and built in Canada by Magellan Aerospace, have made a reputation as reliable and versatile multi-use suborbital launch vehicles. The Black Brant XII is currently the most capable in the series, utilizing 4 stages instead of only 1 for the Black Brant I.
| ----------------------------------------------------------------------------- | ----------------------------------------------------------------------------- |
|---|---|
| Approximate Apogee | 500km to 1500 km, depending on payload |
| Payload Mass | 136 kg - 522 kg (300 lb - 1150 lb) |
| Wet Mass | 5300 kg (11700 lb) |
| Length | 17.0 m (55.0 ft) |
| Diameter | 76 cm (2.5 ft) |
| Approximate v | 5340 m/s |
| Reusability | Not Publicly Available |
| Initial Cost | Not Publicly Available |
| Additional Cost / Launch | 600K, from unreliable source |
| Cost/kg Payload | 1K to 5K |
Sources: Black Brant XII (2019), Space Exploration Stack Exchange (2017)
8. Commercial Suborbital Launch Vehicles
Example: Blue Origin New Shepard Many private commercial aerospace companies, like Blue Origin, have begun looking into suborbital space tourism. Blue Origin’s suborbital vehicle, the New Shepherd, is built exactly for that. With a reusable booster, the New Shepard can carry up to six passengers past the Kármán line, without expending expensive rocket components. With its high payload capacity and mass margins, the rocket can also be outfitted with scientific instruments for research.
| ----------------------------------------------------------------------------- | ----------------------------------------------------------------------------- |
|---|---|
| Approximate Apogee | 106 km (66 mi) |
| Payload Mass | 68 kg (150 lb) for research, 90kg*6 = 540 kg of crew |
| Wet Mass | 35,000 kg (77,000 lb) from Unreliable Source |
| Length | 19.2m (63ft) from Unreliable Source |
| Diameter | 3.8 m (12.5 ft) from Unreliable Source |
| Approximate v | 1419 m/s |
| Reusability | Full, excluding fuel |
| Initial Cost | Not Publicly Available |
| Additional Cost / Launch | $1-3 million |
| Cost/kg Payload | 2K to 6K |
Sources: Blue Origin (2021), MacLellan et al. (2025), Wikipedia Contributors (2006), Shepherd (2025), Blue Origin (2025)
Alternative Systems
Almost all existing launch vehicles are bound by the rocket equation, leading to ever larger and more powerful rockets to launch heavier payloads further and faster. Many innovative concepts, from mass-drivers to laser-propelled spacecraft, have attempted to bypass the equation by offsetting their energy source offboard. However, since many of these systems are in early stages of development, very unconventional, or nonexistent, not much data is publicly available about them.
9. SpinLaunch
Alternative Mass-Driver Style Suborbital and Orbital Launch System Instead of using on-board propellant, the SpinLaunch system diverts its energy requirements to a ground-based centrifuge that imparts a significant amount of initial kinetic energy to the payload. This energy would be drawn straight from electricity, leading to the reduction of propellant costs and shorter turnaround times. However, payloads need to endure centrifugal forces of the magnitude of 10,000gs, and the system isn’t easily scalable to accommodate more massive payloads. So far, only a one third scale prototype has been tested, and I personally haven’t seen any further progress recently.
| ----------------------------------------------------------------------------- | ----------------------------------------------------------------------------- |
|---|---|
| Approximate Apogee | 9 km in test flights, but likely up to 180 km |
| Payload Mass | 400kg |
| Wet Mass | Not Applicable |
| Approximate v | 2100m/s |
| Reusability | Full |
| Initial Cost | Not Publicly Available |
| Additional Cost / Launch | Not Publicly Available |
| Cost / kg Payload | $1,250-$2,500 |
Sources: Wikipedia Contributors (2018)
10. Virgin Galactic Spaceship 2
Alternative Jet-assisted Horizontal Takeoff and Landing Suborbital Launch System The Virgin Galactic Spaceship 2 takes advantage of a jet-powered lifting aircraft, which operates much higher I_sp and more efficiently than a rocket engine, to gradually offset potential energy and gain altitude, before firing its main hybrid rocket motor. This flight profile not only increases the spacecraft’s initial altitude, but also reduces the impact of air resistance, yielding a system filling the same niche as Blue Origin’s New Shepard at a fraction of the cost.
| ----------------------------------------------------------------------------- | ----------------------------------------------------------------------------- |
|---|---|
| Approximate Apogee | 90 km |
| Payload Mass | 90 kg/person * 6 people (2 pilots + 4 passengers) = 540kg |
| Wet Mass | 13,000kg |
| Approximate v | Not Applicable |
| Reusability | Full |
| Initial Cost | Not Publicly Available |
| Additional Cost / Launch | 200K/ticket*4 tickets = 800K (In 2015) |
| Cost / kg Payload | $1.48K/kg |
Sources: Durkin (2018), Wikipedia Contributors (2004)
Laser Propelled Vehicles
Similar to spinLaunch, laser propelled vehicles are conceptualized to offset their energy requirements to electrically powered ground stations. However, unlike spinLaunch, these ground stations would deliver energy to the vehicle throughout flight in the form of lasers, instead of in one short, initial impulse, avoiding the excessive g-forces associated with the centrifugal launch system. The energy received from the laser would then be used to ionize an on-board propellant or the surrounding atmosphere, or even initiate nuclear reactions, providing thrust. However, these systems are still highly conceptual, and would require large, specialized ground infrastructure to deliver the required energy.
Summary
Based on this background research, it can be concluded that the suborbital and near space launch market prioritizes affordability while providing research functionality. For sounding rockets specifically, their focus is to provide similar altitudes and microgravity at a lower cost than orbital flights when extended exposure is unnecessary. High altitude balloons, while even lower cost, do not provide microgravity or a full vacuum environment, but instead provide an affordable method to reach near space environments.
However, most modern sounding rockets in the market are designed for large payloads (\~400kg) with infrequent and expensive launches, yielding repeated launches with a small payload unaffordable. Especially with the miniaturization of electronics and other equipment, it may also be possible to shrink the same amount of scientific capability into a smaller and lighter payload. Therefore, this project will aim to fill the niche of extremely low cost flights with small payloads, while yielding similar altitudes and microgravity conditions as lower performance sounding rockets.
To fill this niche, this project will focus on combining the technologies of high altitude balloons and amateur rockets, both of which are very affordable solutions to near space access. This strategy is expected to not only compound the altitudes of the two vehicles, but also reduce the effect on drag on the rocket due to the thinner atmosphere, further increasing altitude performance. To reduce costs without sacrificing functionality, the rocket aims to use off-the-shelf model rocket components in conjunction with 3D printed parts, that also allow for complex, aerodynamically optimized geometries.
Method
Table of Contents
- Feasibility Studies
- The Effect of Launch Altitude on the Apogee and Launch Relative Apogee of an Improved Orion Sounding Rocket
- The Effect of the Area-drag Coefficient on the Relationship Between Launch Altitude and Launch Relative Apogee of a Model Rocket
- The Effect of Mass on the Relationship Between Launch Altitude and Launch Relative Apogee of a Model Rocket
- Objective
- Initial Design
- Prototype Optimizations
Feasibility Studies
With an understanding of the needs of and current players in the suborbital launch market, I created a simple Euler ballistics, drag, and thrust integrator to explore the feasibility and behavior of a balloon-launched sounding rocket. The results of these simulations went on to inform my optimizations later on.
The Effect of Launch Altitude on the Apogee and Launch Relative Apogee of an Improved Orion Sounding Rocket
Problem
This lab was performed to empirically support and quantify the apogee advantage given by launching a sounding rocket from an elevated launch site, such as a meteorological balloon, resulting from reduced air density and air resistance.
Background Information
Over the course of its flight, the main forces acting on a rocket are thrust from its engine, gravity from Earth, and aerodynamic drag from the surrounding atmosphere. By reducing the surrounding air pressure, it is possible to improve the performance of a rocket by minimizing opposing forces from aerodynamic drag. Since air density decreases as altitude increases, launching a rocket from a higher altitude would logically improve both absolute and relative altitude performance.
Variables
Manipulated
| Variable | Explanation |
|---|---|
| Launch Altitude | The altitude ASL at which the rocket is launched |
Responding
| Apogee (km ASL) | The maximum altitude the rocket achieves over its flight. |
| Launch Relative (km) | The rocket’s apogee relative to its launch altitude. Found as apogee altitude (ASL) - launch altitude (ASL) |
Control
| Rocket Parameters | The rocket’s flight characteristics, including its aerodynamic properties, wet and dry mass, and motor thrust profile |
| Earth Atmosphere | The model used by the simulator to find atmospheric density given altitude ASL, drawn from Hall (2021)’s model. |
Hypothesis
If the launch altitude is increased, then the apogee will increase because both the initial altitude and reduced aerodynamic drag will contribute to a higher maximum altitude.
If the launch altitude is increased, then the maximum height above launch will increase, but less than the apogee, because of the reduction of opposing forces in the form of aerodynamic drag at higher altitudes.
Experimental Design
The experiment was run by the Python script flightIntegrator.py, which uses a simple Euler integrator to simulate drag and gravitational forces and the resulting trajectories of multiple virtual rockets. The rockets are modelled as accurately to the real vehicles as possible using the publicly available data cited in the references. Subsonic and supersonic aerodynamic properties were approximated through OpenFOAM CFD (Computational Fluid Dynamics) airflow simulations.
These simulated rockets were launched from 0km ASL to simulate a regular ground-based launch, 5km, 10km, 20km, and 40km to sample possible altitudes achievable by high altitude meteorological balloons, and 100km as a representation of the upper bound at the edge of space. Although the apogee would be a better measurement of total performance and the final optimization target, it was both directly influenced by the initial altitude and indirectly influenced through aerodynamic effects. Instead, the launch relative apogee, defined as the difference between the launch altitude and apogee, was also measured, as it would more clearly isolate the performance gains resulting from reduced aerodynamic drag.
Observations
Table 1: Apogee and Launch Relative Apogee Vs. Launch Altitude
| Launch Altitude | Apogee | Launch Relative Apogee |
|---|---|---|
| 0 km | 87.55 km | 87.55 km |
| 5 km | 139.78 km | 134.78 km |
| 10 km | 182.48 km | 172.48 km |
| 20 km | 227.33 km | 207.33 km |
| 40 km | 258.36 km | 218.36 km |
| 100 km | 323.67 km | 223.67 km |
 Figure 1: Apogee Vs. Launch Altitude
 Figure 2: Launch Relative Apogee Vs. Launch Altitude
Analysis and Conclusion
Superficially, an Improved Orion rocket reaches an apogee of 142.35 km when launched from just 5 km ASL, a 73.96% improvement when compared to the 81.83 km achieved by an identical vehicle launched from sea level. Similarly, a rocket launched from 40 km ASL reaches an apogee of 285.75 km, a 249.20% improvement, and a rocket launched from 100 km ASL reaches 351.78 km or 329.89% more than the control (See Figure 1).
The maximum altitude above the launch altitude provides a metric with which to measure the impact of aerodynamic forces. Looking at the launch relative apogee, it seems to be approaching a horizontal asymptote with an exponentially decaying difference, which means it can be fit to an exponential function of form y=a+be^cx (See Figure 3). This means that the maximum altitude above launch will approach a finite value as the launch altitude approaches infinity. Intuitively, this is likely because, as air resistance becomes negligible, the rocket’s trajectory will approach a theoretical Dragless parabolic trajectory.
For the Improved Orion specifically, its launch relative apogee given a launch altitude can be fit to the exponential decay curve, as shown in Figure 3. The asymptote can be found as y=252.49148 by calculating the limit as x approaches infinity, and represents the theoretical launch relative apogee without the effects of aerodynamic forces
 Figure 3: Maximum Altitude Above Launch Altitude as an Approximate Function of Launch Altitude
An Improved Orion rocket launched from 40km, the maximum altitude of a meteorological balloon, reaches 91.54% of the theoretical maximum performance. In comparison, an identical vehicle launched from sea level reaches only 32.41% of the theoretical performance, and 97.33% when launched from 100 km. However, note that rockets launched from higher altitudes still directly (non-aerodynamically) benefited from the higher initial altitude to boost its apogee, matching my hypothesis. Overall, an Improved Orion rocket launched from just 40km experiences similar aerodynamic advantages when compared to an identical vehicle launched from the edge of space.
The Effect of the Area-drag Coefficient on the Relationship Between Launch Altitude and Launch Relative Apogee of a Model Rocket
Purpose and Background Information
As the launch altitude increases and air density decreases, the aerodynamic forces on the rocket also decrease linearly with air density. As a result, optimizations of the aerodynamic properties of a rocket would intuitively become less effective as launch altitude increases, and increasing launch altitude would similarly be more effective for draggier rockets. The purpose of this lab is to conform and quantify these intuitions.
Variables
Manipulated
| Variable | Explanation |
|---|---|
| Area-Drag Coefficient AC_d [cm^2] | The product of the forward cross-sectional area and drag coefficient of the rocket, which can approximately characterize drag forces on a rocket given the surrounding air density, airspeed, and drag. Reasonable values were found from CFD (Computational Fluid Dynamics) digital wind tunnel simulations. |
| Launch Altitude ASL p*_z,0* [km] | The altitude ASL at which the rocket is launched. |
Note: Since two manipulated variables are being tested, samples will be collected across the products of the tested sets.
Responding
| Launch Relative Apogee p_z,max - p_z,0[km] | The maximum height the rocket achieves during its flight above its launch site. Found as apogee altitude (ASL) - launch altitude (ASL) |
Control
| Rocket Parameters | The rocket’s flight characteristics, including its wet and dry mass, and motor thrust profile |
Hypothesis
If the rocket’s area-drag coefficient increases, the effect of increasing the launch altitude on the launch relative apogee will also become stronger, as air resistance, and the reduction of air resistance, will be a more important force influencing the rocket’s flight.
Experimental Design
The experimental design consisted of multiple virtual rockets simulated simultaneously using a Python script. The reasonable tested range of area-drag coefficients were determined from OpenFOAM CFD simulations, while other parameters are for a reasonable model rocket flying under a F-15 Estes rocket motor. These simulated rockets were launched from 0km to 100km ASL, at increments of 5km, and simulated with area drag coefficients between 0cm^2 (Dragless) and 20.0cm^2 at increments of 4cm^2. A rocket was simulated for every pair in the product of these tests, totaling to 126 rockets. Since the direct altitude advantage seen in the apogee is not affected by the rocket’s drag and other characteristics, the launch relative apogee is explored in this lab.
Observations
 Figure 1: The Influence of The Area-Drag Coefficients on the Relationship Between Launch Altitude and Launch Relative Apogee
See raw data in lab report.
Figure 1: The Influence of The Area-Drag Coefficients on the Relationship Between Launch Altitude and Launch Relative Apogee
See raw data in lab report.
Analysis and Conclusion
From Figure 1, it is immediately apparent that the influences of increasing drag coefficients on the launch relative apogee become less prevalent as launch altitude increases. While the curves are difficult to characterize mathematically, they all seem to approach the curve formed by the 0cm^2 area-drag coefficient, which represents flight influenced by only thrust and gravity. Although the launch relative apogee does increase with launch altitude, this can be attributed to decreasing acceleration from gravity at higher altitudes.
It is also notable that, at low altitudes with constant increments of the area-drag coefficient, the launch relative apogee first drops rapidly, then slows. The specifics of this can be examined by plotting the relationship between the area-drag coefficient and the launch relative apogee, with series representing launch altitudes.
 Figure 2: Relationship Between The Area-Drag Coefficient and Launch Relative Apogee at Varying Launch Altitudes
More clearly than in Figure 1, launch relative apogees decrease quickly, but slow down, at low altitudes, in a shape similar to an exponential decay function. As altitude increases, the effect of this decay drastically decreases as aerodynamic forces become less important. At around 70km, aerodynamic forces become negligible, and the relationship becomes a horizontal line, analogous to the convergence of the curves in Figure 1. The slight offsets in the horizontal lines after 70km are analogous to the small slope at which gravitational acceleration affects apogee altitudes without atmospheric forces.
In conclusion, while aerodynamic optimizations can greatly benefit a rocket when flying in thicker areas of the atmosphere, those effects become weaker and less effective as altitude increases. At 40 km, the effects of aerodynamics are still slightly noticeable, but comparatively miniscule compared to the same optimizations at sea level. After around 70km, aerodynamic forces are almost negligible.
The Effect of Mass on the Relationship Between Launch Altitude and Launch Relative Apogee of a Model Rocket
Background Information and Purpose
As mass decreases, the change in velocity delta v increases as an inverse function when impulse is constant. At the same time, constant forces also generate more acceleration. When increased airspeeds are paired with lower inertia, the effects of aerodynamic forces are more prevalent, and lower mass rockets would intuitively benefit more from the reduction of drag through higher launch altitudes. The purpose of this lab is to conform and quantify these intuitions.
Variables
Manipulated
| Variable | Explanation |
|---|---|
| Dry mass m*_d* [g] | The mass of the rocket without any propellant. Dry masses will be tested from 150g to 350g at 50g intervals. |
| Launch Altitude ASL p*_z,0* [km] | The altitude ASL at which the rocket is launched. |
Note: Since two manipulated variables are being tested, data points will be collected across the products of the tested sets.
Responding
| Launch Relative Apogee p*_z,max - p_z,0*[km] | The maximum height the rocket achieves during its flight above its launch site. Found as apogee altitude (ASL) - launch altitude (ASL) |
Control
| Other Rocket Parameters | The rocket’s flight characteristics, including its aerodynamic properties, motor and dry mass, and motor thrust profile |
Hypothesis
As the rocket’s mass decreases, the rocket’s launch relative apogee will benefit more from increased launch altitudes, because lower inertia and higher velocity means that aerodynamic forces have a larger influence on the rocket’s trajectory.
Experimental Design
The experimental design consisted of multiple virtual rockets simulated simultaneously using a Python script. These simulated rockets were launched from 0km to 100km ASL, at increments of 5km, and simulated with dry masses between 150g and 350g at increments of 50g. A rocket was simulated for every pair in the product of these tests, totaling to 126 rockets. Since the direct altitude advantage seen in the apogee is not affected by the rocket’s mass, drag, and other characteristics, the launch relative apogee is explored in this lab.
Observations
 Figure 1: The Influence of Dry Mass on the Relationship Between Launch Altitude and Launch Relative Apogee
See raw data in lab report.
Analysis and Conclusion
From Figure 1, it can be seen that lower mass rockets consistently reach higher altitudes than higher mass rockets, because of the higher delta-v provided by the motor. However, to explore how dry mass influences how much a particular rocket benefits from higher launch altitudes, we can scale the data relative to each rocket’s apogee when launched from sea level.
 Figure 2: The Influence of Dry Mass on the Relationship Between the Percent Improvement of the Launch Relative Apogee and Launch Altitude
From Figure 2 it can be seen that, at 40km ASL, the rocket with a dry mass of 150g reaches a launch relative apogee 531% higher than when launched from sea level, while the 350g rocket only experiences a 75% advantage. It is important to note that although the 150g rocket reaches higher altitudes overall, Figure 2 shows altitudes relative to a sea level launch, and the overall higher apogees do not influence this result. In conclusion, this lab shows that lightweight rockets that usually are more significantly influenced by aerodynamic forces benefit more from the drag reduction introduced by a higher launch altitude.
Note: These have been summarized lab reports. For more detailed information, please refer to the full lab reports found at https://drive.google.com/drive/folders/1mOcebvbbNEJmpOokG0TAzTlIzIx2ylqw?usp=drive_link
Objective
To make the most from each flight without increasing the cost of the rocket, the project’s main focus will be on the optimization of the rocket’s structure and geometry to maximize apogee. From these feasibility studies, it can be concluded that increasing the launch altitude provides the greatest benefits to low mass, high thrust, and high speed, but draggy rockets. Concerning the optimizations, the influence of drag on the launch relative apogee is eventually outweighed by the effects of mass at higher altitudes and lower air densities. Therefore, the optimizer must not only optimize for drag, but also account for the influence of mass in the flight and apogee of the rocket.
Initial Design
Before optimization, a fundamental design that could be built upon was needed. For this, a parameterized rocket that supports the previously characterized objectives was designed. This design is very similar to a traditional model rocket, and incorporates much of my experience with traditional model rockets, but includes some modifications to accommodate its goals. Below, the main aerodynamically and structurally significant parts of the rocket, along with the traditional and more specialized engineering features, are explained.
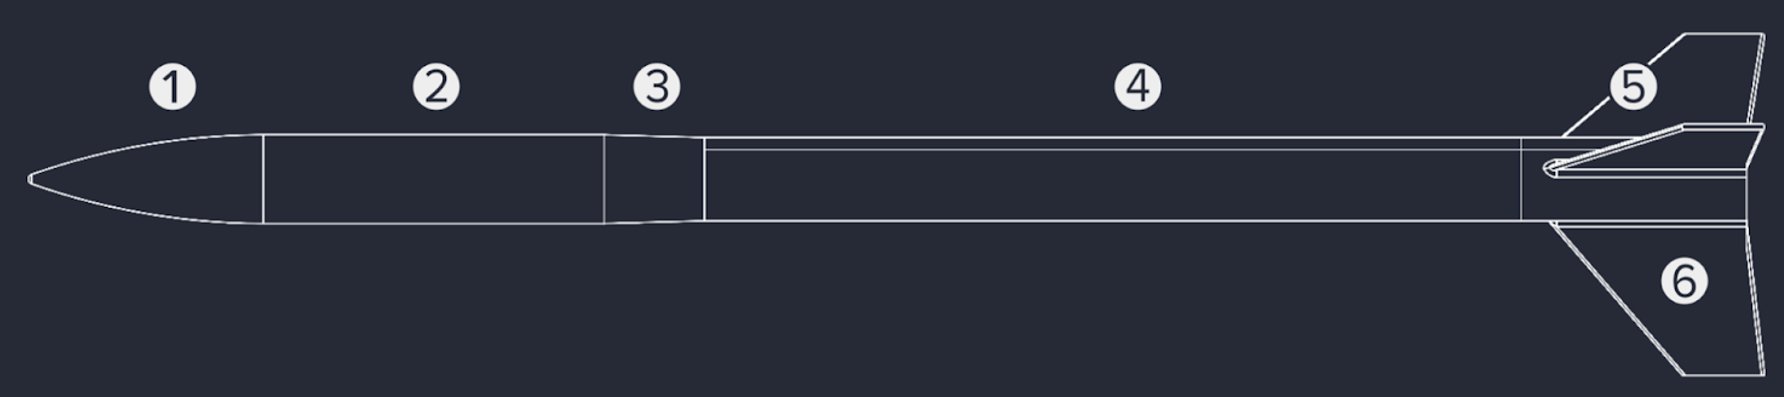
1. Nose Cone
In a traditional model rocket, the nose cone’s main purpose is to reduce pressure buildup and pressure drag by introducing a slope to what would be a flat aerodynamic surface. Similar to how a sharp needle can be pushed through foam smoother and with less force than a cylindrical rod of the same dimensions, a rocket with an optimized nosecone can move through air with less drag force. However, a longer nosecone does not necessarily mean higher altitude. The surface area of the nose cone is also a point of consideration, as more surface area increases drag along the skin of the rocket, known as skin or viscous drag. This is analogous to the increasing friction between the foam and the needle as more of the needle rubs against the foam. Additionally, a longer nosecone also increases mass, which, while less important in a traditional lower atmosphere model rocket, becomes a major factor when optimizing for flight in the upper atmosphere. For simplicity, an ogive nosecone, which is a nosecone formed by the revolution of a tangent arc, is used in all optimizations, although that may change on a later date.
Optimizable Parameters
| Length l [cm] | Since the nose cone is defined to be ogive, the only modifiable parameter is the length of the nosecone. |
2. Electronics Bay (Ebay)
The electronics bay houses the payload of the rocket, which, in this case, would be the electronics. Specifically, the electronics bay is designed to hold a Raspberry Pi Pico microcontroller, a GPSMV2 GPS module, a RP Pico 10-dof IMU shell, and a LoRa radio transceiver, although these specifics aren’t relevant to the main focus of this project. More importantly, the ebay’s contents determine the required size and volume of the housing, limiting the extent that pressure and skin drag can be optimized. Since the ebay’s dimensions are fully defined by its contents, no parameters can be optimized.
3. Transition
Because of the discrepancy between the sizes of the ebay and main body tube, a mitigating aerodynamic transition can be considered (The reason for the size discrepancy is explained later). In this case specifically, I’ve decided to use a Bézier curve to define the shape of the transition, as it provides flexibility in its tangency and length. Similar to the nose cone, the optimization must strike a balance between the smoothness of the transition, and its mass and surface area.
Optimizable Parameters
| Length l [cm] | The overall length of the transition |
| Forward Tangency a [dimensionless] | How tangent the transition is to the ebay, controlled by varying the position of the top handle of the Bézier curve. |
| Aft Tangency b [dimensionless] | How tangent the transition is to the main body tube, controlled by varying the position of the top handle of the Bézier curve. |
4. Main Body Tube
The main body tube houses the recovery devices, including the parachute, and also increases the distance between the fins and center of mass to maximize stability. The length of the main body tube also allows hot gasses from the explosive parachute ejection charge to cool, ensuring that the parachute doesn’t catch fire. Since both the body tube and ebay are cylindrical, they do not produce any pressure drag in straight flight. They do, however, experience friction drag, which is mitigated by narrowing the main body tube to reduce its SA, as it doesn’t require the same diameter as the ebay.
5. Fin Can
The fin can is the central structural element that supports and secures the fins and small, solid fueled rocket motor. As a result, it is also the structural element that generally handles the most intense forces, including the majority of aerodynamic forces in the rocket generated by the fins, and the relatively immense thrust force from the rocket motor.
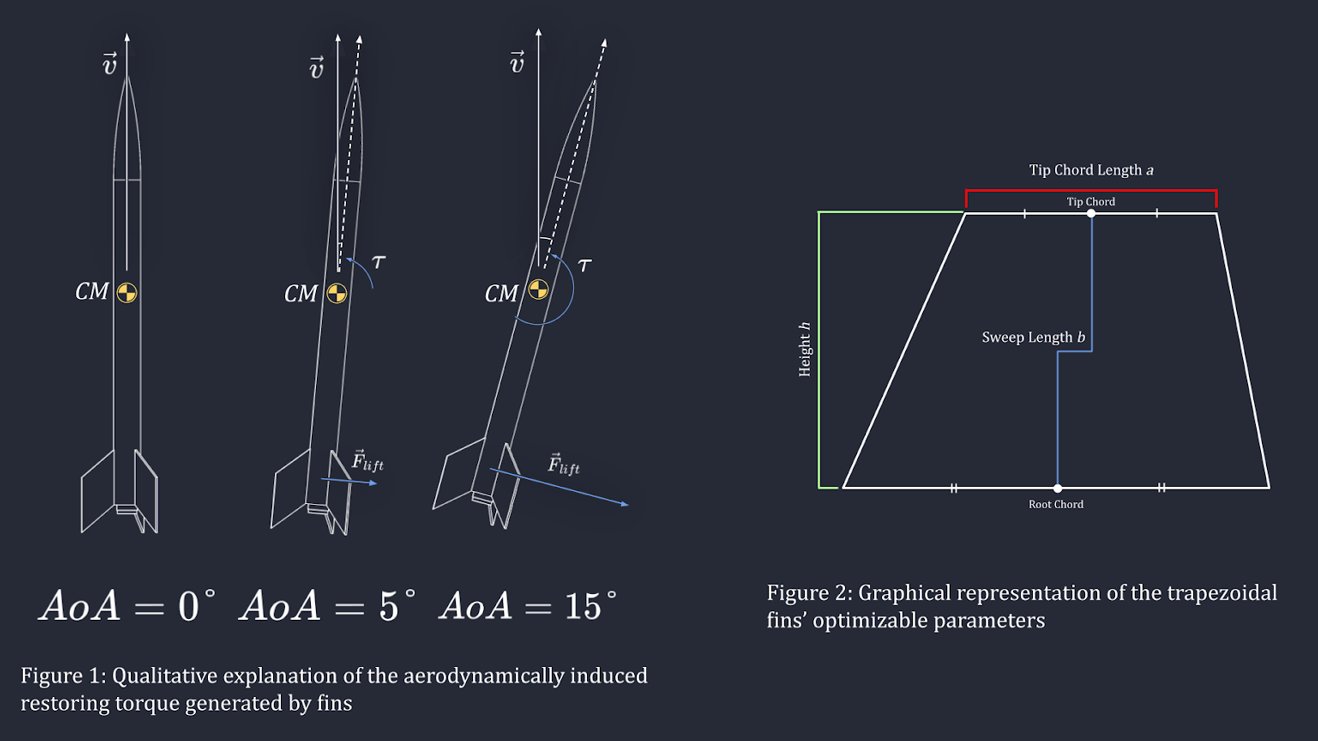
6. Fins
The fins are large aerodynamic surfaces that provide passive aerodynamic stabilization, to keep the rocket facing the direction of motion. As the angle between the airflow and the rocket’s centerline (Also known as angle of attack) increases, the fins generate a lift force that induces an opposing, restoring torque on the rocket, as seen in Figure 1.
While larger fins provide more stability, they also generate more pressure and viscous drag. The optimization must ensure that the rocket remains stable while maximizing the rocket’s apogee.
Optimizable Parameters
| Height h [cm] | The distance from the root to the tip chord of the fin. |
| Tip Chord a [cm] | The length of the tip chord. |
| Sweep Length b [cm] | The longitudinal offset at which the midpoints of the root and tip chords are offset. |
See Figure 2 for graphical representation
Prototype Optimizations
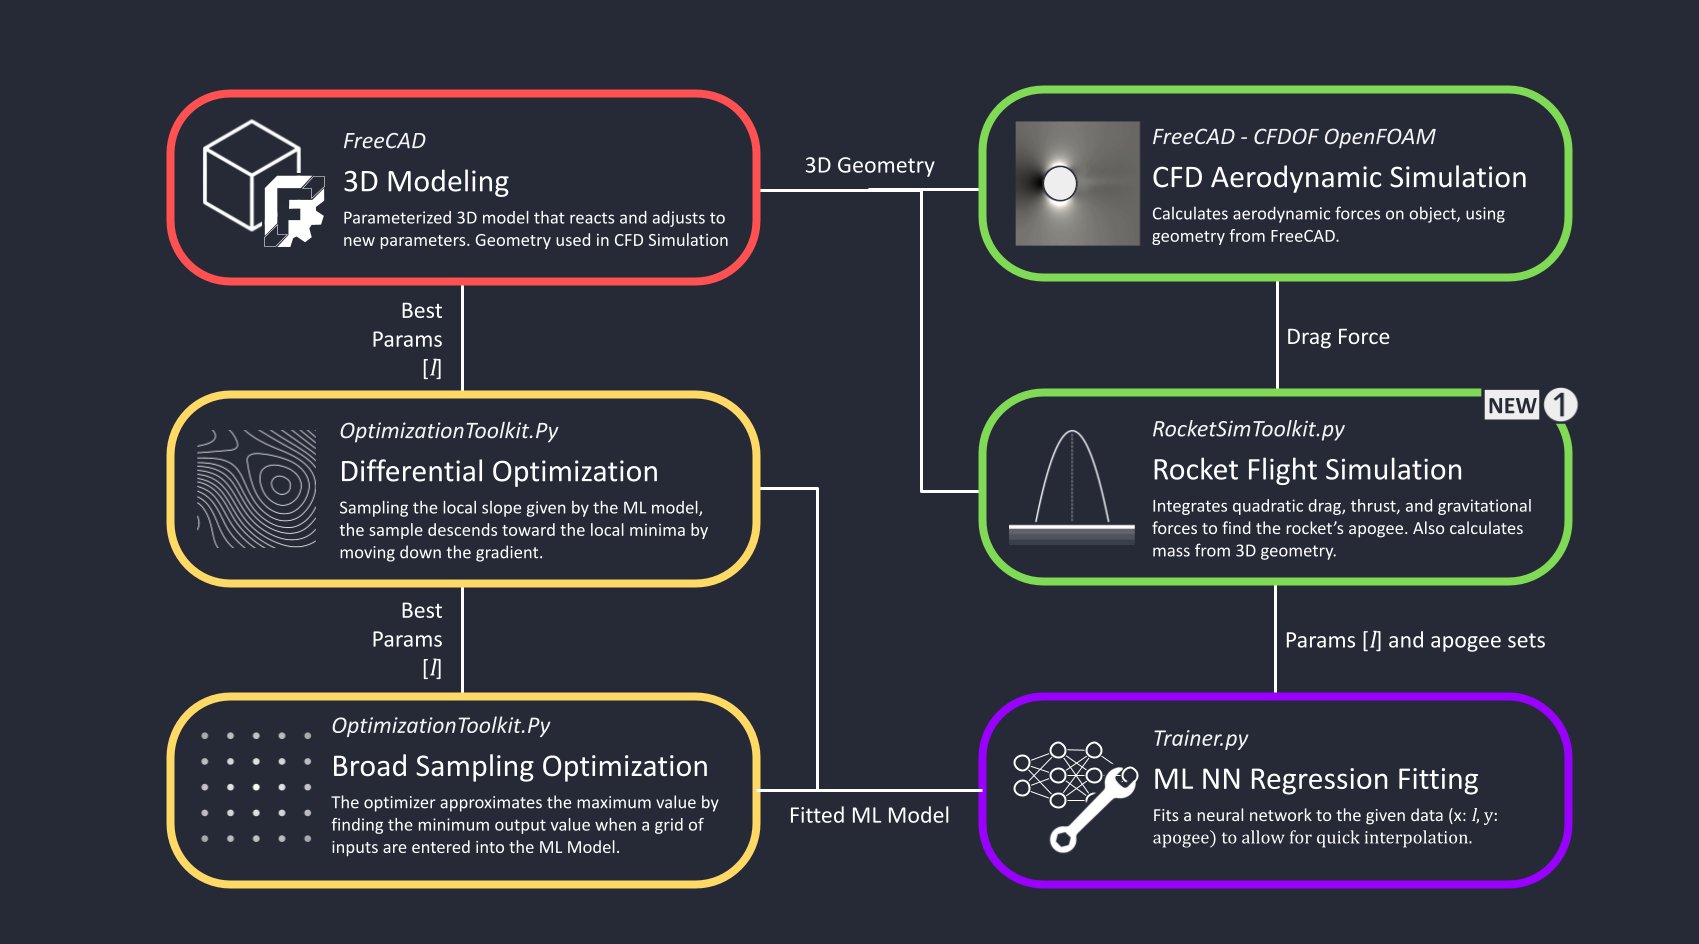
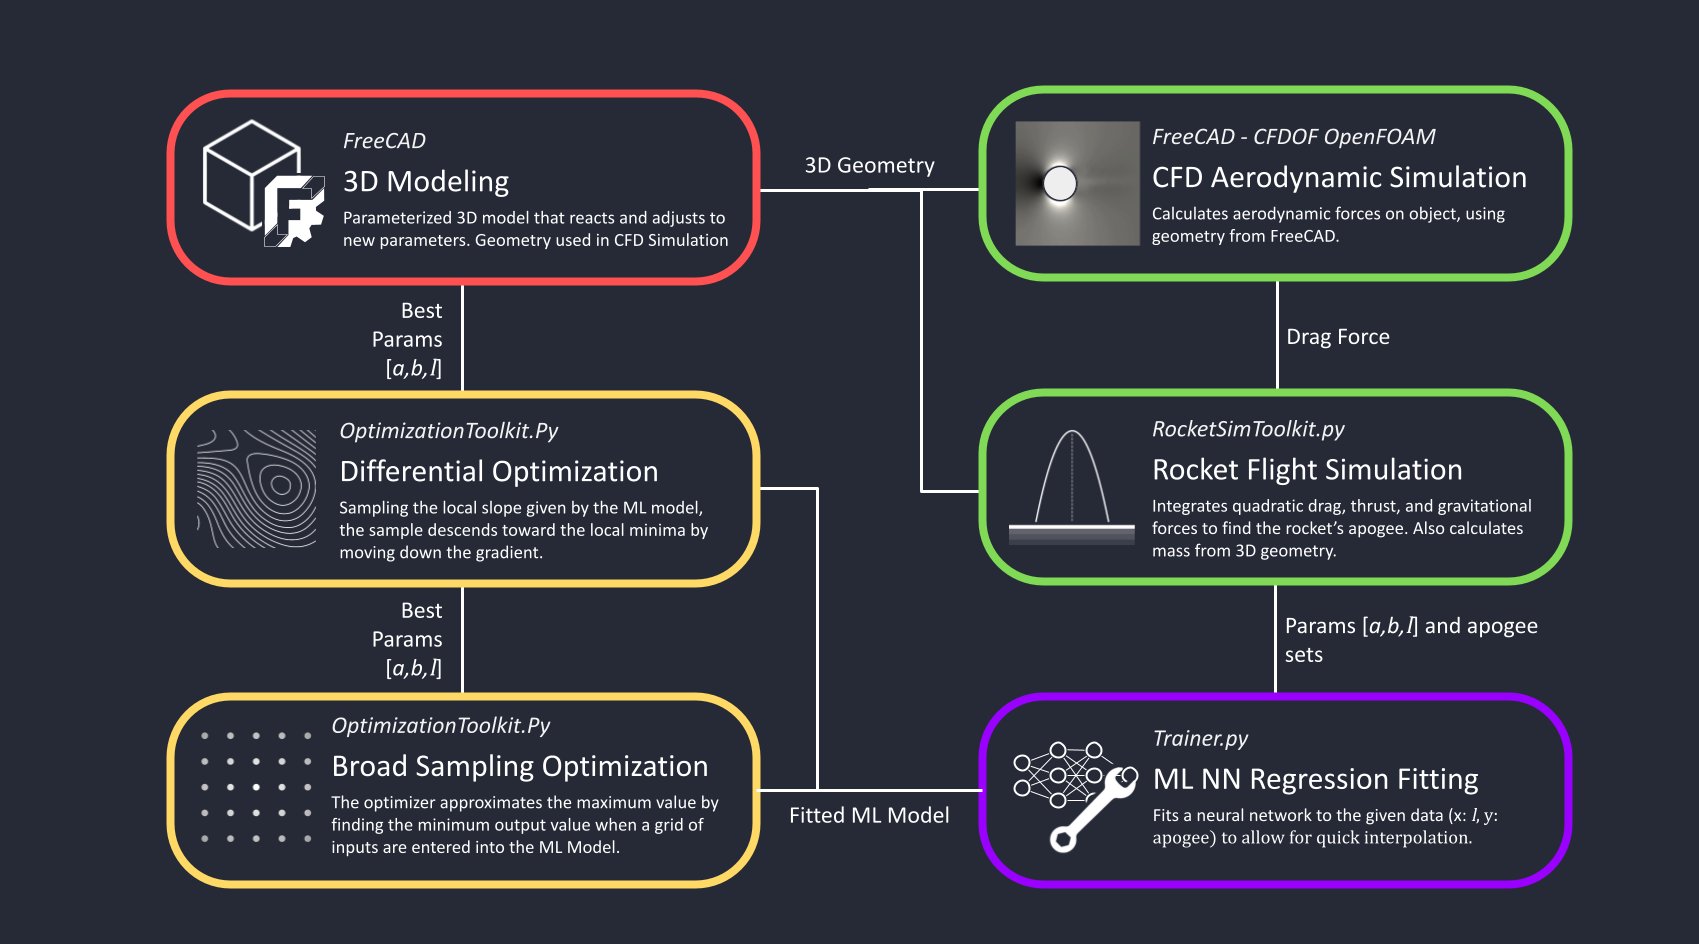
As the main focus of this project, I developed a flexible yet effective method to refine and optimize the shape and other characteristics of a rocket’s individual components, in order to maximize altitude as a whole. The final algorithm involved CFD (Computational Fluid Dynamics) aerodynamic simulations, an efficient rocket flight integrator and simulator, and a ML regression model that informs a gradient descent optimization algorithm. The development and purpose of the individual components are discussed in-depth below, following the many versions of the algorithm.
Existing Optimization Strategies
Before starting the development of my own optimization algorithm, I first looked into some existing methods for aerodynamic optimization.
Basic Evolutionary method
The evolutionary method stems from the biomimicry, but instead of mimicking solutions seen in nature, it instead mimics the process of mutation and natural selection itself. For this reason, it is sometimes known as a genetic algorithm optimization. Basic evolutionary optimization uses the same concept as Darwinian evolution, where the fittest of a set of mutations us used as a parent, or starting point, for the next generation (Biswas, 2022).
For this project, it is most relevant to look at the aerodynamic optimizations assisted by Computational Fluid Dynamics (CFD) simulations. CFD simulations simulate the flow of fluid, air in the case of aerodynamics, by computationally solving the Navier-Stokes equation over a fine lattice of “cells”, emulating the observed flow of fluids. From these simulations, aerodynamic forces, including lift and drag, can be extracted.
It is likely the most flexible approach detailed here, as it can be used to optimize for not just drag, but also turbulence, pressure, apogee, and other output parameters after the CFD aerodynamic simulation is processed. However, since so many samples are taken, and the computational power required for CFD simulations, it is impractical to run a full CFD driven evolutionary algorithm on a single computer, if at all.
Differential Evolutionary method
The differential evolutionary algorithm stems from calculus, specifically the first derivative test and the intermediate value theorem. At local and absolute minima and maxima, the derivative, or slope, of the curve must be zero. If the slope is currently at a non-zero value, it must pass every value between its current value and zero as it moves towards the local minima or maxima. When the initial value is sufficiently close to the maxima, the derivatives between the initial position and the maxima will stay between the initial slope and zero. As a result, we can find the closest local maxima by following the slope at a given point, analogous to a ball rolling down a hill.
This concept is used to find the maxima of a graph where the variable being optimized is plotted over the input parameters. Additional CFD simulations are only run to determine the derivative of the optimized variables at a sample point, and the sample point is then moved in the direction of the derivative. This method greatly reduces the computational power required to compared to basic evolution, while maintaining flexibility.
It is important to note that when the sample point is taken near a local maxima that is not the absolute maxima, it may find this local maxima without finding the actual optimal values.
Source: (Madavan, n.d.)
Adjoint Method
The adjoint method is a specialized CFD simulation, that generates the derivatives of the optimized variable over the derivatives of many parameters in a single CFD simulation, making it the most efficient method of optimization, and also capable of optimizing all points in a complex mesh (Hatton, 2023). However, the adjoint method traditionally only minimize drag, and is difficult to modify for optimizing other variables.
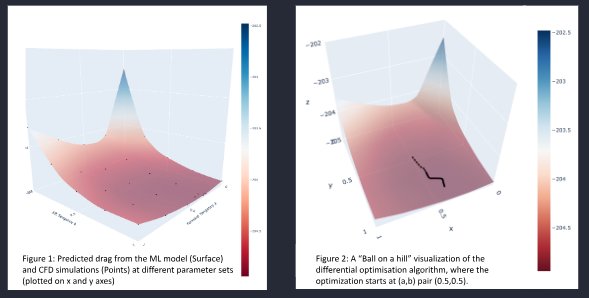
Optimization 1: Transition Toy Model
To start development of the algorithm, a simple “toy” model of the transition between the larger electrical bay (ebay) and main body tube was used as a sample dataset on which to build a prototype optimization model. For this optimization, the length of the transition was kept constant, while the two tangencies were adjusted, such that the results could be visualized in a 3D graph.
Variables
Manipulated
| Variable | Description |
|---|---|
| Forward Tangency a [dimensionless] | How tangent the transition is to the ebay, controlled by varying the position of the top handle of the Bézier curve. |
| Aft Tangency b [dimensionless] | How tangent the transition is to the main body tube, controlled by varying the position of the top handle of the Bézier curve. |
Responding / Optimized
| Drag [N] | Raw drag readings from the CFD simulation are minimized. |
Optimization Scheme
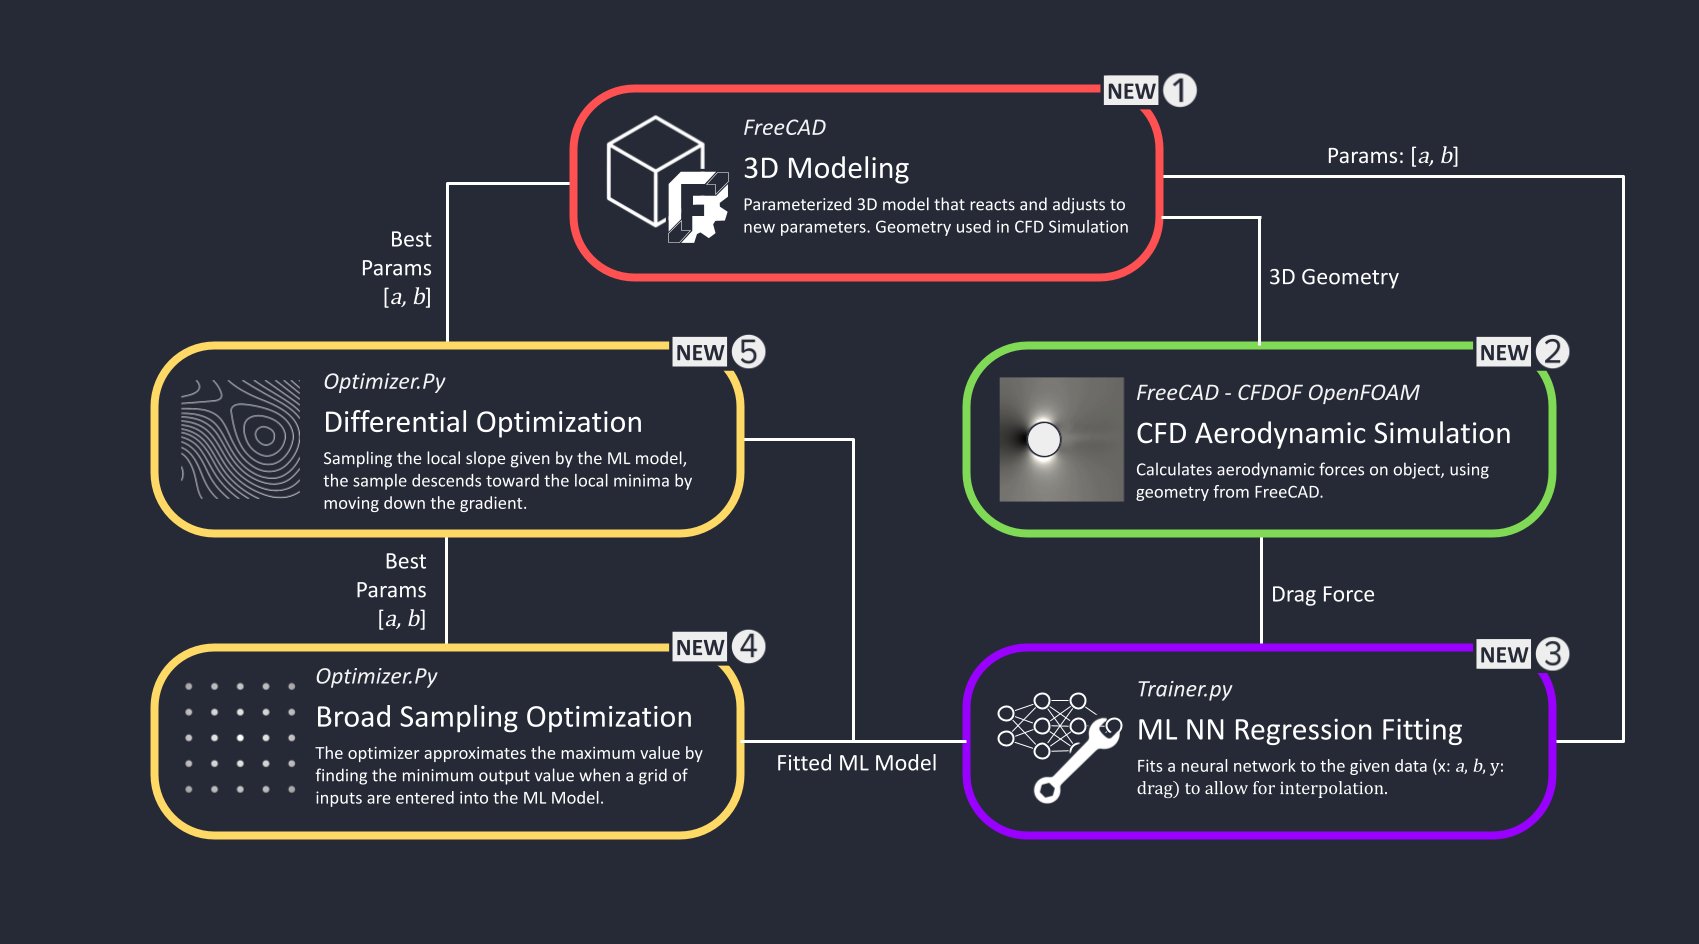
New Optimization Steps
1. 3D Modeling
The component is first modeled in FreeCAD, an open source 3D design software, to define its geometry before the next steps in optimization. This geometry is linked with parameters in a spreadsheet, simplifying the optimization.
2. OpenFOAM CFD Aerodynamic Simulation
Using geometry provided by FreeCAD, OpenFOAM computationally solves the Navier-Stokes equation for many small cells to, effectively simulating airflow around the required object, and determining aerodynamic forces. For later optimizations, the area-drag coefficient is determined from the drag force and relative airspeed.
3. ML NN Regression Fitting
For each of the following optimization algorithms, the optimized variable for various input parameter sets must be taken over a large set of samples. However, considering the computational power required for just one CFD simulation, it would be practically impossible to run a new CFD simulation for every sample requested by the optimizer. Instead, using the TensorFlow library, a neural network is trained to predict changes in the optimized variable (drag in this case) given a set of parameters. In the training process, the neural network, which can be thought of as a complex mathematical function in a blackbox, is regressed to the given data. This effectively creates a more computationally efficient proxy of the CFD simulation, and enable the rest of the optimization algorithms to take the required volume samples without unreasonable amounts of computational power.
Note that the model isn’t trained to predict the optimized variable directly, but instead its deltas, or differences, from their initial values. Through this trial, I noticed that direct predictions led to unpredictable and inaccurate fitting, as the drag force values were on very different orders of magnitude than the intake parameters. Instead, by predicting deltas, the output values stay within a reasonable range and fit efficiently.
4. Broad Sampling Optimization
A rough grid of samples are taken to find the approximate optimal parameters, to avoid the local traps mentioned in the explanation of differential evolution optimizations. However, because of the low resolution of the selected samples, a refinement is required.
5. Differential Optimization
Similar to how a traditional differential evolution optimization finds the maximum value, the differential optimization step takes approximate parameters from the broad sampling optimization, and follows the slope to find the optimal parameters. However, unlike the traditional algorithm, the ML model is instead used as a proxy for CFD simulations to reduce the computational power required.
After optimization, the optimal parameters are fed back into the start of the loop, such that all aspects of the optimization can further refine their predictions. When the predicted optimal parameters stop changing, it is concluded that the optimization has converged.
Results
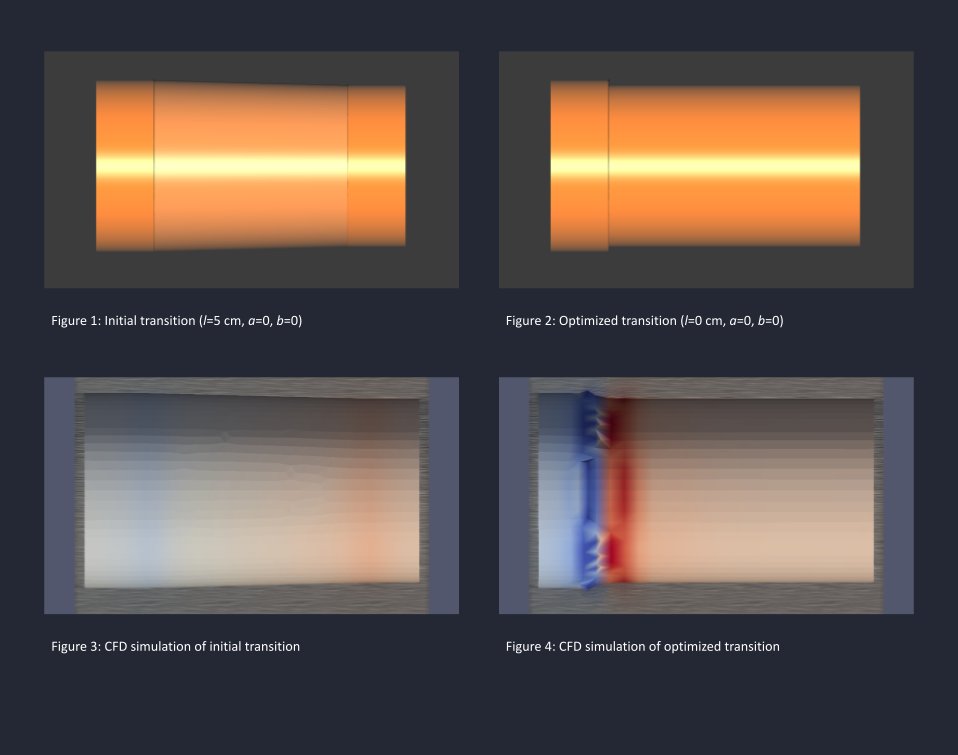
In 6 cycles, or iterations, of optimization, the optimizer converged on a smoothed, roughly conical transition, without very significant drag improvements. However, it did find that highly smoothed and reflex transitions generate a newton more drag at 100m/s. This optimization also served as an easily modifiable testbed to lay the groundwork for all five new optimization steps, especially the CFD simulations, ML regression, and differential optimization.
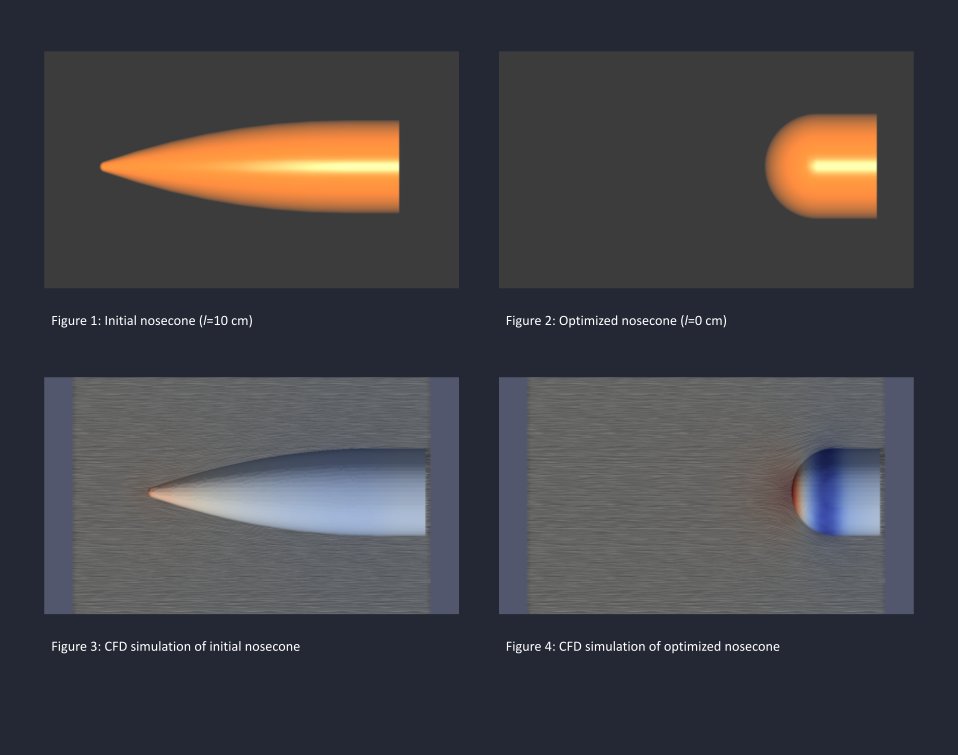
Optimization 2: Nose Cone
After the development of basic optimization functions, this is the first optimization that will be applied to the real rocket. This optimization will consider the effect of nose cone drag and mass on the rockets flight, and will have to strike a balance between the two to maximize altitude. This iteration of the optimization algorithm also comes with restructuring, generalization, and streamlining of the code to support future optimizations.
Variables
Manipulated
| Variable | Description |
|---|---|
| Nose cone length l [cm] | The length of the ogive nosecone, initially 10cm |
Responding / Optimized
| Apogee altitude | The max altitude the rocket achieves throughout its flight. This is found by simulating flights launched from 40km ASL using rocketSimToolkit.py, which was developed for this purpose, and is effected by the drag and mass of the nosecone. |
Optimization Scheme
New Optimization Steps
1. Rocket Flight Simulation
As seen in the feasibility studies, mass is also a significant factor in a rocket’s apogee, and becomes even more important as launch altitude increases. The self-developed python module RocketSimToolkit.py takes the mass and drag of the rocket into consideration, and finds the launch relative apogee given both of these parameters. This allows for the optimization of the ultimate goal, altitude performance, rather than mass or drag individually. For the specifics on how this module solves the differential equation for quadratic drag and other forces to determine the rocket’s apogee, see logbook entry February 13 for more detailed information on the specifics of the simulator.
In addition to RocketSimToolkit.py, all optimization methods have been packaged into OptimizationToolkit.py with significant improvements to generalization, interface and data recording. These libraries have also been moved to be more closely integrated with the rest of the CAD file structure, such that optimizations are directly applied to the 3D printed parts.
Results
In only two iterations, the optimizer converged on the shortest, spherical nosecone. As explained in the feasibility studies, drag forces become negligible as altitude increases, and the optimizer minimized mass to maximize altitude. As a result, this optimized rocket flew 270m higher than the original rocket with a 10cm long nose cone.
Aside from the higher altitude, this optimization also served as a test for the new RocketSimToolkit.py and OptimizationToolkit.py modules. These two modules are significantly more flexible than the older Optimzer.py script, which was rewritten case to case, allowing for a wider range of optimized parameters and outputs with less development time.
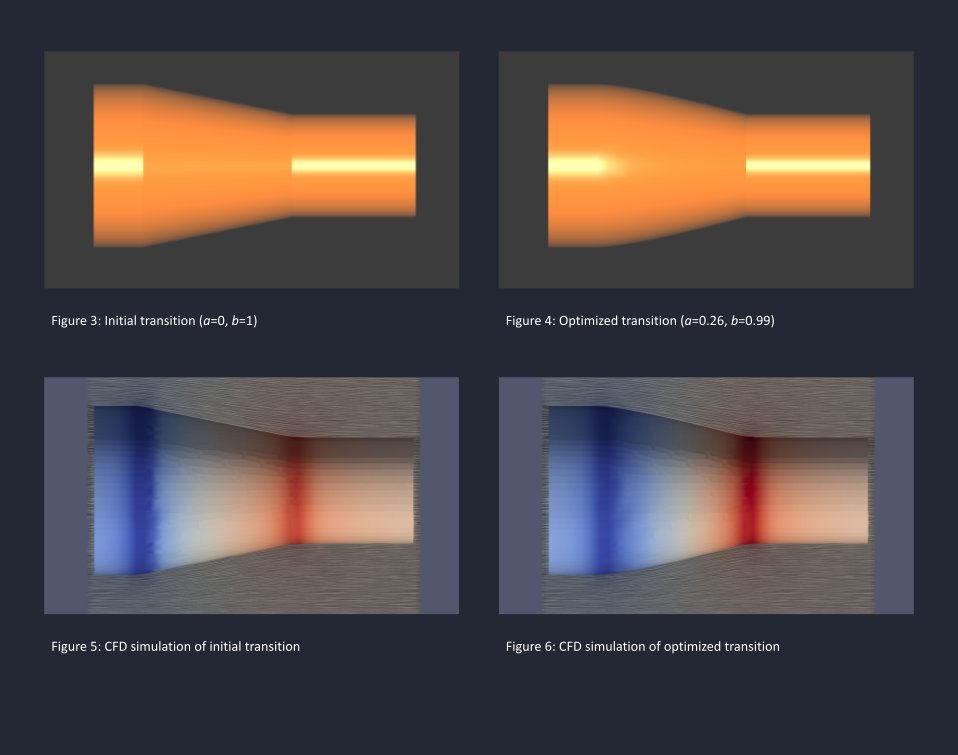
Optimization 3: Transition
This optimization is the most complex of the three optimizations completed so far, not just optimizing for all three parameters concerning the transition, but also maximizing apogee rather than minimizing drag. However, with the improved implementation of the optimization functions in optimization 2, the development and execution of this iteration was a lot more streamlined.
Variables
Manipulated
| Variable | Description |
|---|---|
| Length l [cm] | The overall length of the transition, initially 5cm. |
| Forward Tangency a [dimensionless] | How tangent the transition is to the ebay, controlled by varying the position of the top handle of the Bézier curve. |
| Aft Tangency b [dimensionless] | How tangent the transition is to the main body tube, controlled by varying the position of the top handle of the Bézier curve. |
Responding / Optimized
| Apogee altitude | The max altitude the rocket achieves throughout its flight. This is found by simulating flights launched from 40km ASL using rocketSimToolkit.py, which was developed for this purpose, and is effected by the drag and mass of the nosecone. |
Optimization Scheme
Results
In only two iterations, the optimizer converged on a sharp drop-off as the best transition shape. Again, as drag forces became negligible with the high altitude, and the optimizer minimized mass to maximize altitude. As a result, this optimized rocket flew 141m higher than the original rocket with a 5cm long conical transition.
Analysis
Through these optimizations, the rocket’s mass was reduced by 43g, and its apogee was increased 411.0m above the original launch relative apogee of 1062.5m. This substantial increase in performance didn’t come at the cost of more powerful motors or advanced materials, but simply changes in the rocket’s geometry. More importantly, this project yielded a flexible but effective optimization algorithm that can optimize almost any set of input parameters to maximize or minimize a specific flight characteristic, usually apogee.
Specific analyses can be found above for each of the preceding feasibility studies, and results for each optimization.
Conclusion
So far, this project has explored the feasibility of small, balloon launched rockets, identified the factors that influence the performance gain by this method, and created an optimization algorithm to maximize the performance for a rocket following this flight profile.
Optimizations to the rocket’s geometry has lead to a substantial 411 meter increase in altitude performance, without effecting payload or requiring higher performance components. More importantly, this project yielded a flexible but effective optimization algorithm that can optimize almost any set of input parameters to maximize or minimize a specific flight characteristic, usually apogee.
For filling the niche of low-cost, low payload near-space flights, this optimizer can maximize the altitude performance of a vehicle, while keeping the launch cost low. This keeps this solution competitive, while making the most of a limited budget.
Next Steps
Fin Optimization - Short Term
With this flexible optimization algorithm in place, I plan to optimize the parameters for fin size and shape, as mentioned in the Initial Design section. At higher altitudes, lower air density means that the rocket, as a whole, experiences less drag, but also means that the fins produce less restoring torque. As a result, these fins have to be specifically optimized to provide stability in these thin atmospheric conditions, which likely means very large fins. However, larger fins also generate more drag, and weigh more, lowering the launch relative apogee. Therefore, this optimization will look at maximizing the rocket’s altitude, while ensuring that the rocket remains stable throughout flight.
Ground Test Flight - Short Term
Following the fin optimization and the finalization of the rocket’s design, I plan to conduct a ground-launched test flight to ensure the stability and structural integrity of the rocket, and also test the functionality of the electronics. While the structural and electronic design of the were not covered in this writeup, I’ve been developing them in parallel with the optimizations, and the construction of the rocket should not be a significantly lengthy process.

Balloon Launched Test Flight - Long Term
All the work I’ve done in this project are are aimed toward this ultimate goal, of flying a full prototype of the system. Aside from aerodynamic optimizations, I’ve also purchased suitable weather balloons, and I’m in the process of developing a telemetry system capable of transmitting over such vast distances. Additionally, I’ve been in contact with Transport Canada and ISED Canada to ensure safety in the operation of such a system. However, due to the difficulties and time required to develop a full system, along with the complexities of the safety situation, this will likely have to wait until a future project.
Flexible, Automated Optimization - Long Term
Currently, each optimization only modifies a few parameters, because the bottleneck of me, a person, having to shuttle CFD data and requested samples between different software. If this process could be automated, I’d be possible not only to optimize more parameters, but possibly the coordinates of every point in a mesh, leading to more intricate and optimized geometries.
Applications
As mentioned in the Background Research section, near-space and suborbital flight offers an unique suite of experimental conditions, including reduced atmospheric pressure and obscuration, access to the upper layers of the atmosphere, and microgravity. Applications will be considered for a balloon-launched rocket more capable than the one designed in this project, but still out of the range of professional sounding rockets.
Frequent Microgravity Access - Protein Crystallization and Optics Manufacturing
Despite significantly lower cost, a simple balloon-assisted rocket can still provide a microgravity environment, with 16 seconds of high quality microgravity <1×10^-3 gs of acceleration, and up to a minute of slightly lower quality <5×10^-2 gs acceleration. With specialized methods, the lower cost barrier may allow the higher quality preparation and more detailed analysis of many other proteins, like Ribonuclease A.
Additionally, there has been growing interest in the integration of heavy metal oxides into glass mixtures to satisfy the specific requirements required for specialized optics, including optic fibers (Mahalakshmi et al., 2022). However, some of these glass mixtures cannot be solidified under a gravitational force, as the suspended particles would fall out of solution. Instead, balloon-assisted rocket flights could potentially be used in both the development and manufacture of these specialized glasses.
Space-like Conditions - Smallsat development
With the increasing miniaturization of technology, smallsats and cubesats have become increasingly common not just for amateur missions, but also for professional applications like Canada’s WildFireSat satellites. Low cost, near space flights could provide an opportunity to calibrate control systems in microgravity, tune and test specific sensors, and test vacuum-specific systems, overall increasing the rate and accuracy of design iterations.
Frequent Mesospheric Access - Meteor Vapour Analysis, Mesospheric Meteorology, and Potential Lower Mesospheric Microbiology
The mesosphere is a layer of the middle atmosphere between the stratosphere and ionosphere, extending from approximately 50km to 80km ASL. Its air density means that it is inaccessible to high altitude balloons, but also creates too much drag for orbital spacecraft, meaning that, currently, the only method to access the mesosphere is through the use of a sounding rocket. As a result, it is often considered the most inaccessible and least understood layer of the atmosphere, and sometimes humorously known as the “ignorisphere” (National Geographic, 2024). At the same time, it is also a very dynamic layer of the atmosphere.
The mesosphere is the main layer at which meteors burn up during atmospheric entry, depositing their constituent elements as vapours in the mesosphere. By collecting and analysing mesospheric air samples over a large number of flights, which might be more feasible with this method, it might be possible to better understand the composition of the meteoroids and interplanetary material that is scattered throughout the solar system. (Royal Belgian Institute for Space Aeronomy, 2026)
Additionally, the mesosphere is of meteorological interest, as it is the site of high energy oscillations caused by buoyancy known as gravity waves. These waves carry enough energy to power chemical processes, and, alongside their temperature differences, effect the meteorological conditions of the mesosphere and adjacent layers of atmosphere. Currently, the main method to study these phenomena is through the luminescence of the upper atmosphere known as airglow, but affordable, frequent launches provided by balloon-assisted could potentially allow more precise and detailed measurements of mesospheric processes.
Despite the relative lack of nutrients, the thinner atmosphere, very low temperatures, and exposure to UV radiation, microscopic life has been detected to continue surviving suspended across the lower and middle layers of the atmosphere. Through aircraft and balloon flights, microbes were sampled and collected from altitudes as high as the stratosphere (NASA Astrobiology, 2018). However, since neither of these methods would be able to sample for life in the mesosphere because of the low air density, and costs from frequent sounding rocket flights would add up quickly, balloon-assisted sounding rockets could potentially be used instead. Understanding microscopic life in environments as extreme as the stratosphere and mesosphere, which can sometimes reach -170°C, might provide insight into how life could survive on other planets.
Additional Resources
For more detailed, but less structured information regarding my project, please refer to my logbook below. Additionally, mathematical explanations, which are difficult to move into this platform, are also included in the logbook.
Throughout this project, I’ve also put a lot of work into the engineering and electronic aspects of the project, but did not focus on it here. If you want to see this work, along with the code for my optimization and rocket simulation toolkits, please visit the project drive folder at https://drive.google.com/drive/folders/1jM7oPU3L6TlyJj3w4EcKyULnz27t1s0_?usp=sharing.
No generative AI was used in the writing of this online platform.
Citations
Adkins, J. (2023, September 22). Sounding Rockets Overview - NASA. NASA. https://www.nasa.gov/soundingrockets/overview/
Bathurst\, M. (2025\, June 25). USC Student Rocket Group Shatters International Amateur Space Record - USC Viterbi | School of Engineering. USC Viterbi | School of Engineering. https://viterbischool.usc.edu/news/2024/11/usc-student-rocket-group-shatters-international-amateur-space-record/
Biswas, P. (2022, November 15). Genetic Algorithm — An Optimization Approach. Medium; TDS Archive. https://medium.com/data-science/genetic-algorithm-an-optimization- approach-dd60e23261e6
Blue Origin. (2021). New Shepard | Blue Origin. Blue Origin. https://www.blueorigin.com/new-shepard
Blue Origin. (2025). Payloads | Blue Origin. Blue Origin. https://www.blueorigin.com/new-shepard/payloads
Canadian Space Agency. (2022). Zero pressure balloon and meteorological balloon – A comparative table. Canadian Space Agency. https://www.asc- csa.gc.ca/eng/sciences/balloons/comparative-table-zero-pressure-and-meteorological-balloons.asp
Dataintelo\, & Sharma\, R. (2024a\, October 19). Space Rocket Suborbital Launch Market Report | Global Forecast From 2025 To 2033. Dataintelo.com. https://dataintelo.com/report/space-rocket-suborbital-launch-market
Durkin, E. (2018, December 13). Virgin Galactic launches SpaceShipTwo to the edge of space. The Guardian; The Guardian. https://www.theguardian.com/science/2018/dec/13/virgin- galactic-spaceshiptwo-launch-california-edge-of-space ESA. (2023, April 25). Sounding Rocket - SciSpacE. Science in Space Enviroment. https://scispace.esa.int/scispace-platforms/sounding-rocket/
Estes Rockets. (2023). Pro Series IITM So Long Rocket Kit - Estes Highest Flying Model | Estes Rockets. Estes Rockets. https://estesrockets.com/products/so-long? _pos=1&_fid=b386fb8bb&_ss=c
Estes Rockets. (2024). Estes E12-8 Engines - Long Delay Rocket Motors for Upper Stage Flights | Estes Rockets. Estes Rockets. https://estesrockets.com/products/e12-8-engines
Estes Rockets. (2025). MayhemTM Model Rocket Kit – Two-Stage Rocket for Advanced Rocketeers | Estes Rockets. Estes Rockets. https://estesrockets.com/products/mayhem? _pos=7&_sid=e5d375fed&_ss=r
Hall, N. (2021a, March 13). Earth Atmosphere Model - Metric Units. Nasa.gov. https://www.grc.nasa.gov/www/k-12/airplane/atmosmet.html
Hall, N. (2021b, March 13). Earth Atmosphere Model - Metric Units. Nasa.gov. https://www.grc.nasa.gov/www/k-12/airplane/atmosmet.html
Hatton, G. (2023, March 22). What is the Adjoint Method in CFD? - ENGYS. ENGYS. https://engys.com/blog/what-is-the-adjoint-method-in-cfd/
Kaymont. (2024). HAB-600. Kaymontconsolidated. https://www.kaymont.com/product-page/hab-600?_gl=1*sqskju*_up*MQ..*_gs*MQ..&gclid=Cj0KCQjw0NPGBhCDARIsAGAzpp2- NIFaLRknPegYzpQ8yImDxPFy27Uq00u2_o1zCDmvvSknRthGic0aAq6GEALw_wcB&gbraid=0AAAAADEKZLkX_Qvk06vizQVV4R9FQyhD8
L. Sjölin, Wlodawer, A., G. Bergqvist, Holm, P., Löth, K., H. Malmström, J. Zaar, Svensson, L. A., & Gilliland, G. L. (1991). Protein crystal growth of Ribonuclease A and Pancreatic Trypsin Inhibitor aboard the MASER 3 rocket. Journal of Crystal Growth, 110(1-2), 322–332. https://doi.org/10.1016/0022-0248(91)90902-h
MacLellan, K., Farrell, S., Suleiman, F., Law, Z., & Balintec, V. (2025, April 14). Blue Origin’s New Shepard rocket launch and landing - as it happened. Reuters. https://www.reuters.com/world/us/live-blue-origin-new-shepard-rocket-launch-2025-04-14/
Madavan, N. (n.d.). On Improving Efficiency of Differential Evolution for Aerodynamic Shape Optimization Applications. Retrieved March 2, 2026, from https://ntrs.nasa.gov/api/citations/20040152066/downloads/20040152066.pdf
Magellan Aerospace. (2024, October 25). Black Brant - Magellan Aerospace. Magellan Aerospace. https://magellan.aero/product/rockets/black-brant/
McPherson, A., & DeLucas, L. J. (2015). Microgravity protein crystallization. Npj Microgravity, 1(1). https://doi.org/10.1038/npjmgrav.2015.10
NASA. (n.d.). Improved Orion Launch Vehicle (30.XXX). https://sites.wff.nasa.gov/code810/vehicles/Improved_Orion.pdf
NASA. (2015, July 13). Types of Scientific Balloons - NASA. NASA. https://www.nasa.gov/scientificballoons/types-of-balloons/
NASA Glenn Research Center. (2025\, July 7). Model Rockets | Glenn Research Center | NASA. Glenn Research Center | NASA. https://www1.grc.nasa.gov/beginners-guide-to- aeronautics/model-rockets/
NASA’s Wallops Flight Facility. (2024). A chart of the various types of sounding rocket types launched by NASA. [Online Image]. In https://www.nasa.gov/soundingrockets/vehicles/. https://www.nasa.gov/wp-content/uploads/2023/03/soundingrocketchart-lowres.jpg?resize=900,530
National Weather Service. (2025). Education Corner weather balloon. Weather.gov. https://www.weather.gov/gjt/education_corner_balloon
Reddit Users. (2024). Amateur Rocketry World-record (470,000 ft / 143 km). Reddit.com. https://www.reddit.com/r/space/comments/1gsg5ys/amateur_rocketry_worldrecord_470000_ft_143_km/
Rhyne, R., Munning, J., & Henry, R. (1972). WIND VELOCITY PROFILES MEASURED BY THE SMOKE-TRAIL METHOD AT WALLOPS ISLAND, VIRGINIA, 1965 THOUGH 1969. https://ntrs.nasa.gov/api/citations/19720021986/downloads/19720021986.pdf Shepherd, M. (2025, April 14). How High Did Blue Origin New Shepard Really Go? Forbes. https://www.forbes.com/sites/marshallshepherd/2025/04/14/how-high-did-blue-origin-new- shepard-really-go/
Space Exploration Stack Exchange. (2017). Using large orbital launchers as sounding rockets. What are the opportunities and challenges? Space Exploration Stack Exchange. https://space.stackexchange.com/questions/19748/using-large-orbital-launchers-as-sounding-rockets-what-are-the-opportunities-an
SSC Space. (2018, December). MASER Rocket Program. SSC Space. https://www.sscspace.com/wp-content/uploads/2018/12/MASER.pdf
Stern, S. A., Slater, D., Cash, W., Wilkinson, E., Green, J., & Gladstone, R. (1995). Rocket FUV observations of the Io plasma torus during the Shoemaker‐Levy/9 impacts. Geophysical Research Letters, 22(13), 1837–1840. https://doi.org/10.1029/95gl01899
StratoStar. (2025\, April 22). Meet StratoStar High-Altitude Weather Balloons | STEM Project Learning. StratoStar. https://stratostar.com/space/
USC Rocket Propulsion Laboratory. (2024, November 20). Aftershock. Aftershock II - USCRPL. https://www.uscrpl.com/aftershock-ii
Vasco, N. (2025, June 12). Why Is Helium So Expensive? WestAir. https://westairgases.com/blog/why-is-helium-expensive/
Wade, M. (2017a). Improved Orion. Astronautix.com. http://www.astronautix.com/i/improvedorion.html
Wade, M. (2019a). Black Brant I. Astronautix.com. http://www.astronautix.com/b/blackbranti.html
Wade, M. (2019b). Black Brant XII. Astronautix.com. http://www.astronautix.com/b/blackbrantxii.html
Wade, M. (2019c). Improved Orion engine. Astronautix.com. http://www.astronautix.com/i/improvedorionengine.html
Wikipedia Contributors. (2004, December 22). suborbital, air-launched spaceplane. Wikipedia.org; Wikimedia Foundation, Inc. https://en.wikipedia.org/wiki/SpaceShipTwo
Wikipedia Contributors. (2006, August 11). suborbital rocket developed by Blue Origin. Wikipedia.org; Wikimedia Foundation, Inc. https://en.wikipedia.org/wiki/New_Shepard
Wikipedia Contributors. (2018, February 23). a spaceflight company working on catapult technology to move payloads to space. Wikipedia.org; Wikimedia Foundation, Inc. https://en.wikipedia.org/wiki/SpinLaunch#cite_note-business_profile-17
Wikipedia Contributors. (2024). X-ray crystallography - Wikipedia. Wikipedia.org. https://en.wikipedia.org/wiki/X-ray_crystallography
Wikipedia contributors. (2013, April 23). Nike Smoke - Wikipedia. Wikipedia.org; Wikimedia Foundation, Inc. https://en.wikipedia.org/wiki/Nike_Smoke#cite_note-:0-2
Acknowledgement
Countless people helped me throughout this project, both directly and indirectly. In particular, I’d like to thank
- My parents, for their dedication and continuous support throughout all my scientific endeavors.
- The staff and students at the FISE United Space School in Houston, for providing an environment where I could develop my skills, and inspiring to pursue this project. In particular, I’d like to thank NASA engineer and HUNCH Design & Prototype Project Manager Glenn Johnson for his support and encouragement during and after my time in Houston.
- My Science 10 H teacher Mr. Stewart, for providing me with advice regarding my project from an engineer’s perspective.
- David Goulding, for introducing me to the fundamentals and applications of Calculus, and sparking my interest in this field of mathematics. My deeper exploration and used extensive use of calculus in this project were a direct result of his classes.
- Brent McNiven, a HAM radio operator, for sharing his knowledge and experience with radio communications with me. While these communications systems aren’t covered in this writeup, as it focuses on aerodynamic optimization, his help has been invaluable in my parallel development of the other subsystems in this project.
- ISED Canada and Transport Canada, for their ongoing work to ensure the safety of a future test flight.
And finally, I’d like to thank you for your interest in my project!