
Pixels to Predictions: Machine Learning Phenotypic Clustering of Hypertrophic Cardiomyopathy
Grade 12
Presentation
Problem
Hypertrophic cardiomyopathy (HCM) is recognized as the most common genetic cardiac disorder, affecting approximately 1 in 500 individuals globally. It is primarily characterized by abnormal thickening of the heart muscle, predominantly involving the left ventricle (LV). This hypertrophy can lead to a range of severe clinical manifestations, including obstruction of blood flow from the heart, heart failure, and potentially life-threatening cardiac arrhythmias. Although sudden cardiac death (SCD) occurs in fewer than 1% of HCM cases, accurately identifying patients at elevated risk remains critically important for effective management and prevention.
Currently, risk stratification for adverse outcomes in HCM patients heavily relies on conventional methods, such as the American Heart Association hypertrophic cardiomyopathy sudden cardiac death risk score (AHA HCM Risk-SCD). This scoring system employs a manual, subjective assessment based on a two-dimensional measurement of maximal left ventricular wall thickness derived primarily from echocardiography or cardiac magnetic resonance imaging (CMR). However, multiple studies have highlighted substantial limitations inherent to this approach, citing significant inter-observer variability, measurement inaccuracies, and consequently, unreliable predictions of clinical outcomes. This underscores a critical gap in clinical practice, indicating the necessity for more precise and reproducible methodologies for evaluating the structural cardiac alterations associated with HCM, ultimately aiming for improved accuracy in patient risk assessment and management. This brings me to the question I hope to answer in this study: How can machine learning be employed to improve risk stratification for HCM patients?
Method
For this project, I will create an approach that will work to improve risk stratification metrics used currently for HCM. By combining three-dimensional (3D) cardiac shape modelling with unsupervised machine learning algorithms, my approach replaces the crude single-segment thickness measurements of hypertrophic cardiomyopathy (HCM) with a detailed representation of left ventricular (LV) hypertrophy. Specifically, extracting hundreds of regional thickness values from 3D mesh models captures subtle variations that conventional 2D assessments overlook. Clustering these multidimensional thickness profiles then unmasks phenotypic groups within HCM, allowing more precise classification of high-risk patients. In doing so, the method directly addresses the limitations of subjective, single-value wall thickness measures, providing a more objective and comprehensive risk stratification framework.
To achieve this goal with my innovation, the project was split into various stages: 1. Study Cohort
The cohort analyzed in this study comprised 405 adult patients diagnosed with hypertrophic cardiomyopathy (HCM), all of whom were in the Cardiovascular Imaging Registry of Calgary (CIROC). CIROC is a comprehensive, prospective clinical registry established by the Libin Cardiovascular Institute, University of Calgary, designed to collect demographic, clinical, and cardiac imaging data from patients undergoing cardiovascular assessment. The cohort used for this project was rigorously selected to include only adult patients with an established diagnosis of HCM, confirmed through standardized cardiac magnetic resonance imaging (CMR) protocols. Additionally, to ensure the consistency, validity, and interpretability of the imaging data, strict exclusion criteria were employed. Specifically, patients with a history of previous surgical interventions such as myectomy, alcohol septal ablation, coronary artery bypass grafting (CABG), significant valve surgeries, or those with documented obstructive coronary artery disease were excluded from the study. Further, participants with incomplete CMR datasets or inadequate image quality hindering accurate segmentation and regional wall-thickness modelling were also excluded.
Baseline clinical assessments at the time of enrollment involved comprehensive patient profiling, including detailed medical history, symptomatic assessment (evaluated by New York Heart Association [NYHA] functional classification), demographic information such as age and sex, as well as clinical questionnaires capturing cardiovascular risk factors relevant to adverse clinical outcomes. Long-term clinical follow-up was also conducted for all enrolled patients to record clinical outcomes and assess the prognostic significance of phenotypic clusters identified through subsequent analyses. The primary composite clinical endpoint for evaluating prognosis encompassed clinically meaningful adverse cardiac events, including all-cause mortality, hospitalization for heart failure, documented ventricular arrhythmias, appropriate implantable cardioverter-defibrillator (ICD) therapy, new-onset atrial fibrillation, and survival following sudden cardiac arrest. Patients were systematically followed over a median period of 4.5 years, providing robust clinical outcome data necessary for meaningful association analyses between patient phenotypes and clinical prognosis.
2. Cardiac Imaging Data Processing: The imaging dataset utilized in this study was systematically generated through a rigorous, multi-stage image processing pipeline, beginning with standardized cardiac magnetic resonance imaging (CMR) acquisition. All enrolled patients underwent comprehensive CMR imaging using standardized imaging protocols. Specifically, high-resolution two-dimensional (2D) cine imaging was performed across multiple standardized cardiac imaging planes—including the short-axis (SAX), two-chamber (2Ch), three-chamber (3Ch), and four-chamber (4Ch) views—to provide detailed visualization of cardiac morphology and function. Late gadolinium enhancement (LGE) imaging was concurrently acquired to quantify myocardial fibrosis and scar tissue, a critical marker of cardiac pathology in hypertrophic cardiomyopathy (HCM). Following the acquisition, all CMR images were transferred securely onto a centralized cloud-based image management platform using a customized OHIF image viewer (version 2.0). On this platform, segmentation of left ventricular (LV) myocardial boundaries was conducted by myself and other students. We semi-manually delineated both the endocardial and epicardial contours at the end-diastolic phase (the cardiac cycle phase characterized by maximal ventricular relaxation and filling). Segmentation was systematically performed across all acquired imaging planes (SAX, 2Ch, 3Ch, and 4Ch views), thereby ensuring comprehensive and accurate delineation of myocardial boundaries from apex to base.
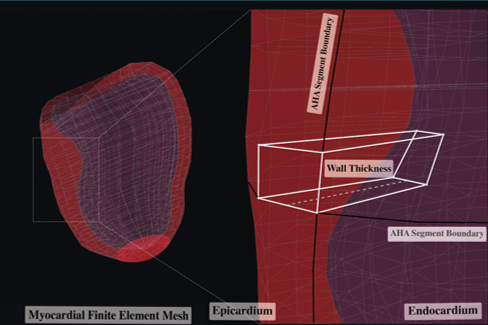
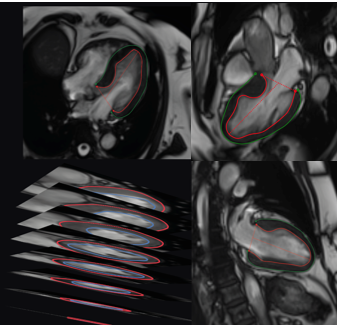 The segmented myocardial contours served as foundational input data for constructing patient-specific three-dimensional (3D) LV mesh models, employing advanced computational algorithms developed internally by a PhD student, Rylan Marianchuk. These algorithms integrated the manually segmented myocardial boundaries from multiple imaging views, resulting in detailed, structured 3D geometric representations of each patient's left ventricular myocardium. Each LV mesh was systematically partitioned into 456 hexahedral elements, which were evenly distributed across the myocardium from the base to the apex, maintaining precise spatial correspondence across patients and thereby enhancing inter-subject comparability.
Lastly, regional myocardial wall thickness measurements were automatically extracted for each of the 456 mesh elements, calculated as the shortest perpendicular distance between corresponding points on the endocardial and epicardial surfaces. These measurements provided highly granular, localized assessments of myocardial thickness variations, thus capturing detailed regional patterns of hypertrophy that are crucial in phenotyping HCM patients. The complete set of regional thickness measurements for each patient was then organized into structured, multidimensional numeric arrays.
The segmented myocardial contours served as foundational input data for constructing patient-specific three-dimensional (3D) LV mesh models, employing advanced computational algorithms developed internally by a PhD student, Rylan Marianchuk. These algorithms integrated the manually segmented myocardial boundaries from multiple imaging views, resulting in detailed, structured 3D geometric representations of each patient's left ventricular myocardium. Each LV mesh was systematically partitioned into 456 hexahedral elements, which were evenly distributed across the myocardium from the base to the apex, maintaining precise spatial correspondence across patients and thereby enhancing inter-subject comparability.
Lastly, regional myocardial wall thickness measurements were automatically extracted for each of the 456 mesh elements, calculated as the shortest perpendicular distance between corresponding points on the endocardial and epicardial surfaces. These measurements provided highly granular, localized assessments of myocardial thickness variations, thus capturing detailed regional patterns of hypertrophy that are crucial in phenotyping HCM patients. The complete set of regional thickness measurements for each patient was then organized into structured, multidimensional numeric arrays.
3. Dimensionality Reduction using Principal Component Analysis (PCA) Given the complexity and high dimensionality of the dataset, which comprised local maximal wall thickness measurements across 456 hexahedral elements derived from three-dimensional (3D) left ventricular (LV) mesh models, dimensionality reduction was performed to simplify the dataset, enhance interpretability, and facilitate subsequent clustering analyses. Principal component analysis (PCA), a widely accepted statistical technique for feature extraction and dimensionality reduction, was applied to transform the original high-dimensional thickness data into a lower-dimensional representation while preserving the maximum possible variance within the dataset. The PCA algorithm operates by orthogonally projecting the original data onto a new set of axes—termed principal components—that sequentially maximize variance capture. In this study, PCA was executed on the dataset comprising all 456 regional LV wall thickness measurements without prior dimensionality constraints to initially assess the variance distribution across components. A cumulative explained variance plot was then generated to determine the optimal number of principal components needed to adequately capture the dataset's variability. The analysis demonstrated that the first eight principal components collectively accounted for approximately 80% of the total variance inherent in the original data. Based on these results, the first eight PCA components were selected as inputs for subsequent clustering analysis, thereby effectively balancing dimensionality reduction with retention of significant variance and information content.

4. Clustering Analysis using K-Means Clustering To identify potential phenotypic clusters of hypertrophic cardiomyopathy (HCM) patients based on regional wall thickness profiles, unsupervised machine learning was applied using the dimensionality-reduced dataset obtained from PCA. Unsupervised clustering techniques allow for the detection of inherent structural groupings within data without relying on predefined labels or categories, which is particularly beneficial in conditions like HCM, where disease phenotypes and prognostic subgroups may not yet be well-defined.
4.1 Choosing a Clustering Algorithm K-means clustering, an iterative centroid-based clustering method, was employed to partition patients into distinct groups based on their similarity in PCA-derived feature space. For this analysis, I specifically selected the K-means clustering algorithm, a partition-based clustering approach renowned for its computational efficiency, ease of interpretation, and scalability to large datasets. K-means clustering partitions data points into k clusters, where each data point belongs to the cluster with the nearest mean (cluster centroid). This method operates by initially selecting k number of centroids randomly or strategically within the data space, assigning observations to the nearest centroid, recalculating centroid positions based on the newly formed clusters, and iteratively repeating these steps until convergence criteria—usually minimal intra-cluster variance—are achieved. The choice of K-means was guided by several key considerations: Interpretability: K-means provides straightforward interpretability as each cluster is represented by its centroid, enabling easy clinical translation. Computational Efficiency: Given the large number of subjects (405 patients) and the high dimensionality of initial data (456 features reduced to eight PCA components), K-means is notably efficient computationally. Established Clinical Utility: Previous studies successfully employed K-means clustering for subtyping of large datasets, reinforcing its suitability for my research context. Although K-means was ultimately selected, additional clustering algorithms were systematically evaluated to ensure robustness of cluster identification. Alternative algorithms examined included Hierarchical Clustering and Density-Based Spatial Clustering (HDBSCAN): Hierarchical Clustering: Ward’s hierarchical method incrementally merges data points or groups of points into clusters by minimizing intra-cluster variance at each stage, resulting in a dendrogram that facilitates visual assessment of potential cluster structures. To objectively determine the optimal number of hierarchical clusters, silhouette scores (which measure the degree of cluster separation and cohesion) were computed for cluster counts ranging from two to ten. The analysis revealed the highest silhouette score (0.268) with two clusters, comparable to that obtained via K-means. Despite this similarity, hierarchical clustering provided a lower clinical significance when statistical testing was done. Density-Based Spatial Clustering (HDBSCAN): HDBSCAN identifies clusters as continuous regions of high density separated by lower-density areas, effectively managing outliers and clusters of irregular shapes. Initial analysis using HDBSCAN resulted in clusters characterized by excessive fragmentation, producing multiple small groups that lacked clinical interpretability. Preliminary silhouette scores from HDBSCAN analyses were notably lower (average silhouette score < 0.20), further indicating weaker cluster quality and suboptimal interpretability. Given these findings, the K-means algorithm was confirmed as the most suitable clustering method for its balance of clinical significance, interpretability, and quality of cluster delineation.
4.2 Choosing the Number of Clusters Beyond choosing the correct algorithm, however, it was also crucial to determine how many clusters should be created. Determining the optimal number of clusters (k) is critical for robust phenotypic differentiation and clinical interpretability. Therefore, two well-established methods, namely the elbow method and silhouette score analysis, were systematically utilized: Elbow Method: This method involves calculating the within-cluster sum of squares (WCSS) for various values of k (typically ranging from 1 to 20 clusters). A plot depicting WCSS against the number of clusters was created to visually assess the point at which increasing the number of clusters resulted in only marginal decreases in WCSS (the "elbow point"). In this analysis, visual inspection suggested a significant reduction in within-cluster variance at two clusters. Silhouette Score Analysis: This quantitative metric evaluates clustering quality by calculating the average silhouette coefficient for each number of clusters, balancing cluster cohesion (intra-cluster similarity) and separation (inter-cluster dissimilarity). Silhouette scores range from -1 to +1, with higher scores indicating clearer cluster separation. Analysis revealed that clustering the data into two distinct phenotypic groups yielded the highest silhouette score (approximately 0.25), confirming the optimality of two clusters.
4.3 Clustering Outputs Consequently, the final K-means clustering analysis was performed using two clusters on the eight-dimensional PCA-derived feature space, yielding two distinct phenotypic clusters. To further visualize the separation and characteristics of these clusters, two-dimensional (2D) scatter plots and three-dimensional (3D) plots of the first three PCA components were generated, clearly illustrating distinct spatial separation between the identified phenotypic groups.
2D Plot:

3D Plot:
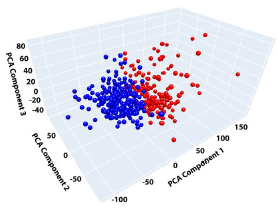
Ultimately, this combination of PCA and K-means clustering effectively classified HCM patients into phenotypically meaningful clusters based on comprehensive regional myocardial wall thickness profiles, providing a novel approach to phenotypic characterization and potential risk stratification in hypertrophic cardiomyopathy.
Analysis
Using K-means clustering, two distinct phenotypic clusters were identified from the ventricular wall thickness measurements. However, what do these clusters mean? Statistical analyses were performed to evaluate differences in clinical characteristics between the clusters identified and to assess the association of these clusters with future adverse clinical outcomes. All statistical analyses were conducted using R statistical software (version 4.3.1). Prior to conducting analyses, the dataset underwent thorough exploratory data analysis and preprocessing steps, including checks for missing values, outliers, and normality assumptions, to ensure appropriate selection of statistical tests and validity of the findings.
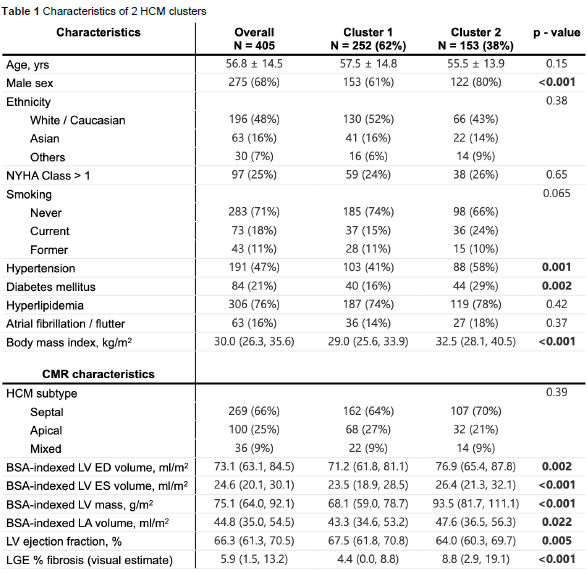
Baseline characteristics of patients across the two clusters were initially summarized using descriptive statistics. Continuous variables were presented as mean ± standard deviation (SD) or median with interquartile range (IQR), based on the distribution characteristics. Categorical variables were reported as absolute numbers and percentages (%). To determine appropriate parametric or non-parametric testing for continuous variables, normality of data distributions was rigorously evaluated through visual inspection of histograms, quantile-quantile (Q-Q) plots, boxplots, as well as formal statistical testing using the Shapiro-Wilk test. Variables demonstrating approximately normal distributions (Shapiro-Wilk test: p > 0.05) were analyzed using Student’s independent-samples t-test, while variables showing significant deviation from normality (Shapiro-Wilk test: p ≤ 0.05) were assessed using the Wilcoxon rank-sum (Mann-Whitney U) test. Categorical variables across clusters were compared using Chi-square tests or Fisher’s exact test (when expected cell frequencies were less than five), as appropriate. In the analysis of baseline characteristics, significant differences were observed between clusters in several important clinical and imaging parameters. Patients classified into Cluster 2 demonstrated significantly increased prevalence of factors associated with adverse outcomes, including greater left ventricular mass, increased left atrial volume, and more extensive myocardial fibrosis, as measured by late gadolinium enhancement (LGE). Furthermore, symptomatic status, measured by the New York Heart Association (NYHA) classification, was significantly worse in Cluster 2 compared to Cluster 1, indicating increased disease severity within this subgroup (all comparisons: p < 0.05).
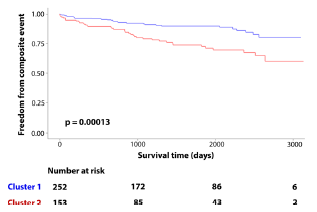
Survival analyses were subsequently conducted to evaluate the association of identified clusters with clinical outcomes over follow-up. Kaplan-Meier survival curves were constructed to graphically illustrate differences in time-to-event probabilities (freedom from composite adverse events) between clusters. Kaplan-Meier analysis revealed significant differences in adverse outcomes between clusters over the follow-up period. Of the 405 patients, 67 patients (16.5%) experienced the composite clinical outcome. Notably, the rate of adverse outcomes was significantly higher in Cluster 2 (25%) compared to Cluster 1 (11%), representing a marked increase in risk (log-rank test: p < 0.001).
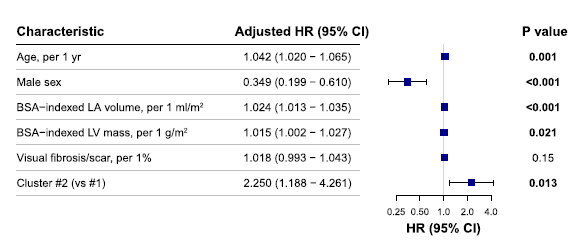
To assess the independent significance of cluster membership, a multivariable Cox proportional hazards regression analysis was also conducted. The Cox model evaluated the independent association of cluster membership with the primary composite outcome after adjusting for relevant clinical and imaging covariates selected a priori based on clinical importance or demonstrated prognostic significance in prior literature. These covariates included patient age, sex, indexed left atrial (LA) volume, indexed left ventricular (LV) mass, and LV fibrosis quantified via late gadolinium enhancement (LGE) imaging. Results of the Cox regression analysis were presented as hazard ratios (HRs) with associated 95% confidence intervals (CIs), and statistical significance was defined as a two-tailed p-value less than 0.05. The multivariable Cox regression analysis demonstrated that cluster membership remained significantly and independently associated with the primary composite adverse outcome after controlling for important covariates. Specifically, membership in Cluster 2 was associated with a more than twofold increased risk of adverse clinical outcomes (hazard ratio [HR]: 2.2; 95% confidence interval [CI]: 1.2–4.3; p = 0.013), independent of other established prognostic markers, such as age, sex, left atrial volume, LV mass, and myocardial fibrosis burden.
Conclusion
In this study, I successfully developed and implemented a computational approach aimed at refining the phenotypic characterization and clinical risk stratification of patients with hypertrophic cardiomyopathy (HCM). By integrating cardiac magnetic resonance (CMR) imaging data with unsupervised machine learning, specifically PCA dimensionality reduction followed by K-means clustering, I identified two distinct phenotypic clusters with substantial clinical relevance. Cluster analyses revealed significant differences in important baseline characteristics between groups. Patients in Cluster 2 were characterized by greater LV mass, increased left atrial volume, extensive myocardial fibrosis measured by late gadolinium enhancement (LGE), and worse symptomatic status according to the New York Heart Association classification. Additionally, survival analyses demonstrated that these patients experienced a significantly higher incidence of adverse clinical outcomes. Through multivariable Cox proportional hazards regression, I established that Cluster 2 membership independently predicted a greater than twofold increase in the risk of major adverse cardiovascular events, even after accounting for established clinical predictors.
Currently, I am actively expanding on these initial findings by evaluating additional computational models, including specified clustering algorithms and advanced deep learning-based approaches, to assess whether different methods can further improve the robustness, accuracy, and clinical applicability of the clusters identified. Moreover, to enhance the clinical usability of these results, I am in the process of developing a comprehensive visual "phenotype atlas" that clearly highlights the average myocardial thickness patterns unique to each identified cluster. Such a tool could serve as a practical reference, facilitating patient phenotyping in routine clinical practice and helping overcome the limitations previously noted with conventional scoring systems.
Overall, through the application of sophisticated computational techniques and advanced cardiac imaging, I have demonstrated a substantial improvement in the identification and prognostic characterization of phenotypically distinct subgroups within the HCM patient population. My findings address the critical limitations of traditional HCM risk stratification methods, which rely heavily on subjective, manual, two-dimensional measurements. Such methods frequently miss the complex heterogeneity intrinsic to HCM, limiting their predictive value and clinical utility. My computational approach, by contrast, provides an objective method for accurately distinguishing patients with higher-risk phenotypes. This methodology offers the potential to significantly improve early identification of high-risk individuals, allowing clinicians to implement timely interventions and improve patient outcomes.
Citations
-
https://www.ahajournals.org/doi/full/10.1161/CIRCULATIONAHA.120.051968
-
https://www.sciencedirect.com/science/article/pii/S0019483220304107
-
https://www.thelancet.com/journals/landig/article/PIIS2589-7500(20)30267-3/fulltext
-
https://watspeed.uwaterloo.ca/programs-and-courses/course-unsupervised-machine-learning.html
-
https://www.ibm.com/think/topics/supervised-vs-unsupervised-learning
The links above were the main sources used in my project, but small pieces of information from dozens of other websites were also used. A comprehensive list will be available printed out in person at CYSF.
Acknowledgement
This work was done during my studentship under the mentorship of Dr. James White at the Libin Cardiovascular Institute, University of Calgary. I am deeply grateful to Dr. White for his invaluable guidance, mentorship, and support throughout the research process. Additionally, I wish to acknowledge the essential contributions of Dr. Dina Labib, Mr. Justin J. Tse, Mr. Rylan Marianchuk, and all other members of Dr. White's lab. Their expertise, feedback, and collaboration were instrumental in the success of this research.
Outside of the lab, my sincere gratitude goes to Mr. Buhler, my CYSF coordinator, and Dr. E.P. Scarlett High School for their continuous encouragement and support of my academic efforts. Finally, I would like to express heartfelt appreciation to my parents for their unwavering guidance, encouragement, and support throughout this project.
This project would not have been possible without each of these individuals.