Audio Vs Visual Learning
Muhammad Khan, Percy Antle
Queen Elizabeth High School
Grade 8
Presentation
Hypothesis
- I hypothesize that: The way instructions are delivered (Audio, Visual, Both) to a participant will affect how well they can complete a novel task
- I hypothesize that: People of different age groups (grade 8, Adults) will learn different ways and will show different responses to the way in which instructions are delivered
Predictions:
- We predict that adults will be better at speed and quality across all conditions
- We predict that participants following only visual directions will give better responses than AV because an audio track interefers with the necessary skills to fold origami
- We predict that participants following only audio instructions will be worse than both visual and AV
Research
Research: 1: What makes visual learner Visual learners are often best suited interacting with information presented in a visual format, such as, images, videos, graphs, diagrams. Visual learners use their senses to process and percieve enviroment and material. Visual learning is said to have the benefit of better information retention. Visual learners also often have a stronger memory and have great observation skills, most people in our survey described themselves as visual learners. 2: What makes audio learner Audio learners prefer to learn through discussions, lectures, or even simply talking to themselves. They learn better when someone explains a concept to them. Audio learners have very strong communication and listening skills. They often learn well with repetition, because they prefer hearing instructions. They are much more rare according to the survey we ran on participants. 3: Do people learn better if they learn with their style Many papers show that people don't actually learn better with their style, or that learning styles are a myth. There is a great deal of conflicting research on this topic. Some research suggests that students can actually learn better when taught in a way different to their identified learning style. This means that there may not be a difference between learning styles, but for certain tasks, learning styles might come out on top 4: How does development affect learning style Many people believe that learning style is set at birth, but actually it takes many changes through development, because learning is an uneven process. Adults will usually outperform kids in tasks that are tested visually or auditory, but most kids and adults are visual learners. It is possible that you will change learning styles as you grow older. We are testing adults vs kids to see whos better in general and in certain categories. 5: In this task who has advantage In origami, visual learners have an advantage. It might be hard because many tasks like these require skills like spacial recognition, and can be followed without direction. In fact, an audio track may even interfere with learning the skills to fold with origami.
Variables
Manipulated: Audio or video file or AV Age (grade 8 vs Adult)
Responding: - Amount of time it takes to complete the task - Quality of the finished product
Controlled -Video watched by participants -Origami paper -What they have to make
Procedure
Method 1: Section 1: Creases, to help in the future
Start with the square paper on the table in a way that one point is facing you and there is a point on the opposite side, as well as points on the left and right.
Fold the point on the bottom to the point on the top to create a triangle. Make a crease and unfold.
Rotate the square so that the point that was originally on your left is now in front of you.
Fold the point at the bottom to the point at the top to form a triangle. Make a crease and unfold, which will create an x.
Now flip the paper on its backside and rotate it 45 degrees to the right so that 2 corners are facing you and 2 corners are facing away from you.
Fold the left edge to the right edge to create a rectangle. Make a crease and unfold.
Fold the bottom edge to the top edge to create a rectangle. Make a crease and unfold, this will split the paper into 8 triangles.
Section 2: Making the rhombus
Rotate the square 45 degrees left. Notice how your creases form 8 triangles, you should notice 4 square each made up of 2 triangles
On the right square, there is a top and a bottom triangle, on the bottom square there is a left and right triangle, fold the right square bottom triangle onto the bottom square right triangle to create a flap.
On the left side, fold the bottom triangle on the left square onto the left triangle of the bottom square, there should now be one last point in the air.
Lastly, fold that final point in the air onto the bottom point, it should naturally come together to make a layered square.
Take 1 layer of the right point and the edge running from it to the bottom point, and fold it so that the edge lines up with the center line, creating an upside down right triangle.
We do the same on the other side. Take 1 layer of the left point and the edge running from it to the bottom point, and fold it so that it lines up with the center line, creating an upside down right triangle.
Flip your square on to its backside by swapping left and right corners, make sure the top and bottom corners don’t switch.
Take 1 layer of the right point and the edge running from it to the bottom point, and fold it so that the edge lines up with the center line, creating an upside down right triangle that lines up with your previous one.
We do the same on the other side. Take 1 layer of the left point and the edge running from it to the bottom point, and fold it so that it lines up with the center line, creating an upside down right triangle, again, lining up with your previous one.
This will create a kite shape. Now open the fold you just did to see a square, grab the bottom point, but notice it’s layered, only take 1 layer.
Fold this layer up to the crease you previously made. Push both right and left points into and flatten it out to create a long rhombus.
Flip your square on to its backside swapping left and right corners, make sure the top and bottom corners don’t switch.
This will reveal a kite shape. We do the same as before. Now open the fold you just did to see a square, grab the bottom point, but notice it’s layered, only take 1 layer.
Fold this layer up to the crease you previously made. Push both right and left points into and flatten it out to create a long rhombus.
Notice that you have created a long rhombus now, the bottom should have a split, make sure you keep that on the bottom for the next steps.
Section 3: Creating the crane.
We are going to do something similar to what we did to create that kite shape before.
Take 1 layer of the right point and the edge running from it to the bottom point, and fold it so that it lines up with the center line, creating an upside down right triangle.
We do the same on the other side. Take 1 layer of the left point and the edge running from it to the bottom point, and fold it so that it lines up with the center line, creating an upside down right triangle.
Flip your rhombus on to its backside, make sure the top and bottom corners don’t switch though.
Take 1 layer of the right point and the edge running from it to the bottom point, and fold it so that it lines up with the center line, creating an upside down right triangle that lines up with your previous one.
We do the same on the other side. Take 1 layer of the left point and the edge running from it to the bottom point, and fold it so that it lines up with the center line, creating an upside down right triangle, again, lining up with your previous one, this will create a diamond with two long sides and 2 short sides, make sure the short sides are on top, there should be a point facing you.
In these next steps, we’re going to fold it so the outside is inside and the inside is outside.
Take 1 layer of the right and left sides, and fold them so that the edges are lined up, and you have it standing up on top of the other diamond.
Do the same thing with the other diamond, on the other side, take 1 layer of the right and left sides, and fold them so that the edges are lined up.
Now lay on one of the flat sides down in front of you, notice that you have the same diamond, but there is a noticeable split at the top.
Fold the bottom point to the same height as the 2 points at the top, do the same on the other side, fold the bottom point to the same height as the now 3 points at the top.
This will create a 5 sided shape with 4 points at the top.
Take 1 layer of the right and left sides, and fold them so that the edges are lined up, and you have it standing up on top of the other diamond.
Do the same thing with the other diamond, on the other side, take 1 layer of the right and left sides, and fold them so that the edges are lined up.
You should now have the same 5 sided shape, ensure that the 4 points are at the top and there is a flat base on the bottom.
Fold the face in front of you down, it should fold naturally and it should reveal a triangle. Flip it on its backside, still ensuring the top and bottom points stay the same and repeat the same on the other side Fold the face in front of you down, it should fold naturally and it should reveal a triangle.
Notice that underneath the folds you just made, which are the wings, there is a thick base, pinch that and notice the 2 wings sticking out, as well as 2 points going up.
Holding on to the base, pull the point going up on the right, to the right about 45 degrees and pinch to make it stay in place.
Holding on to the base, pull the point going up on the left, to the left about 45 degrees and pinch to make it stay in place.
Fold the tip of either point sticking out about ⅓ from the top down to create a face for your crane.
Method 2:
Step 1: Make participants fold the paper crane using the appropriate video; audio participants use the audio only video, visual participants use the only visual video, and the control participants use the visual and audio video.
Step 2: For each participant, record the time they took in completing the paper crane, the quality of their paper crane (0 = not completed, 1 = 2 or more major errors, 2 = at least 1 major error, 3 = only minor errors.), and which steps participants struggled in completing the task.
Observations
Kids
Participants in the visual group took the least amount of time, even less than control Quality in both visual and control groups were between 2-3 Audio group did not complete any cranes Most people had trouble with making the kite/rhombus shape in the procedure. In general took more time than adults.
| Participant | Group | Time | Quality | |
|---|---|---|---|---|
| 1 | Control | 15:04 | 3 | |
| 2 | Control | 17:29 | 2 | |
| 3 | Control | 17:30 | 2.5 | |
| average | 16:41 | 2.5 | ||
| sdev | 0.05833746678 | 0.5 | ||
| sem | 0.03368115215 | 0.2886751346 | ||
| 4 | Video | 14:24 | 2 | |
| 5 | Video | 9:11 | 3 | |
| 6 | Video | 8:33 | 3 | |
| average | 10:42 | 2.666666667 | ||
| sdev | 0.1337636526 | 0.5773502692 | ||
| sem | 0.07722848085 | 0.3333333333 | ||
| 7 | Audio | 18:00 | 0 | |
| 8 | Audio | 18:00 | 0 | |
| 9 | Audio | 12:00 | 0 | |
| average | 16:00 | 0 | ||
| sdev | 0.1443375673 | 0 | ||
| sem | 0.08333333333 | 0 |
Adults
Control was this fastest group, as opposed to the kids, visual was the fastest group. Quality for visual and control groups between 2-3 No completion for audio group. Most people had trouble turning the cran inside out in the procedure. In general, were faster than kids.
| Participant | Group | Time | Quality | |
|---|---|---|---|---|
| 1 | Control | 9:03 | 2 | |
| 2 | Control | 10:13 | 3 | |
| 3 | Control | 12:50 | 2.5 | |
| average | 10:42 | 2.5 | ||
| sdev | 0.08072599307 | 0.5 | ||
| sem | 0.04660717383 | 0.2886751346 | ||
| 4 | Video | 12:49 | 3 | |
| 5 | Video | 20:23 | 3 | |
| 6 | Video | 0:00 | 0 | |
| average | 19:04 | 2 | ||
| sdev | 0.2377810634 | 1.732050808 | ||
| sem | 0.137282961 | 1 | ||
| 7 | Audio | 3:14 | 0 | |
| 8 | Audio | 11:22 | 0 | |
| 9 | Audio | 3:05 | 0 | |
| average | 13:53 | 0 | ||
| sdev | 0.5113263499 | 0 | ||
| sem | 0.2952144057 | 0 |
Analysis
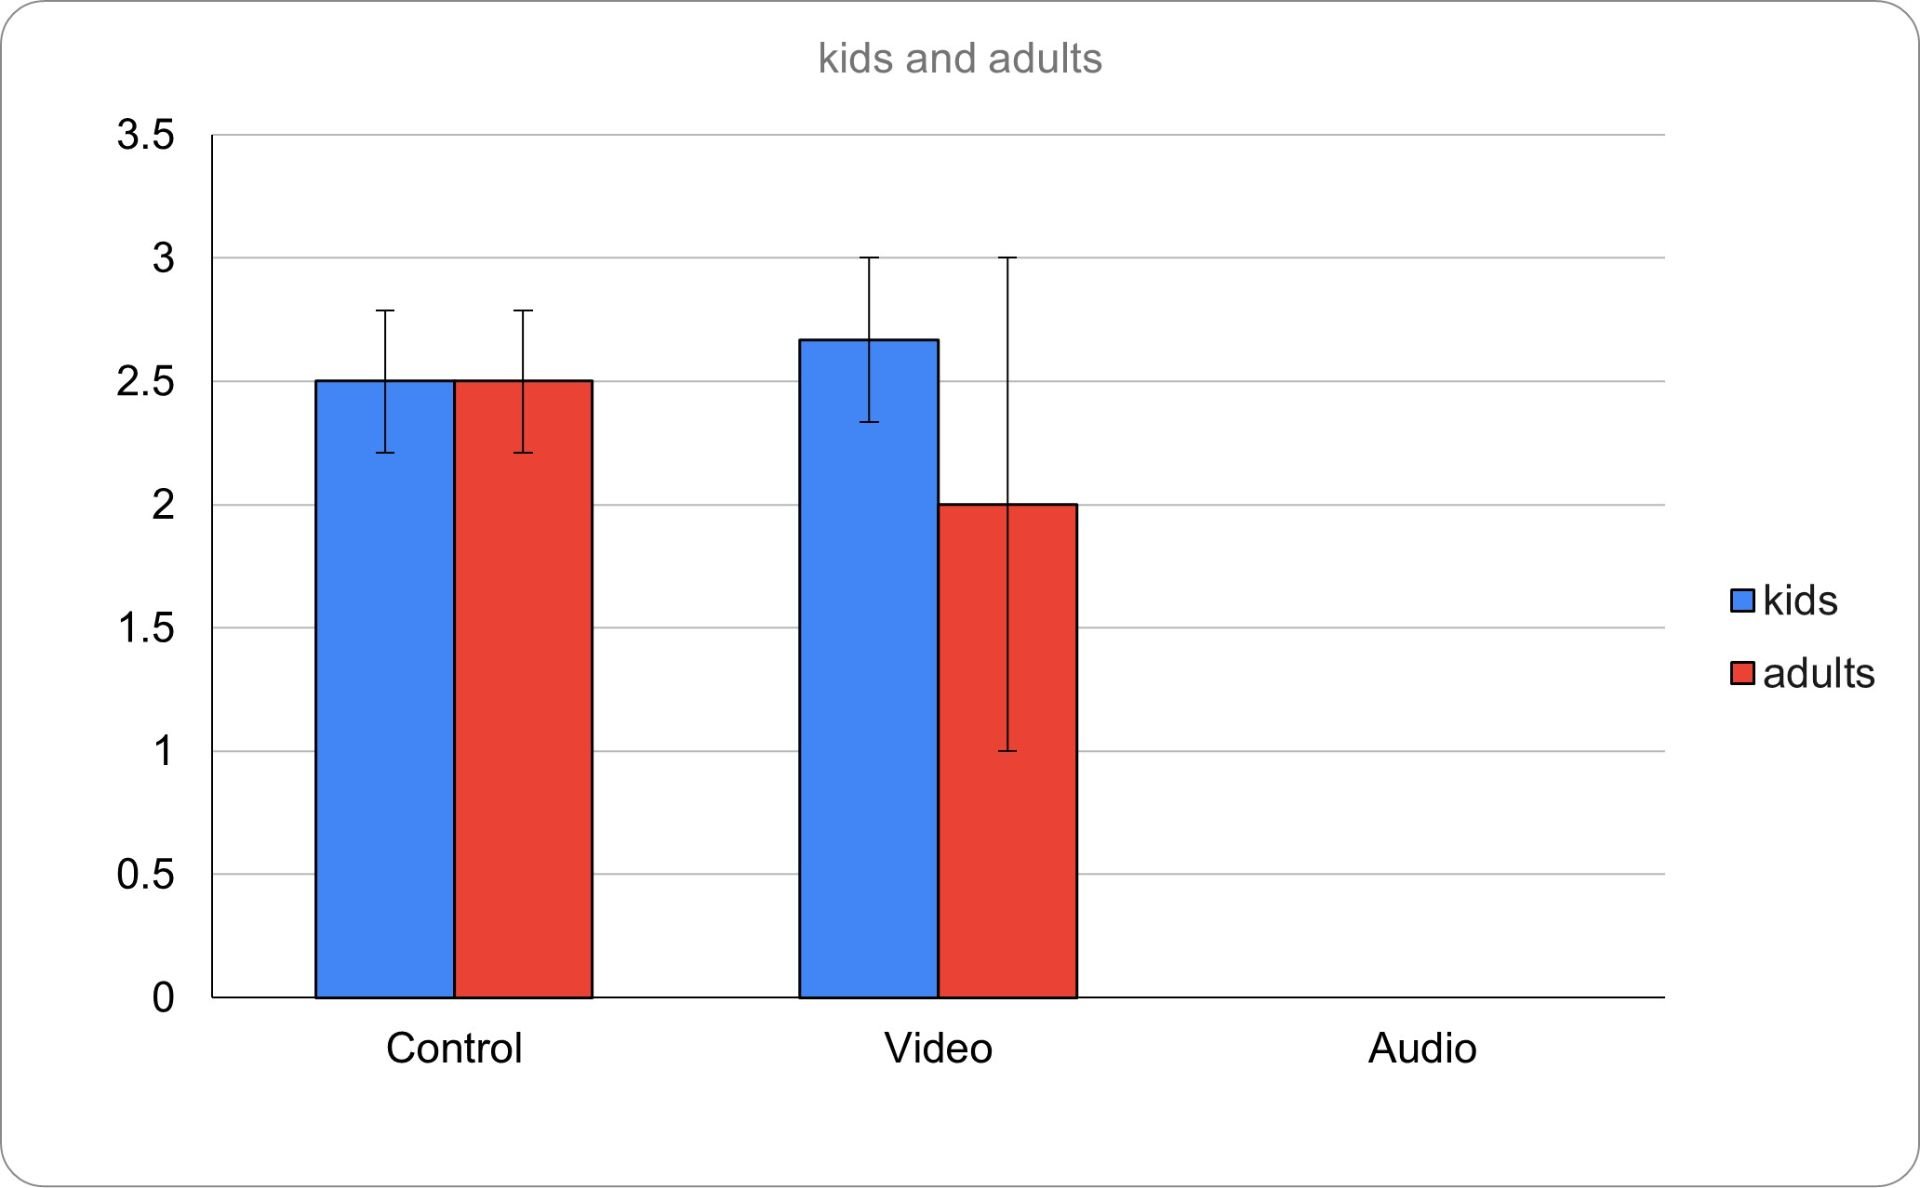
Statistics testing quality
Two Way Analysis of Variance
Data source: Data 1 in Notebook1
Balanced Design
Dependent Variable: Quality
Normality Test (Shapiro-Wilk): Failed (P < 0.050)
Equal Variance Test (Brown-Forsythe): Failed (P < 0.050)
Source of Variation DF SS MS F P
Group 2 23.444 11.722 18.348 <0.001
Age 1 0.222 0.222 0.348 0.566
Group x Age 2 0.444 0.222 0.348 0.713
Residual 12 7.667 0.639
Total 17 31.778 1.869
The difference in the mean values among the different levels of Group is greater than would be expected by chance after allowing for effects of differences in Age. There is a statistically significant difference (P = <0.001). To isolate which group(s) differ from the others use a multiple comparison procedure.
The difference in the mean values among the different levels of Age is not great enough to exclude the possibility that the difference is just due to random sampling variability after allowing for the effects of differences in Group. There is not a statistically significant difference (P = 0.566).
The effect of different levels of Group does not depend on what level of Age is present. There is not a statistically significant interaction between Group and Age. (P = 0.713)
Power of performed test with alpha = 0.0500: for Group : 0.998
Power of performed test with alpha = 0.0500: for Age : 0.0500
Power of performed test with alpha = 0.0500: for Group x Age : 0.0500
Least square means for Group :
Group Mean
Control 2.500
Video 2.333
Audio 0.000
Std Err of LS Mean = 0.326
Least square means for Age :
Group Mean
Kid 1.722
adult 1.500
Std Err of LS Mean = 0.266
Least square means for Group x Age :
Group Mean
Control x Kid 2.500
Control x adult 2.500
Video x Kid 2.667
Video x adult 2.000
Audio x Kid 0.000
Audio x adult 0.000
Std Err of LS Mean = 0.461
All Pairwise Multiple Comparison Procedures (Holm-Sidak method):
Overall significance level = 0.05
Comparisons for factor: Group
Comparison Diff of Means t P P<0.050
Control vs. Audio 2.500 5.417 <0.001 Yes
Video vs. Audio 2.333 5.056 <0.001 Yes
Control vs. Video 0.167 0.361 0.724 No
Comparisons for factor: Age
Comparison Diff of Means t P P<0.050
Kid vs. adult 0.222 0.590 0.566 No
Comparisons for factor: Age within Control
Comparison Diff of Means t P P<0.050
Kid vs. adult 0.000 0.000 1.000 No
Comparisons for factor: Age within Video
Comparison Diff of Means t P P<0.050
Kid vs. adult 0.667 1.022 0.327 No
Comparisons for factor: Age within Audio
Comparison Diff of Means t P P<0.050
Kid vs. adult 0.000 0.000 1.000 No
Comparisons for factor: Group within Kid
Comparison Diff of Means t P P<0.050
Video vs. Audio 2.667 4.086 0.005 Yes
Control vs. Audio 2.500 3.831 0.005 Yes
Video vs. Control 0.167 0.255 0.803 No
Comparisons for factor: Group within adult
Comparison Diff of Means t P P<0.050
Control vs. Audio 2.500 3.831 0.007 Yes
Video vs. Audio 2.000 3.065 0.020 Yes
Control vs. Video 0.500 0.766 0.458 No
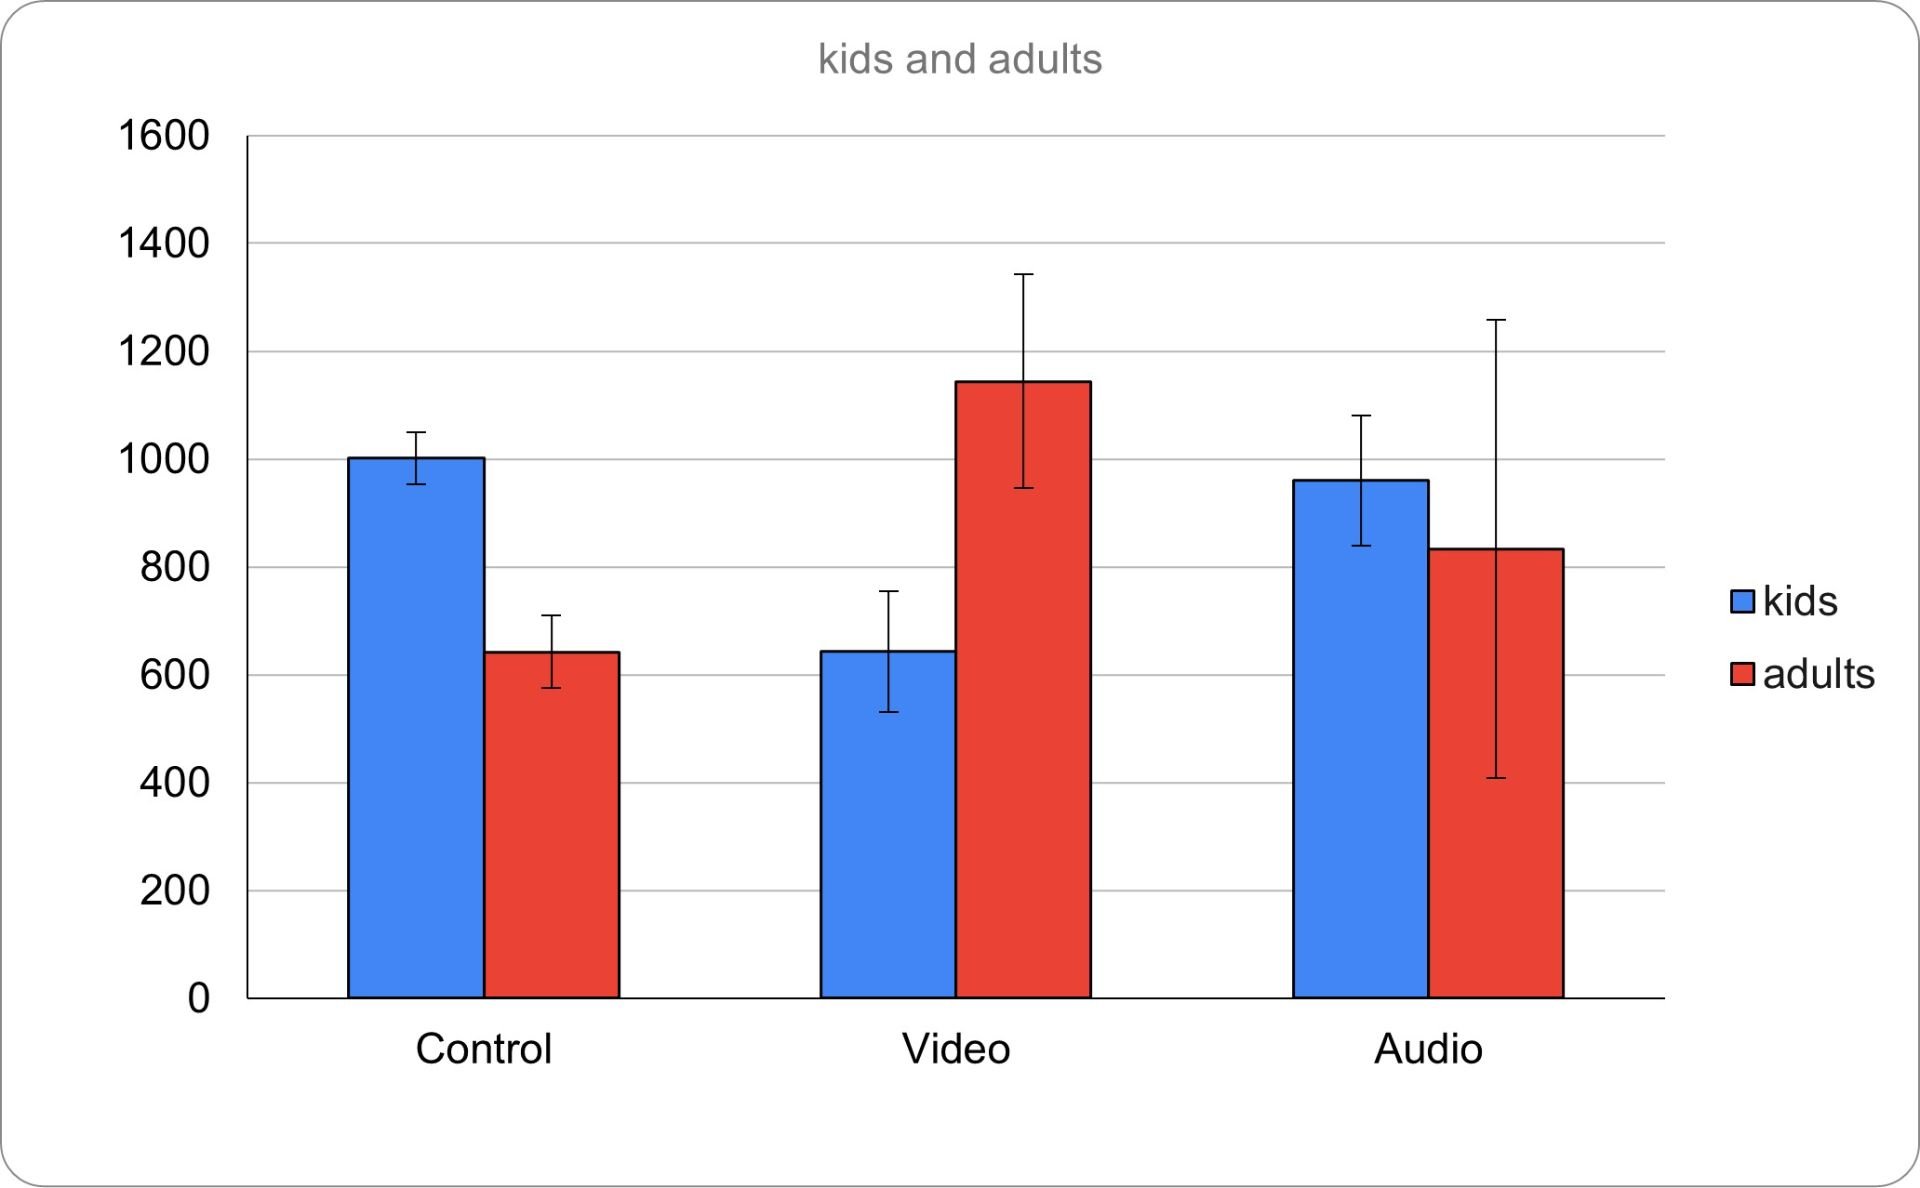
Statistics testing time
Two Way Analysis of Variance
Data source: Data 1 in Notebook1
Balanced Design
Dependent Variable: Time
Normality Test (Shapiro-Wilk): Passed (P = 0.198)
Equal Variance Test (Brown-Forsythe): Passed (P = 0.085)
Source of Variation DF SS MS F P
Group 2 21694.778 10847.389 0.0856 0.919
Age 1 128.000 128.000 0.00101 0.975
Group x Age 2 594136.333 297068.167 2.344 0.138
Residual 12 1520531.333 126710.944
Total 17 2136490.444 125675.908
The difference in the mean values among the different levels of Group is not great enough to exclude the possibility that the difference is just due to random sampling variability after allowing for the effects of differences in Age. There is not a statistically significant difference (P = 0.919).
The difference in the mean values among the different levels of Age is not great enough to exclude the possibility that the difference is just due to random sampling variability after allowing for the effects of differences in Group. There is not a statistically significant difference (P = 0.975).
The effect of different levels of Group does not depend on what level of Age is present. There is not a statistically significant interaction between Group and Age. (P = 0.138)
Power of performed test with alpha = 0.0500: for Group : 0.0500
Power of performed test with alpha = 0.0500: for Age : 0.0500
Power of performed test with alpha = 0.0500: for Group x Age : 0.235
Least square means for Group :
Group Mean
Control 821.500
Video 893.333
Audio 896.833
Std Err of LS Mean = 145.322
Least square means for Age :
Group Mean
Kid 867.889
adult 873.222
Std Err of LS Mean = 118.655
Least square means for Group x Age :
Group Mean
Control x Kid 1001.000
Control x adult 642.000
Video x Kid 642.667
Video x adult 1144.000
Audio x Kid 960.000
Audio x adult 833.667
Std Err of LS Mean = 205.516
Conclusion
We found not a significant difference in time to complete a task, between audio, visual, and AV, but there is a difference between kids and adults, for example adults were better in time for AV, and kids were better in time for visual group. This shows there is a difference, and changes in learning can take place during development stages. For quality, visual and AV were about the same, suggesting a visual component may help me people learn how to do a certain task. This lines up with our research because we found that most people are visual learners. Audio learners were not able to successfully complete the origami crane, this could be because it's a visual task, our instructions weren't specific enough, or most people are not able to learn auditory.
Application
Our experiment applies to the real world in many ways. This experiment can help in improving learning for specific types of learners. For example, we have understood that visual learners are much more capable to do better with videos compared to auditory learners who have a much harder time with specific instructions. We can improve school curriculums, and varieties of courses based on the learning of the individual.
People who have hearing and visual disabilities can also be affected in a positive way. We could generalize visual or audio based learning to suit the needs of a person who isn't that particular type of learner. Another possibility is combining this idea with pre-existing learning styles to ensure better learning for students.
We could also apply it to the real world by making a website where people could find exactly what type of learner they are through these taks, and how they may be able to learn better with specific resuslts.
In conclusion, our experiment is meant to improve education for all types of learners by giving them the best possible instruction as possible.
Sources Of Error
Limitations: Sample size - It would be very hard to conduct a big sample size, so we did the minimum per group. With a larger sample size we may have significant difference in our statistics for time, but with time and budget, it would be extremely difficult to get a large enough sample size. Video - The video quality wasn't perfect, and auditory instructions given may not be specific enough for auditory learners to actually complete a crane, as seen in our results, all participants in the audio group did not complete the crane. Future directions: If we were to do this same experiment again, we could analyze more tasks rather than just one, have specific instructions for eah task, and could take data while also teaching people what learning style they are and how they can learn best with that style, (Website with access to all tasks and videos and results given while collecting data from said website). In the future, with a larger sample size, we may have a significant difference in our time data, and could analyze that compared to people in all categories.
Citations
References
- (2020, August 10). Auditory Learning Style Explained. Retrieved February 28, 2026, from https://www.wgu.edu/blog/2020/08/auditory-learning-style.html
- Belief in learning styles myth may be detrimental. (2019, May 30). American Psychological Association. Retrieved February 28, 2026, from https://www.apa.org/news/press/releases/2019/05/learning-styles-myth
- McCue, T. (2019, January 30). How Combined Learning Style Not Just Visual Or Kinesthetic Can Help You Succeed. Retrieved February 28, 2026, from https://www.forbes.com/sites/tjmccue/2019/01/30/how-combined-learning-style-not-just-visual-or-kinesthetic-can-help-you-succeed/
- Roark, C. L. (2023). Auditory and visual category learning in children and adults. PMC. Retrieved February 28, 2026, from https://pmc.ncbi.nlm.nih.gov/articles/PMC10164074/
- Show, Don't Tell: What It Means to Be a Visual Learner. (n.d.). Bay Atlantic University. Retrieved February 28, 2026, from https://bau.edu/blog/visual-learner/
- Straub\, E. O. (2024\, January 10). Roundup on Research: The Myth of 'Learning Styles' | Online Teaching. Online Teaching. Retrieved February 28\, 2026\, from https://onlineteaching.umich.edu/articles/the-myth-of-learning-styles/
Acknowledgement
We thank the students in Queen Elizabeth Junior High and High School in classes 8.1 and 8.2 for being participants in our study We thank the students and faculty at the University of Calgary for participating in this experiment Thanks to my dad for helping me to record the videos and audio track used in our experiment. Thanks to Easy Paper Origami for teaching me how to fold a paper crane.