
Assessment of Solar Irradiance Patterns and Solar Power Potential in Calgary using Data Analysis
Arushi Paul
Fairview School
Grade 6
Presentation
Problem
Research Statement
The amount of sunlight available for generating solar energy depends on the time of day, the season, and geographical location. In Calgary, Alberta the days are long during summer but short during winter time. The goal of this study is to use real environmental data to investigate sunlight patterns in Calgary, in order to better understand the availability of solar energy and evaluate it's potential for generating electricity [1, 2].
Main Goals of the Research
- Analyze how the amount of sunlight fluctuates through out the day
- Find out which months and seasons get the most sunlight
- Based on solar irradiance, classify whether a day is sunny, partly sunny, or cloudy
- Using real data, figure out how much solar power Calgary can produce
- Evaluate whether solar power can be used to generate electricity for household use or not
Main Research Problem
- Does Calgary receive enough sunlight throughout the year for solar panels to serve as main source of energy?
- How do seasonal and daily sunlight variations affect solar electricity production?
Method
- Collected Calgary's solar irradiance and weather data from NASA Power [3] and electricity data from Statistics Canada [4].
- Organized data into Excel for analysis
- Calculated hourly, monthly and seasonal average solar irradiance
- Analyzed how sunlight varies by hour, day, month & season
- Created graphs and heat map to visualize solar irradiance patterns
- Classified days as sunny, partly sunny, or cloudy based on solar irradiance levels
- Estimated annual solar energy available per square meter in Calgary
- Calculated expected electricity generation from a typical 4KW home solar system
- Evaluated whether solar power is practical for Calgary using analysed data
- Provided recommendations for solar panels
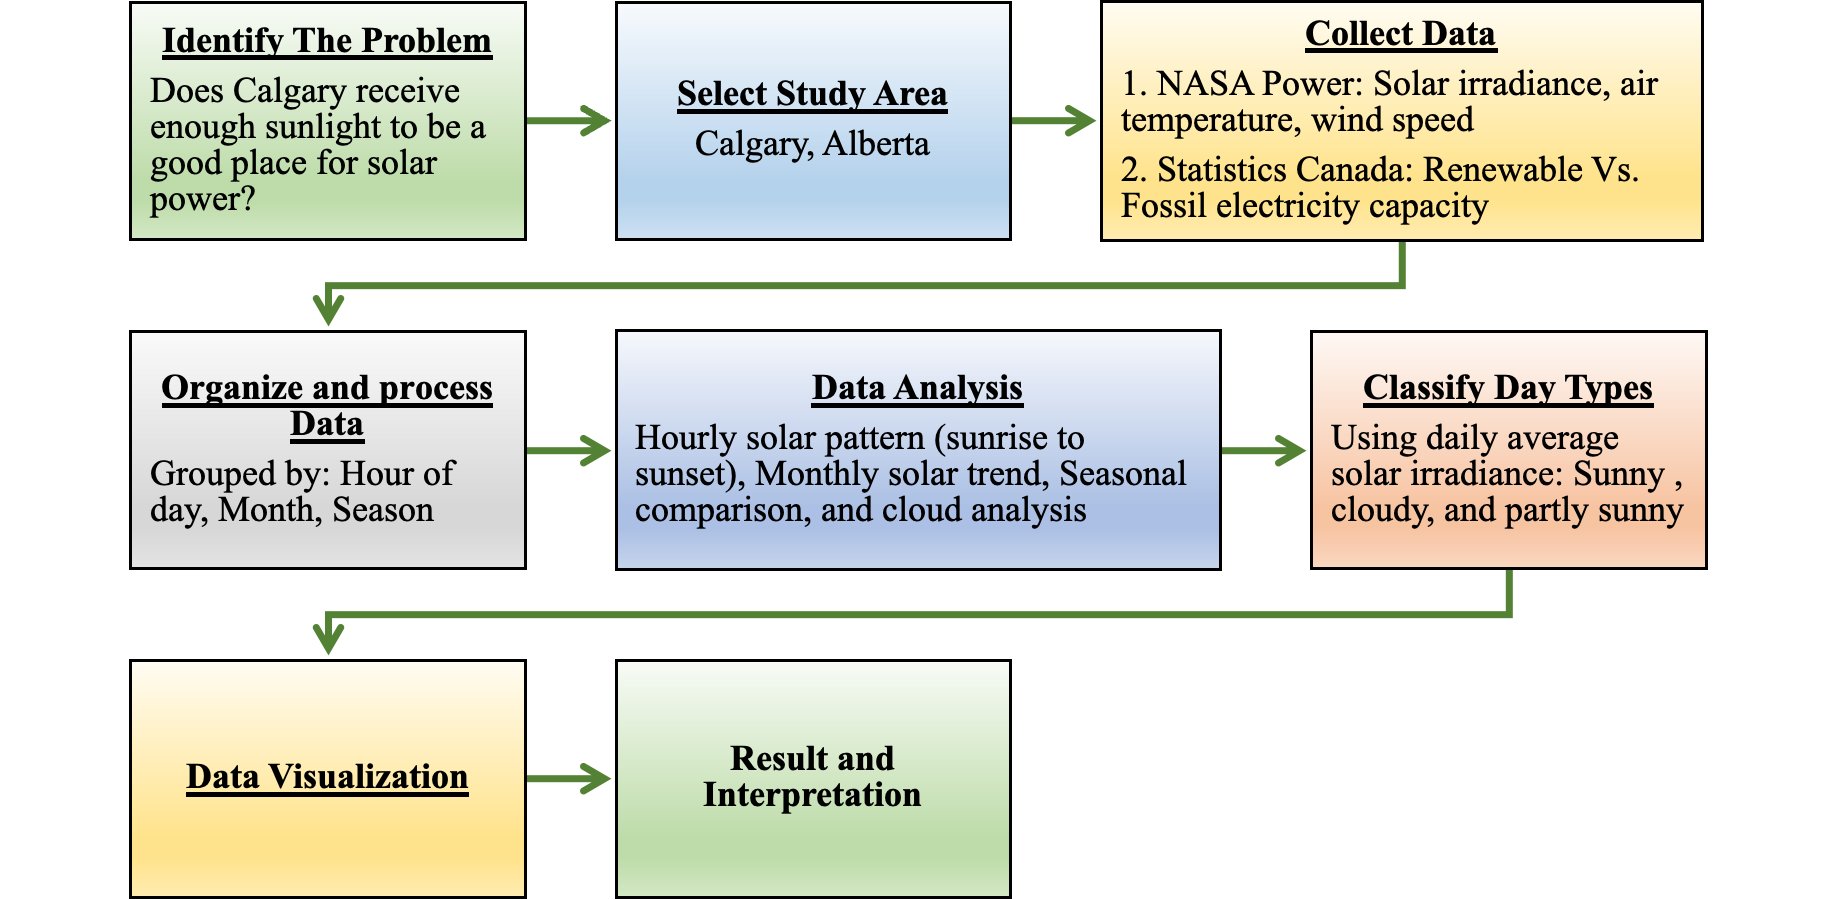 Figure 01: Methodology flowchart illustrating data collection, processing, analysis, and interpretation used to assess solar energy potential in Calgary
Research
Hypothesis
- Solar irradiance in Calgary varies by season, month, and time of day
- Summer (June–July) will have the highest solar irradiance and solar energy due to longer daylight hours and higher sun angles
- Solar irradiance will peak around midday (11 AM–2 PM)
- Winter (November–January) will have the lowest solar irradiance and energy due to shorter days and a lower sun angle
- Solar panels will produce much more electricity in the summer than in the winter
- For a stable electricity supply during the winter, grid support and battery storage will be necessary
Background Research
Photovoltaic (PV) solar panel uses sunlight to convert solar energy into electricity which is a renewable source of power. Solar energy doesn't release greenhouse gases or air pollution like fossil fuels do; it's a beneficial choice for the environment [5].
Studies show that solar panel efficiency is more dependent on sunlight than temperature. If there is enough sunlight, solar panels can work well even when it's cold. This research examines Calgary's solar energy potential by analyzing solar irradiance data throughout the day, season and year. It also evaluates whether solar power is a viable and sustainable renewable energy source for the region or not.
Related Scientific Concepts and Definitions
Renewable and non-renewable energy
Energy derived from natural occurrences that are endless and continuous on a human scale is known as renewable energy. They come from the sun (solar energy), wind (wind), water (hydroelectricity), earth's heat (geothermal energy), biomass, and other natural sources rather than fossil fuels. Their primary benefit is that they provide energy with minimal negative effects on the environment, which lowers greenhouse gas emissions. Since it provides a sustainable alternative to reduce reliance on finite resources and fight climate change, renewable energy is essential to the global energy transition [6, 7].
Energy from finite resources that cannot be replenished at the rate of consumption is referred to as non-renewable energy. To put things in perspective, non-renewable energy sources won't be regenerated during our lifetimes—or, more precisely, during the lifetimes of many people. Fossil fuels, including coal, natural gas, petroleum, and crude oil, make up the majority of non-renewable energy sources [8]. However, nuclear fuel, which is mostly used to generate electricity, is also typically categorized as non-renewable. Figure 02 is a pictorial representation of fossil fuels vs. renewable energy.
 Figure 02: Non-renewable vs. Renewable Energy
Solar Energy
Solar energy is simply power from the sun, captured and converted into usable electricity or heat using technologies like solar cells or solar panels, providing a clean, renewable energy source for homes, businesses, and devices. It harnesses sunlight (photons) and turns it into electrical charges that flow as electricity, offering a sustainable alternative to fossil fuels.
Solar Power
Electricity generated from solar energy through the use of solar panels is called solar power.
Solar Cell
A solar cell, also known as a photovoltaic (PV) cell, is a device that converts sunlight directly into electricity via the photovoltaic effect.
Solar Panel
A collection of solar cells joined together to produce more power is called a solar panel, sometimes referred to as a module. They consist of numerous individual solar cells, usually between 36 and 72 per panel. In other words, a solar panel is created by connecting the cells in a particular way [9].
Solar Irradiance
Solar irradiance is the instantaneous power per unit area received from the Sun in the form of electromagnetic radiation, typically measured in Watts per square meter (W/m²). It represents the intensity of sunlight at a specific moment and location, crucial for calculating solar energy production [10].
Solar Radiation:
Solar radiation is the total solar energy received over time. It can be turned into different forms of energy [10].
Why Solar Power?
- Solar power uses energy from the sun
- It does not produce pollution or greenhouse gases
- Solar panels can be installed on rooftops
- Solar energy helps reduce electricity bills and carbon emissions
Working Principle of Solar Power:
- The Sun sends solar energy (sunlight) to the Earth.
- Solar panels absorb sunlight and convert it into direct current (DC) electricity using photovoltaic (PV) cells.
- An inverter converts DC electricity into alternating current (AC) power that homes and buildings can use.
- The electricity then powers lights, appliances, and other electrical devices.
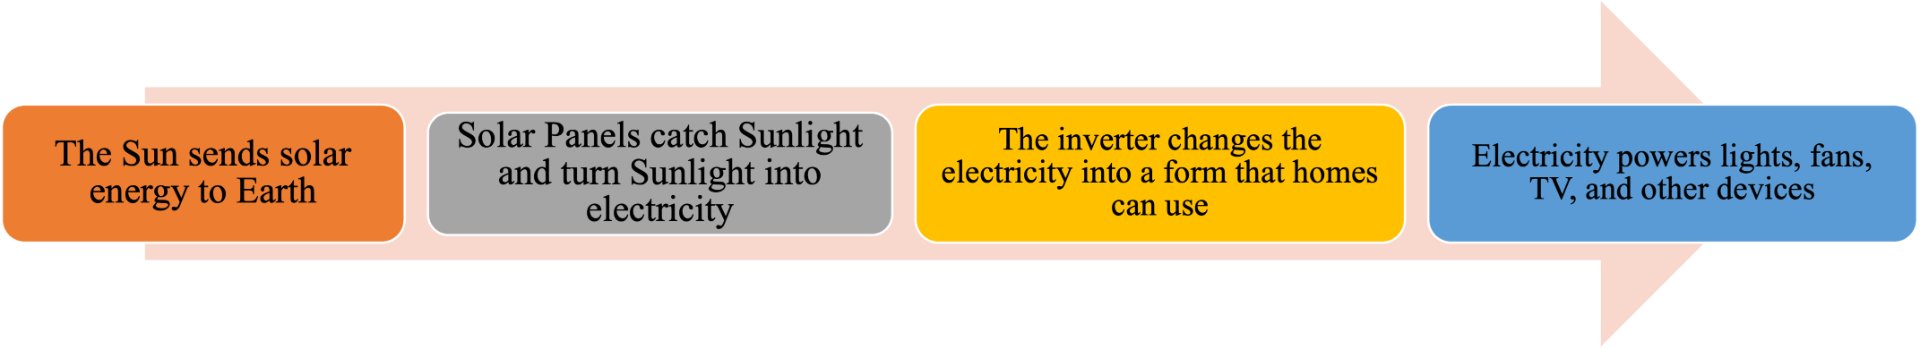 Figure 03: Flowchart for the Working Principle of Solar Power
The real working principle of solar power is also illustrated in Figure 4.
 Figure 04: Working Principle of Solar Power
Geographical Factors Affecting Solar Energy in Calgary
Nowadays, many countries are using solar electricity to cut down on their reliance on fossil fuels and the effects of climate change. However, many people think that solar energy might not work well in northern places like Canada because of snow, clouds, and reduced hours of daylight in the winter.
Although Calgary, Alberta, has long winters, it is still one of the most sunniest cities in Canada. Therefore, it is necessary to conduct data analysis to determine the feasibility of using solar energy for year-round electricity production in Calgary [11].
I have illustrated some geographical factors that affect Calgary's solar power potential in Figure 05. Several geographic and environmental factors influence Calgary's solar energy availability, determining how much sunlight reaches solar panels throughout the year. 
Figure 05: Geographical Factors that Affect Solar Power Potential
Latitude:
- Calgary is located at about 51° North latitude.
- This gives Calgary longer daylight hours in the summer.
- Longer days mean more time for solar panels to produce electricity.
Elevation:
- 1045 m above sea level
- Higher elevation means a thinner atmosphere; less sunlight is absorbed.
- More sunlight reaches the solar panel in higher-altitude cities than in lower-altitude cities.
Other Factors:
- The angle of the sun,
- The length of the day,
- The time of year,
- The amount of clouds
These factors also affect the sun's strength and duration at different times of the year. The amount of solar energy available in the summer and winter is very different because of the seasons.
Renewable Energy Trend in Calgary
Alberta produces its electricity from various energy sources. Wind and solar energy are examples of renewable sources because they come from natural resources that don't run out. Coal and natural gas are both producers of thermal energy, which releases more carbon dioxide (CO₂). Figure 06 depicts the growth of renewable electricity capacity in Alberta from 2015 to 2024. According to the graph in 2015, renewable energy accounted for around 18% of Alberta's electricity, which went up to nearly 38% by 2024. This shows that renewable energy production has doubled in less than ten years. Much of this rapid growth occurred after the construction of more wind turbines and solar panels in 2021.
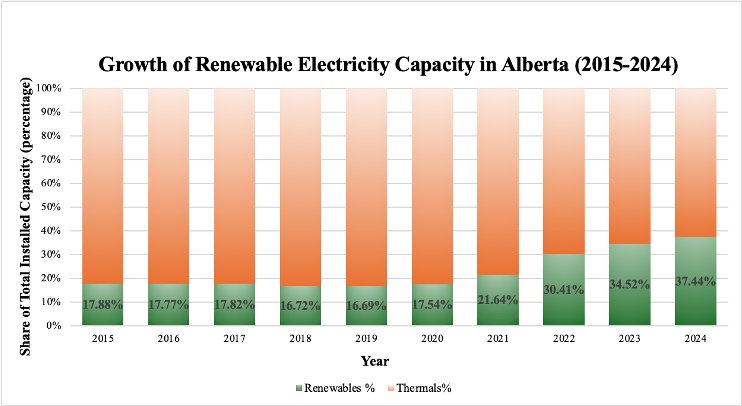 Figure 06: Growth of Renewable Electricity Capacity In Alberta (2015-2024)
From Figure 06, we can understand that thermal energy is still the biggest source of electricity in Alberta, but it is slowly moving toward using cleaner energy sources. Figure 07 demonstrates the projection of the renewable electricity share in Alberta. To do the projection, a simple linear trend method has been utilized. Based on data from 2015 to 2024, this graph shows that by 2030, renewable energy might make up around 46% of Alberta's total electricity supply, which is almost half of what the province uses.
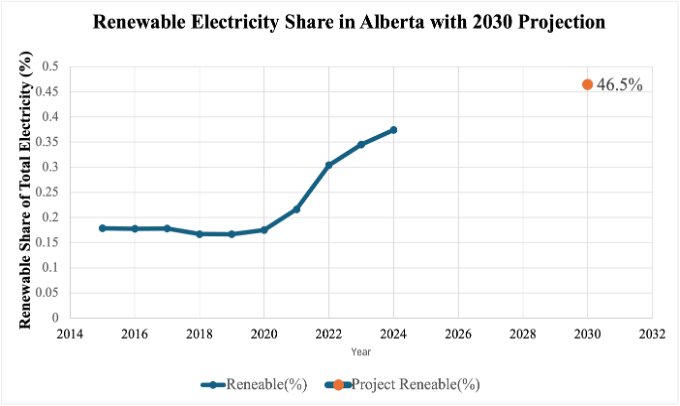 Figure 07: Renewable Electricity Share in Alberta with 2030 Projection
Using more renewable energy helps to lower carbon emissions, makes the air cleaner, and helps fight climate change. The energy mix in Alberta is obviously evolving toward a future that is cleaner and more sustainable.
Data
Data Sources
In this project, I used real scientific and government datasets to analyze solar energy potential and electricity trends in Calgary, Alberta.
The primary solar data was collected from the NASA POWER database, which provides satellite-based solar irradiance and meteorological information globally. This dataset includes hourly and daily solar irradiance measurements, allowing the analysis of sunlight intensity throughout various times of day and seasons. The official source of NASA power is as follows: NASA Power To understand the trend of renewable energy in Alberta, electricity generation data was collected from Statistics Canada, which is the primary source of national energy data. These data helped analyze how renewable energy capacity has grown compared to electricity generated from fossil fuels. The official source of Statistics Canada is as follows: Statistics Canada The following table summarizes the primary datasets used to analyze solar energy potential in Calgary and electricity generation trends in Alberta.
| NASA Power | Statistics Canada |
|---|---|
|
|
|
|
|
|
Data Processing and Preparation:
After data collection, several processing steps were performed:
- Raw solar irradiance data were organized into hourly, monthly, and seasonal averages
- Monthly averages were calculated to identify seasonal trends.
- Seasonal grouping allowed comparison between winter, spring, summer, and fall energy levels.
- Hourly patterns were analyzed to determine when sunlight is strongest during the day.
Monthly Solar Irradiance Analysis:
The average monthly solar irradiance in Calgary varies significantly from season to season. The sun's angle, day length, and yearly weather changes are the main reasons. The 2024 dataset indicates that irradiance levels rise consistently from late winter to spring, peak in the summer, and then slowly fall in the autumn and winter. My data analysis shows that solar irradiance is maximum in July, when it reaches about 270 W/m². This is also when the days are longest, and the sun angles are largest. June also has comparable high levels of irradiance, which shows that early and mid-summer are the best times for solar power production. On the other hand, December has the lowest irradiance levels, with an average sunshine strength of only 35 W/m² since the days are shorter and the sun is lower in the sky. To evaluate the solar energy potential in Calgary, irradiance levels were categorized into solar potential classes. The following table shows the solar irradiance level and the respective solar potential. To evaluate the solar energy potential in Calgary, irradiance levels were categorized into solar potential classes. The following table shows the solar irradiance level and the respective solar potential.
| Average Solar Irradiance (W/m²) | Solar Potential |
|---|---|
| < 75 W/m² | Poor |
| 75 – 150 W/m² | Low–Moderate |
| 150 – 250 W/m² | Good |
| > 250 W/m² | Excellent |
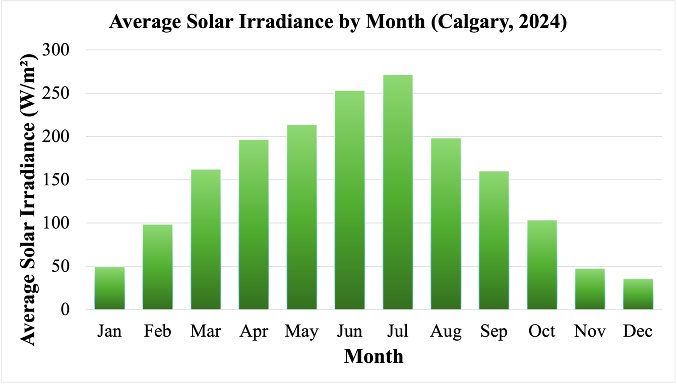 Figure 08: Average Solar Irradiance by Month (Calgary, 2024).
The following are the key findings from the monthly solar irradiance analysis:
- Solar irradiance peaks in July (\~270 W/m²)
- The lowest values occur in December (\~35 W/m²)
- Summer solar energy in Calgary is approximately 5 times higher than in winter.
Seasonal Solar Irradiance Analysis:
The seasonal solar irradiance pattern shows that summer has about four times as much usable solar energy as winter. In the summer, the sun angle is higher, and the days are longer, which means that more energy is received each day.
This change in the seasons make it clear that we need to store energy or assist the system to make sure we have a dependable supply of electricity all year. I have demonstrated the seasonal solar irradiance pattern in the Figure 09.
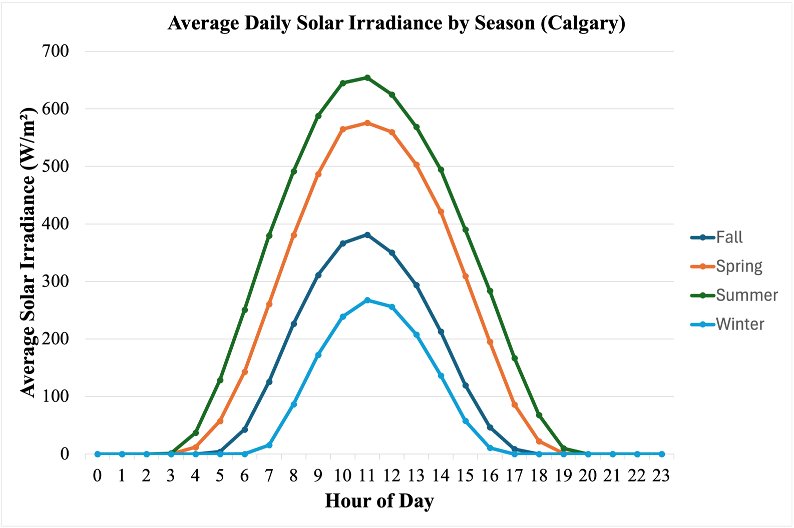 Figure 09: Average Daily Solar Irradiance by Season (Calgary, 2024)
The key findings from the seasonal solar irradiance analysis are as follows:
- Summer exhibits the highest solar irradiance, peaking at approximately 650 W/m² around noon (11:00–12:00 PM).
- Spring has the second-highest irradiance, making it another strong season for solar power generation.
- The summer curve is both taller and wider, indicating higher solar intensity and longer daylight duration, which together produce the greatest total daily solar energy.
Hourly Solar Irradiance Analysis:
I have analyzed the heatmap to understand how solar energy changes throughout the year. A heat map is important because it allows us to see large amounts of data clearly and quickly. Instead of looking at thousands of numbers in a table, the heat map uses colors to show patterns. Brighter or greener colors represent stronger sunlight, while darker or redder colors represent weaker sunlight. This visual method helps identify:
- The best hours of the day for solar energy production
- The strongest months for solar power
- Seasonal differences in sunlight intensity
- Daily sunlight variation patterns
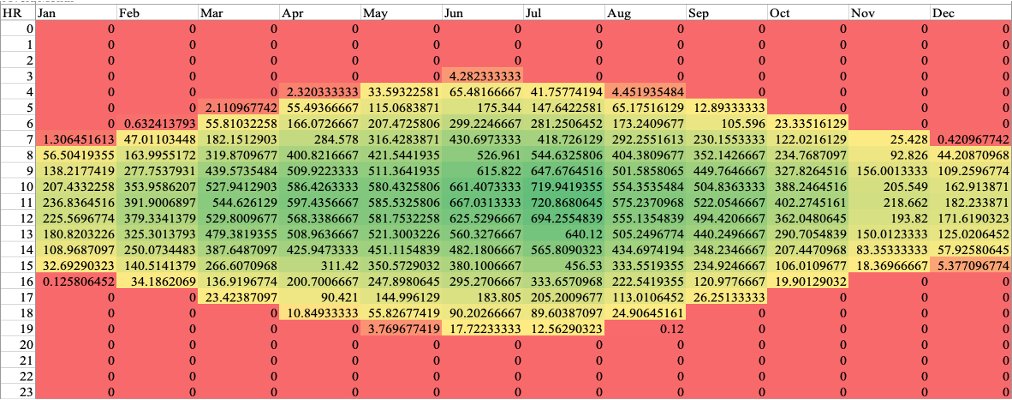 Figure 10: Heat map by Month & Hour (Calgary, 2924)
Figure 10 is showing how strong sunlight is per hour and month in Calgary (2024). Brighter colors mean stronger sunlight. I have summarized the key findings from this heatmap in the following:
Figure 10: Heat map by Month & Hour (Calgary, 2924)
Figure 10 is showing how strong sunlight is per hour and month in Calgary (2024). Brighter colors mean stronger sunlight. I have summarized the key findings from this heatmap in the following:
- Strongest sunlight: June–July (10 AM – 2 PM)
- Weakest sunlight: Winter mornings & evenings
- Best daily time for solar power: Midday
- Best months for solar panels: April–September
Cloud Analysis
To better understand how the weather affects solar power generation in Calgary, I looked at daily sunlight conditions using solar irradiance data. For this analysis, each day was classified based on the solar irradiance level. I have summarized the classification of daily solar conditions in the following table:
| Category | Solar Irradiance Range (W/m²) |
|---|---|
| Cloudy | < 120 W/m² |
| Partly Sunny | 120 – 199 W/m² |
| Sunny | ≥ 200 W/m² |
Figure 11 is a pie chart that demonstrates the percentage of Cloudy, Partly Sunny, and Sunny Days in Calgary (2024)
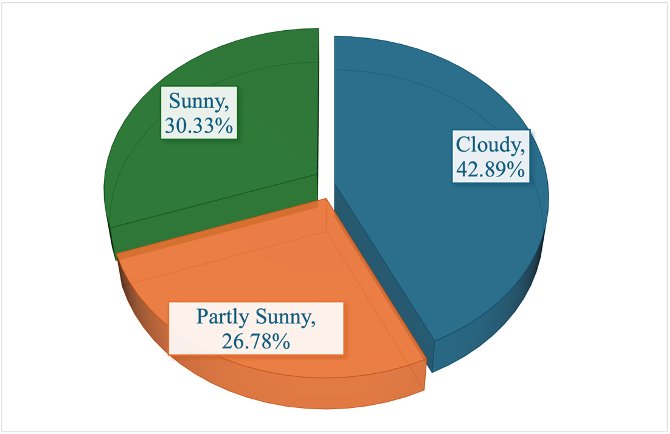 Figure 11: Percentage of Cloudy, Partly Sunny, and Sunny Days in Calgary (2024)
The following are my key findings from the cloud analysis
Figure 11: Percentage of Cloudy, Partly Sunny, and Sunny Days in Calgary (2024)
The following are my key findings from the cloud analysis
- 30.33% of days are sunny, providing strong conditions for high solar electricity generation.
- 26.78% of days are partly sunny, offering moderate but usable solar potential.
- Overall, 57.11% of days (sunny + partly sunny) are suitable for effective solar power generation.
Therefore, it can be concluded that although Calgary experiences a high number of cloudy days, more than half of the year offers usable solar conditions, confirming that solar power remains technically viable when combined with energy storage and grid integration.
Solar Energy Conversion:
In this part of my research, I wanted to find out how much usable energy Calgary gets. Therefore, I converted the monthly solar irradiance (in W/m²) into solar radiation (in kWh/m²). At first, I converted the monthly average solar irradiance into daily solar radiation using the formula:
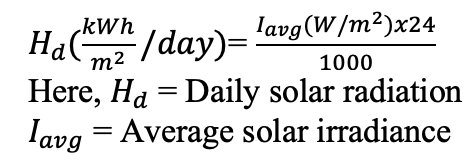 And then I have converted the daily solar radiation into monthly solar radiation or solar energy by using the following equation:
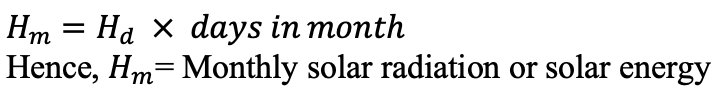 The following table shows how monthly solar irradiance was converted into total monthly solar energy:
| Month | Monthly Average Solar Irradiance (W/m²) | Monthly Solar Radiation or Solar Energy (kWh/m²/month) |
|---|---|---|
| January | 49.52 | 36.84 |
| February | 98.53 | 68.58 |
| March | 162.33 | 120.77 |
| April | 196.65 | 141.59 |
| May | 213.69 | 158.99 |
| June | 253.39 | 182.44 |
| July | 271.68 | 202.13 |
| August | 198.33 | 147.56 |
| September | 160.10 | 115.27 |
| October | 103.52 | 77.02 |
| November | 47.67 | 34.32 |
| December | 35.79 | 26.63 |
From the above table, we can conclude that Calgary receives 1,312.14 kWh of solar energy per m² per year.
Energy Production from a Residential Solar System
The next step of my project was to determine how much electricity a residential solar system could produce from this sunlight. I have used the following equation to find it out:
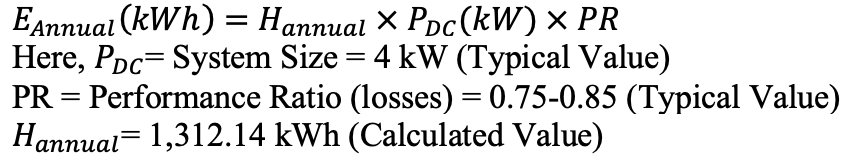 Using the above formula, the annual estimated electricity production is
 from a 4 kW residential solar system.
Why Was a 4 kW System Selected?
A 4 kW solar system means it can produce a maximum of 4 kilowatts (4,000 watts) of electricity under ideal sunlight conditions. Kilowatt (kW) measures power, or how much electricity can be produced at one moment. A 4 kW system was chosen for the following reasons:
- It represents a common residential rooftop solar system size.
- It is suitable for a small- to medium-sized home.
- It produces a realistic amount of electricity for a family.
How Many Solar Panels Are Needed for 4 kW?
Most modern solar panels produce about 400 watts per panel.
To calculate the number of panels:
 So, approximately 10 solar panels are needed to build a 4 kW solar system.
Environmental Impact (Carbon Savings)
To understand the environmental benefit, electricity production was multiplied by Alberta’s grid emission factor (0.54 kg CO₂ per kWh).
 This equals approximately 2.5 tons of carbon dioxide saved each year.
Conclusion
Conclusion:
- Calgary receives enough sunlight to support solar power generation.
- Solar energy is highest in summer (June–July) and lowest in winter.
- More than 57% of days are sunny or partly sunny.
- A 4 kW home solar system can produce about 4,200 kWh per year.
- This can reduce about 2.5 tons of CO₂ each year.
My final answer to my research question is ... Yes—solar power is a realistic, clean, and reliable energy solution for Calgary, especially from spring to fall when sunlight is strongest
Novelty of My Project
I not only analyzed solar irradiance patterns in Calgary using actual solar and meteorological data for my project, but also
- Predicted renewable energy trend in Alberta
- Turned sunlight data into actual electrical generation
- Predicted performance of solar systems in homes
- Calculated environmental benefits (lowering CO₂ levels)
Real-World Benefits of My Project
- Helps Calgary switch to renewable energy
- Reduces reliance on fossil fuels
- Reduces pollutants and carbon emissions in the environment
- Encourages sustainable energy planning for the future
Recommendation
- Install rooftop solar panels to use free sunlight.
- Use battery storage to save extra summer energy.
- Stay connected to the electric grid for winter backup.
- Build more renewable energy projects in Calgary, Alberta.
Future Scope
- Study battery storage for winter energy use
- Use Artificial Intelligence (AI) to predict solar energy production
- Calculate household electricity cost savings
- Expand the study to other cold-climate cities in Canada
Citations
- “Solar Energy,” https://www.calgary.ca, 2024. https://www.calgary.ca/environment/policies/solar-energy.html
- “Solar Panels In Alberta: How Do They Work? | Empower Energy Solar\,” Empower Energy Solar, Jul. 2021. https://empowerenergysolar.ca/solar-panels-in-alberta-how-do-they-work/ (accessed Mar. 04, 2026).
- NASA Langley Research Center (LaRC) POWER Project. Surface meteorology and solar energy data for Calgary, Canada. https://power.larc.nasa.gov/
- Statistics Canada. Electricity generation and installed capacity by fuel type, Alberta. Government of Canada. https://www.statcan.gc.ca/
- IEA, “Solar PV,” International Energy Agency, 2023. https://www.iea.org/energy-system/renewables/solar-pv
- O. Ellabban, H. Abu-Rub, and F. Blaabjerg, “Renewable energy resources: Current status, future prospects and their enabling technology,” Renewable and Sustainable Energy Reviews, vol. 39, no. 39, pp. 748–764, Nov. 2014, doi: https://doi.org/10.1016/j.rser.2014.07.113.
- IRENA, “International Renewable Energy Agency (IRENA),” Irena.org, 2023. https://www.irena.org/
- “Home - Energy Explained, Your Guide To Understanding Energy - Energy Information Administration,” Eia.gov, 2017. https://www.eia.gov/energyexplained/
- Sunrun. (2018\, May 4). Solar Module - Definition | Solar Terms | Sunrun. Sunrun. https://www.sunrun.com/go-solar-center/solar terms/definition/solar-module
- Alternative Energy Tutorials. (n.d.). Solar Irradiance and Solar Irradiation—An Overview. Alternative Energy Tutorials. https://www.alternative-energy tutorials.com/solar-power/solar-irradiance.html
- Environment and Climate Change Canada, “Historical Climate Data - Climate - Environment and Climate Change Canada,” Weather.gc.ca, 2019. https://climate.weather.gc.ca/
- The Environmental Benefits of Solar Energy: Cleaner Air and Water - Aztech Solar. (2023, August 1). https://www.aztechsolar.com.au/the environmental-benefits-of-solar-energy-cleaner-air-and-water/
- Solar\, C. (2024\, July 18). How Solar Panels Can Help Reduce High Electric Bills: Discover Why Your Power Bill is to High. CMI Solar | Solar Panel Installations across Canada. https://www.cmisolar.ca/2024/07/18/how-solar-panels-can-help-reduce-high-electric
- Solar, R. (2024, August 31). How Solar Energy Contributes in Reducing Air Pollution? Rayzonsolar.com; Rayzon Solar. https://rayzonsolar.com/blog/solar-energy-reduces-air-pollution-sustainable-future
- energize-solar-admin. (2024, May 29). Energize Solar. Energize Solar. https://energize-solar.co.uk/the-environmental-impact-of-solar-panels/
Acknowledgement
- Thank you to my science teacher, Ms. Tan for helping me with my ethics form
- Thank you to the science fair corresponder, Mr. DeGelder who guided me and told me what to do
- Thank you to my mom and my aunt for helping me do my project
- Thank you to my uncle for helping me understand some key concepts related to this project