Glow with the Flow: Using a Convolution Neural Network to assess Photoplethysmography Imaging
Grade 11
Presentation
No video provided
Problem
Cardiovascular Disease: One of the world's leading cause of death
Cardiovascular Disease (CVD) is one of the world’s most pressing public health issues, with CVD accounting for over 930,000 deaths in the United States in 2021. On average, someone dies of CVD every 34 seconds in the United States. In Canada, approximately 1 in 12 Canadian adults aged 20 and over (2.6 million people) live with diagnosed heart disease, and is the second leading cause of death in Canada. These sobering statistics underline the fact that despite medical advancements, many cardiovascular conditions go undiagnosed until serious events occur. The financial burden of treating advanced cardiovascular conditions is substantial, with congestive heart failure alone consuming more than $30 billion annually in healthcare expenditures in the United States. Early detection represents a critical intervention point, potentially preventing progression to life-threatening stages, yet significant technological gaps exist in primary care screening capabilities. My project attempts to test emerging technologies such as photoplethysmography (PPG) to show promising potential to revolutionize cardiovascular assessment through non-invasive methods that can detect subtle vascular changes before symptoms manifest.
Cardiovascular disease encompasses a broad spectrum of conditions affecting the heart and blood vessels, with widespread physiological implications extending beyond the cardiovascular system itself. CVD is often associated with the build up of fatty deposits inside the arteries, known as atherosclerosis, which increases the risk of blood clots and can lead to serious health complications. This progressive disease can damage arteries in vital organs including the brain, heart, kidneys, and eyes. The pervasive nature of cardiovascular damage makes CVD one of the main causes of death and disability in developed nations, though research consistently shows that it can often be largely prevented through healthy lifestyle choices and early medical intervention.
Photoplethusmoghraphy: The potential solution to misdiagnosis and early screening?
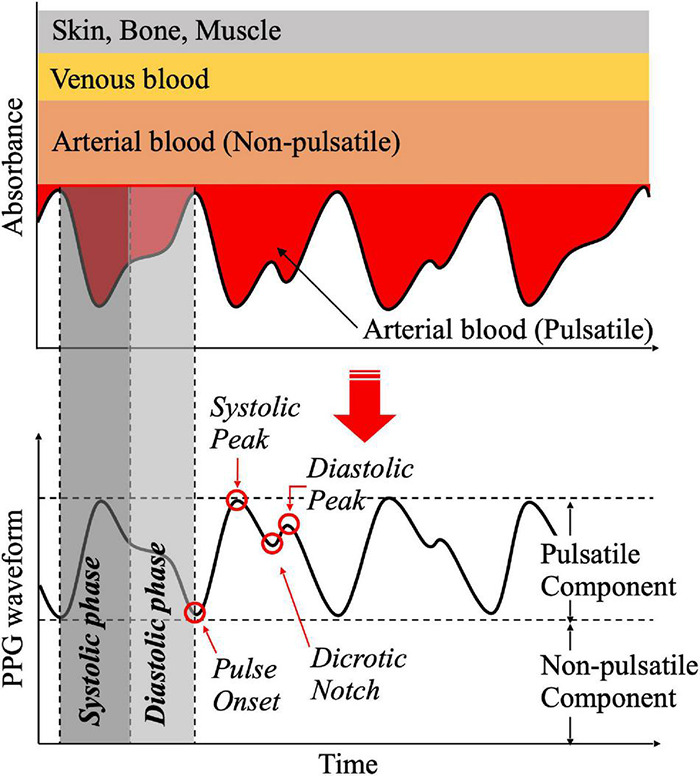
Photoplethysmography (PPG) is a non-invasive optical technique used to detect blood volume changes in the microvascular bed of tissue. It operates by illuminating the skin with light and measuring the amount of light either transmitted or reflected to a photodetector. The PPG waveform comprises a pulsatile ('AC') physiological component attributed to cardiac synchronous changes in the blood volume with each heartbeat, and a slowly varying ('DC') component with various lower frequency components attributed to respiration, sympathetic nervous system activity, and thermoregulation. This simple and low-cost optical technique provides valuable information about the cardiovascular system and has found widespread clinical application. PPG is commonly used in pulse oximeters to measure blood oxygen saturation and is increasingly being explored for applications such as heart rate monitoring, blood pressure estimation, and assessment of vascular health.
Hypertension: The Silent Epidemic
Hypertension remains one of the most prevalent cardiovascular conditions globally, affecting over 1.28 billion adults worldwide. Despite its prevalence, hypertension often goes undetected until significant damage has occurred, earning its reputation as the "silent killer." Hypertension is characterized by persistently elevated pressure of blood against arterial walls, leading to progressive damage to the cardiovascular system and target organs. This condition involves complex interactions between genetic predisposition, environmental factors, and regulatory systems including the renin-angiotensin-aldosterone system and sympathetic nervous system. Prolonged hypertension results in arterial stiffening, left ventricular hypertrophy, and damage to critical organs including the kidneys, brain, and eyes.
The clinical classification of hypertension includes:
-
Normal: Systolic <120 mmHg and Diastolic <80 mmHg
-
Elevated: Systolic 120-129 mmHg and Diastolic <80 mmHg
-
Stage 1 Hypertension: Systolic 130-139 mmHg or Diastolic 80-89 mmHg
-
Stage 2 Hypertension: Systolic ≥140 mmHg or Diastolic ≥90 mmHg
-
Hypertensive Crisis: Systolic >180 mmHg and/or Diastolic >120 mmHg
Photoplethysmography offers significant advantages for blood pressure monitoring compared to conventional methods. Traditional blood pressure measurement provides only intermittent readings and often requires specialized equipment and training. In contrast, PPG technology enables continuous, non-invasive monitoring through optical sensors that can be integrated into wearable devices.
Recent research indicates that PPG signals contain valuable hemodynamic information that correlates with blood pressure. The PPG waveform includes features that change with varying blood pressure, such as:
-
Pulse wave velocity and transit time
-
Dicrotic notch position and amplitude
-
Area under the curve of the pulse wave
-
Systolic upstroke time and diastolic time
The PPG signal represents an aggregated expression of many physiological processes in the cardiovascular circulation system, making it ideal for blood pressure estimation.

Using PPG, we can measure the pressure of the heartrate using the (Area Under Curve) method and therefore determine the blood pressure of the patient.
Atrial Fibrillation: Irregular Rhythms and Stroke Risk
Atrial fibrillation (AF) is the most common sustained cardiac arrhythmia, affecting approximately 33.5 million people globally. This condition significantly increases stroke risk and contributes to heart failure and reduced quality of life.
Atrial fibrillation occurs when disorganized electrical signals cause the atria to quiver rather than contract effectively. This disruption leads to irregular ventricular responses and compromised cardiac output. The pathophysiology involves complex structural and electrical remodeling of the atrial tissue, often triggered by underlying cardiovascular conditions including hypertension, valvular disease, and heart failure.
AF is typically classified into:
-
Paroxysmal: Episodes that terminate spontaneously within 7 days
-
Persistent: Episodes lasting longer than 7 days or requiring intervention
-
Long-standing persistent: Continuous AF lasting more than 12 months
-
Permanent: AF accepted by patient and physician with no further rhythm control attempts
Traditional AF detection relies primarily on electrocardiography (ECG), which presents limitations including brief recording durations, cumbersome equipment, and limited accessibility for continuous monitoring. These challenges contribute to significant underdiagnosis, with estimates suggesting that up to 30% of AF cases remain undetected.
Photoplethysmography offers an accessible alternative for AF screening through detection of pulse rhythm irregularity. The PPG signal reflects cardiac cycle timing through pulsatile blood volume changes, enabling analysis of:
-
Beat-to-beat interval variability
-
Pulse amplitude inconsistency
-
Pulse waveform morphology variations

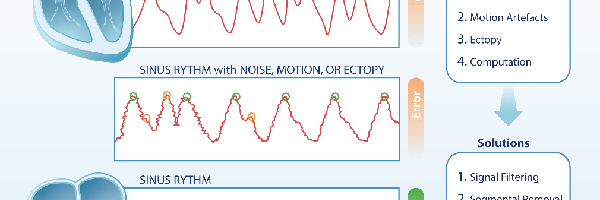
Examples of how Atrial Fibrillation affects the PPG waveform.
Anxiety and Cardiovascular Function: The Psychophysiological Connection
Anxiety and cardiovascular health share bidirectional relationships, with each influencing the other through multiple physiological pathways. This connection represents an important but often overlooked aspect of cardiovascular assessment.
The relationship between anxiety and cardiovascular function involves several physiological mechanisms:
-
Autonomic nervous system activation: Anxiety triggers sympathetic predominance, increasing heart rate, blood pressure, and vascular resistance
-
Hypothalamic-pituitary-adrenal axis: Chronic anxiety elevates cortisol levels, promoting inflammation and endothelial dysfunction
-
Behavioral mediators: Anxiety often leads to unhealthy behaviors that increase cardiovascular risk
-
Inflammatory processes: Anxiety states associate with pro-inflammatory markers linked to cardiovascular pathology
Research demonstrates that individuals with anxiety disorders have significantly increased risks of coronary heart disease and cardiovascular mortality, independent of traditional risk factors. Despite this importance, current anxiety assessment methods rely heavily on subjective reporting, limiting objective measurement of anxiety's cardiovascular effects.
Photoplethysmography offers potential for objective anxiety monitoring through detection of autonomic nervous system activity reflected in the PPG signal. Anxiety-related features detectable through PPG include:
-
Alterations in heart rate and heart rate variability
-
Changes in pulse amplitude reflecting peripheral vasoconstriction
-
Variations in respiratory modulation of the PPG signal
-
Subtle changes in pulse wave velocity and transit time
Method
I collected photoplethysmography (PPG) waveform data from two sources: the MIMIC database and the BUT PPG smartphone database. Each PPG record was segmented into fixed-length windows (e.g. 10-second segments) to capture short-term signal patterns. Before feature extraction or classification, each window underwent filtering to remove noise and baseline drift. I applied a 4th-order Chebyshev Type II bandpass filter roughly between 0.5 Hz and 10 Hz. This passband retains the typical heart-rate frequencies (around 1 Hz and its harmonics) while removing very low-frequency baseline wander and high-frequency noise
Chebyshev Type II Filtering:
A Chebyshev Type II filter was chosen because it provides a steep roll-off and a flat passband (no ripple in the passband), which helps eliminate motion artifacts and interference without distorting the PPG pulse shape. In fact, prior studies found a 4th-order Chebyshev Type II filter to outperform other filters for PPG signal cleaning. The general frequency response of an nth-order Chebyshev Type II filter can be expressed as:
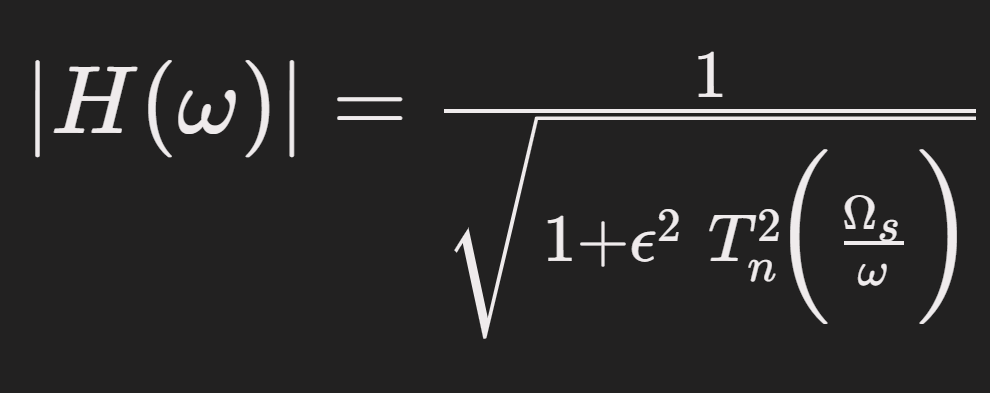
Where T_n is the Chebyshev polynomial of order n, Epsilon controls the stopband ripple, and Omega_s is the cutoff frequency defining the stopband. This equation reflects the filter’s equiripple attenuation in the stopband and minimal distortion in the passband. After bandpass filtering, we further removed any linear trend or DC offset (ensuring the baseline is zero) and normalized each segment (e.g. z-score normalization to zero mean and unit variance). This normalization helps account for differing sensor gains or contact pressures by bringing all signal amplitudes to a comparable scale.
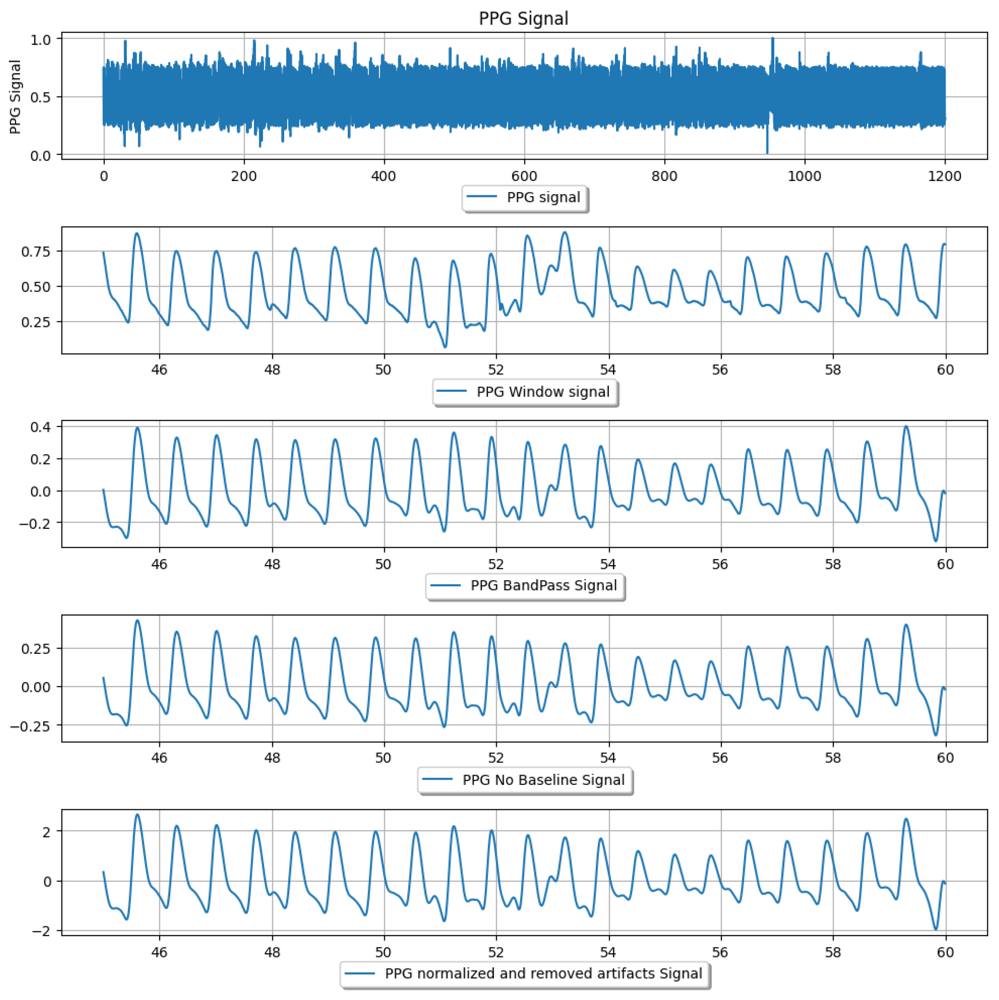
Figure 1: Example PPG signal preprocessing pipeline, showing a raw PPG segment and successive cleaning steps. From top to bottom: raw PPG signal; an extracted time window; the bandpass-filtered signal (0.5–10 Hz) with motion and high-frequency noise removed; the signal after baseline wander removal; and the final normalized PPG signal
Signal Quality Index (SQI):
To ensure the model trained on reliable data, we implemented a Signal Quality Index (SQI) check for each PPG segment. We used skewness of the PPG waveform as the primary SQI indicator, since skewness quantitatively describes the asymmetry of the pulse waveform and is sensitive to waveform distortion
Skewness is calculated as:

Where x_i are the PPG sample values in the window, mu is the mean of the window, Sigma is the standard deviation, and N is the number of samples in the window. This formula computes the third moment of the distribution of PPG amplitudes, normalized by the cube of the standard deviation, to yield a dimensionless measure of waveform asymmetry.
In a clean PPG pulse, the waveform is typically asymmetric. For example, a rapid upslope and a more gradual downslope produce a distribution with a longer tail in one direction. If the PPG signal is very noisy or flattened, it tends to become more symmetric (skewness near zero) because true pulse peaks and features are obscured. We established a skewness threshold based on observing clean vs. corrupted signals: if a segment’s skewness fell near zero (indicating an almost symmetric, likely noise-dominated waveform) or showed an abnormal value (far outside the typical range for physiological pulses), that segment was flagged as low-quality. Segments that did not meet the skewness quality criterion were excluded from training – effectively masked out so the neural network would not receive unreliable data. This step removed periods of motion artifact, sensor misalignment, or poor contact. Using skewness for SQI is supported by literature: it has been found to reflect PPG waveform quality and was even identified as an optimal index for assessing PPG signal reliability. By filtering out poor-SQI segments, we improved the overall quality of the training data, preventing the model from learning spurious patterns caused by noise.
Neural Network Model
Idesigned a 1D CNN to automatically learn features from the preprocessed PPG segments and simultaneously classify multiple health conditions. The input to the network is a one-dimensional sequence of PPG samples (the filtered and normalized window). In our implementation, the CNN consists of a stack of convolutional layers to capture waveform patterns, followed by dense layers for classification. For example, the first layer is a 1D convolution that applies multiple filters (kernels) across the time series to detect local pulse features like onsets or peaks. I used several such convolutional layers in succession (in our prototype, three conv layers were used, each with an increasing number of filters, e.g. 32, 64, 128 filters) with rectified linear unit (ReLU) activation. Each convolution layer is followed by a pooling layer (or strided convolution) to progressively reduce temporal resolution and aggregate features, which also helps make the feature extraction more invariant to slight time shifts. We also apply batch normalization to stabilize training and occasional dropout layers (e.g. 25% dropout) to prevent overfitting, given the relatively limited size of the dataset. After the final convolution/pooling stage, the extracted feature map is flattened into a feature vector. This feeds into one or more fully-connected (dense) layers (for instance, a dense layer with 128 neurons, then 64 neurons) with ReLU activation that integrate the learned features across the whole segment.
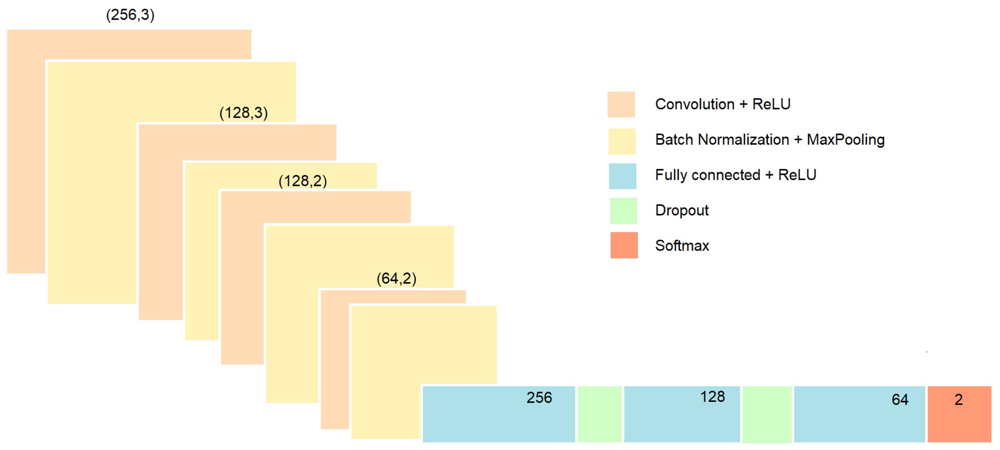
Figure 2: Example convolutional neural network (CNN) architecture for PPG signal classification. The model uses sequential 1D convolutional layers (orange blocks) with ReLU activations, each followed by batch normalization and downsampling (yellow blocks). After several convolution stages extracting temporal features, the network is flattened and passes through fully-connected layers (blue) with dropout regularization (green) to reduce overfitting. The final output layer (red) uses an appropriate activation (such as sigmoid for multi-label output) to predict the presence of each condition.
The CNN outputs predictions for three conditions – atrial fibrillation, hypertension, and anxiety – simultaneously. We formulate this as a multi-label classification problem: the last layer of the network has three output neurons, one for each condition. Each output uses a sigmoid activation to estimate the probability of that condition being present in the input segment. This design allows the model to capture correlations between conditions and share representations – for example, the network can learn general cardiovascular features from PPG that are relevant to all conditions, while the separate output nodes specialize to specific patterns of atrial fibrillation, blood pressure changes, or anxiety-induced signals. During training, we used a multi-output loss function (summing binary cross-entropy losses for each label) to adjust the network weights. A single multi-output CNN is more efficient and compact than training three separate models, and it leverages the fact that the PPG waveform features for different health states might overlap or inform each other. For instance, features indicative of stress (anxiety) might also influence blood pressure, and the model can potentially use such interrelated patterns to improve detection. We trained the CNN using the labeled dataset (with segments labeled for the presence/absence of each condition, based on clinical annotations in MIMIC or experimental labels in the BUT PPG data) using an optimizer. The model’s performance was validated to ensure it learned to correctly identify each condition from PPG input.
Blood Pressure Estimation via Area Under Curve (AUC)
Figure 3: Annotated PPG waveform (single pulse) indicating key features and areas. Important landmarks include the pulse onset, the systolic peak (highest point of the pulse wave), the dicrotic notch (a small dip following the systolic peak, marking the transition to diastolic phase), and the diastolic peak (a secondary peak or inflection during the diastolic phase). The systolic phase of the waveform (gray shaded region in example) spans from the pulse onset up to the dicrotic notch, and the diastolic phase spans from the notch to the end of the pulse. The area under the curve (AUC) can be computed separately for the systolic portion (area under the curve before the notch) and the diastolic portion (area after the notch). These sub-areas, often labeled A<sub>sys</sub> and A<sub>dia</sub>, are physiological features that correlate with blood pressure and vascular characteristics.
One of the insights used in interpreting the PPG signal for hypertension detection is the relationship between the pulse waveform’s shape (particularly the area under different parts of the pulse) and blood pressure. The PPG waveform is a surrogate of arterial blood volume changes, so its morphology carries information about cardiovascular parameters. In particular, the area under the curve (AUC) of the PPG pulse can be divided into two parts: the area under the systolic phase and the area under the diastolic phase (using the dicrotic notch as the dividing point between the two phases). These areas tend to change with hemodynamic conditions. For example, a larger systolic area (A<sub>sys</sub>) may indicate a strong pulse with higher stroke volume output, whereas the relative size of the diastolic area (A<sub>dia</sub>) can increase when the arteries are stiffer or peripheral resistance is higher. According to Park et al. (2022), the ratio of the systolic to diastolic areas – sometimes called the inflection point area ratio – is correlated with total peripheral resistance, a key factor that influences diastolic blood pressure.
In essence, if the diastolic portion of the pulse has comparatively more area (meaning the waveform doesn’t drop off quickly after the systolic peak), it suggests that the blood is flowing out more slowly due to higher resistance in the arteries; this scenario corresponds to higher diastolic blood pressure. Conversely, a smaller diastolic area relative to the systolic area might indicate lower resistance (more compliant vessels), often seen with lower blood pressure. Another feature, the total pulse area (A<sub>total</sub> = A<sub>sys</sub> + A<sub>dia</sub>), can reflect overall perfusion changes. Park et al. note that the total PPG area can change under physiological stress (for instance, it was observed to drop with the onset of surgical pain stimulus as blood distribution shifts), which ties into blood pressure and cardiac output changes.
In my project, I leveraged these relationships by allowing the CNN to learn from the waveform shape, and we also explicitly acknowledge them when interpreting the model’s decisions for hypertension. The CNN’s filters can pick up on subtle differences in the pulse shape corresponding to hypertension – effectively, the network can learn the proxy that a hypertensive pulse may have a prolonged, elevated diastolic tail (affecting the AUC). By referencing known physiology (e.g., an elevated inflection point area ratio indicating higher blood pressure, we can validate that the model’s hypertension output is grounded in real waveform characteristics and not arbitrary features. This understanding of AUC and blood pressure also guided data labeling: segments from MIMIC corresponding to high blood pressure readings are expected to show the waveform traits described above. Overall, incorporating the AUC perspective helps to bridge the gap between the black-box CNN detection and the underlying cardiovascular physiology, strengthening the explanation of how PPG signals can indicate hypertension changes.
Analysis
The Neural Network's image segmentation process has commenced, but in order to appropriately train and filter the data to iterate and provide the most accurate results, the process will take more time. I will be presenting my findings in-person at the Olympic Oval in April.
Conclusion
The Neural Network's image segmentation process has commenced, but in order to appropriately train and filter the data to iterate and provide the most accurate results, the process will take more time. I will be presenting my findings in-person at the Olympic Oval in April.
Citations
- Cardiovascular disease - NHS
- Heart Disease in Canada - Canada.ca
- More than half of U.S. adults don’t know heart disease is leading cause of death, despite 100-year reign | American Heart Association
- Smartphone-based photoplethysmographic imaging for heart rate monitoring - PubMed
- Seeing Red: PPG Biometrics Using Smartphone Cameras
- GitHub - ssloxford/seeing-red: Using PPG Obtained via Smartphone Cameras for Authentication
- Atrial fibrillation - Symptoms and causes - Mayo Clinic
- Diagnostic Performance of a Smartphone‐Based Photoplethysmographic Application for Atrial Fibrillation Screening in a Primary Care Setting | Journal of the American Heart Association
- Getting Started | MIMIC
- Weighing the Effectiveness of Photoplethysmography Signal Analysis in Population Diagnosis of Atrial Fibrillation – AFIP foundation
- https://ieee-dataport.org/documents/anxiecg-ppg-database-synchronized-ecg-and-mobile-ppg-signals-during-baseline-physical#files
- PPG-BP Database
Acknowledgement
I would like to acknowledge Mr. Manias for being a supportive and encouraging mentor throughout this process. I would also like to acknowledge my parents who supported me throughout my project.