Canmore Spring Water
Clayton Dwyer
Mount Royal School
Grade 8
Presentation
No video provided
Hypothesis
If the water quality of the spring is measured from November to March, then the flow rate will decrease while the mineral concentration (hardness and alkalinity) will increase.
As the ground freezes and surface runoff decreases during winter, the spring is fed primarily by groundwater that has had more time to dissolve minerals from the surrounding limestone bedrock. The Rockies are made up of limestone and so I expect the Hardness and Alkalinity to be high and will compare that to Calgary Tap Water.
Research
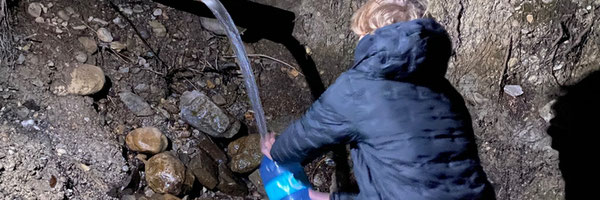
On our way to and from the mountains, for as long as I can remember, my family has always stopped at a natural spring just outside of Canmore to fill up our water bottles. My Dad and I drink the water, but my Mom has always refused to drink it for fear of getting Beaver Fever (Giardia lamblia). I wanted to test the spring water to see if it is safe and to see if the water quality changes at different times of year.
Tap water in Canada is of high quality (according to the Government of Canada). However, water in nature is not as closely regulated or pure. It picks up pieces of everything it comes into contact with including minerals, silt, vegetation, fertilizers and run-off from farms. While these substances can be harmless, they can also be dangerous especially for people who are really old, really young or already sick. Health Canada works with provinces and territories to develop guidelines that determine maximum acceptable concentrations (MACs) of other substance in drinking water.
Drinking water guidelines are only established for contaminants that meet all three of the following criteria:
- Exposure could lead to an adverse human health effect;
- The contaminant is frequently detected, or expected to be detected in drinking water supplies throughout Canada;
- The concentration detected, or expected to be detected, in drinking water is of possible human health significance.
The guidelines usually set a MAC in drinking water, which is based on scientific evidence of health effects and the likely route(s) and intensity of exposure (e.g., daily water intake). The MAC is set at a concentration that is protective of the most vulnerable persons (e.g., infants, children) and thus ensures protection of all Canadians. (NCCEH Website)
In Canada, water quality is primarily determined by the Guidelines for Canadian Drinking Water Quality, established by Health Canada. They categorize indicators into three types:
- Maximum Acceptable Concentration (MAC): Levels that could affect health.
- Aesthetic Objective (AO): Levels that affect taste, smell, or color (but not necessarily health).
- Operational Guidance (OG): Levels that help treatment plants run smoothly.
Below is a guide for the indicators I tested, specifically tailored to what you might find in a natural spring in the Rockies. I used Gemini to come up with this table. I shared the indicators I was testing and asked for a healthy range.
| Indicator | Guideline / "Healthy" Range | Category | Notes for your Project |
|---|---|---|---|
| Potability | 0 CFU/100 mL | MAC | For a spring, "potable" means zero E. coli or Total Coliforms. Natural springs often fail this without treatment! |
| pH | 7.0 – 10.5 | AO | Canmore water is often slightly alkaline (7.5–8.5) due to limestone. |
| Hardness | 80 – 100 mg/L | AO | No health limit, but >200 mg/L is "hard." Canmore springs are notoriously hard. |
| Nitrate | 10 mg/L | MAC | High levels usually suggest runoff from fertilizer or waste. |
| Nitrite | 1 mg/L | MAC | Usually tested alongside Nitrate. |
| Sulfate | ≤ 500 mg/L | AO | High levels can have a laxative effect. |
| Iron | ≤ 0.3 mg/L | AO | Prevents orange staining and "metallic" taste. |
| Manganese | 0.12 mg/L (MAC) | MAC/AO | 0.02 mg/L is the limit for taste/staining. |
| Copper | ≤ 2000 ppb (2 mg/L) | MAC | Usually comes from pipes, not the spring itself. |
| Zinc | ≤ 5.0 mg/L | AO | Prevents a "greasy" film and astringent taste. |
| Fluoride | 1.5 mg/L | MAC | Naturally occurring in Bow Valley rocks |
| Total Dissolved Solids (TDS) | ≤ 500 mg/L | AO | Linked to Conductivity. High TDS = high conductivity. |
| Hydrogen Sulfide | ≤ 0.05 mg/L | AO | This is what causes that "rotten egg" smell. |
Affect of Temperature on water quality:
https://www.canada.ca/en/health-canada/services/publications/healthy-living/guidelines-canadian-drinking-water-quality-guideline-technical-document-temperature.html
History of the Harvey Heights Canmore Spring
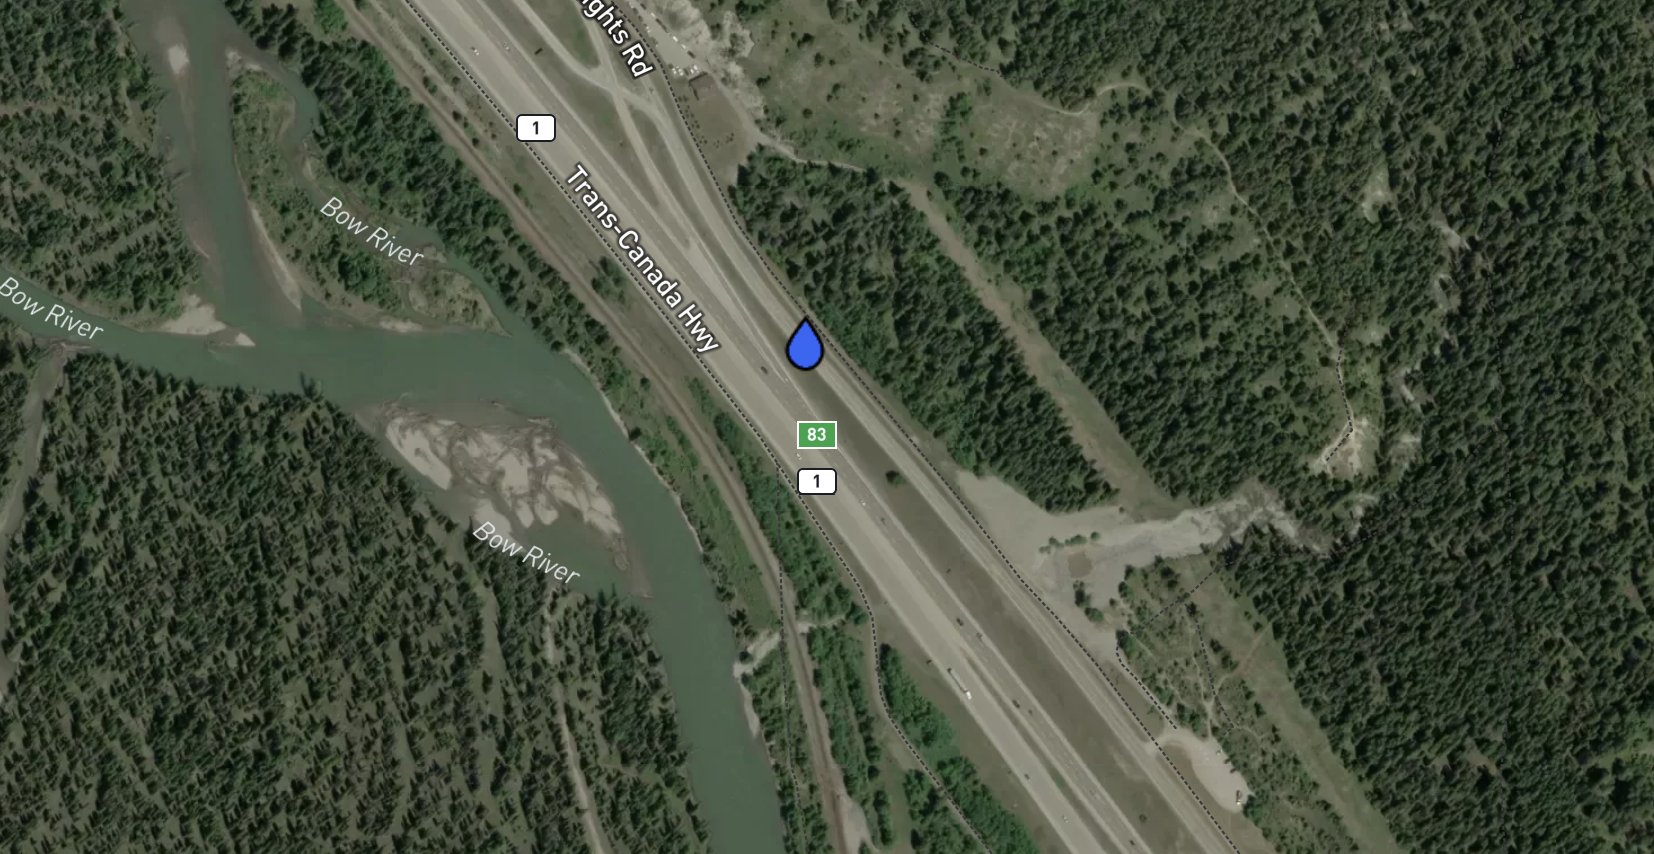
Flow of 2 springs coming out just a few steps up the hill from bike/walking path just off secondary highway beside #1. Spring GPS Coordinates: 51.11982,-115.379906
Directions:
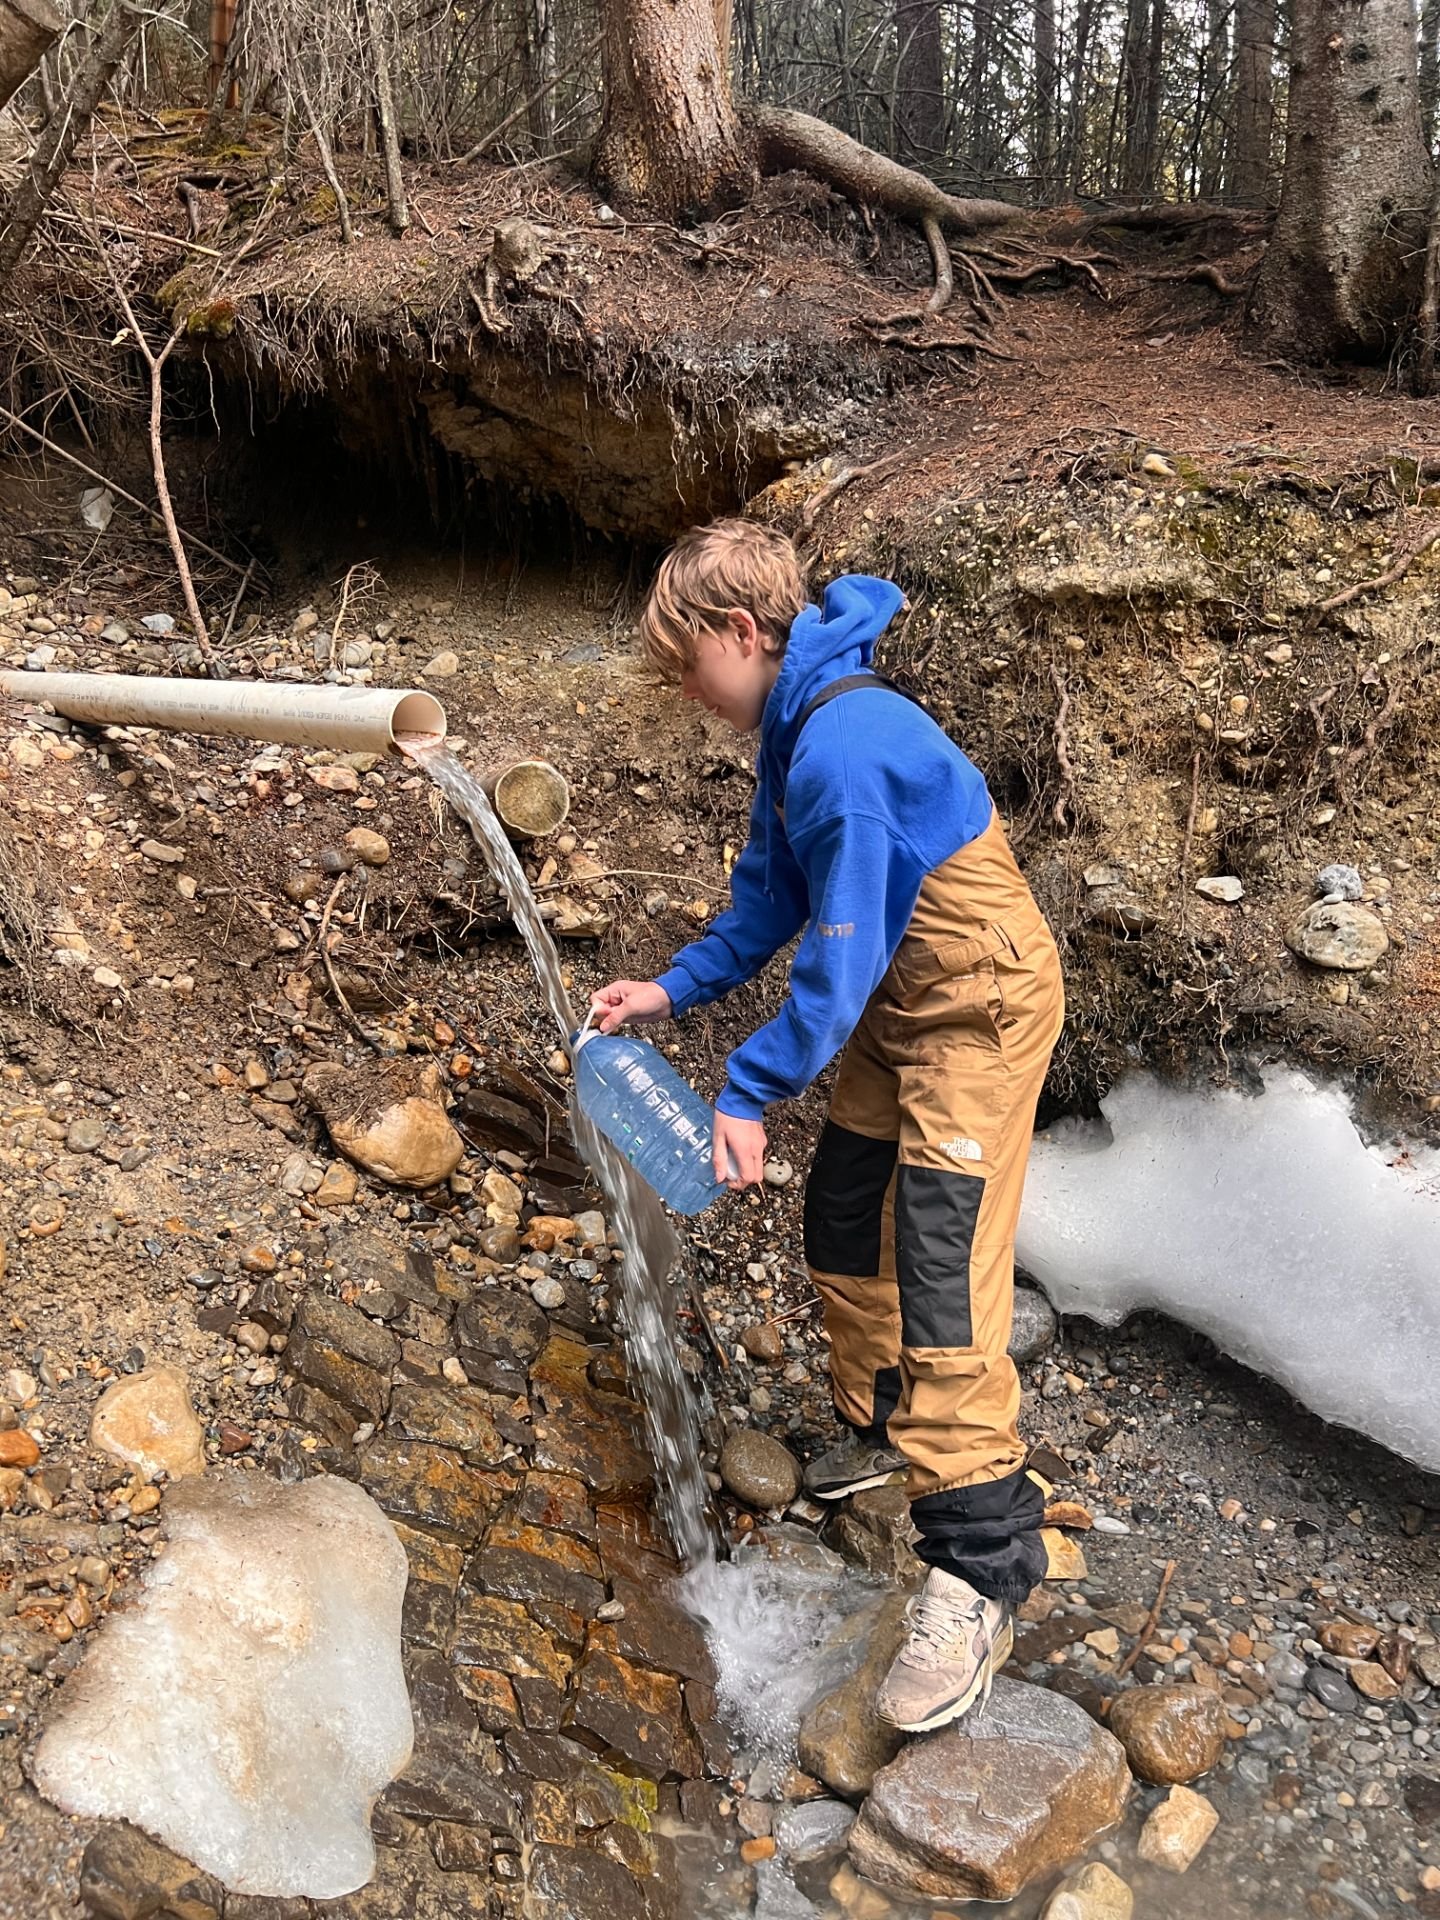
On the #1 Highway from Calgary heading West through Canmore you will take the 3rd exit (this is also the first exit you will see for Harvie Heights). This is the smaller overpass after the main large one. Immediately turn right onto the smaller side road and park right away on the curve of the small secondary road next to the bike and walking path. Venture directly into the trees next to path, from here you will be able to see and hear the flow of water. Walk through to the top of the spring where you can see it coming out of the ground. There are a couple of old pipes there. It is recommended you bring your own pipe or lean smaller bottles up against the flow.
in my research i found many online posts about the Canmore spring but could not find a certain date in witch it was installed but i found many posts from Rocky Mountain Outlook that warning people of the water sayin it is not filtered
Variables
Independent Variables:
- The Water Sources: Mountain Spring in Canmore vs. Calgary Tap Water
- The Time of Testing: Monthly intervals from November to April
Dependent Variable: Water Cleanliness
- The levels of the following chemicals; alkalinity, carbonite, PH, hydrogen sulfide, iron, coper, manganese, total and free chlorine, mercury, Quaternary Aluminum Salt, zinc, Sodium Chloride, Fluoride, Nitrate, Nitrite, Sulfate.
- Hardness
- Flowrate
- Temperature
Controlled Variables:
- Testing method: I will used the same test kit for every sample
- Collection Technique: I will use clean containers and collect from the same spot
- Storage: water will be stored for same amount of time before testing
Procedure
How do seasonal changes from late fall to early spring affect the chemical and physical properties of a natural spring near Banff? I took samples and tested the spring water over 5 months. I expected to see small variations in the mountain spring water quality due to seasonal temperature and flow rate changes but overall I expect the water quality to stay consistent to see more fluoride and nitrates (but still healthy ranges) in the spring water compared to the tap water because it has not been treated or impacted by urban runoff. I also expect to see the mountain spring water will show higher levels of hardness because it has spent more time in contact with the limestone minerals of the mountains sub-surface.
I stop at the Canmore Spring once a month to collect water samples.
- I fill up a 4L bottle and use the spring water to rinse, this water is dumped into the runoff from the spring.
- I use an iPhone stop watch and a ssecond individual to accurately time from the time the bottle is put under the spring until the time it is full.
- I repeat step 2 three times to get 3 separate flow rates that can be averaged.
- I record air temperature and water temperature and time of day before loading water sample into the car and returning to Calgary.
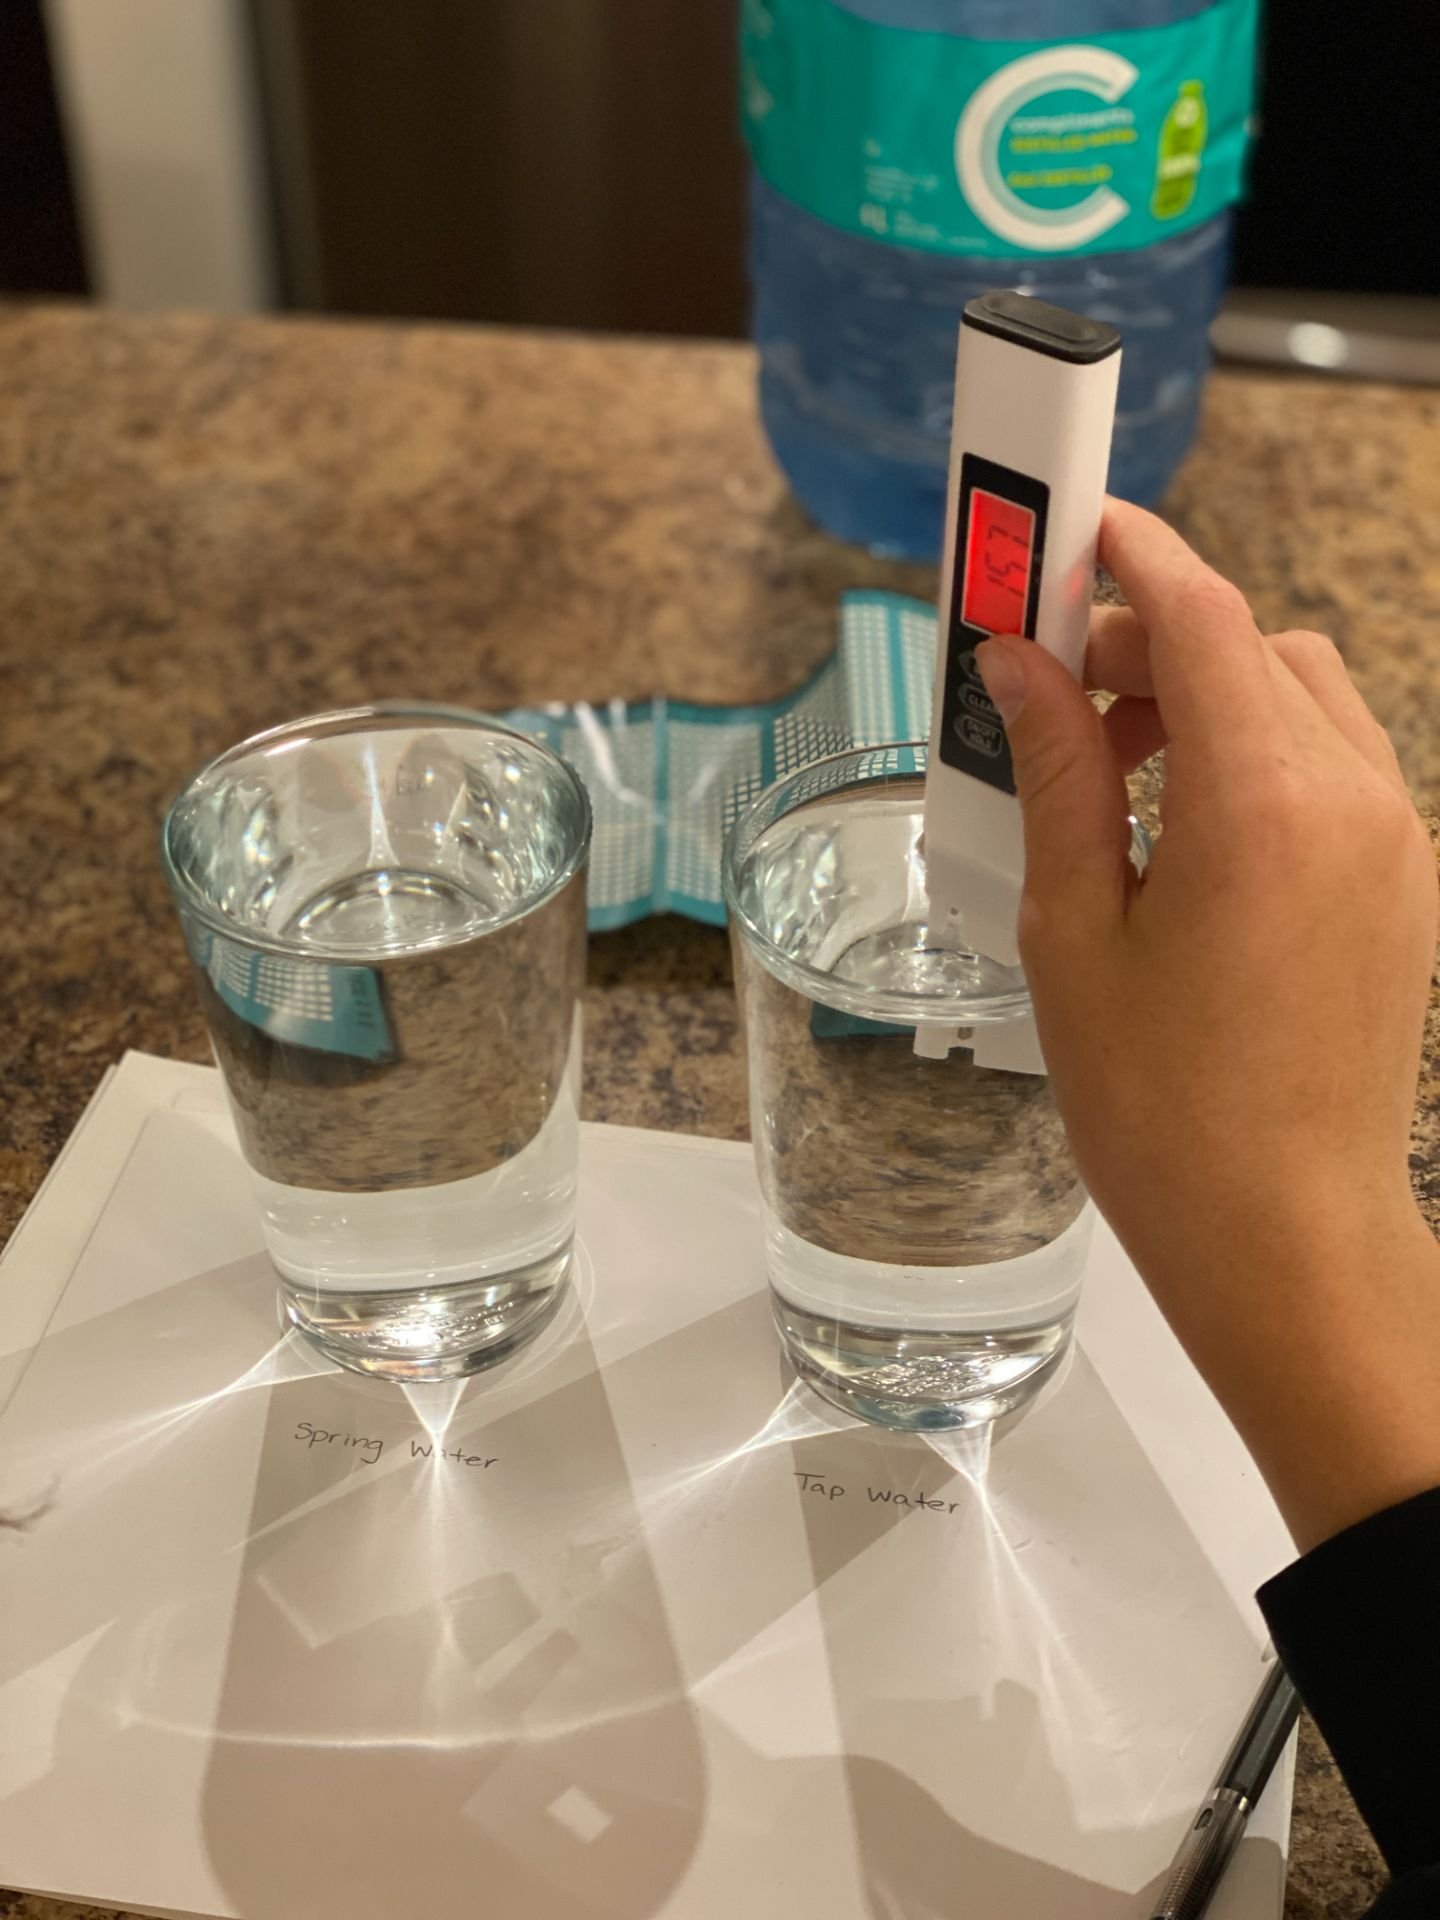
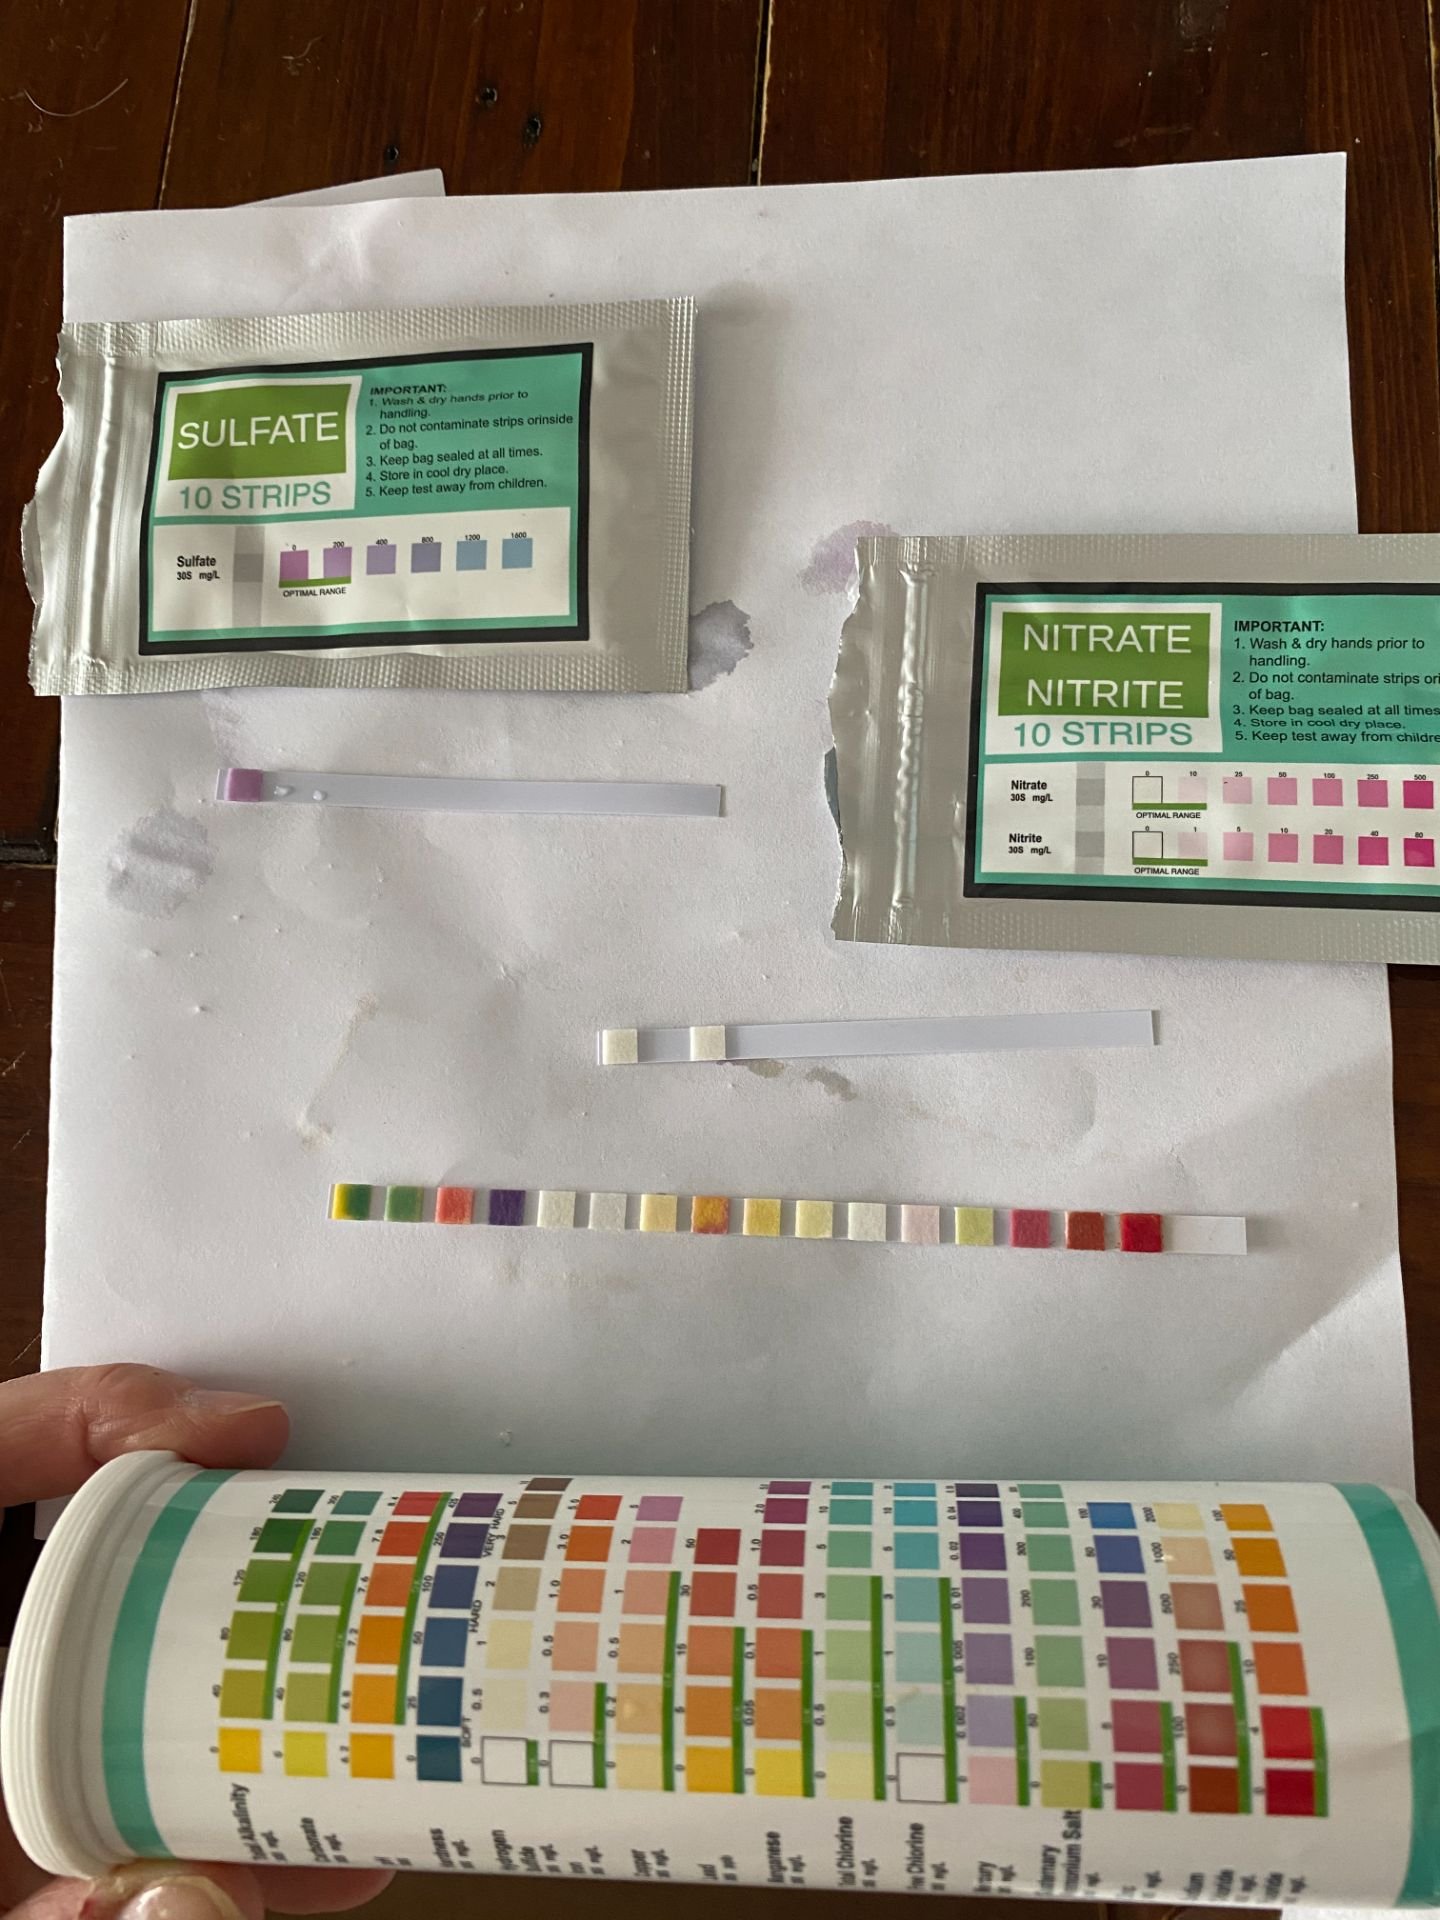
- In Calgary, I test the water using a drinking water test kit and a potability and conductivity metre. Following directions for the individual tests on the directions.
- All measurements are recorded in my Google Sheet spreadsheet and in my Google Document logbook.
Observations
In addition to quantitative testing I have sampled the water at every testing. I haven't noticed a difference in the taste of the water. The flow rate has not changed significantly. While it seems to be slowing slightly, that may be the result of testing.
Flow Rate
| 0.87 L/s | 0.79 L/s | 0.77 L/s | 0.74 L/s |
|---|---|---|---|
Analysis
Tap Water vs Spring Water
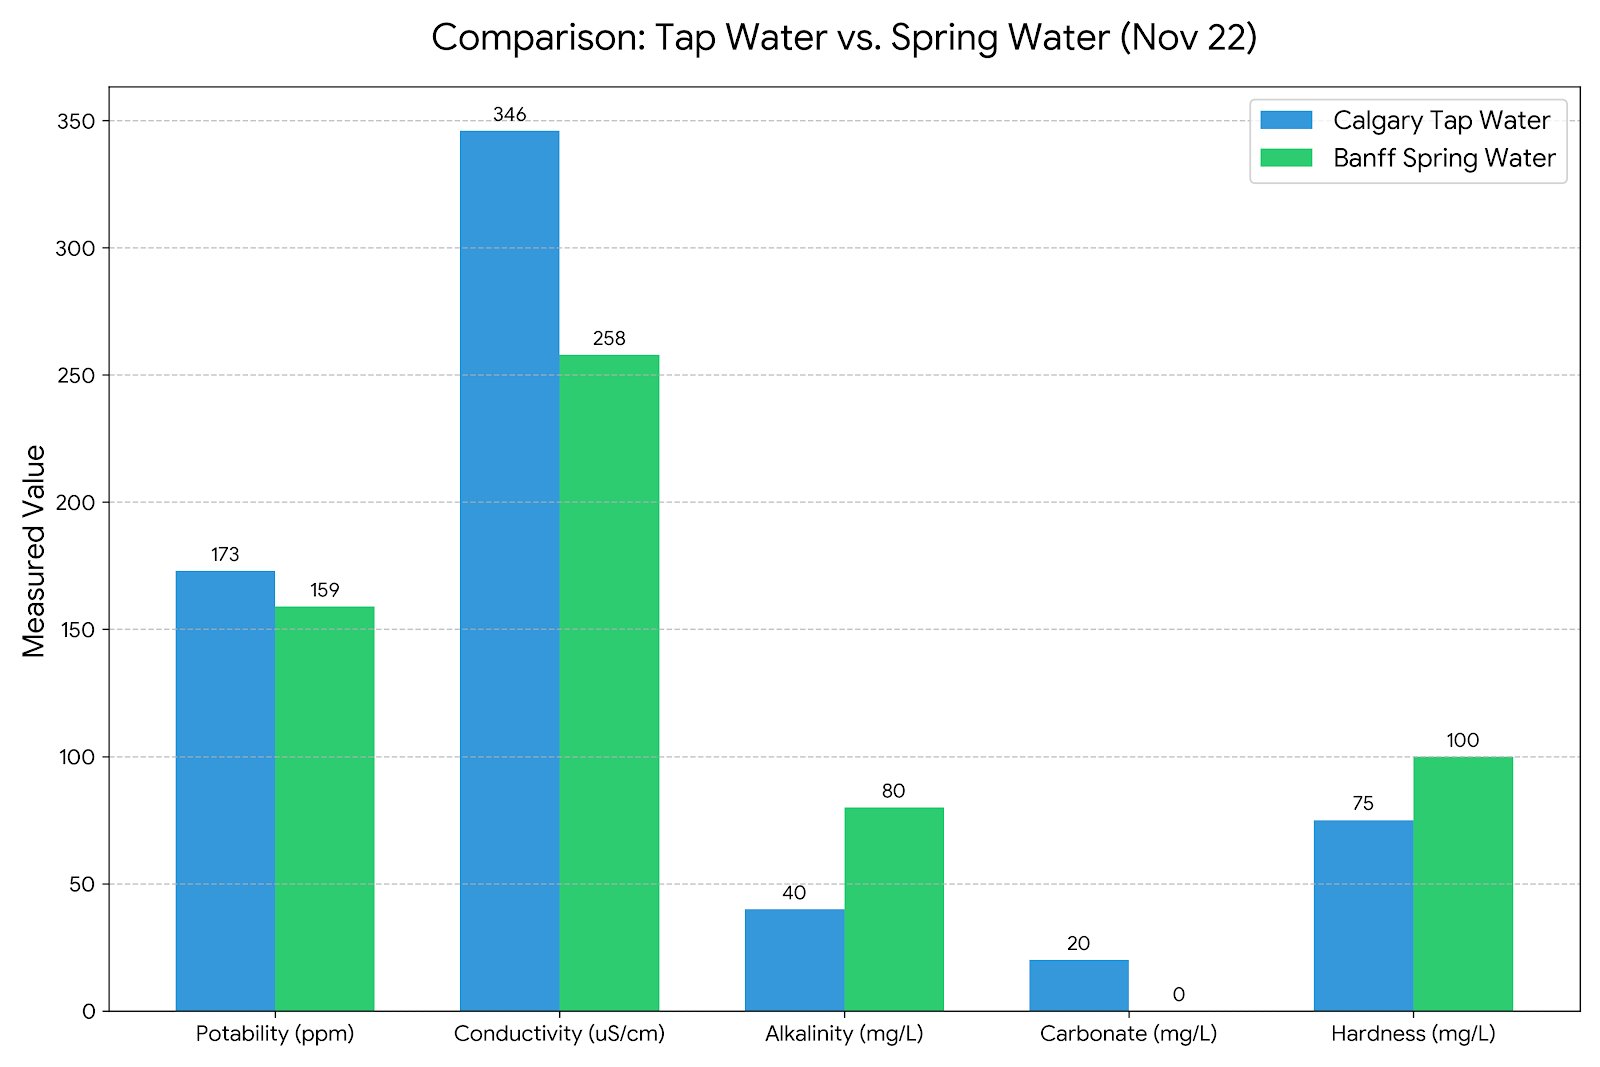
Comparing Calgary tap water at the same temperature to the spring water in November provided a "Control" or a baseline. It showed that even when the temperature was exactly the same, the chemical makeup of our treated city water is different from the untreated natural spring water. The tap water contains more dissolved solids. This baseline comparison shows that even at identical temperatures, Calgary tap water contains more dissolved solids (TDS) and carbonates than the Banff spring in November, likely due to municipal water treatment. Tap Water has higher Conductivity and Potability (TDS) in November. This could be due to the salts and minerals added during the water treatment process in Calgary. The Tap Water had a Carbonate level of 20 mg/L while the Spring Water showed 0 Mg/L. This suggests that in the late autumn, the spring was being fed by very fresh surface runoff that hadn't yet dissolved enough limestone to show up on my carbonate test. Even in November, the Spring Water was already "harder" than the Tap Water. This helps to show that the mountains naturally add more minerals to the water than the city treatment plants do.
Mineral Trends
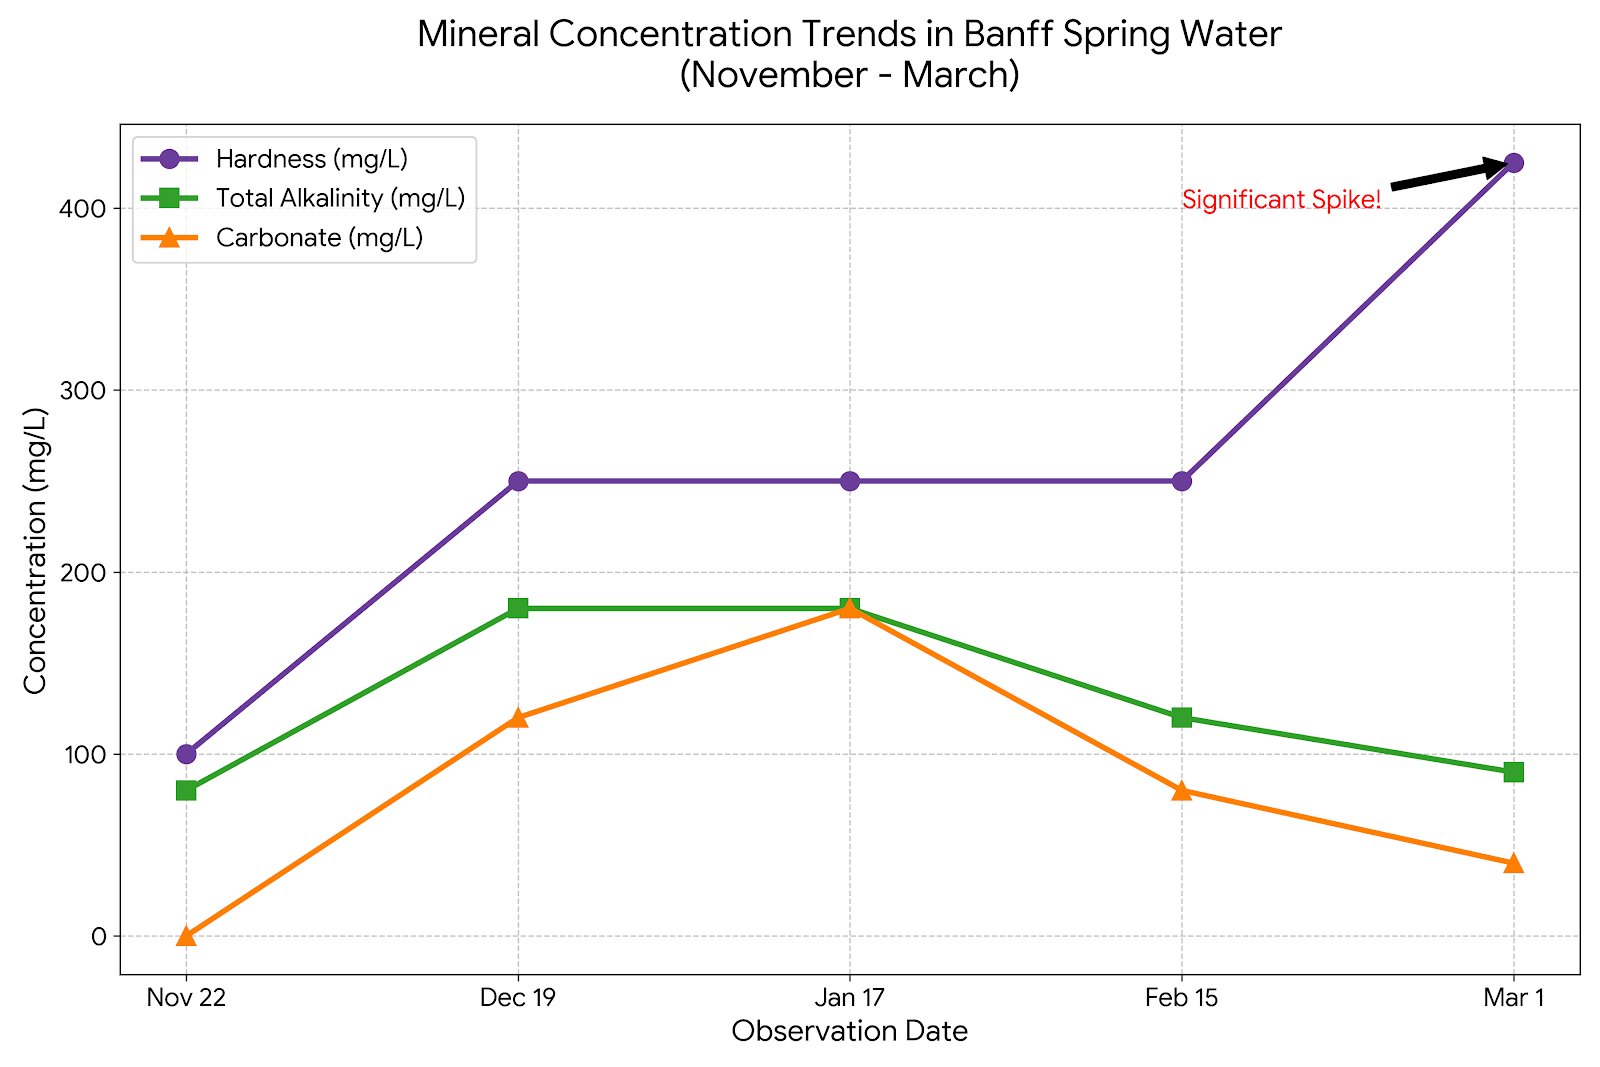
The data shows a 325% increase in hardness from November to March. This suggests that winter groundwater is much more concentrated with minerals than the water in the fall.
425 Mg/L is considered very hard. Calgary water is already hard water and it usually falls in the range of 100-250 Mg/L.
In the Rockies, groundwater flows through limestone and dolostone. During the winter, there is very little fresh surface water (rain or melting snow) to dilute the spring. By March, the water coming out has likely been underground for a long time, picking up high amounts of Calcium and Magnesium from the rocks.
pH Levels
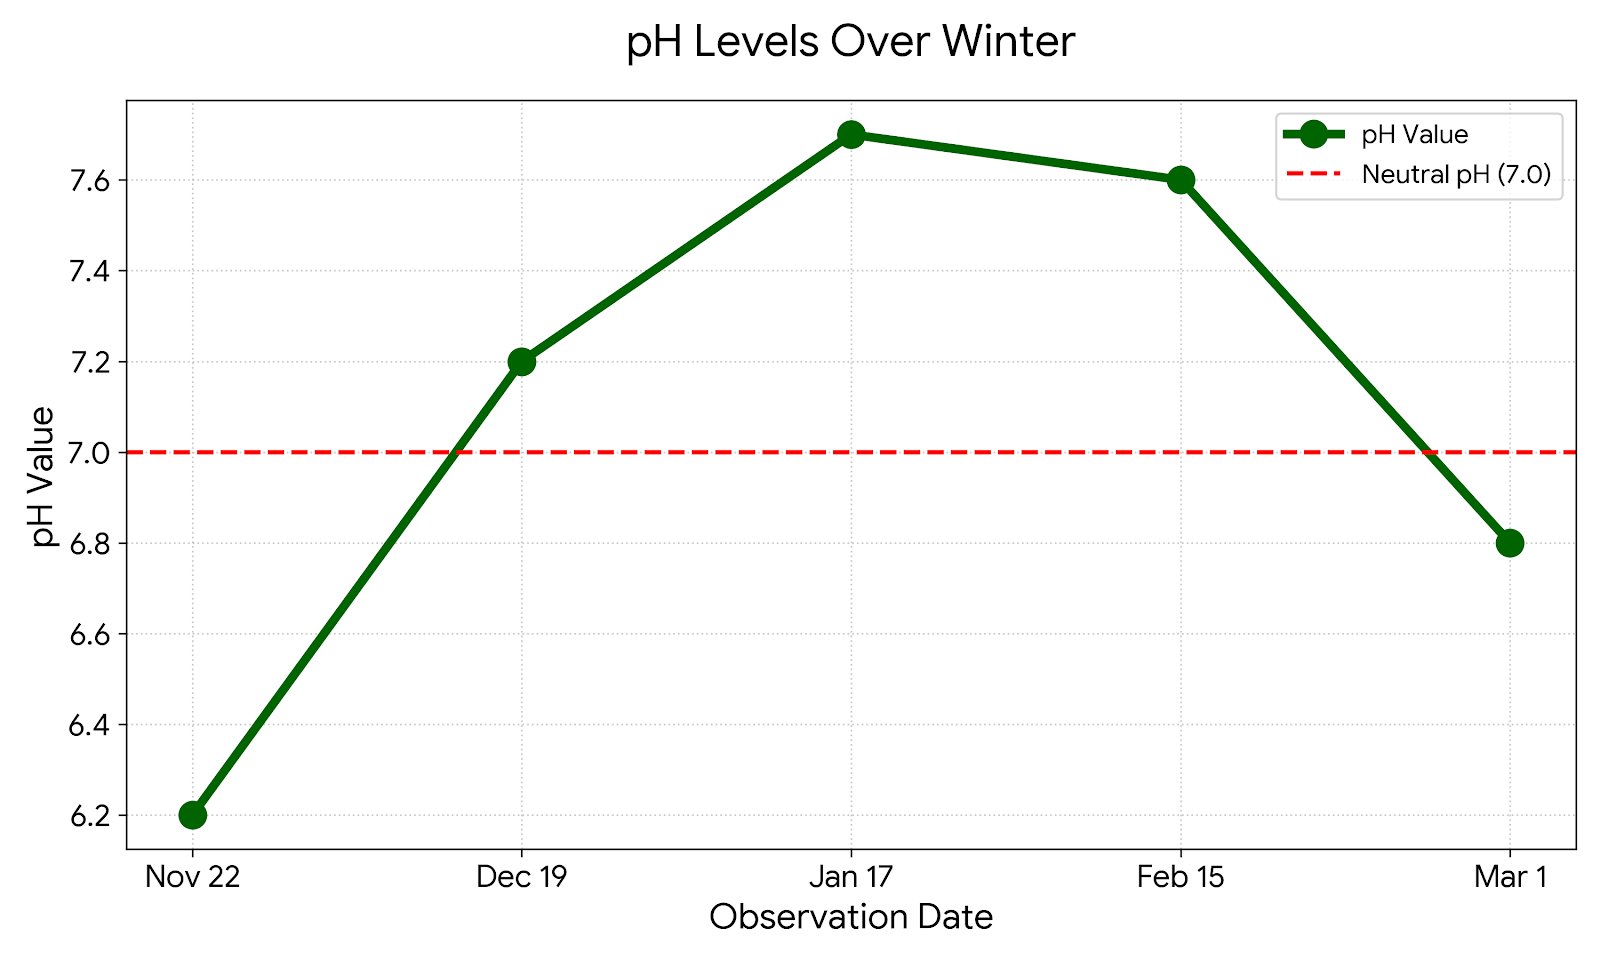
The pH results went from slightly acidic to (6.2) to more basic (7.7) in the winter then back to slightly acidic in the spring (6.8).
As we saw in the Mineral Concentration trends, total alkalinity and carbonate also spiked in mid-winter. Alkalinity acts as a buffer that neutralizes acid. This could explain the changes in pH. As the mineral concentration went up, the water's ability to resist acidity increased, pushing the pH higher.
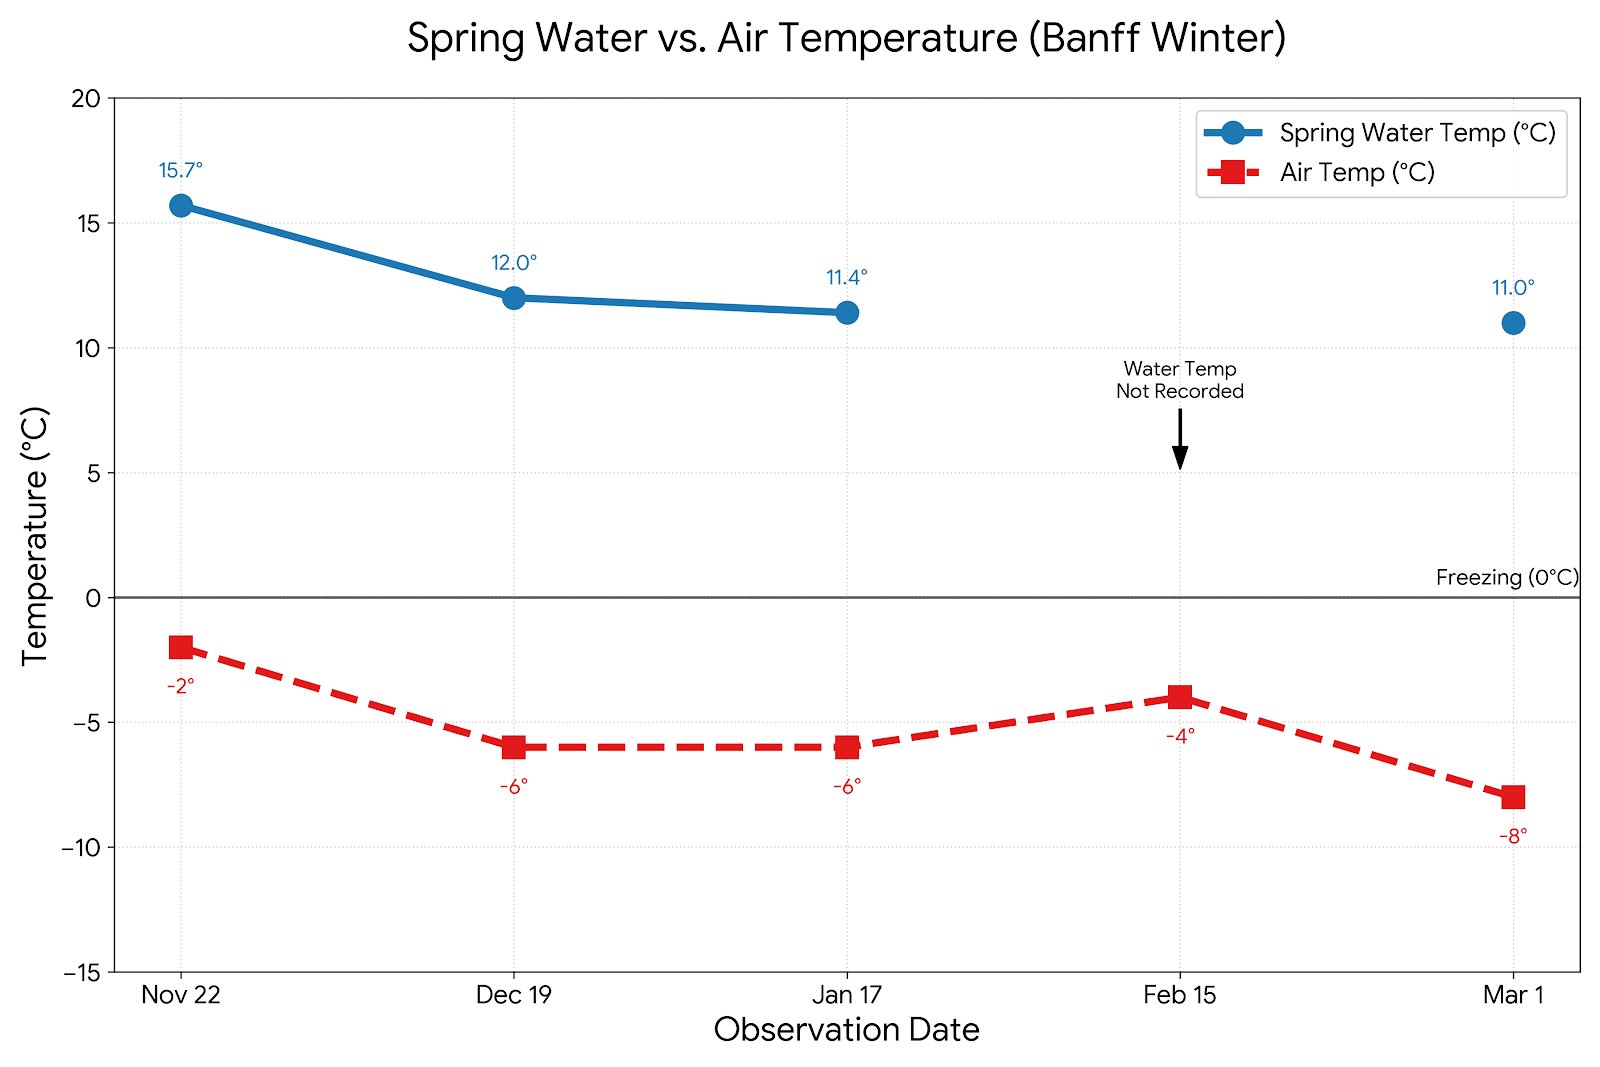
Temperature
Notice how the temperature stays relatively warm (above 10℃) even in the middle of a Banff winter. This shows that the water is coming from deep underground and has been insulated from the cold air temperatures. You can see the insulation gap between the air and the water temperatures. The spring water is protected from the freezing air by the earth above it. On March 1st, while the air temperature was -8°C, the spring water was 11°C. This is a 19-degree difference.
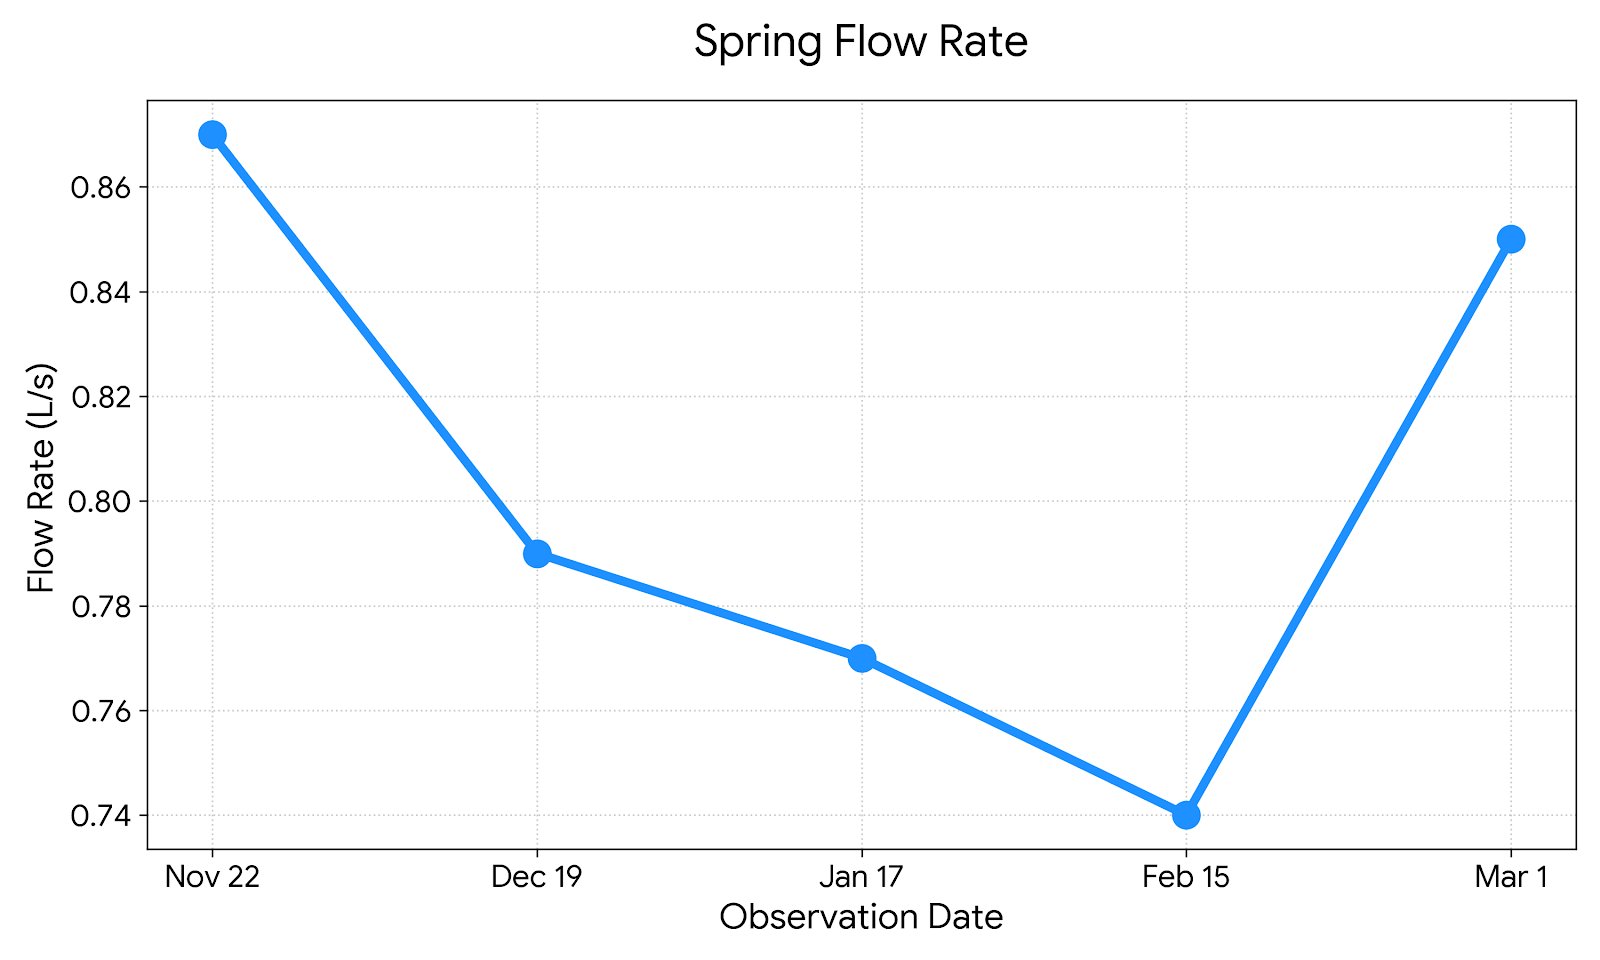
Flow Rate
Flow rate shows a V-shape trend. It decreased from November (0.87 L/s) to February (0.74 L/s). This makes sense if we think that likely the ground is freezing at this time. The increase in March (0.85 L/s) reflects that early spring melt and the warm weather at the end of February from Chinooks.
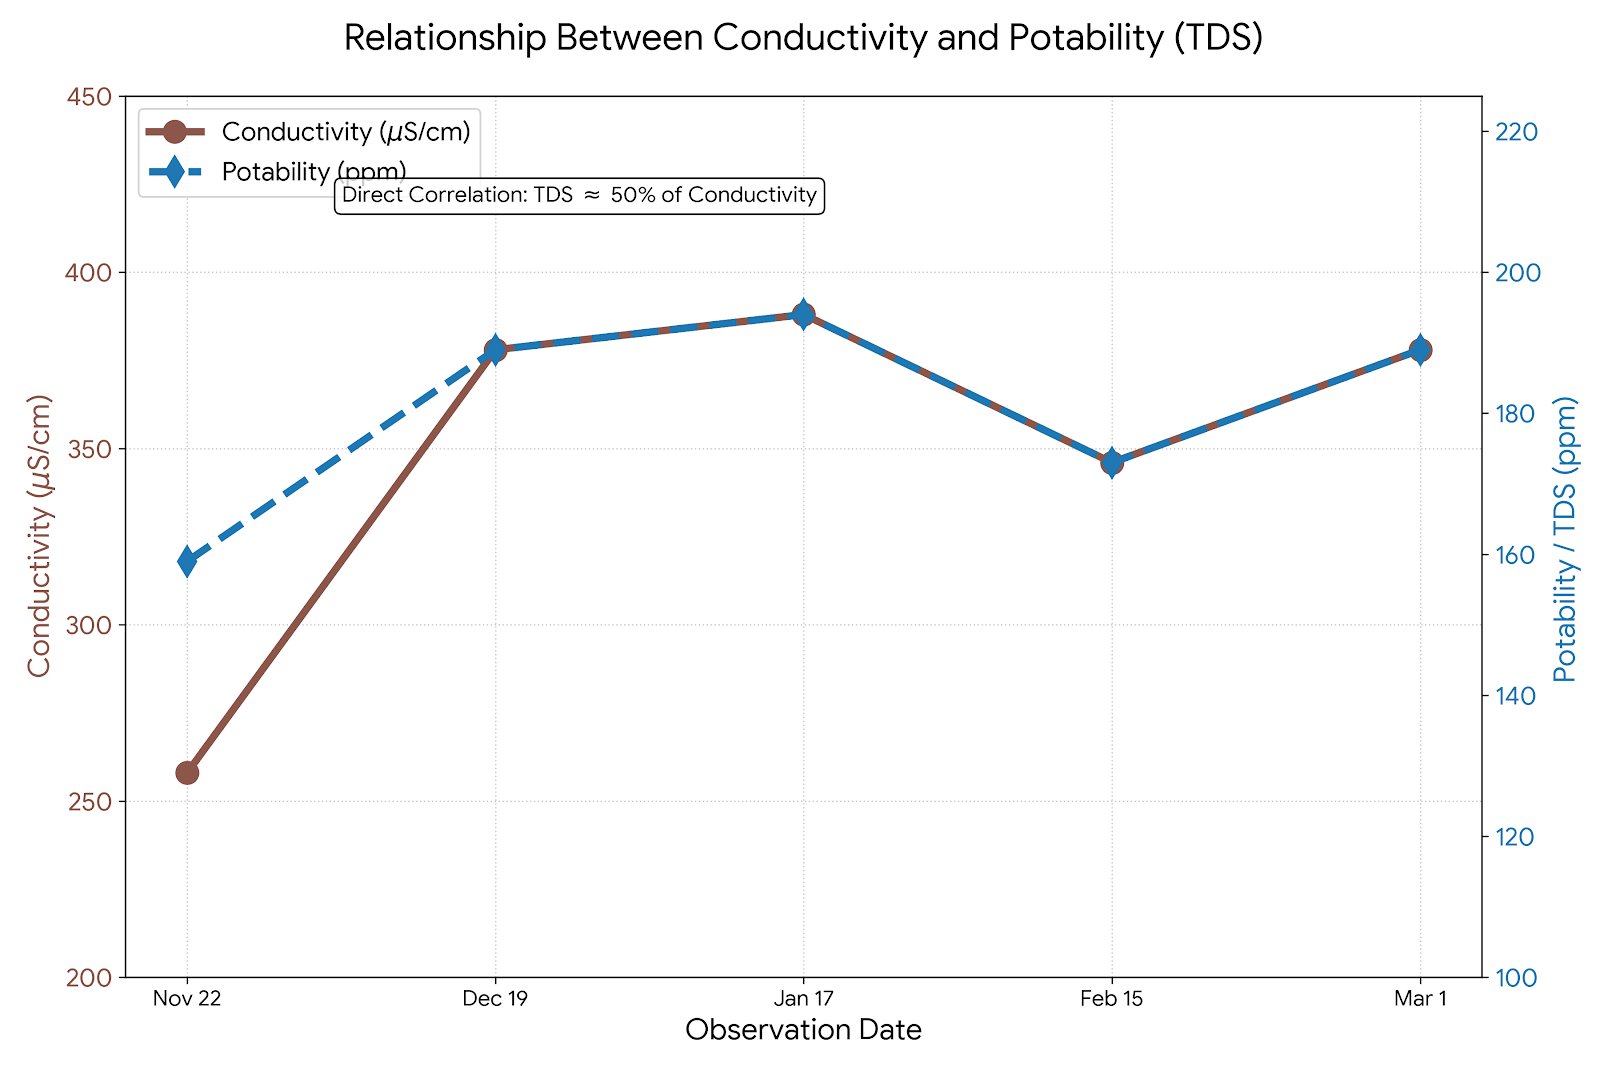
Conductivity and Potability
This conductivity and potability graph shows the relationship between conductivity and total dissolved solids (TDS) which is what potability tests for. I used two separate y-axes (left for Conductivity and right for Potability) to show how they follow almost the same path.
Potability sensors don't actually count the number of particles; they measure the electrical conductivity and then multiply it by a factor (usually 0.5 to 0.7). My data shows, the two lines follow the same up then down pattern. This is because potability (the dissolved mineral concentration) and conductivty (how well the water carries current) are two ways to measure the same thing. These both peaked on January 17th showing the highest concentration of minerals when the ground was the most frozen.
Conclusion
My results support my hypothesis. As the winter progressed hardness increased from 100 mg/L to 425 mg/L. This confirms that as surface dilution from rain stopped, the spring was fed by water that had spent a longer residence time dissolving calcium carbonate from the limestone bedrock. The flow rate also dropped with the weather, It reached it's lowest point (0.74 L/s) in February coinciding with the coldest air temperatures (-4 to -8). This suggests that the recharge of the spring was restricted by frozen surface ground, leaving only the deep-seated aquifer to supply the flow. While the overall winter trend showed a decrease in flow, the March 1st increase was unexpected. This likely indicates an early melt, where rising temperatures in February begin to introduce surface water back into the system, slightly ahead of what I would have expected.
Application
My project is important because the Canmore Spring is a very popular spring. Every time I collected water samples there were multiple people collecting at the same time. I want to make sure that the water is safe and clean and monitor changes throughout the year. Knowing the water quality of the spring would impact all users.
While many water quality projects are a single snapshot in time, my project is a longitudinal analysis. Collecting data consistently from November to March allowed me to observe how the winter freeze-in effect alters mineral concentration. My findings have implications for local hydrogeology. The 325% increase in hardness I measured by March shows that any winter wildlife relying on this spring are interacting with a completely different chemical environment than they do in the fall. Understanding these natural fluctuations can be important for setting accurate environmental benchmarks for our mountain ecosystems. Hopefully my findings will also have personal applications and my whole family can condintue to enjoy fresh mountain spring water.
Sources Of Error
- Sensor Calibration: Most pH and TDS meters can drift over time. I didn’t calibrate the meter with a puffer solution between testing and that could have impacted my results.
- Missed Data Point: In February I did not have my thermometer and could not test the water temperature as it was collected.
- Human Error in Flow Rate: I used a bucket and stopwatch method and this human error could have changed my flow rate measurements.
- Recent Weather Events: It snowed 20cm the night before my january test and diluted the spring opening.
Citations
Citations:
City of Calgary Website:
https://www.calgary.ca/water/drinking-water.html
Government of Canada, Drinking Water Quality:
https://www.canada.ca/en/health-canada/services/environmental-workplace-health/water-quality/drinking-water.html
Federal-Provincial-Territorial Committee on Drinking Water (CDW) - Health Canada:
https://www.canada.ca/en/health-canada/services/environmental-workplace-health/water-quality/drinking-water/federal-provincial-territorial-committee-drinking-water-health-canada.html
My Health Alberta:
https://myhealth.alberta.ca/Health/pages/conditions.aspx?hwid=abk5466
Canada Commons:
https://canadacommons.ca/artifacts/32380885/canadian-drinking-water-quality-guidelines/33280674/
National Collaborating Centre for Environmental Health:
https://ncceh.ca/resources/blog/staying-current-canadian-drinking-water-guidelines
Find a Spring:
https://findaspring.org/spring/locations/north-america/canada/harvie-heightscanmore-spring-canmore-alberta-canada/
Acknowledgement
I would like to thank my mom, Katrina Watson, for helping me to record my information and helping me test my samples. I would like to thank Jason Dwyer, my dad, who showed me the spring in the first place and who drove me to Canmore each month and helped me to collect my samples. Thanks to Mr. Webster, my Science Fair Coordinator for helping me get registered on the platform. I would also like to acknowledge the use of Gemini AI. I used Gemini to help me interpret my data and though I initially made my graphs in Google Sheets I later used gemini to refine my graphs.