Automated Varroa Mite Detection Using Deep Learning and Data Augmentation
Ronald Li
Webber Academy
Grade 12
Presentation
Problem
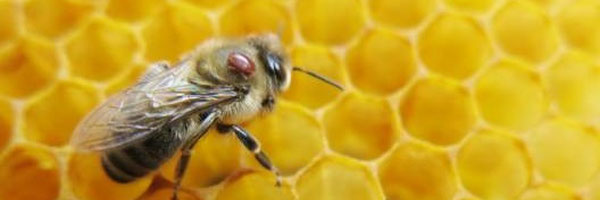
Honey bees, Apis mellifera, are important pollinators that produce food and protect plant biodiversity in natural ecosystems and increase crop production in agriculture, serving as one of the most valuable insects to global food security [1]. The Western Honey Bee, A. mellifera, is globally the main pollinator, with 5% of plant species exclusively being visited by A. mellifera [2].
Canada’s ecological biodiversity and agricultural productivity is dependent on honeybees. Specifically, of Canada’s $7 billion annual contribution of honey bee products, Alberta is the province with the largest beekeeping industry by total production [3].
Despite growth in the total number of hives, the past decade has seen increasing difficulty managing significant colony losses, from the decrease in total honey production in Canada from 2023 to 2024 and a high colony winter mortality rate of 34.6% in Canada in 2024 [4]. Current issues include land management, environmental conditions, and beekeeping practices. Anthropological pollution causes toxic substances and heavy metals to accumulate in plants, which then transfers to honeybees through pollination [5]. Similarly, the use of chemical pesticides increases toxic exposure to bees [5].
Most notably, Varroa destructor, a harmful parasitic mite that infests honey bees, is the most serious threat to A. mellifera, feeding on the fat of adult bees [6] and causing widespread colony losses [7]. In the past few decades, V. destructor has spread globally, attributed to the host switch to A. mellifera, which has limited evolved resistance compared to the ancestral host of V. destructor, Apis cerana, the Eastern Honey Bee [8].
V. destructor impacts reproductive capability of bees and overall fitness from shortened lifespan to diminished immune function [5], [6]. V. destructor also acts as a transmitter of multiple bee viruses as a part of its feeding behaviour, including Deformed Wing Virus (DWV) [7]. Without active treatment, V. destructor can lead to colony death, explaining the high level of colony losses as V. destructor has spread globally [8], [9].
Currently, treatment methods are highly effective at managing but not eliminating V. destructor, including synthetic chemicals and organic acids [9], but efficacy depends heavily on timing and resistance management. Growing concerns around possible resistance to these vital treatment methods in the future and side effects of treatment on bees and bee products make increased management of V. destructor valuable to the protection of food security and biodiversity [10], [11].
Methods of monitoring Varroa mites include sticky board, sugar dusting, ether roll, and alcohol wash [12]. Sticky boards are a noninvasive monitoring method that does not harm the bees unlike other methods like ether roll and alcohol wash. It captures mites that fall off bees within a certain duration, usually a few days, and is used to determine current mite infestation levels [12], [13]. Sticky boards can collect very few up to hundreds of mites per board and require beekeepers to count mites manually [12], [13]. This includes separating hive debris from the small size of mites (less than 2mm in width), leading to inconsistencies accurately determining mite levels, especially with high mite densities [14].
Inspired by the brain, deep learning is a subset of machine learning using multilayered neural networks and large amounts of data [15]. Deep learning models, trained on large amounts of data, have demonstrated success in a wide range of tasks including object detection, achieving human-level performance or better [16].
Convolutional neural networks (CNNs) are deep learning models often used for computer vision tasks [17]. CNNs have the ability to extract low and high-level features using convolutions, since the added layers are capable of detecting specific features, moving from lower to higher level features with each layer [15]. For example, the first layer of a trained CNN may detect edges while the last layer detects eyes. Following the rise of large datasets and capable computing power, CNNs have revolutionized the field of computer vision. Applications in agriculture include crop disease detection, yield prediction, phenotyping, and pest monitoring [18]. The advantage of using CNNs is feature extraction that automatically learns complex features required for deep learning tasks without manual engineering, making them ideal for complex visual tasks [15].
Notably, there has been further focus in fields like agriculture and manufacturing with small object detection, including wheat head detection [19] and drone imagery detection [20]. Small object detection is a challenging problem where the detecting objects occupy few pixels in an image, and models struggle with performance compared to typical CNN object detection models due to a lack of distinctive visual features, object occlusion, and environmental factors such as lighting and blur [21].
Architectures demonstrate trade-offs between speed, accuracy, and computational requirements for object detection. You Only Look Once (YOLO) is a one-stage unified model that divides images into grids, making it fast and efficient for real-time detection [22]. For example, [14] uses YOLO for V. destructor sticky board detection with a 357 image dataset manually annotated by experts, creating the VarroDetector software. Faster R-CNN is a two-stage detector using Region Proposal Network, a more accurate but slower framework, used by [23] for similar V. destructor detection, dividing each image from a dataset of 64 images. In addition, [23] uses a deblurGAN to improve accuracy of the low resolution cropped images.
For training models, learning falls under three main categories: supervised learning, semi-supervised learning, and self-supervised learning [24]. Supervised learning uses fully labeled datasets where each input has a corresponding ground truth annotation, achieving high accuracy but requiring extensive manual labeling effort. Self-supervised learning generates labels automatically from the data structure itself, eliminating annotation needs but potentially sacrificing task-specific accuracy. Semi-supervised learning combines a small labeled dataset with a larger unlabeled dataset, balancing the performance of supervised learning with the low cost of unsupervised learning [24]. Deep learning is heavily dependent on the input data [15]. With a numerous and diverse dataset, it is possible to make models robust, however, these are field-specific and expensive, requiring manual human effort for annotation. For example, ImageNet, the dataset used by AlexNet and a key component of its success, contains over a million manually labeled images and was compiled in an organized effort by researchers over multiple years [16], [25]. This bottleneck is a major limitation to development of deep learning models compared to the recent and rapid growth in computational power [26].
An important method used to address limited data is data augmentation, which uses various image transforms such as scale, rotation, crops, and modifications to colour and saturation to supply the model with a greater diversity of images that increases performance when presented with new, unseen data [15].
Recent work on deep learning for V. destructor detection include [14], [23], [27]. This research, primarily done in Spain in the past few years, uses deep learning with various models, however, they use expert-annotated images collected in similar geographic locations. While they utilize techniques to increase their dataset size, their research does not focus on developing optimal augmentation pipelines and the implications behind this for future research and usage of data augmentations for efficiency of computation and data collection.
This research is aimed at answering the following questions: How effective are Varroa mite detection models for automated Varroa mite counting? Specifically, what detection accuracy (mAP) can YOLO based models achieve? To what extent does data augmentation from limited real samples affect the performance of the model on testing data?
The primary objective of this research is to develop and evaluate a Varroa mite detection model optimized for diverse sticky board conditions. This involves using available annotated data to train a baseline model, followed by applying various data augmentations used specifically to determine each transformation efficacy.
The secondary objective is to deploy the model in a mobile application that allows for practical usage of the trained model by beekeepers to obtain mite counts using smartphone images. This provides a tool that can improve Varroa mite monitoring and support colony management, while evaluating the viability and best practices of using data augmentation for developing accurate detection models.
Method
The methodology of this project consists of the data collection, model training, data augmentation, and model evaluation.
The dataset used for this project is publicly available [23].
Sticky board images were collected from beekeepers. Sticky boards were placed underneath the bottom hive body, allowing the mite fall to accumulate on the boards. After some period of time, the boards were removed, and the mites were analyzed. Depending on the rate of mite fall, the boards can be removed at varying frequencies. The sticky boards were used on multiple colonies with varying levels of mite infestation [13]. Data collection was performed by [23] using smartphone cameras to photograph the sticky boards. A total of 64 annotated images were collected by [23], with a resolution of 8064 pixels by 6048 pixels. Each image was manually annotated by experts, with bounding box annotations being drawn around each mite.
In order to convert the dataset from PASCAL VOC dataset format to YOLOv11 format, the yolosplitter library in Python was used.
A deep learning object detection architecture was employed to detect and count individual V. destructor mites. The bounding box and confidence outputs for each mite enables the direct counting of mites. The CNN model, YOLO11s by Ultralytics, was implemented using the Pytorch ROCm deep learning framework. Training was performed on a home computer, a Linux machine running Python 3.10 in a PyEnv virtual environment, using an AMD Radeon 6700XT graphics card with 12GB of VRAM. Override commands were necessary to use the graphics card due to incomplete graphics card drivers.
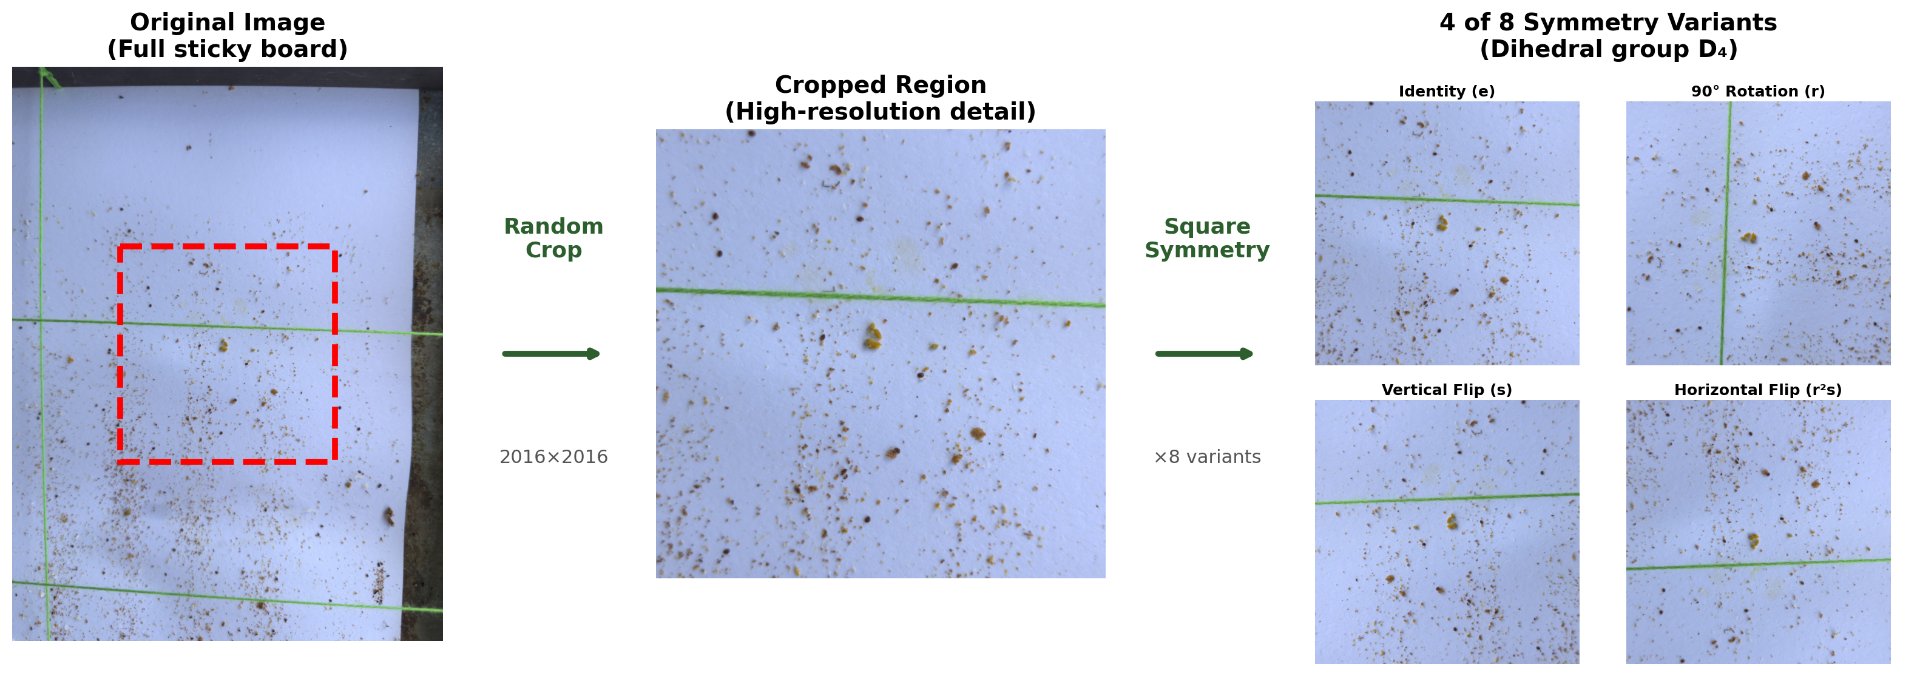
The dataset was split into 45 training, 6 validation, and 13 test images (a dataset split of approximately 70-10-20). Images were fed into the model at an image size of 2016 pixels and a batch size of 2 due to computational limitations, while YOLO11s (9.4M parameters) was chosen over YOLO11n (2.6M parameters) due to an increase in performance and small increase in computational requirement and training time. Training used the SGD optimizer and was performed over 200 epochs.
The Albumentations Python library was used for specific and controlled transforms, applying transforms to images before being given to the model for training. A multitude of transform combinations were tested methodically, following standard practice of determining optimal data augmentations. The final model implemented RandomCrop with p=1.0, height=2016, width=2016, and SquareSymmetry with p=0.5. RandomCrop takes a random section of each complete image to show the model different parts of each image and preserving the resolution of the mites, since each mite is represented by a small number of pixels. This was necessary due to the computational limitations of my project. SquareSymmetry feeds the model various flips and rotations of an image across the axes of symmetry, allowing the model to train with all possible orientations that sticky boards will be photographed with.
Other transforms were also applied, following the order of size normalization, geometric invariances, dropout, colour dependence transforms, affine transforms, domain-specific transforms, and normalization. Transforms were applied incrementally onto the augmentation pipeline as successful augmentations added upon one another.
All final metrics were performed using the unseen test data. The accuracy of the model was measured with core metrics including F1 score, precision, recall, accuracy, Intersection over Union (IoU), which measures the overlap between the true and predicted bounding boxes, and Mean Average Precision (mAP), which measures performance across all confidence thresholds [15].
In order to apply the model practically, I developed a similar application to VarroDetector in [14] that allows users to input their own images and visualize where mites are.
Analysis
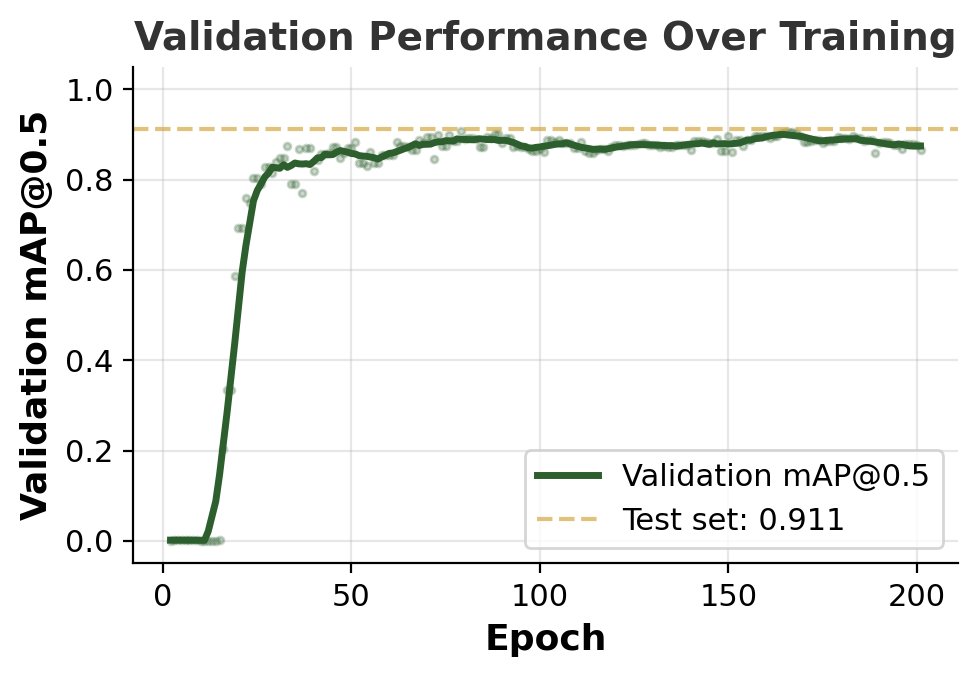
Domain-specific augmentations (RandomCrop + SquareSymmetry) achieved 91.1% mAP, improving by 5.6% over no augmentation. RandomCrop enabled us to maintain full resolution of mite instances while staying within the limits of our training resources. SquareSymmetry trained our model to detect mites regardless of mite orientation.
However, generic robustness augmentations (blur, sharpen, colour) hurt performance by creating a train/test mismatch. We can infer that either general augmentations applied to images before training do not improve model performance as the augmentations were too extreme and therefore led to images not found in the real world, or that the limited data was too uniform to benefit from additional augmentations. Since data was sanitized before training, images are not fully representative of real world images. For example, each image in the dataset was taken from a single, consistent aerial perspective, so therefore perspective transforms would not help increase the model performance. A perspective transform would benefit the model in real world situations since people take images from a slight angle instead of consistently above the sticky board, but this could only be fully tested and measured given the availability of data with such variations.
Lastly, small object detection benefits from high-resolution crops (2016×2016) that preserve detail without increasing training computational demand. Varroa mites have some distinct identifying characteristics including the round, oval shape and smooth shiny shell. Keeping a high resolution may allow the neural network to better learn these features, since each mite instance consists of very few pixels.
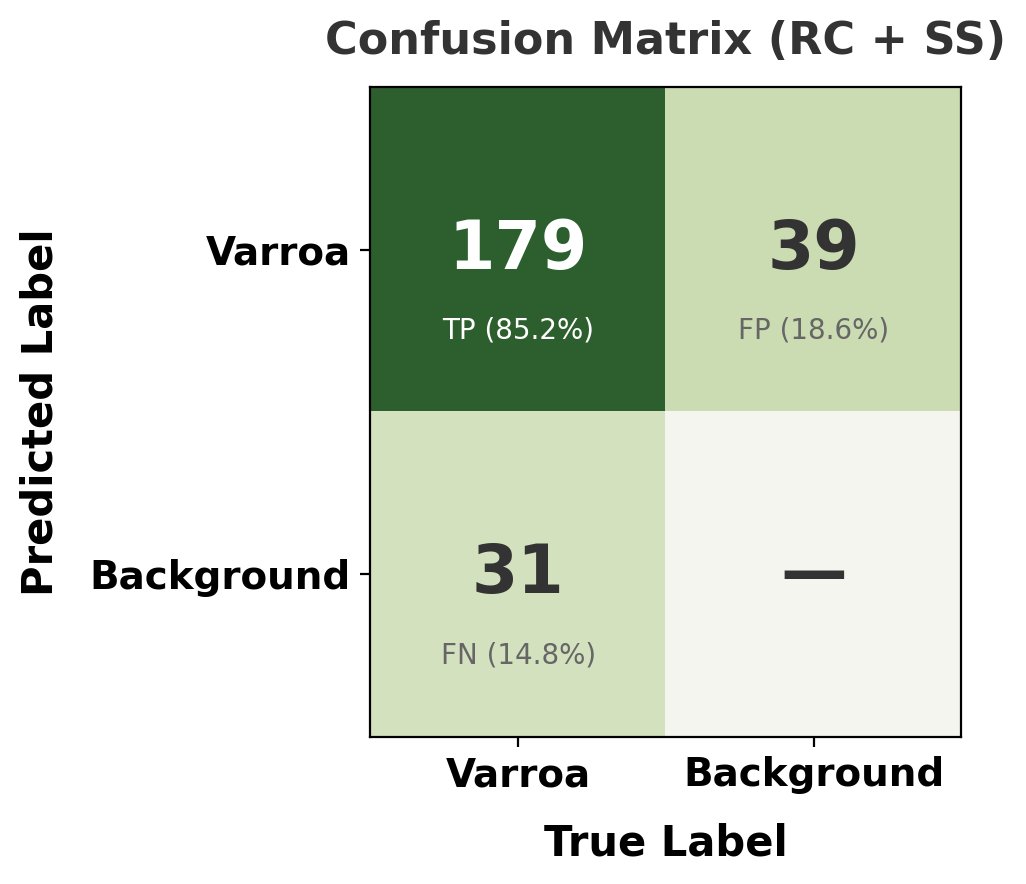
The difference between precision and recall is relatively small, indicating that the model has a negligible difference between having false positives and false negatives.
Overfitting was not a problem as there was little performance drop between the training and validation images compared to the test images.
| Augmentation | F1 Score | Precision | Recall | Accuracy | mAP@0.5 |
|---|---|---|---|---|---|
| None | 0.786 | 0.752 | 0.824 | 0.645 | 0.855 |
| Random Crop (RC) | 0.852 | 0.867 | 0.838 | 0.701 | 0.906 |
| RC + Square Symmetry (SS) | 0.836 | 0.816 | 0.857 | 0.719 | 0.911 |
| RC + SS + Affine | 0.829 | 0.816 | 0.843 | 0.669 | 0.898 |
| RC + SS + Dropout | 0.811 | 0.777 | 0.848 | 0.681 | 0.873 |
| RC + SS + Gaussian Blur | 0.815 | 0.854 | 0.778 | 0.670 | 0.889 |
| RC + SS + HSV | 0.804 | 0.828 | 0.781 | 0.663 | 0.880 |
| RC + SS + Sharpen | 0.827 | 0.830 | 0.824 | 0.709 | 0.903 |
Conclusion
This project addresses two specific topics: building a Varroa mite counting model and testing data augmentation techniques based on real images. By augmenting our limited real world training data, this research provides immediate practical value for beekeepers, reducing the manual counting process and enabling more frequent and more accurate monitoring. Prevention of colony losses continues to pose difficulties for beekeepers. Early detection and intervention is vital to management of this issue, and this is dependent on inexpensive Varroa mite monitoring, which this project makes accessible for all beekeepers. Given that these mites contribute significantly to colony losses, this work contributes to improved colony health management that provides massive ecological and economic benefits to Canada and the rest of the world. In addition, demonstrating that this methodology is viable and cost effective can encourage similar research and application of data augmentation based on real images in other agricultural pest monitoring challenges and different computer vision tasks where data is scarce or underrepresented in certain geographic regions.
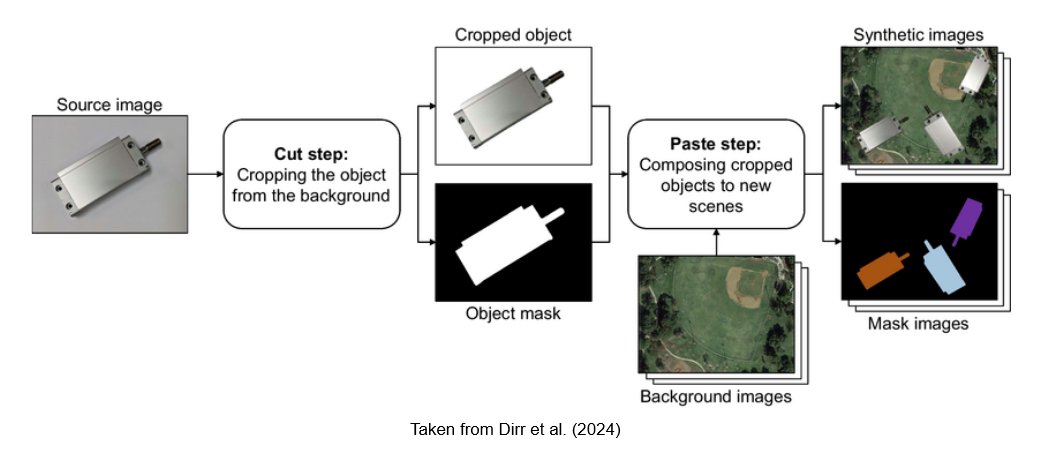
We can conclude that targeted augmentations improve machine learning models with scarce training data, resulting in high performance neural networks. Future works exploring synthetic data generation (cut-and-paste training data) and further sticky board image collection continue this focus on data as a way to improve deep learning models.
1 of 18 images collected from beekeepers in BC. Images are currently being processed and labelled manually.

Cut-and-paste method used by [26], [28] for creating training data.
Citations
[1] G. Papa et al., "The honey bee Apis mellifera: An insect at the interface between human and ecosystem health," Biology (Basel), vol. 11, no. 2, p. 233, Feb. 2022, doi: 10.3390/biology11020233. [2] K.-L. J. Hung, J. M. Kingston, M. Albrecht, D. A. Holway, and J. R. Kohn, "The worldwide importance of honey bees as pollinators in natural habitats," Proc. Biol. Sci., vol. 285, no. 1870, Jan. 2018, doi: 10.1098/rspb.2017.2140. [3] "Statistical Overview of the Canadian Honey and Bee Industry 2024," Horticulture Section, Crops and Horticulture Division, Agriculture and Agri-Food Canada, 2025. [4] G. Claing et al., "Statement On Honey Bee Wintering Losses In Canada," Canadian Association of Professional Apiculturists, 2024. [5] P. Hristov, R. Shumkova, N. Palova, and B. Neov, "Factors associated with honey bee colony losses: A mini-review," Vet. Sci., vol. 7, no. 4, p. 166, Oct. 2020, doi: 10.3390/vetsci7040166. [6] S. D. Ramsey et al., "Varroa destructor feeds primarily on honey bee fat body tissue and not hemolymph," Proc. Natl. Acad. Sci. U. S. A., vol. 116, no. 5, pp. 1792–1801, Jan. 2019, doi: 10.1073/pnas.1818371116. [7] K. S. Traynor et al., "Varroa destructor: A complex parasite, crippling honey bees worldwide," Trends Parasitol., vol. 36, no. 7, pp. 592–606, Jul. 2020, doi: 10.1016/j.pt.2020.04.004. [8] N. Eliash and A. Mikheyev, "Varroa mite evolution: a neglected aspect of worldwide bee collapses?," Curr. Opin. Insect Sci., vol. 39, pp. 21–26, Jun. 2020, doi: 10.1016/j.cois.2019.11.004. [9] P. Rosenkranz, P. Aumeier, and B. Ziegelmann, "Biology and control of Varroa destructor," J. Invertebr. Pathol., vol. 103 Suppl 1, pp. S96–119, Jan. 2010, doi: 10.1016/j.jip.2009.07.016. [10] Y. Kosch, C. Mülling, and I. U. Emmerich, "Resistance of Varroa destructor against oxalic acid treatment-A systematic review," Vet. Sci., vol. 11, no. 9, p. 393, Aug. 2024, doi: 10.3390/vetsci11090393. [11] Y. Kosch, C. K. W. Mülling, and I. U. Emmerich, "Assessment of resistance of Varroa destructor to formic and lactic acid treatment—A systematic review," Vet. Sci., vol. 12, Feb. 2025, doi: 10.3390/vetsci12020144. [12] V. Dietemann et al., "Standard methods for varroa research," J. Apic. Res., vol. 52, no. 1, pp. 1–54, Jan. 2013, doi: 10.3896/ibra.1.52.1.09. [13] M. A. Roth, A. D. Gross, and J. M. Wilson, "Varroa Mite Sampling Methods," 2019. [14] J. Yániz et al., "An AI-based open-source software for Varroa mite fall analysis in honeybee colonies," Agriculture, vol. 15, no. 9, p. 969, Apr. 2025, doi: 10.3390/agriculture15090969. [15] L. Alzubaidi et al., "Review of deep learning: concepts, CNN architectures, challenges, applications, future directions," J. Big Data, vol. 8, no. 1, p. 53, Mar. 2021, doi: 10.1186/s40537-021-00444-8. [16] A. Krizhevsky, I. Sutskever, and G. E. Hinton, "ImageNet classification with deep convolutional neural networks," Commun. ACM, vol. 60, no. 6, pp. 84–90, May 2017, doi: 10.1145/3065386. [17] X. Zhao, L. Wang, Y. Zhang, X. Han, M. Deveci, and M. Parmar, "A review of convolutional neural networks in computer vision," Artif. Intell. Rev., vol. 57, no. 4, Mar. 2024, doi: 10.1007/s10462-024-10721-6. [18] M. El Sakka, M. Ivanovici, L. Chaari, and J. Mothe, "A review of CNN applications in smart agriculture using multimodal data," Sensors (Basel), vol. 25, no. 2, p. 472, Jan. 2025, doi: 10.3390/s25020472. [19] S. Khaki, N. Safaei, H. Pham, and L. Wang, "WheatNet: A lightweight convolutional neural network for high-throughput image-based wheat head detection and counting," Neurocomputing, vol. 489, pp. 78–89, Jun. 2022, doi: 10.1016/j.neucom.2022.03.017. [20] M. Chao, C. Peng, L. Yun, C. Zhang, H. Wang, and Z. Chen, "A lightweight small object detection model for UAV images based on deep semantic integration," Sci. Rep., vol. 15, no. 1, p. 31888, Aug. 2025, doi: 10.1038/s41598-025-16878-6. [21] M. Nikouei et al., "Small object detection: A comprehensive survey on challenges, techniques and real-world applications," Intell. Syst. Appl., vol. 27, no. 200561, p. 200561, Sep. 2025, doi: 10.1016/j.iswa.2025.200561. [22] J. Redmon, S. Divvala, R. Girshick, and A. Farhadi, "You only look once: Unified, real-time object detection," in 2016 IEEE Conference on Computer Vision and Pattern Recognition (CVPR), IEEE, Jun. 2016. doi: 10.1109/cvpr.2016.91. [23] J. Divasón et al., "Analysis of Varroa mite colony infestation level using new open software based on deep learning techniques," Sensors (Basel), vol. 24, Jun. 2024, doi: 10.3390/s24123828. [24] I. H. Sarker, "Machine learning: Algorithms, real-world applications and research directions," SN Comput. Sci., vol. 2, no. 3, p. 160, Mar. 2021, doi: 10.1007/s42979-021-00592-x. [25] J. Deng, W. Dong, R. Socher, L.-J. Li, K. Li, and L. Fei-Fei, "ImageNet: A large-scale hierarchical image database," in 2009 IEEE Conference on Computer Vision and Pattern Recognition, IEEE, Jun. 2009. doi: 10.1109/cvpr.2009.5206848. [26] K. Najafian, A. Ghanbari, I. Stavness, L. Jin, G. Shirdel, and F. Maleki, "A semi-self-supervised learning approach for wheat head detection using extremely small number of labeled samples," 2021 IEEE/CVF International Conference on Computer Vision Workshops (ICCVW), pp. 1342–1351, Oct. 2021, doi: 10.1109/ICCVW54120.2021.00155. [27] J. Divasón, F. J. Martinez-de-Pison, A. Romero, P. Santolaria, and J. L. Yániz, "Varroa mite detection using deep learning techniques," in Lecture Notes in Computer Science, Cham: Springer Nature Switzerland, 2023, pp. 326–337. doi: 10.1007/978-3-031-40725-3_28. [28] J. Dirr, J. C. Bauer, D. Gebauer, and R. Daub, "Cut-paste image generation for instance segmentation for robotic picking of industrial parts," Int. J. Adv. Manuf. Technol., vol. 130, pp. 191–201, 2024, doi: 10.1007/s00170-023-12622-4.
Acknowledgement
Thank you to Dr. Farnaz Sheikhi and Dr. Farhad Maleki from the University of Calgary Department of Computer Science, and Dr. Beatriz Garcia-Diaz, for the continued guidance and support throughout this project.