
Operation Oracle - Eyes of The Future Pt.2
Anie Udofia
William Aberhart High School
Grade 10
Presentation
No video provided
Problem
In our current healthcare landscape, the global fight for early disease detection is struggling on three interconnected fronts: the clinical front of deadly delays, the access front of geographic and economic barriers, and the systemic front of opaque, disempowering technology. This triple crisis fuels systematic failure at the point of care, where time, distance, and distrust converge to turn preventable diseases into near death sentences. This project, "Operation Oracle," is engineered as a direct counter-offensive against all three.
1. The Clinical Front: The "Diagnostic Gap" and Its Deadly Delays
Certain cancers significantly weaponize time. The danger in skin and lung cancer does not merely lie in their commonality, but more so because their underlying biology allows rapid progression during diagnostic delay. In the most aggressive form of skin cancer, melanoma, malignant melanocytes exhibit high mitotic activity and early metastatic potential, meaning that small changes in lesion morphology can signal a shift from curable to lethal disease within weeks. In lung cancer, tumors often undergo a prolonged asymptomatic growth phase, remaining clinically silent until advanced stages, while aggressive subtypes proliferate and invade critical thoracic structures long before symptoms prompt imaging. In both cases, delay is not neutral, as it is biologically catastrophic.
In dermatology, the initial assessment of skin lesions relies on subjective visual examination, a process with high inter-observer variability. The consequences are tangible: cancer patients in Alberta are now regularly waiting 12–16 weeks for a first specialist consult, which is far beyond provincial guidelines for timely care, increasing the risk of progression during delay (Calgary CityNews, 2024). With melanoma's rapid progression, a progression that can become life-threatening in as little as six weeks (Forefront Dermatology, 2021), such delays can drastically reduce survival rates from 99% for localized melanoma to 25% once it metastasizes (Canadian Cancer Society, n.d.).
For lung cancer, low-dose CT screening faces barriers of radiation exposure, cost, and immobility. Rural patients face significant diagnostic delays; Canadian data show diagnostic intervals 30–40% longer in rural areas (Canadian Partnership Against Cancer, 2022, p. 27). In Australia, lung cancer remains the leading cause of cancer death with lung cancer survival rates significantly lower than many other cancers, reflecting late-stage diagnosis challenges (Australian Institute of Health and Welfare, 2025).
2. The Access Front: Geographic and Economic Fortifications
The diagnostic gap is reinforced by physical and economic barriers. This equipment disparity is compounded by a global radiologist density crisis, with high-income countries averaging 97.9 radiologists per million people, compared to fewer than 2 per million in low-income nations (OECD, 2023, p. 172). In Alberta, this access gap is severe: rural communities represent a substantial portion of the population yet have access to a disproportionately small share of specialist physicians, reflecting a broader national pattern of urban-concentrated medical expertise (Canadian Institute for Health Information, 2023). As a result, rural patients are often forced to travel hundreds of kilometers for basic diagnostic imaging and specialist care.
3. The Systemic Front: The "Black Box" Empowerment Gap
The integration of Artificial Intelligence (AI) into medicine introduces new risks. Landmark studies show commercial AI can have error rates up to 34.7% for darker-skinned females, a direct result of biased development (Buolamwini & Gebru, 2018). This creates opaque "black box" systems that erode trust and disempower users. This "Closed Loop of Creation" perpetuates health inequities, with some of the most vulnerable communities, such as Indigenous populations in high-income countries, experiencing significantly higher cancer mortality and lower screening access (American Cancer Society, n.d.). Therefore, the core problem is not merely a lack of sophisticated tools, but a lack of accessible, understandable, and co-creatable tools. There is a pressing need for diagnostic systems that simultaneously:
- Detect disease early with clinical-grade accuracy,
- Overcome physical and economic barriers through portable, affordable design, and
- Break the closed loop through transparency, education, and community co-creation.
The Mission: A Coordinated Three-Front Offensive
This project, "Operation Oracle," confronts this triple crisis head-on. I move beyond simply building another diagnostic device to engineer educational platforms that embody a new paradigm for equitable health technology.
NOMA AI serves as the demystification engine for skin cancer screening, directly attacking the "black box" problem through a three-tier multimodal architecture: (1) an explainable visual AI using Grad-CAM heatmaps, (2) an interactive educational module implementing the gold-standard ABCDE clinical rules, and (3) a weighted integration of AI analysis with direct patient feedback and history. Its primary output is not just a risk score, but patient understanding, helping to transform users from anxious subjects into informed collaborators who comprehend both the medical rationale and the technology assessing them.
PULMO AI demonstrates the innovative frontier of this democratized approach. It addresses the limitations of single-modality thoracic screening by creating a novel acoustic-microwave fusion platform. This system uniquely combines the functional data of digital auscultation with the safe, non-ionizing structural imaging of microwave radar. In turn, this unique approach tackles both the radiation barrier of CT and the subjectivity of traditional auscultation. Built on affordable, open-source hardware, it represents the kind of community-driven innovation that becomes possible when diagnostic tools are transparent and accessible.
Together, they form a coordinated three-front response:
- Against Clinical Delay: Rapid, multimodal screening at point-of-care
- Against Access Barriers: Portable platforms using democratized hardware
- Against Systemic Exclusion: Explainable AI + clinical education + complete open-source documentation (including an online course teaching others to build their own)
"Operation Oracle" aims to transform early detection from a scarce, opaque resource into a portable, explainable, and truly accessible practice. Ultimately, my project seeks to demonstrate that the most effective diagnostic tools don't just process data, but build the literacy necessary to understand it.
Method
Unified Design Philosophy & Hardware Platform
Core Principle
Democratization of innovation is a fundamental pillar imperative to the proposed operation, one that allows for the very power of creation to be possessed by all in ways that reach their unique needs. In order to reach this objective, accessibility serves as the primary catalyst, achieved through a three-part strategy: (1) the use of low-cost, off-the-shelf hardware (e.g., Raspberry Pi); (2) the complete public release of all software, datasets, and 3D-printable designs via GitHub and Kaggle; and (3) the creation of a free, online educational course that teaches others how to build, understand, and adapt these systems. This comprehensive approach ensures the power to screen, diagnose, and innovate is a portable resource owned by communities, not a fortress controlled by a few. Not only does this encourage repurposed innovation, but this approach equally serves as a reproducibility framework that enables community iterations.
Countering Clinical Delay with Multimodal Sensor Fusion
NOMA AI: The Visual-Clinic Integrator
The skin is an incredibly personal and dynamic organ that reflects our unique genetic makeup, environment, and history. It is essential that tools in this domain can sufficiently reflect these unique aspects, aspects that equally vary from one individual to another. However, this inherent variability makes accurate visual diagnosis a profound challenge, and one that requires a tool as adaptable and nuanced as the skin itself. NOMA AI serves as a comprehensive skin cancer screening device that combines AI-powered visual analysis with clinical risk assessment to provide accessible, preliminary skin lesion evaluation. Built on a Raspberry Pi platform, it democratizes dermatological screening through an integrated hardware-software solution. The device specifically utilizes the Raspberry Pi 4 (4 GB RAM) that provides processing power for real-time AI inference as well as system control. Given its focus on identifying such lesions, the device heavily relies on physical imaging to make up a significant portion of its analysis, and thus would require a proponent that can balance high image quality with easy implementation. The Arducam 12 MP IMX519 Camera serves this role well, an autofocus camera that supplies the high-resolution imagery necessary to capture fine-grained details of skin lesions, such as border irregularity and color variation, at a point-of-care cost of under $50. Initially, the RedTagCanada for OV5647 high-Definition 5 Million Pixel Camera was employed, but its quality and resolution was low-grade, serving as a significant limitation during the initial construction of NOMA AI and equally pointing towards the need for the Arducam. For the display, the 5-inch Waveshare Display Touchscreen was employed, providing the intuitive GUI necessary for a functional app, while a custom-built tri-color LED system (Red/Yellow/Green) offered an immediate, unambiguous physical triage signal based on the system's assessment.
NOMA AI: Software
Dataset and Preprocessing
The dataset for NOMA AI was sourced from a dataset compiled by me on Kaggle (from existing inventories), called “Skin Diseases and Cancer Comprehensive Dataset”, containing 12 900 dermascopic and standard skin lesion images across 24 classes, including four malignant and twenty benign conditions. Each class folder was parsed automatically, and class weights were computed using Scikit-learn to address dataset imbalance that I noted to be a possible concern. This is due to the fact that several classes had comparative size differences, perpetuated by the variation with the particular category (e.g. benign at 1000 images compared to squamous cell carcinoma with approximately 200). The data was divided into 80% training and 20% validation subsets using TensorFlow’s image_dataset_from_directory method, ensuring reproducibility via a fixed random seed. I choose to resize all images to 224x224 pixels for optimal compatibility with MobileNetV3 and normalized between 0–1. Extensive data augmentation was equally applied using TensorFlow’s built-in layers to improve generalization, including random flipping, rotation, contrast, zoom, and brightness adjustment.
Model Architecture
The model architecture was based on MobileNetV3, a state-of-the-art CNN architecture known for its superior efficiency through compound scaling. This model was equally employed due to the fact that I learnt that it was not built with SELECT_TF_OPS, allowing for its tranquil implementation on Pi 4.The network was initialized with ImageNet pre-trained weights, and the top layers were customized to adapt to the skin disease classification task.
Model Configuration:
- Base Model: MobileNetV3 (pre-trained on ImageNet)
- Input Shape: 224×224×3 pixels
- Initial Weights: ImageNet pre-trained
- Preprocessing: Custom TFLite-compatible rescaling layer (converting [0,255] to [-1,1])
Custom Classification Head: The classification head was enhanced for high accuracy while maintaining TFLite compatibility:
- Global Average Pooling: Extracted from MobileNetV3's feature extractor
- Dropout Layer (0.3): Initial regularization
- Dense Layer (512 units, ReLU activation): Enhanced feature learning
- Batch Normalization: Stabilized training and improved convergence
- Dropout Layer (0.4): Additional regularization to prevent overfitting
- Dense Layer (256 units, ReLU activation): Further feature refinement
- Dropout Layer (0.3): Final regularization layer
- Softmax Output Layer (24 units): Multi-class prediction for skin diseases
Training was performed on Kaggle's GPU environment (Tesla T4) using TensorFlow 2.18.0. The model was optimized for TFLite compatibility with integrated preprocessing layers to eliminate external dependencies for edge deployment.
Training Strategy (Three-Stage Approach):
- Stage 1 – Classifier Training (30 epochs): Base MobileNetV3 layers were frozen, and only the custom classifier head was trained with a learning rate of 0.001
- Stage 2 – Fine-Tuning (40 epochs): Last 40 layers of MobileNetV3 were unfrozen and fine-tuned with a reduced learning rate of 0.0001
- Stage 3 – Full Training (Conditional, 30 epochs): Activated only if validation accuracy remained below 75%; full model unfreezing with very low learning rate (0.00001)
Training Strategy
The model was trained for 100 epochs using:
- Optimizer: Adam optimizer with decaying learning rates
- Loss Function: Categorical cross-entropy with class weighting
- Metrics: Accuracy as primary evaluation metric
- Class Balancing: Automatic computation of class weights using compute_class_weight to handle dataset imbalance
- Early Stopping: Custom callback terminating training when targets were achieved (85% training accuracy, 75% validation accuracy)
Model Conversion and Optimization
After training, I wanted to ensure that the model was tflite compatible given that the Pi 4 runs better on a Tensorflow environment that is much lighter and more mobile.
- TFLite Conversion: Model successfully converted using tf.lite.TFLiteConverter on Kaggle
- Optimization: Applied tf.lite.Optimize.DEFAULT for aggressive optimization
- SELECT_TF_OPS: It is essential that this was not used in the conversion or present at all in the base model, or else the model cannot fully load on the device
- Model Preservation: Both .keras and .tflite formats saved for deployment (on Kaggle)
- Saved as: /kaggle/working/noma_cancer_ai_model.keras
The integrated preprocessing layers ensured seamless deployment without additional preprocessing steps on edge devices.
Device Integration
The optimized TFLite model was integrated into a compact, portable diagnostic device equipped with the following materials.
Detailed Material’s List of NOMA AI Hardware
| Materials | Price | Functionality |
|---|---|---|
| Raspberry Pi 4 (4 GB) | $90.99 |
|
| Waveshare 5” Touchscreen | $59.99 |
|
| Miuzei Basic Starter Kit | $19.99 |
|
| Lesnlok Green Acrylic Sheets 1/8 inch Thick 3mm | $18.99 |
|
| Gorilla Clear Grip Contact Adhesive | $12.61 |
|
| Arducam IMX519 | $33.99 |
|
| 64GB Micro SD Card | $13.99 |
|
| INIU Powerbank (20 000mAh) | $36.99 |
|
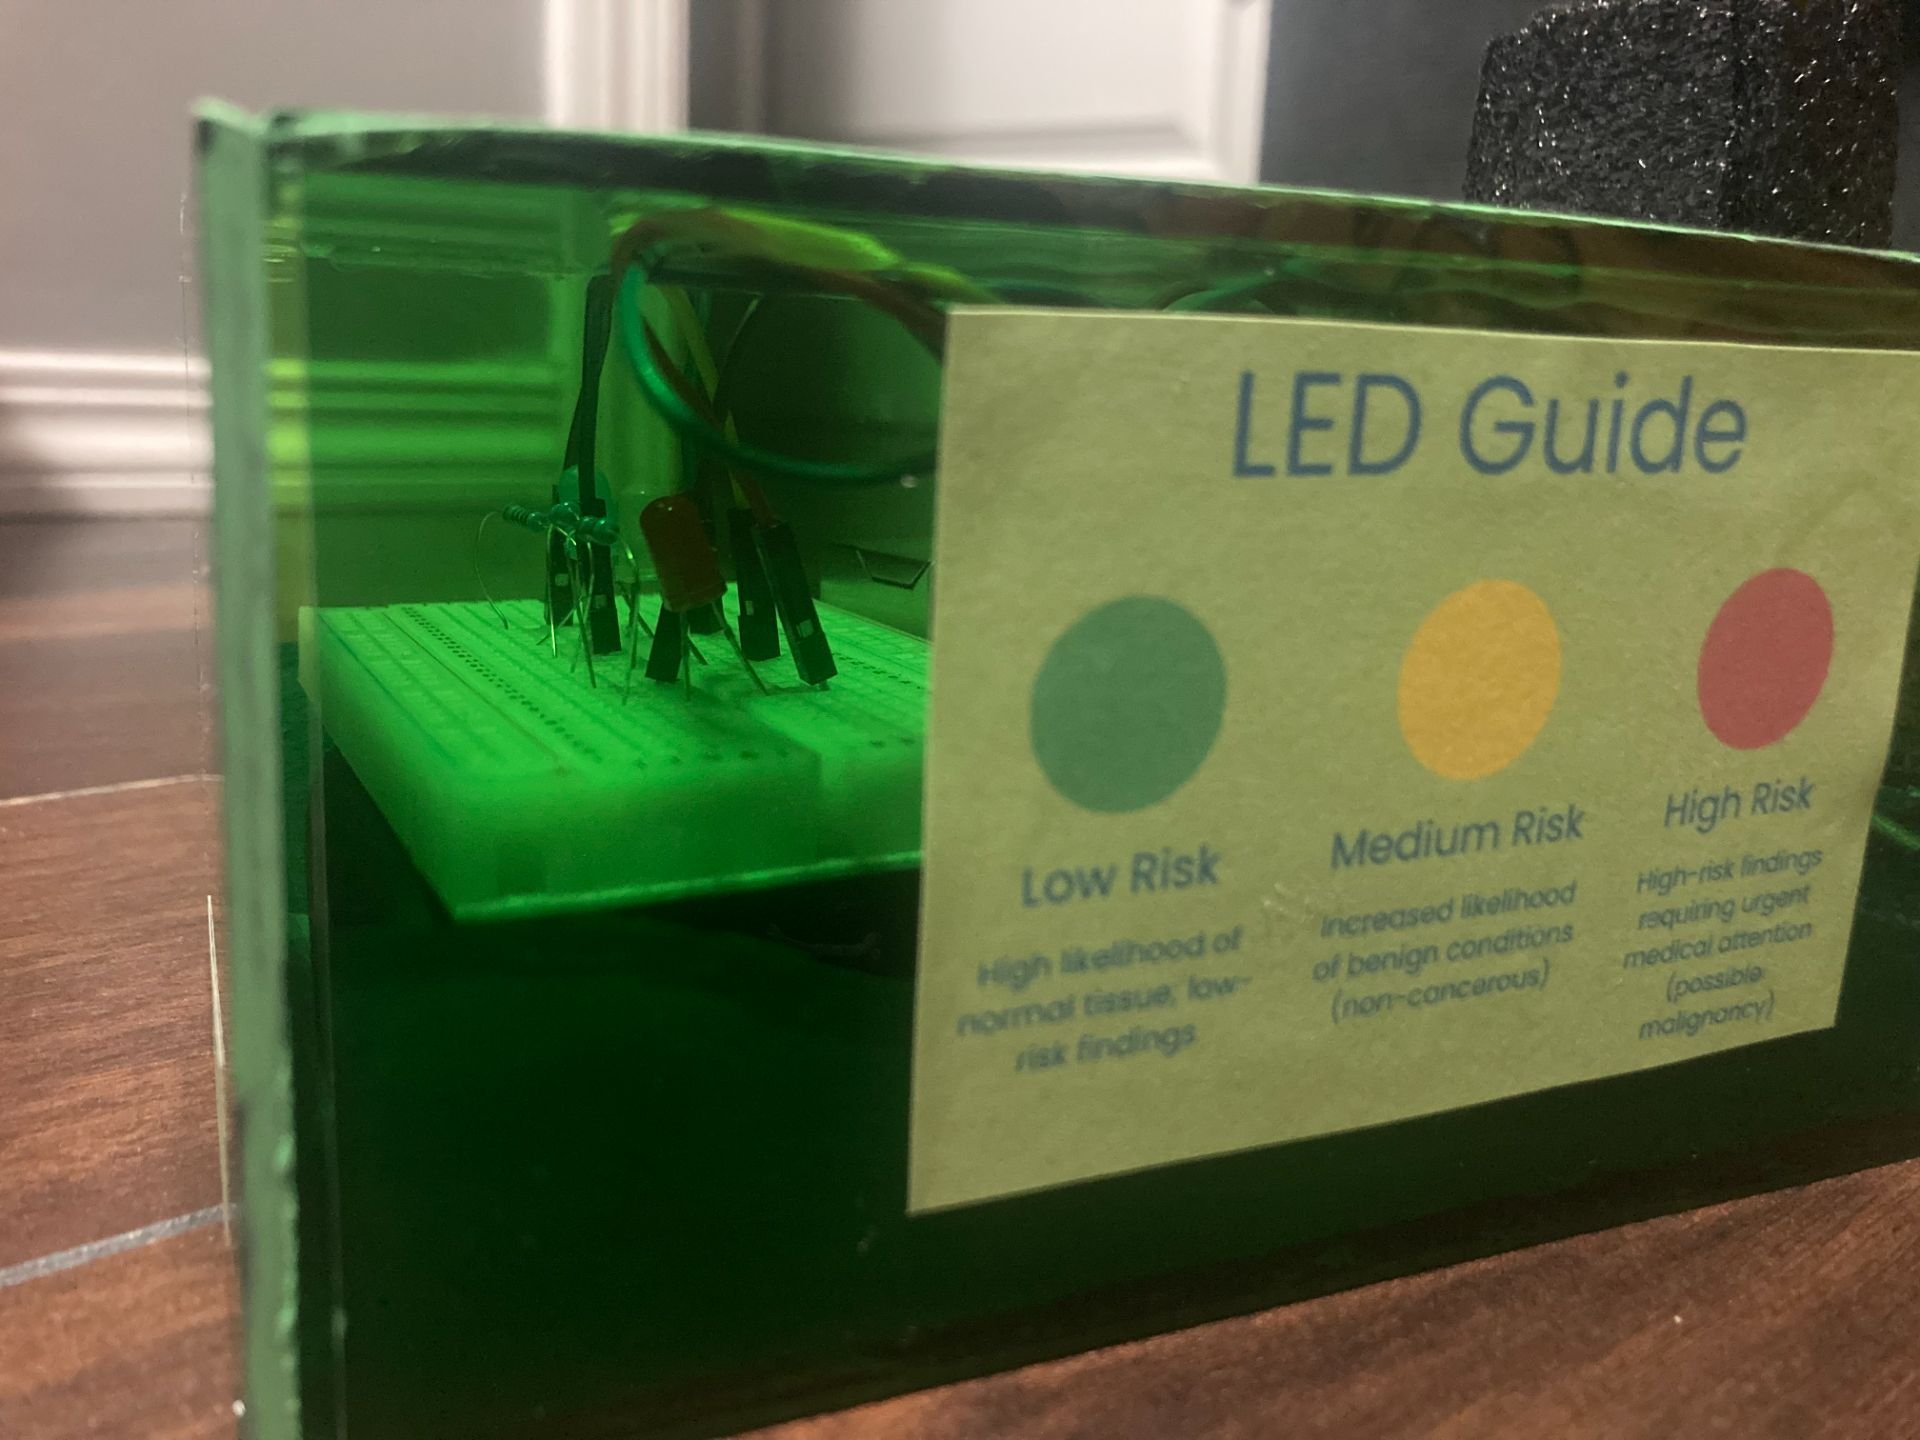 Figure 1: NOMA AI LED Array + Guide
NOMA AI APP
With the device now assembled, I carefully built the app's primary logic. Once a scan is initiated, the system launches a layered evaluation process. The AI performs an initial visual classification, but the decision does not end there. To reduce overreliance on automation and strengthen diagnostic confidence, NOMA AI deploys a clinical risk assessment based on the ABCDE melanoma criteria. Users are guided through targeted questions addressing asymmetry, border irregularity, color variation, diameter, and evolution. These are all essential factors that clinicians rely on in real-world diagnosis. This fusion of machine intelligence and clinical reasoning creates a more resilient screening framework than either method alone, as the use of only machine intelligence returned incomplete results and did not meet the needs I had previously stated concerning the variability of skin. This was because the predictions were made without complete context, without the bigger picture in mind.
Moreover, results are communicated immediately through a tri-colored LED alert system: red signals high-risk findings requiring urgent medical attention, yellow indicates lesions that warrant monitoring, and green confirms normal tissue. Each alert equally displays the most likely associated classification as determined by the model (melanoma, acne, normal, etc.). To reinforce trust and accountability, the system employs Grad-CAM visualization, producing heatmaps that reveal which regions of the lesion influenced the model’s decision, aiding to turn the AI from a black box into an interpretable tool.
Beyond detection, NOMA AI serves as a defensive education platform. Each screening reinforces dermatological literacy, helping users recognize warning signs and understand risk rather than passively receiving a result. This combination of custom hardware, explainable AI, and clinically grounded assessment protocols allows NOMA AI to function as an early-warning system. NOMA AI was not at all designed with the goal of replacing physicians, but to strengthen the first line of defense in the battle against skin cancer and various other skin diseases.
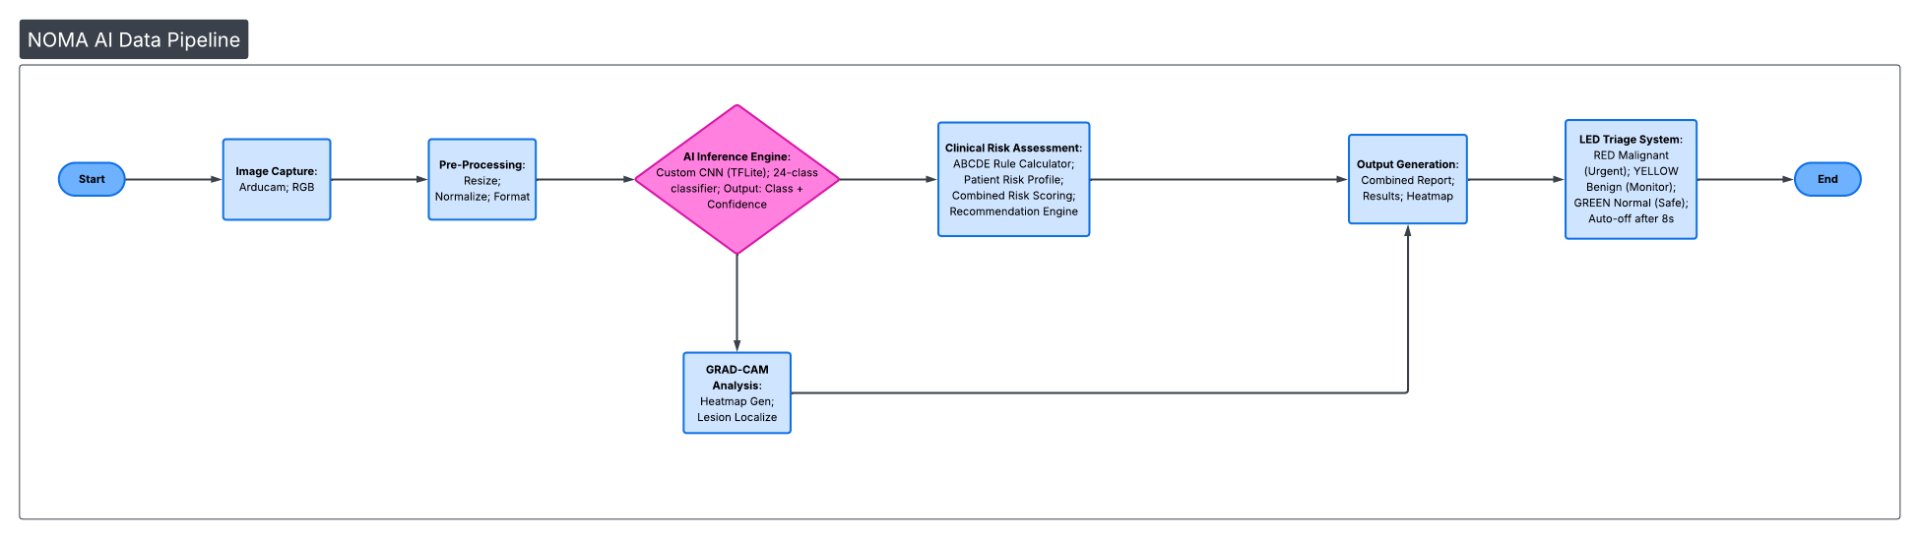 Figure 2: Detailed NOMA AI Data Pipeline
Here is the link to the NOMA AI GitHub repository: https://github.com/HeavenlyCloudz/NOMA-AI
This NOMA AI approach serves to encourage user resiliency and autonomy, given the nature of the screening, encouraging education while benefiting the dermal health for targeted communities.
PULMO AI: The Internal Structure + Audio Visualizer
While NOMA AI serves as a method for visualizing visible structures that are apparent to the naked eye, PULMO AI takes a different route by emphasizing focus on internal structures while employing the same fusion model approach. This device leverages the complementary nature of microwave imaging (sensitive to structural dielectric changes) and lung sound analysis (indicative of functional pathology) to create a composite diagnostic picture. At its core, PULMO AI addresses the critical need for accessible, non-ionizing technology that is both affordable and comprehensive, one that currently surpasses existing modalities such as CT scans (ionizing radiation, expensive) in this regard.
PULMO AI: Software
Dataset and Preprocessing
Audio
The dataset for the audio aspect of PULMO AI was sourced from the comprehensive "Asthma Detection Dataset Version 2" on Kaggle, containing 1,211 audio samples across five pulmonary conditions:
- COPD: 401 samples
- Asthma: 288 samples
- Pneumonia: 285 samples
- Healthy: 133 samples
- Bronchial: 104 samples
Audio Processing: Each audio file was processed through the YAMNet feature extraction pipeline to generate 1,024-dimensional embeddings. YAMNet, a pre-trained audio event classifier, served as an effective feature extractor for breath sound patterns, converting variable-length audio recordings into fixed-dimensional feature vectors suitable for classification.
Data Preparation: The extracted features were normalized and split into training (80%) and validation (20%) subsets, preserving class distributions through stratified sampling. Class weights were computed to address the inherent dataset imbalance, ensuring robust model performance across all pulmonary conditions.
Model Architecture
The classification system employs a streamlined neural network optimized for embedded deployment:
Feature Extraction: YAMNet pre-trained model (MobileNetV1-based) for generating 1,024-dimensional embeddings from raw audio
Custom Classification Head:
- Dense Layer (512 units, ReLU activation): Initial feature transformation
- Batch Normalization: Training stabilization
- Dropout (0.3): Regularization to prevent overfitting
- Dense Layer (256 units, ReLU activation): Feature refinement
- Batch Normalization: Additional normalization
- Dropout (0.3): Further regularization
- Dense Layer (128 units, ReLU activation): Final feature compression
- Dropout (0.3): Output regularization
- Output Layer (5 units, Softmax): Multi-class probability distribution
Training Strategy
The model was trained for 100 epochs using:
- Optimizer: Adam with scheduled learning rate decay
- Initial Learning Rate: 0.001
- Learning Rate Schedule: Step-wise reduction at epochs 29 (0.0005), 37 (0.00025), 45 (0.000125), and 53 (0.0000625)
- Loss Function: Categorical cross-entropy
- Metrics: Accuracy for both training and validation sets
At this point, the audio part of PULMO AI is complete, with a placeholder app capable of analyzing acoustic signals to give immediate feedback on the likelihood of disease present. However, this is only one piece of PULMO AI. The microwave imaging part has not yet been explored. Thus, in order for PULMO AI to truly be a success, we must address this front! However, how can we know if this system, which is still quite novel as a whole and advancing rapidly, can actually be feasible? This is where initial prototyping and simple proof-of-concept comes into play.
Proof of Microwave Concept
Microwave imaging is primarily based off of how materials or tissue, in this instance, interacts with the electric field, in response to electromagnetic waves like microwaves. Tissue has unique dielectric properties that influence these interactions, such as water content, ionic concentration and cell density. Thus, this affects (1) its relative permittivity, εr, a measurement of the storage of electric energy within a substance, (2) its conductivity, σ, a measurement of how well a substance conducts electricity, and finally (3) its loss tangent, tan δ, the ratio of energy lost to energy stored. We are able to manipulate and explore the changes in these variables by using microwaves. This form of energy is emitted from antennas, which in this case, are UWB Vivaldi antennas, capable of penetrating tissue or material that mimics it, reflecting and finally scattering at boundaries between tissues with contrasting properties. Given these principles, we can then draw up a defining marker of tumors that differentiate them from normal tissue. Drawing back from the dielectric properties mentioned earlier, tumors actually have a higher water content, which in turn allows for higher permittivity and conductivity. Therefore, microwave absorption is much higher. We can validate this train of thought with Maxwell's equation, where;
Total field at receiver:
- E_total = E_incident + E_scattered
- Where the scattered field is related to dielectric constant:
- E_scattered α ∫ (contrast function x Green's function x E_incident) d∇
The inverse problem attempts the reconstruction of the contrast function, which represents the spatial distribution of dielectric properties inside the object. In turn, tumors are much stronger scatterers due to the large mismatch in dielectric properties.
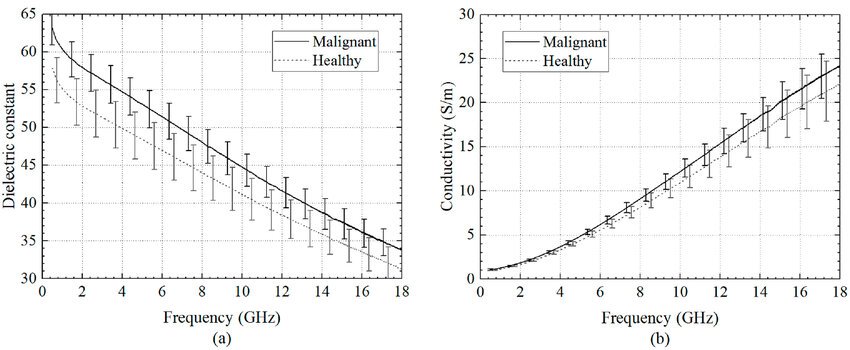 Figure 3: Visualization of Malignant vs Healthy Tissue Dielectric Constant and Frequency
This theory was the backbone for my continued experimentation, as the logic presented above gave me a strong starting point for what my data had to follow. Thus, I began with the configuration of my NanoVNA-F V2, the main interperator of my UWB antennas signals.
NanoVNA-F V2 Configuration
Vector Network Analyzer's output two main scattering parameters (s-params): S11 and S21. S11 serves as a measurement of impedance because it acts as a reflector, or what is bounced back from the subject, which will be reflected back to Port 1 (CH0) of my VNA. S21 acts as the measurement of insertion loss/ gain, or the signals that have been transmitted from Port 1 to Port 2 (CH1) of my VNA. For my particular project of lung screening, S21 is my core, main measurement. The signal loss (attenuation) and phase shift as microwaves go through the chest from my Tx and Rx antennas, in turn building the structural information for my images. S11 is for testing my antennas and equally ensuring if they are in tune or not, as well as simple object detection. Consequently, it is imperative to calibrate the VNA in order to accurately interpret and understand its readings. I followed the ensuing procedure:
- Determine range (my range is 2-3 GHz ), where is 2 is start and 3 is stop
- Begin Calibration (two port), where button is Cal
- OPEN on CH0 (open standard)
- SHORT on CH0 (short standard)
- LOAD on CH0 (50 ohms terminator)
- OPEN on CH1 (Port 2 of S21 params)
- SHORT on CH1
- LOAD on CH1
- THROUGH (connect ports with SMA cable)
- Done, then I clicked SAVE
However, when I finished, I noticed a very intriguing result. This was because the 50 ohms terminator wasn't actually a proper terminator, even after I verified with a multimeter and got a result of 51-54 ohms. This changed the direction of my project from employing S11 params to solely relying on S21 params due to the fact that the LOAD step only impacted the result of S11. This is because my previous research demonstrated how the defining factor for tumorous vs healthy is dielectric and conductive properties, which rely on transmission. Therefore, the absence of S11 params might actually be beneficial to my system in certain aspects, where my setup is no longer overwhelmed by several different parameters that serve different purposes but mostly one type that is much more straight-forward.
Following this revelation, I began my simple setup, where my antennas are 12 cm apart facing up from my foam mound connected to my VNA via my SMA Bingfu cables, no switches implemented yet, ready to test my revised theory. I set up a simple script to ensure my NanoVNA connectivity, with a result returning positive. After this, the system's core capability was tested with a simple phantom model. A saline solution (≈0.9% NaCl) mimicked the average dielectric properties of lung tissue. A small aluminum sphere represented a highly scattering tumor mass. Measurements were taken for three scenarios: air (baseline), the saline phantom ("healthy"), and the phantom with the embedded sphere ("tumor").
Figure 4: Air - Normal
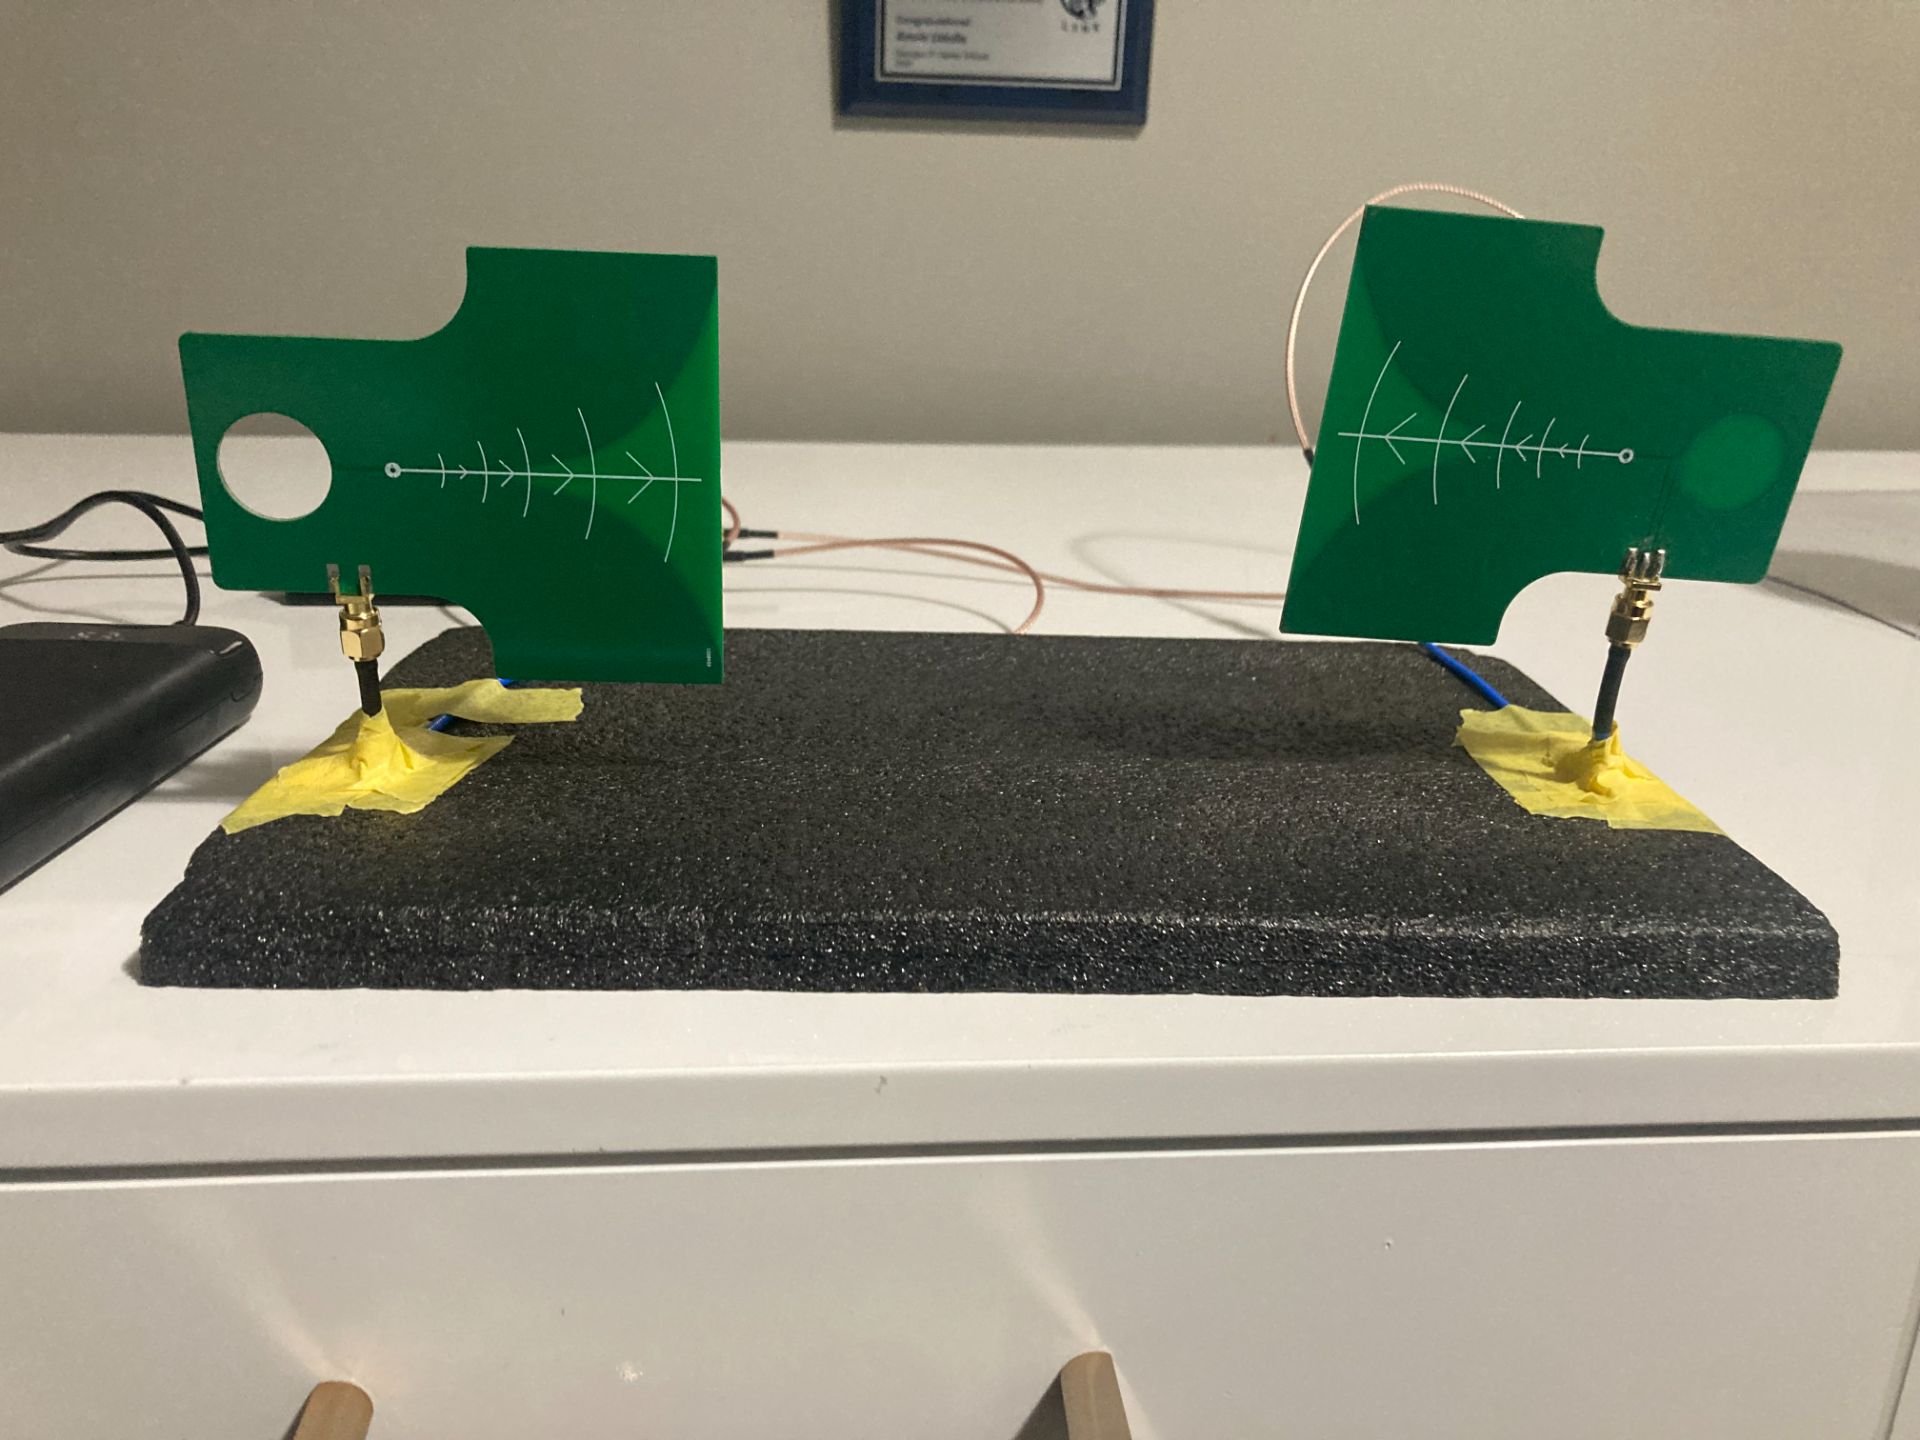
Figure 5: Healthy - Saline solution
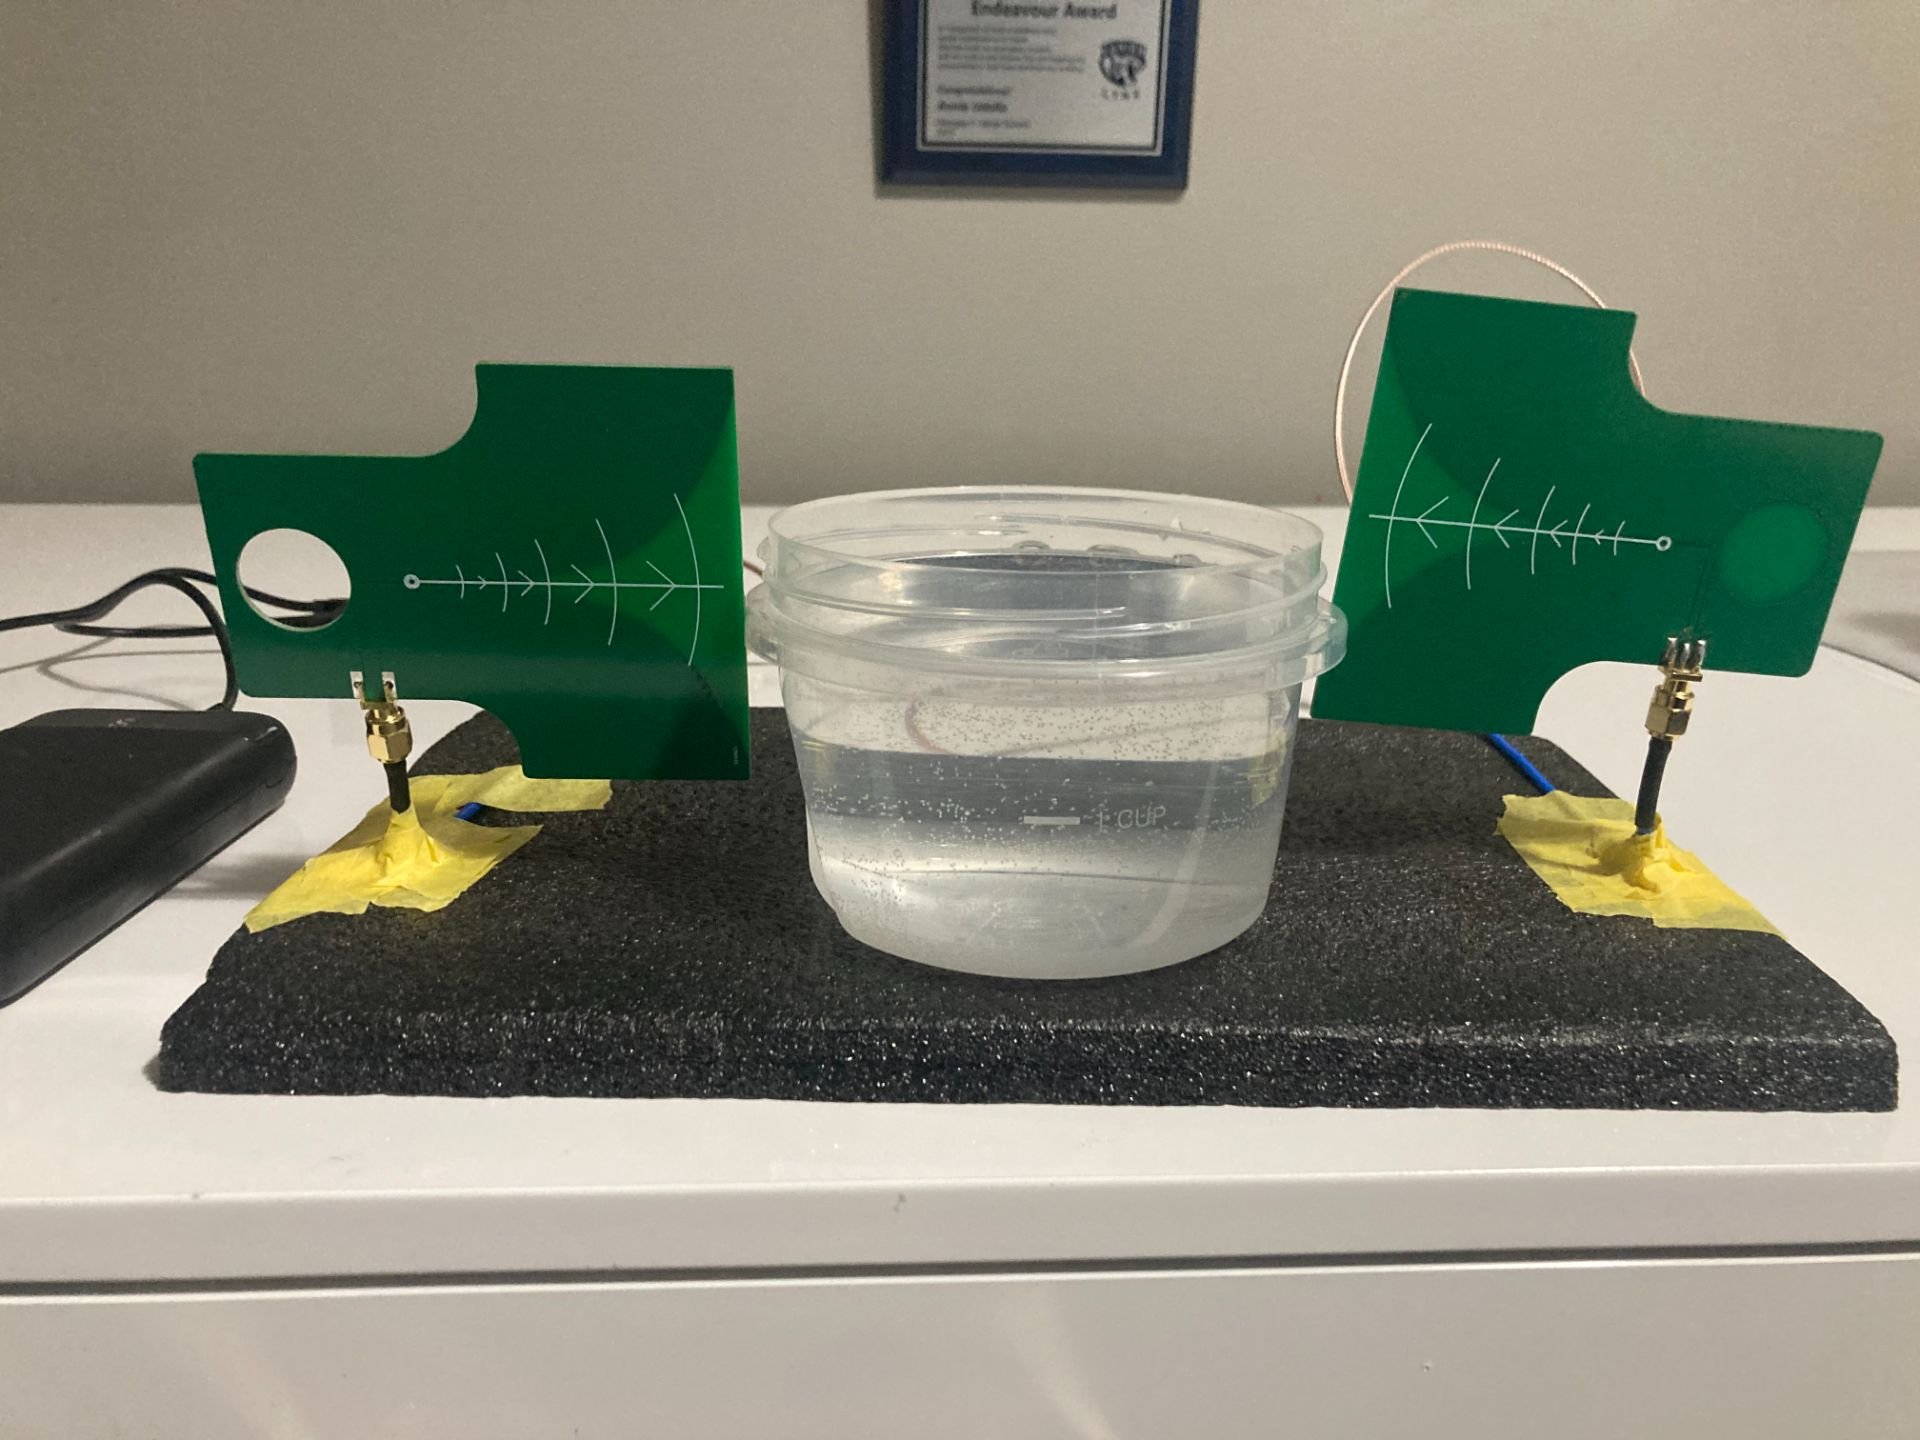
Figure 6: Tumor - Saline solution + Aluminum Ball
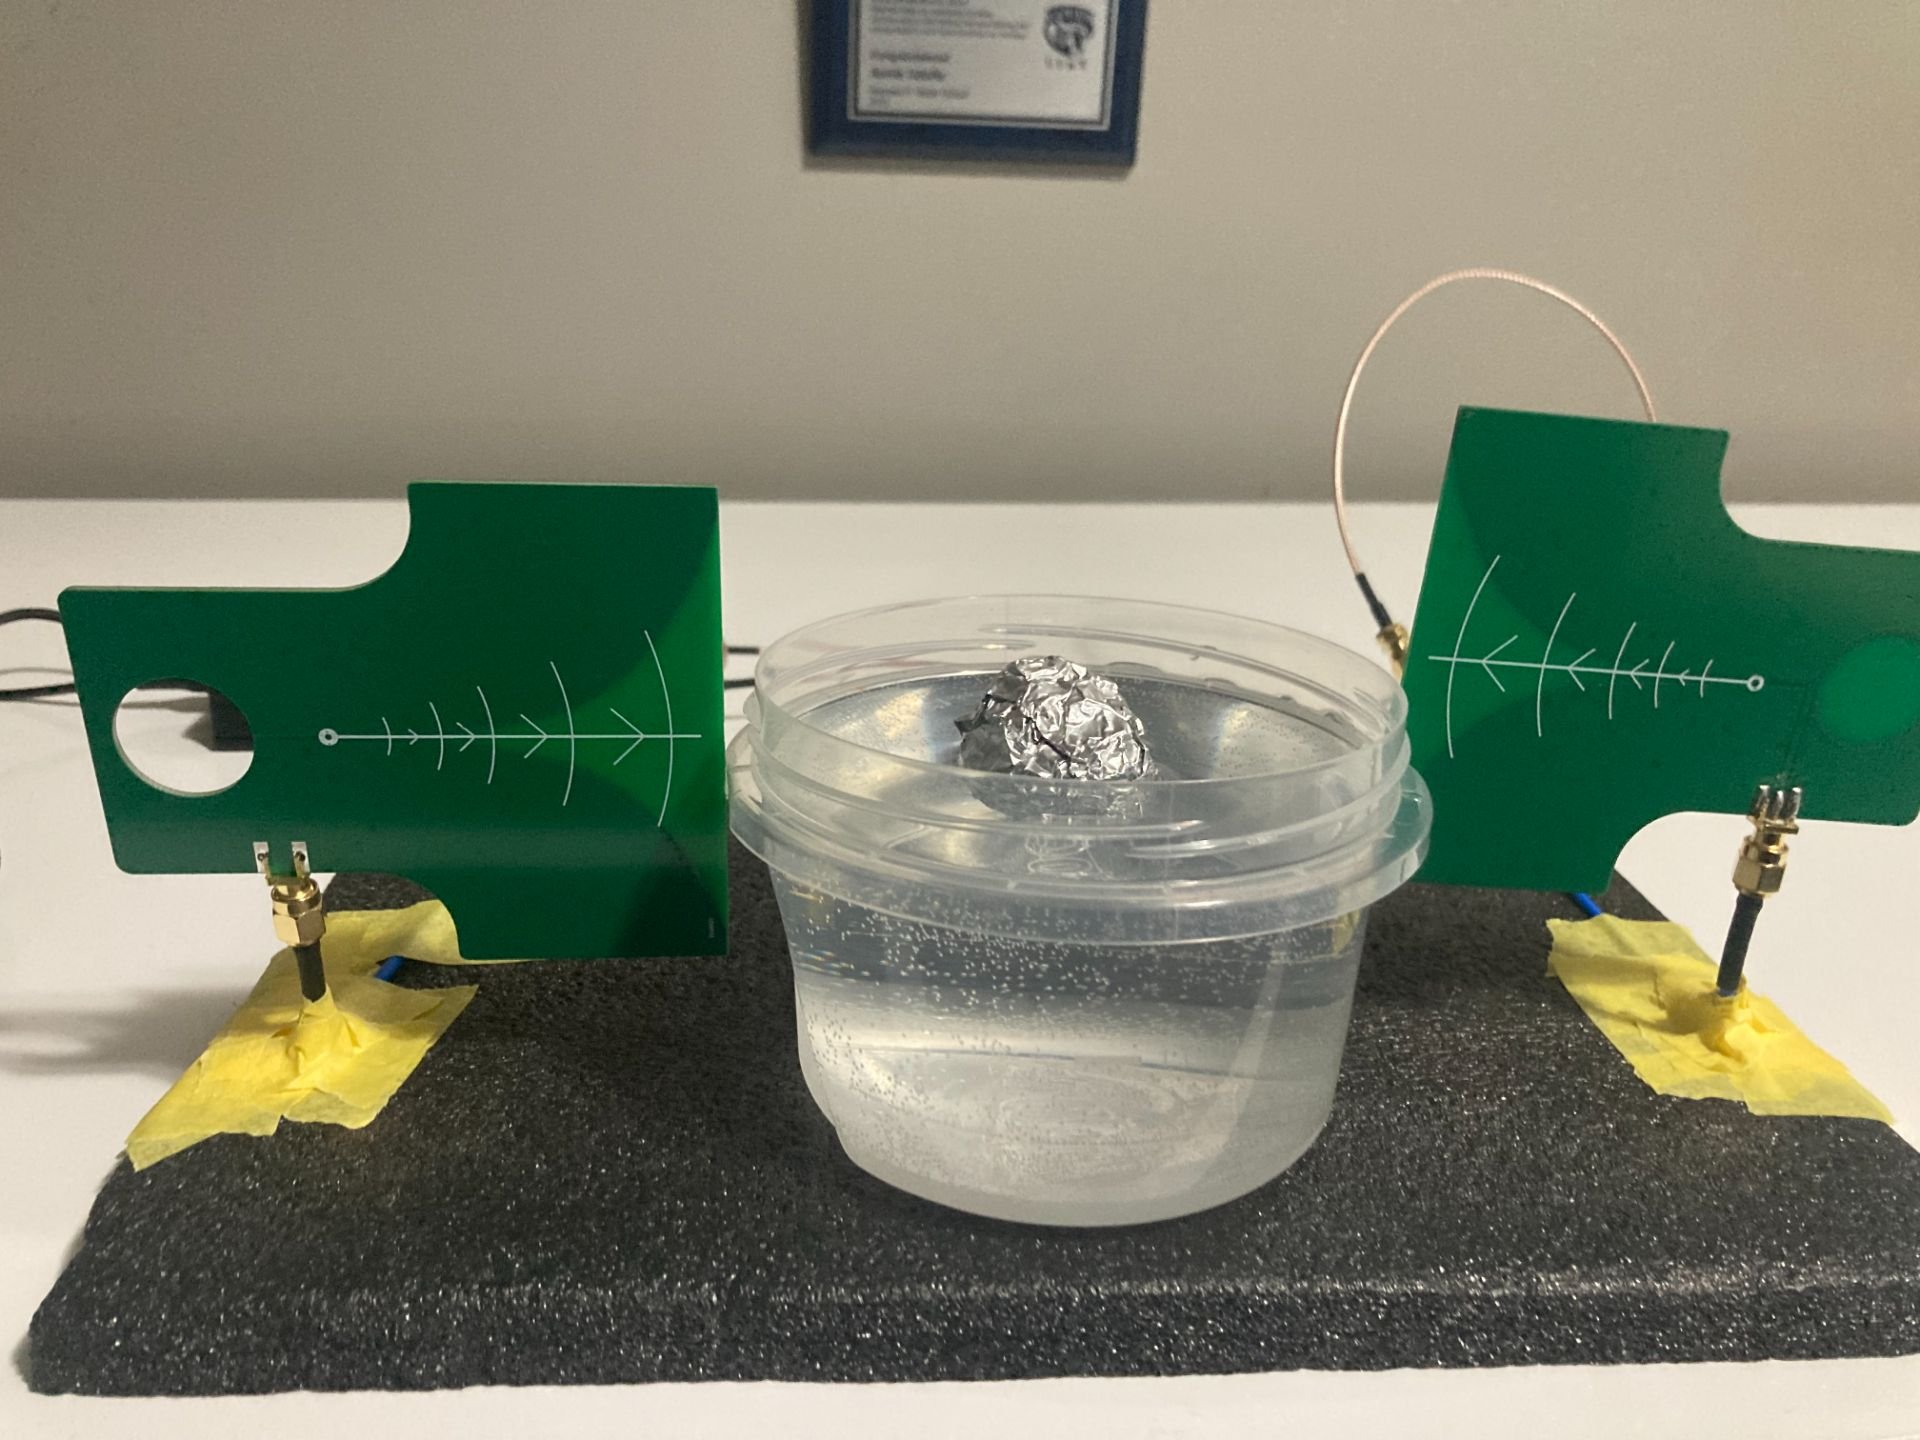
Plastic Container - Mimic of skin barrier, little effect on 3 GHz microwaves
Results:
| Air Baseline average S21 | Healthy Phantom average S21 | Phantom with High-Contrast Scatterer (Simulated Tumor) average S21 |
|---|---|---|
| -17.83 dB | -19.62 dB | -24.52 dB |
| *Antennas are coupled + transmit energy | *The drop shows sensitivity | *Strong tumor signal detected (>2db) |
Signal drop (Air → Healthy): 1.79 dB Signal drop (Healthy → Tumor): 4.90 dB
These results proved the functionality of my antennas without the S11 params.
Thus I tried an even more detailed experiment exploring even more nuances with my two-antenna setup, scaling tumor size, position, number of tumors and phantom depth. The results are demonstrated in this graph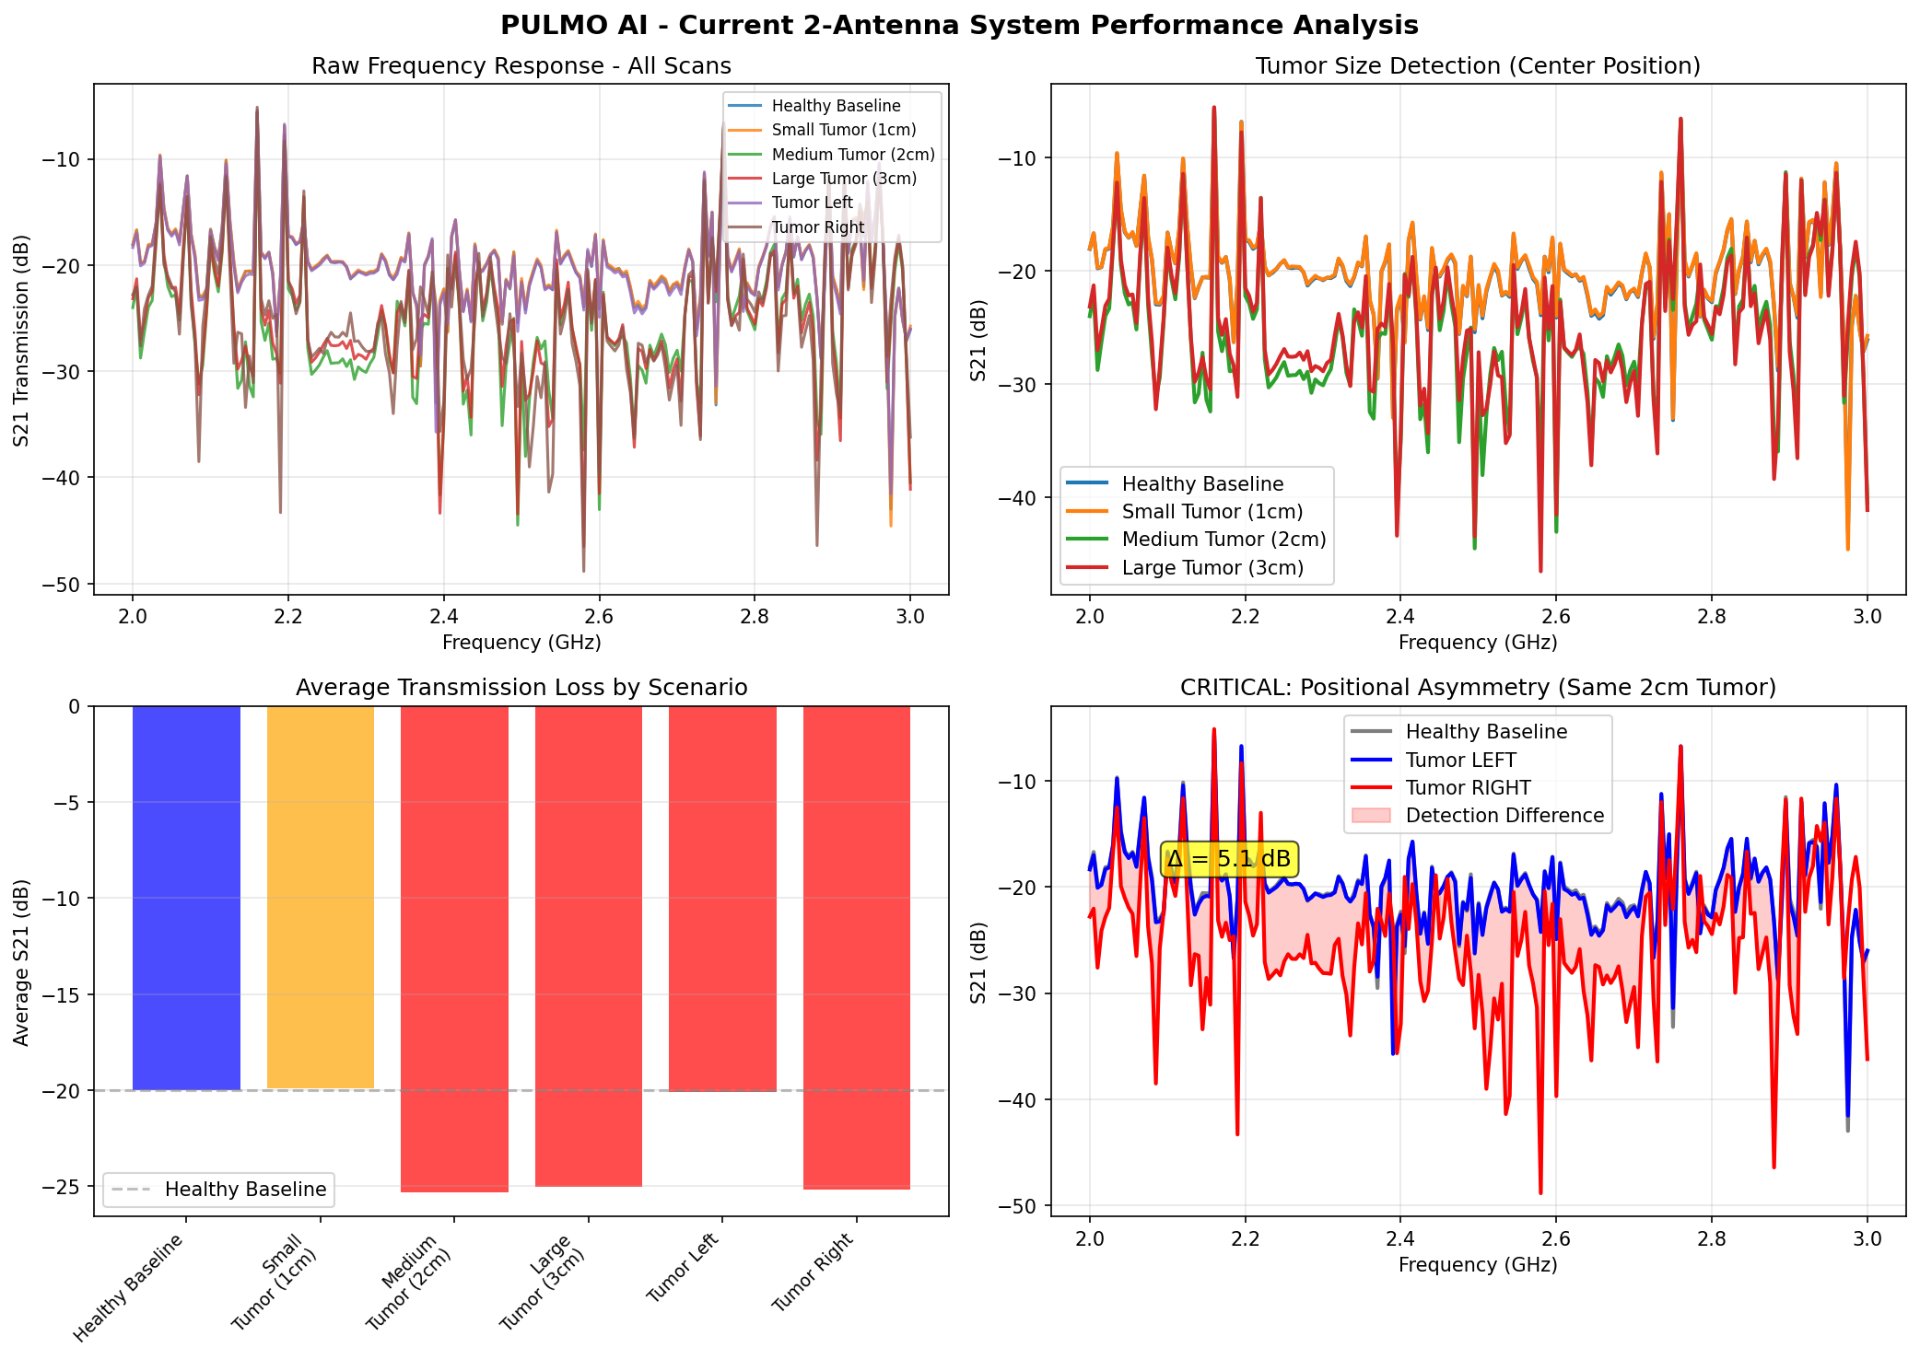 Figure 7: Detailed PULMO AI 2-Antenna Setup
The data, summarized in Figure 7, revealed several key insights:
- Clear Detection Threshold: Medium (2 cm) and large (3 cm) "tumors" were easily detectable (>5 dB change), while a 1 cm target showed minimal change. This established and demonstrated the resolution limit of the simple two-antenna configuration.
- Spatial Dependence: Tumor position significantly affected the signal, highlighting the system's inherent sensitivity to location. This is a crucial feature that necessitates a multi-angle imaging array for clinical utility.
These results served as the final validation for my proof-of-concept using a minimal setup. They confirmed the working principle, quantified baseline performance, and, most importantly, defined the exact specifications for the next development phase: integrating a 4-antenna, switch-controlled array to overcome resolution limits, enable spatial localization, and collect the multi-angle data required for true image reconstruction and robust AI diagnosis.
Development of a 4-Antenna Switch-Multiplexed Array
PULMO AI's microwave imaging subsystem is built around a time-multiplexed array of four antennas. This design acquires multi-angle transmission data without the need for multiple expensive RF sources or receivers. The core innovation is the use of two RF switches, controlled by a central processor (GPIO), to rapidly cycle through different transmitter (Tx) and receiver (Rx) antenna pairs, building a rich dataset for machine-learning-based analysis.
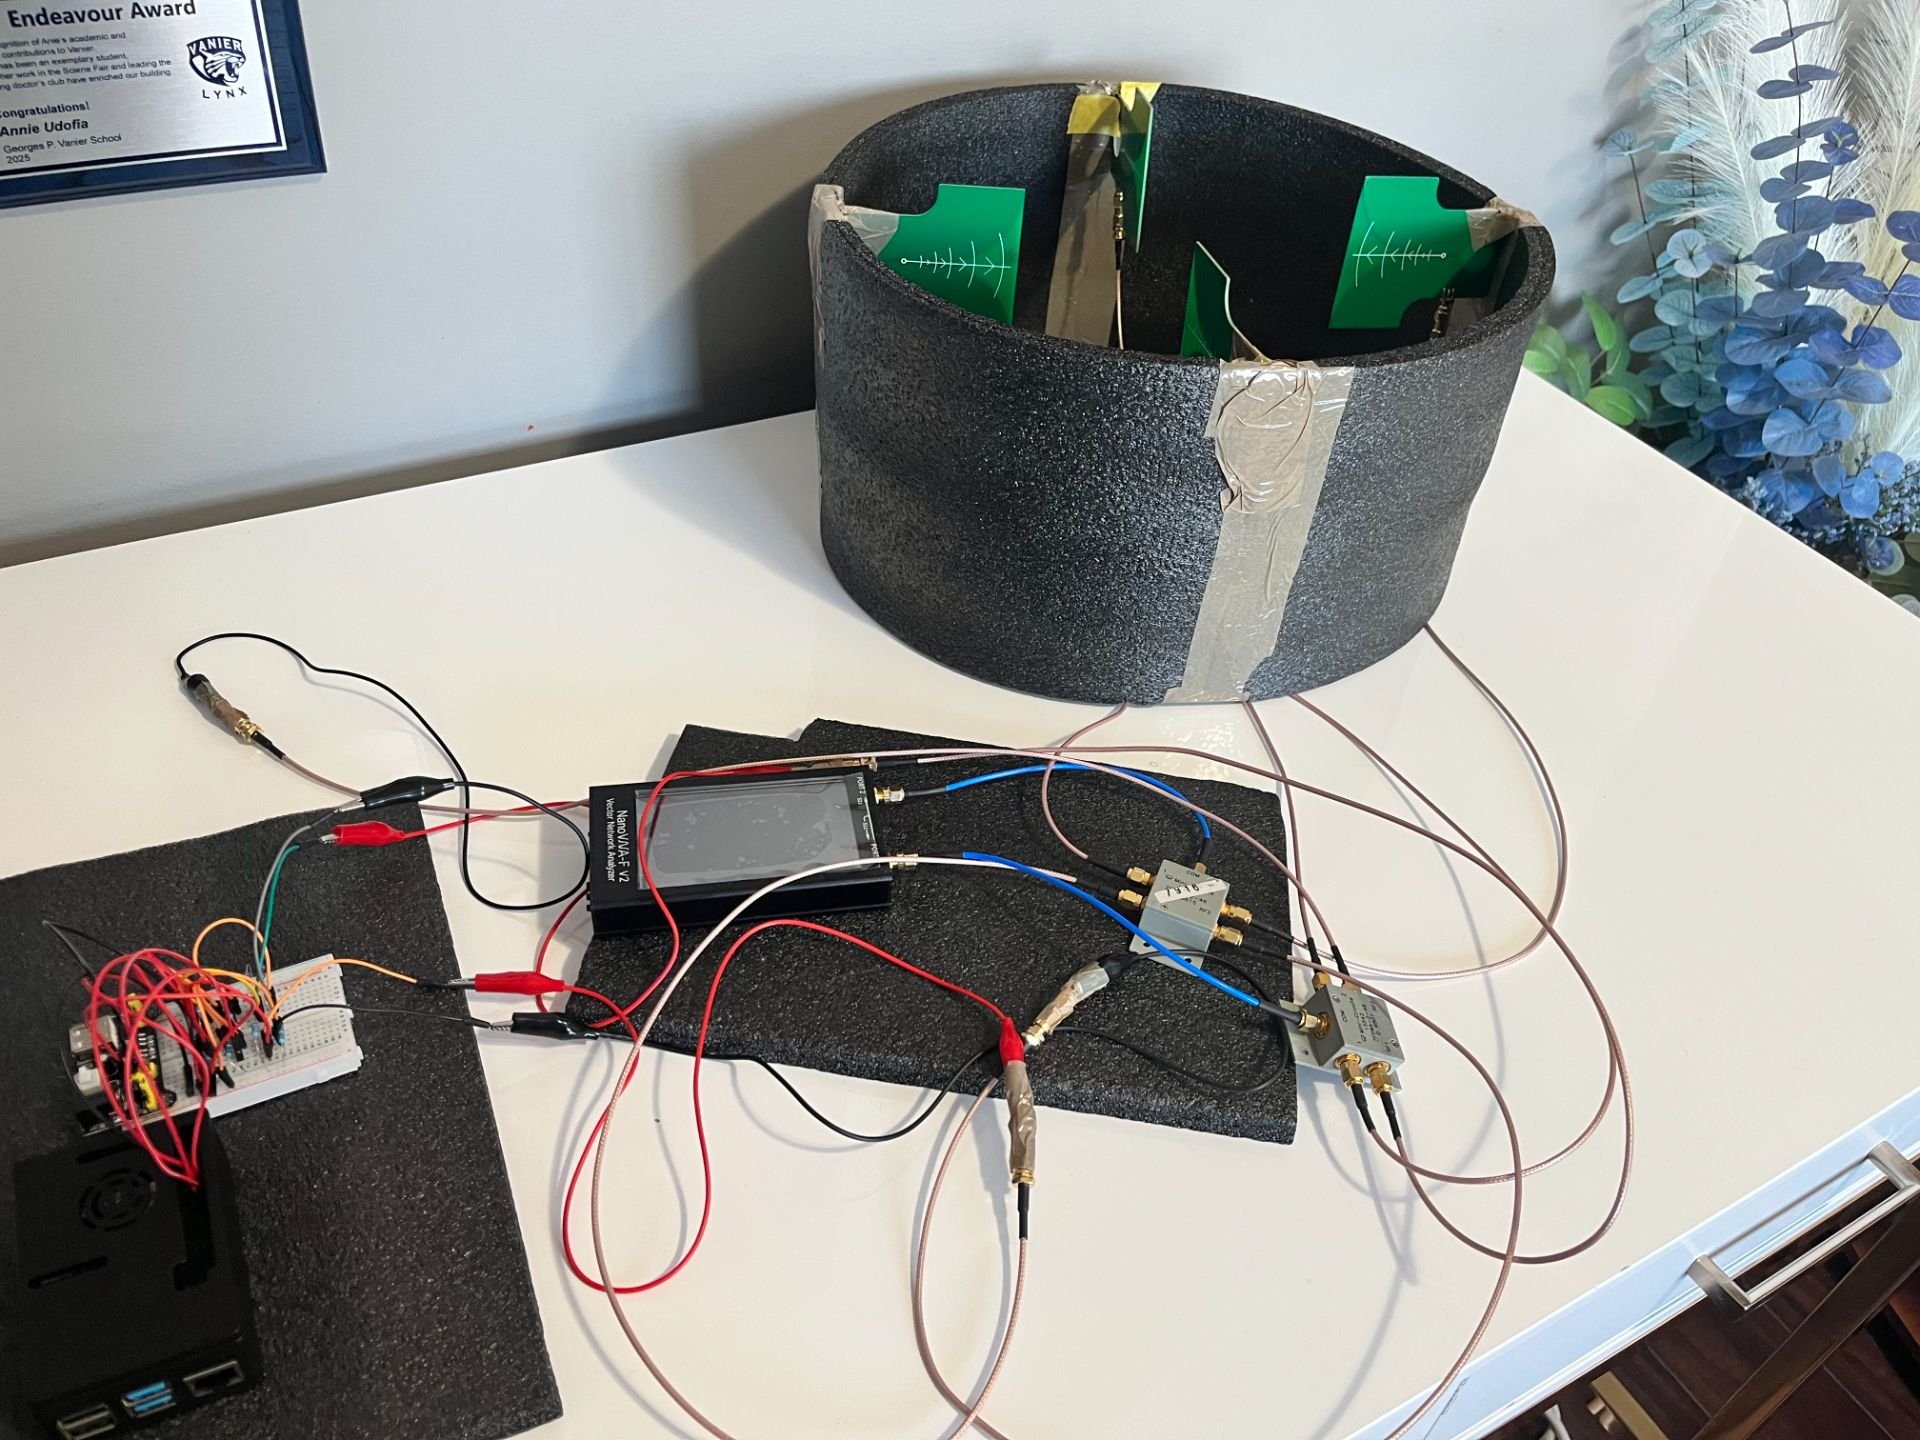 Figure 8: PULMO AI 4-Antenna Switch-Multiplexed Array Initial Prototype
Materials for this step included:
- Breadboard (no requirement for soldering → enhanced flexibility and adaptability)
- 2x 2N222 NPN Transistors (sourced from my Miuzei kit)
- 4x 1kΩ Resistors
- 4x 5.1kΩ Resistors
- Jumper Wires
- Dupont Wires
- Alligator Wires (connect RF Switch SMA male pin to Jumper Wires)
- Raspberry Pi 4
- SMA Bingfu Cables, NanoVNA, Antennas
- RF Switch (#1 goes to CH0/Tx; #2 goes to CH1; Rx)
Setup
These RF Switches are Mini-Circuits ZFSWA-2-46 4.6GHz SMA RF Switches, and are thus Single-Pole, Double-Throw (SPDT). These means they serve as a transport of RF signals:
- Common Port (Port 1): The incoming track that directly connects to the VNA (CH0 for TX switch, CH1 for RX switch)
- Port 2 & Port 3: The two possible outgoing tracks, connecting to the antennas.
- Port 1 = Connects to Antenna 1 (TX switch) or Antenna 3 (RX switch)
- Port 2 = Connects to Antenna 2 (TX switch) or Antenna 4 (RX switch)
- DC Control Ports (RF1, RF2): The levers that changes the track by serving as DC/ voltage control, requiring 5V/GND.
- RF Port 1 = Receives +5V or GND to select signal path
- RF Port 2 = Receives the opposite voltage of RF1 (GND or +5V)
When integrating the Raspberry Pi 4 into this setup to control the switches, the 5V pin of the Pi was connected to the breadboard positive rail, while the Pi GND Pin connected to the negative rail via Female-to-Male Dupont Wires. Direct connection from the RF Switch SMA cable to the ground system was achieved via the connection of alligator clips to the SMA cables pin, contributing to partial signal loss, but one that did not exceed the threshold for system disruption. The control logic that determined which antennas served as transmitters (TX) or receivers (RX) followed a straightforward voltage-based selection: to utilize Antenna 1 as the transmitter, RF1 was set to +5V and RF2 to GND; conversely, to select Antenna 2 as the transmitter, RF1 was set to GND and RF2 to +5V. The same principle applied to the second switch controlling the receiver antennas 3 and 4.
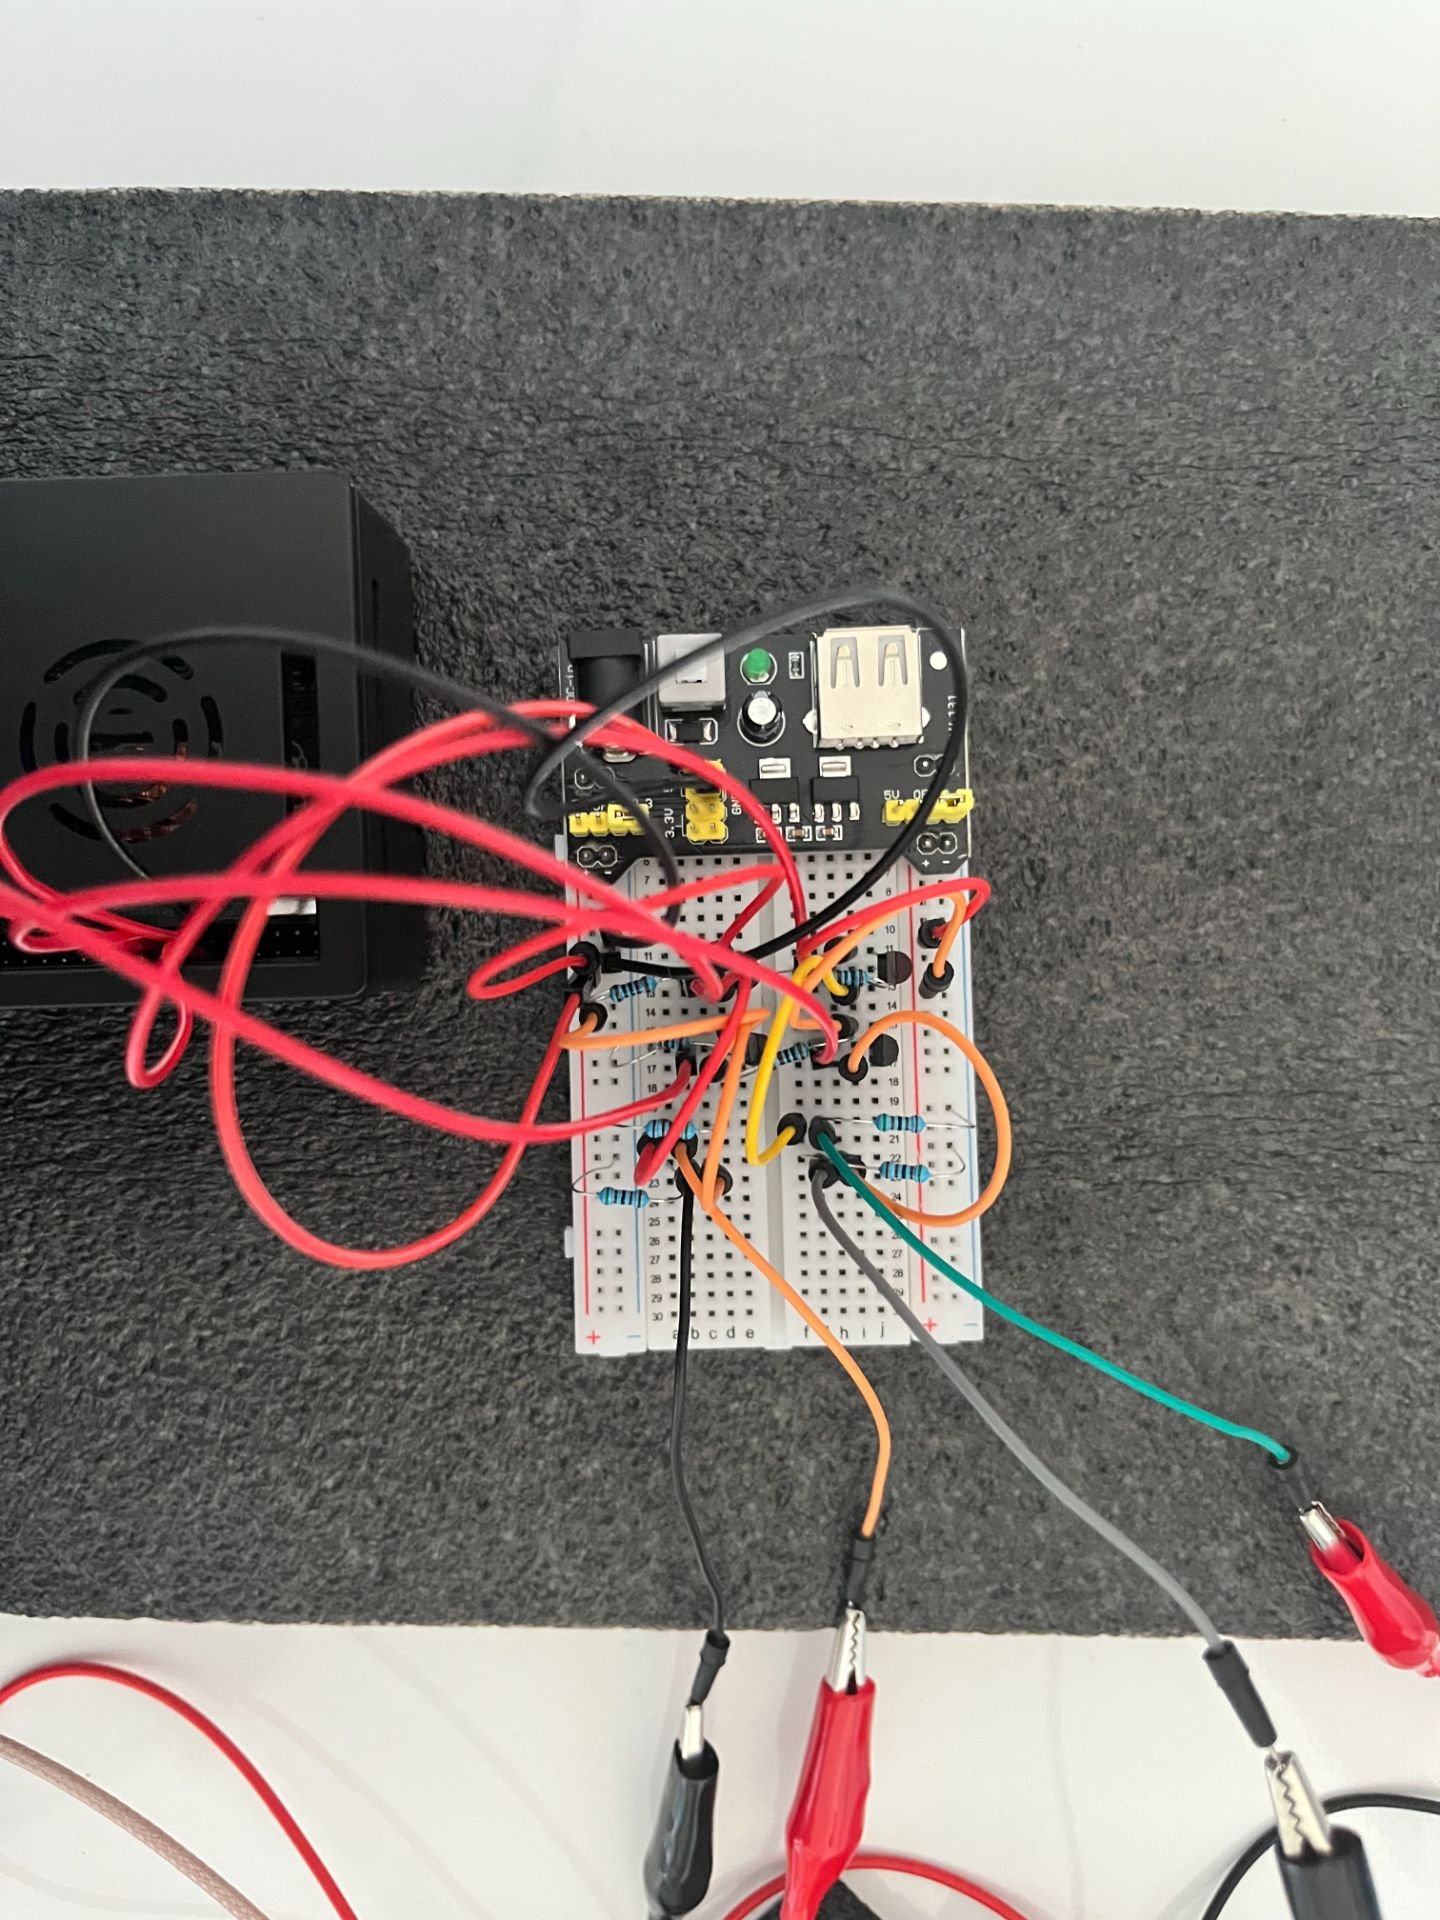 Figure 9: Breadboard Control Circuit
Possible Paths
| Path | Transmitter (TX) | Receiver (RX) | Switch #1 State | Switch #2 State |
|---|---|---|---|---|
| 1 | Antenna 1 | Antenna 3 | RF1 = +5V, RF2 = GND | RF1 = +5V, RF2 = GND |
| 2 | Antenna 1 | Antenna 4 | RF1 = +5V, RF2 = GND | RF1 = GND, RF2 = +5V |
| 3 | Antenna 2 | Antenna 3 | RF1 = GND, RF2 = +5V | RF1 = +5V, RF2 = GND |
| 4 | Antenna 2 | Antenna 4 | RF1 = GND, RF2 = +5V | RF1 = GND, RF2 = +5V |
Multi-Angle Data Acquisition & Feature Extraction
In order for the system to be automatic and no longer reliant on manual activation and RF switching, I developed Python scripts initially run on my laptop to ensure the feasibility of multi-angle data acquisition. They are the following:
- switch_controller.py = Handles digital control of Tx and Rx switches
- vna_interface.py = Interfaces with my NanoVNA in order to acquire S21 data
- array_scanner.py = Iterates through antenna combinations as well as recorder of measurement
- calibration.py = Applies baseline subtraction alongside normalization
- feature_extraction.py = Converts raw S21 traces into structured, machine-learning ready features
Here is the link to my GitHub repository housing my scripts and their accompanying results: https://github.com/HeavenlyCloudz/PULMO-AI
All these scripts are to be run via a CLI-based control script (Powershell, Command Prompt) before being automated on a full integrated system akin to its partner NOMA. It will follow a simplified sequence:
- Set Tx Antennas
- Set Rx Antennas
- Trigger VNA sweep
- Record S21 magnitude and phase
- Store data with metadata as CSV files (Tx/Rx index, frequency vector, timestamps)
AI-Driven Classification & Fusion with Acoustic Data
*This step is still very much in development and evolving. Current methodology described here is subject to change*
I have designed a proposed feature-level fusion pipeline, which will be implemented following the completion of the multi-antenna microwave array. This approach was chosen because it allows the model to learn complex, cross-modal relationships while maintaining explainability.
- Microwave Feature Extraction: As detailed in the previous section, the feature_extractor.py script converts raw S21 traces from all antenna pairs into a structured feature vector M. This vector includes statistical measures (mean attenuation, standard deviation, frequency-domain slope) and, crucially, spatial features derived from comparing signals across different Tx-Rx paths. This provides information about the location of any anomaly.
- Acoustic Feature Extraction: The audio pipeline, already validated, uses YAMNet to convert lung sound recordings into a 1,024-dimensional embedding vector A. This embedding captures the complex temporal and spectral patterns indicative of conditions like crackles and wheezes.
- Feature Concatenation: The two feature vectors are concatenated to form a single, combined representation F = [M, A]. This combined vector now contains information about both the structure and function of the underlying tissue.
- Unified Classification: The concatenated vector F will be fed into a final classifier: a XGBoost model. This is because XGBoost models are able to handle and process multi-dimensional RF and microwave data without necessitating extensive and complex feature scaling. Following that, this model will be trained on data from my phantom experiments. This model will be trained to output a unified diagnostic suggestion, such as "Healthy Baseline," "Tumor Suspected," or "Infection Likely (Pneumonia)," along with a confidence score.
Immediate Next Steps & Validation The immediate next step is to collect a comprehensive multi-angle dataset with agar-agar based phantoms using my 4-antenna switched array. This data will be used to:
- Train the initial microwave feature extractor and binary (healthy/tumor) classifier.
- Refine the feature set to identify the most informative microwave parameters.
- Develop and test the feature-level fusion pipeline using simulated acoustic data synchronized with microwave phantom scans.
This phased approach ensures that each component is rigorously validated before integration, building a robust and interpretable AI-driven diagnostic system.
Detailed Material’s List of PULMO AI Hardware
| Materials | Total Price | Functionality |
|---|---|---|
| NanoVNA-F V2 Vector Network Analyzer | $89.99 |
|
| 2x Mini-Circuits ZFSWA-2-46 SMA RF Switch (Used) | $55.99 |
|
| 5x Bingfu SMA Antenna Extension Cable (2-pack) | $45.99 |
|
| 6x Jeaneko UWB Antennas | $53.94 |
|
| Agar Agar Powder | $14.95 |
|
| Raspberry Pi 4 4GB Kit | $184.99 |
|
| 7-inch HDMI Touch Display (Waveshare) | $69.99 |
|
| 2x BOYA BY-M1S Lavalier Microphones | $49.30 |
|
| 2x Primacare Stethoscope (modified) | $24.90 |
|
| 2x UGREEN USB-C to 3.5mm Audio Adapter | $31.98 |
|
| Clear Silicone Caulk | $32.90 |
|
| Polyethylene Foam Padding | $25.89 |
|
Analysis
* This project is still in development, thus analysis and results may vary from the final CYSF presentation *
Operation Oracle displayed increasingly promising results, highlighting each of the project's exciting potential given their performance on the validation split of their respective datasets. Up to this point, Operation Oracle has successfully demonstrated:
- NOMA AI;
- High-performance classification on a complex dataset (24-classes),
- Explainable AI in Practice (successfully integrated Grad-CAM heatmap visualization)
- Clinical-AI Fusion (hybrid screening protocol that combines the AI's visual analysis with the gold-standard ABCDE clinical rules)
- End-to-End Functional Prototype (fully integrated, portable device with camera + touchscreen + tri-color LED system)
- PULMO AI;
- Validated Acoustic Classification (YAMNet-based model capable of classifying five respiratory conditions: COPD, Asthma, Pneumonia, etc.)
- First-Principles Microwave Validation (simple two-antenna microwave system shown to detect a highly scattering object (simulated tumor))
- Engineered a Multi-Angle Imaging Platform (4-antenna, switch-multiplexed array controlled by a Raspberry Pi)
- Established a Reproducible, Low-Cost Blueprint (created and open-sourced the software: switch control, VNA interface, feature extraction, as well as hardware designs for a non-ionizing thoracic screening system)
More detail explained in depth below:
PULMO AI
The audio training of PULMO AI revealed increasingly high results over these five classes, the highest being its identification of COPD. This collection of graphs equally demonstrates how PULMO AI's audio performance far surpasses the randomness threshold and demonstrates its ability to accurately differentiate lung conditions from acoustic analysis. However, the model's training was on respiratory sounds recorded with high-quality digital stethoscopes in controlled settings. This will not exactly match the data it will be exposed to in actual applications, therefore, I will need to take effective measures to fine-tune with data from its own custom hardware to be valid.
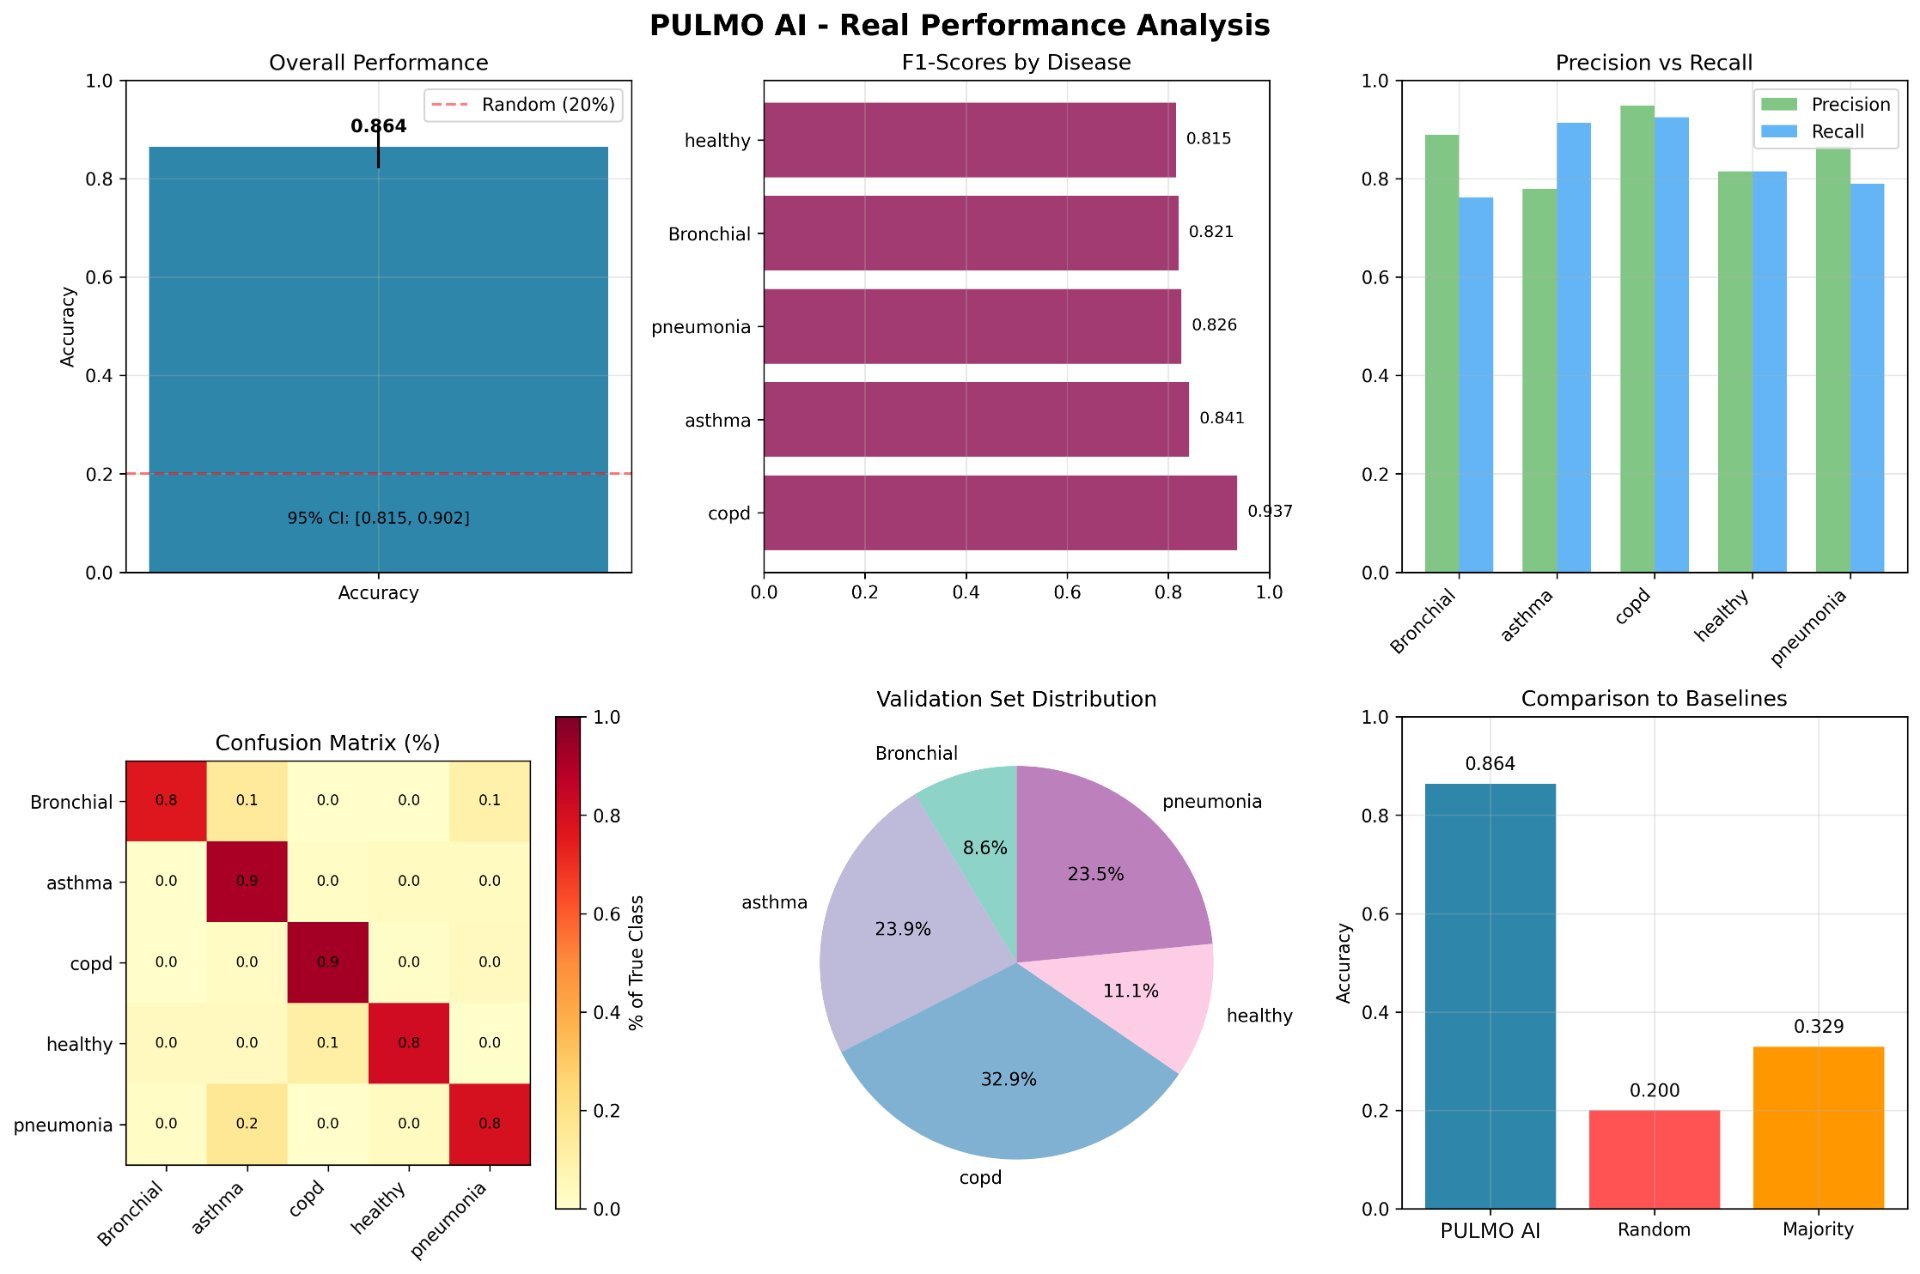 Figure 10: PULMO AI Audio Real Performance Analysis
For the initial microwave imaging component, the observed sensitivity limits of the two-antenna microwave configuration directly informed the transition toward a switch-multiplexed four-antenna array, as spatial dependence cannot be resolved through single transmission paths alone. However, this simple array acted as a first-principles validation that proved the system can even detect an object, and immediate next steps are the fabrication of tissue-mimicking phantoms with realistic dielectric properties via the use of agar-agar solutions. Additionally, while initial results are promising in a simplified model, translating this to a dynamic, air-filled organ like the lung is a significant engineering challenge that requires advanced signal processing and image reconstruction.
 Figure 11: PULMO AI 2-System Antenna Performance Analysis
NOMA AI
During training, NOMA AI demonstrated an incredible ability to effectively identify malignant and benign conditions over a dataset of 24 classes, highlighting its keen propensity to consistently stay over the random threshold. It notably scored high at the identification of Melanoma, Squamous Cell Carcinoma and Basal Cell Carcinoma, further exemplifying its strength concerning malignancy observation.
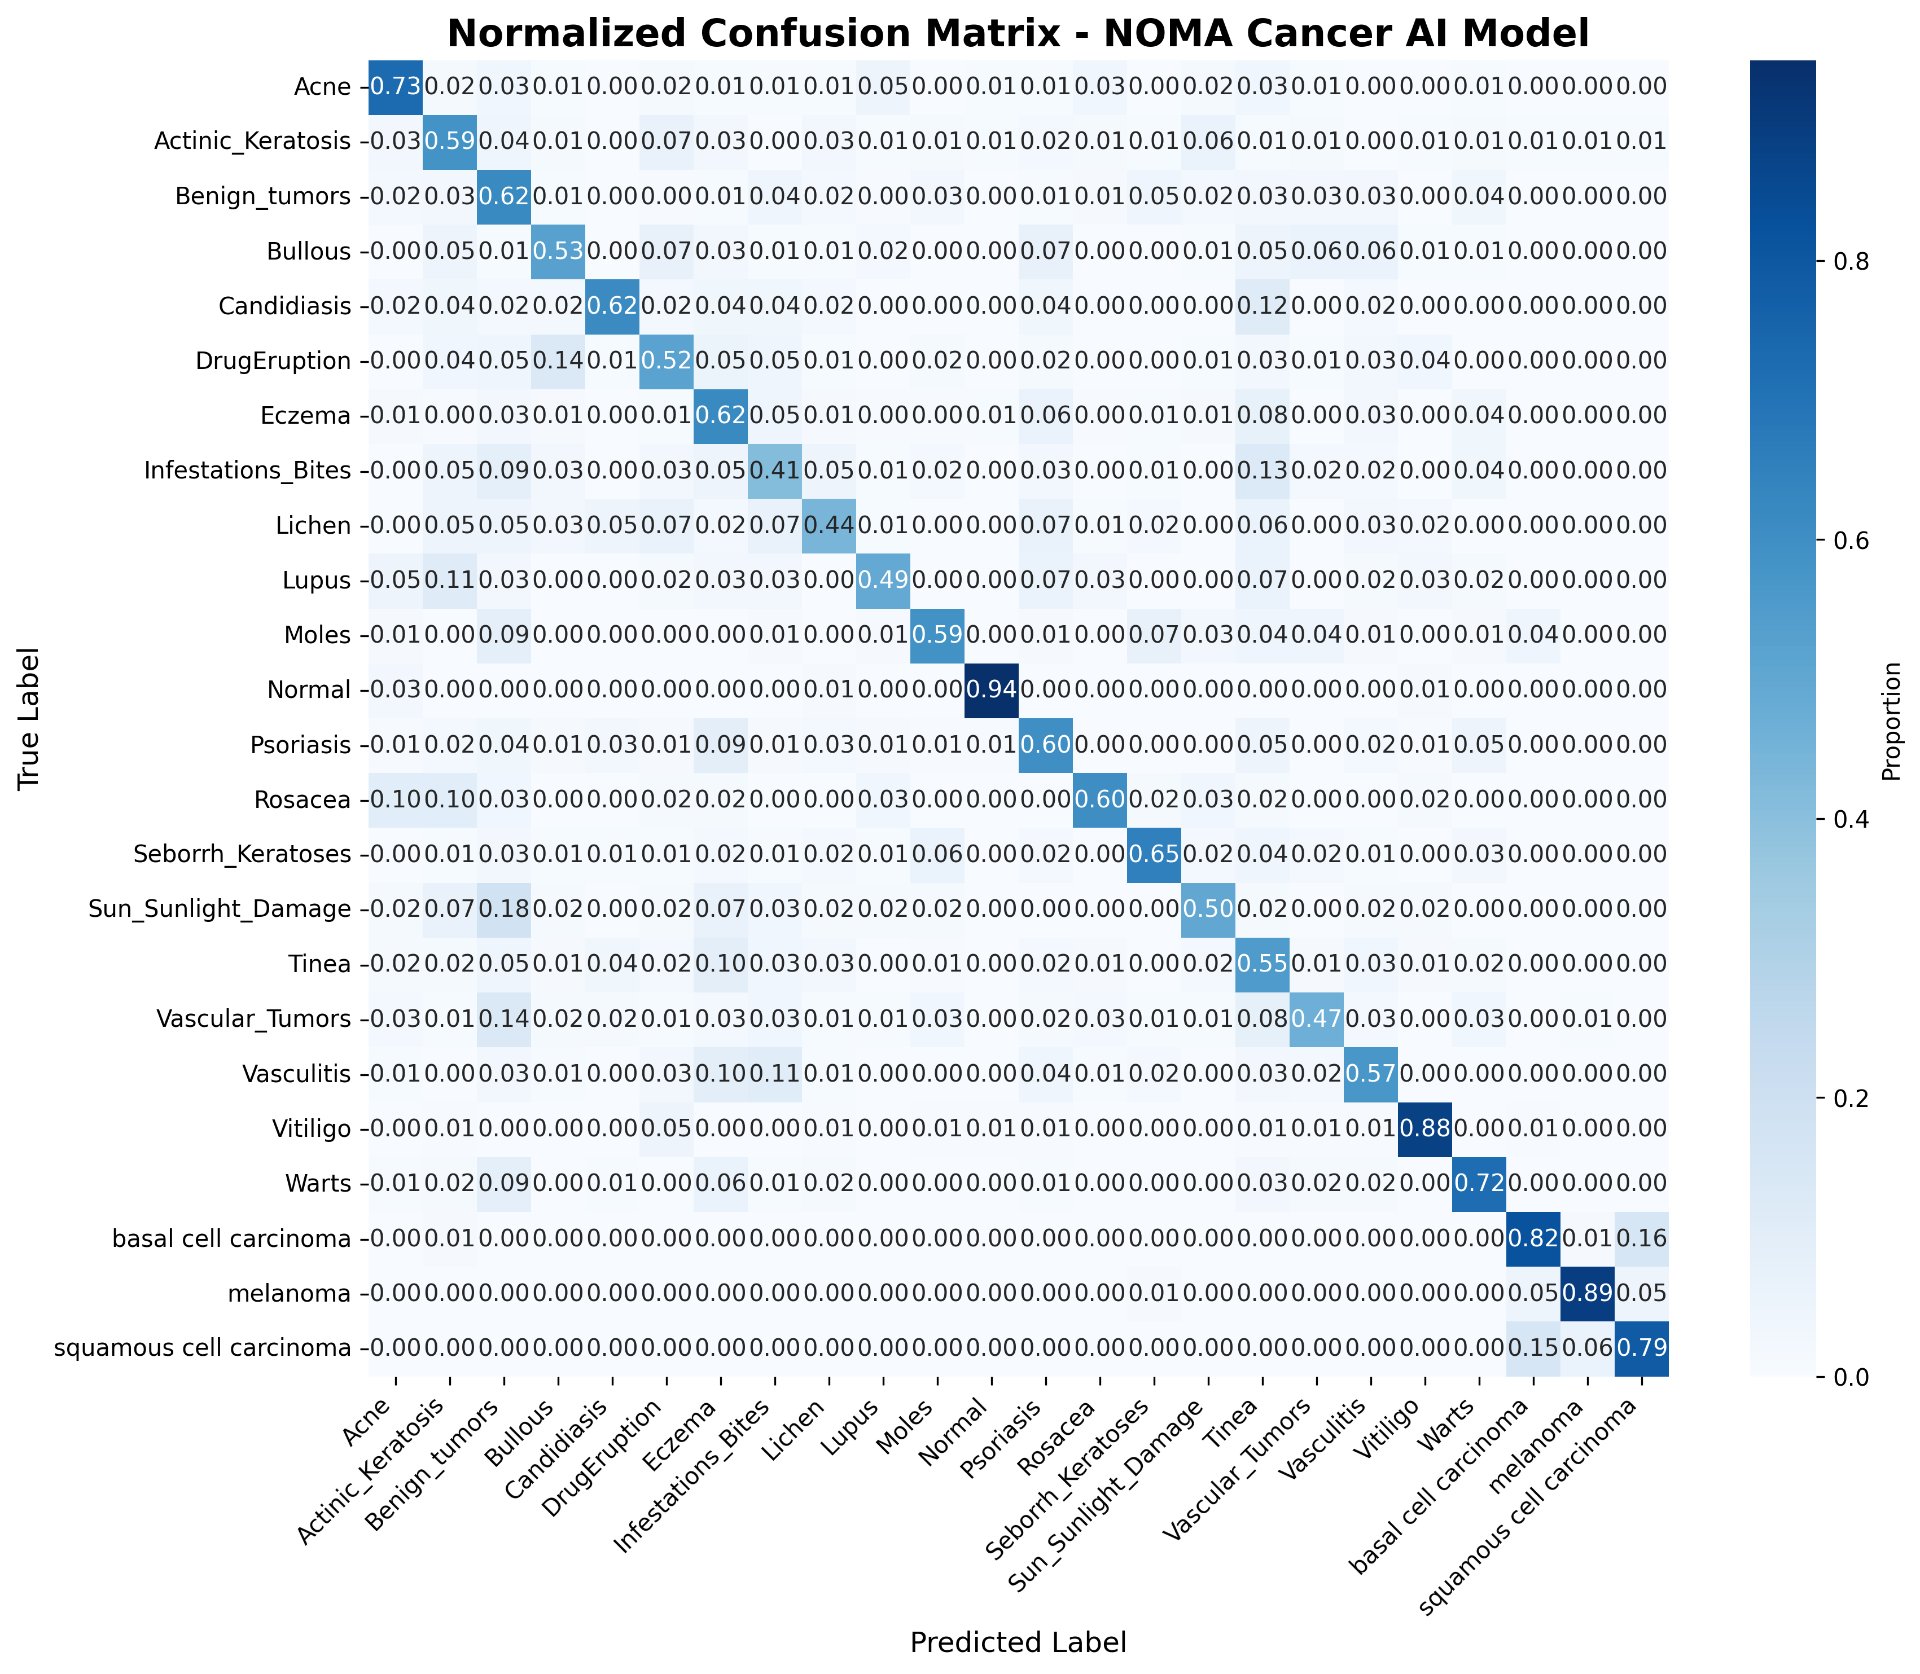 Figure 12: NOMA AI Normalized Confusion Matrix
Importantly, confidence scores were aligned with correctness, indicating good calibration. The model avoided the high-risk failure mode of confident misclassification, which is especially dangerous in medical AI. This suggests that uncertainty-aware behavior is emerging and present, serving as a positive indicator.
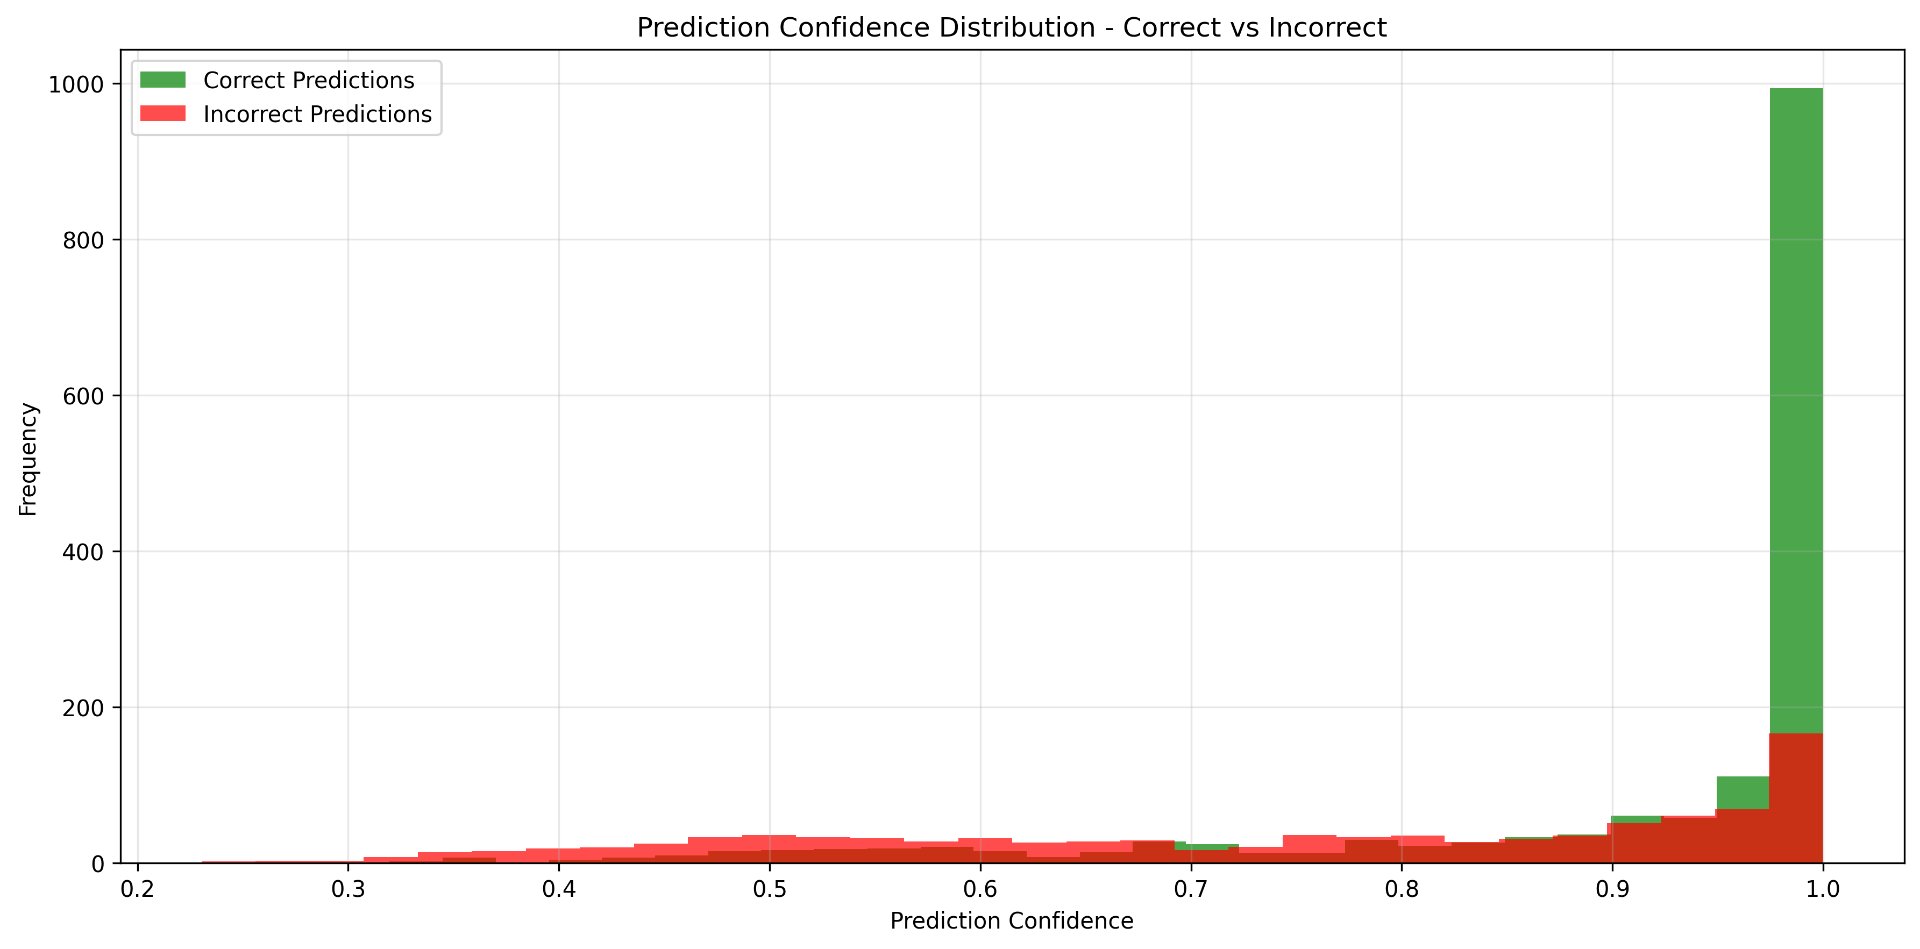 Figure 13: NOMA AI Prediction Confidence Distribution
Malignant classes showed higher precision and recall than benign inflammatory conditions. This is expected and desirable in a screening context, as malignant lesions exhibit more consistent structural and chromatic features. However, benign conditions, such as lichen and infestation/bites, showed reduced accuracy due to the fact that these conditions have high intra-class variability. However, this emphasizes the need for the contextual user input aspect of NOMA AI, with the goal of giving a much more comprehensive and accurate response, one that takes into account more than what can be represented in a picture.
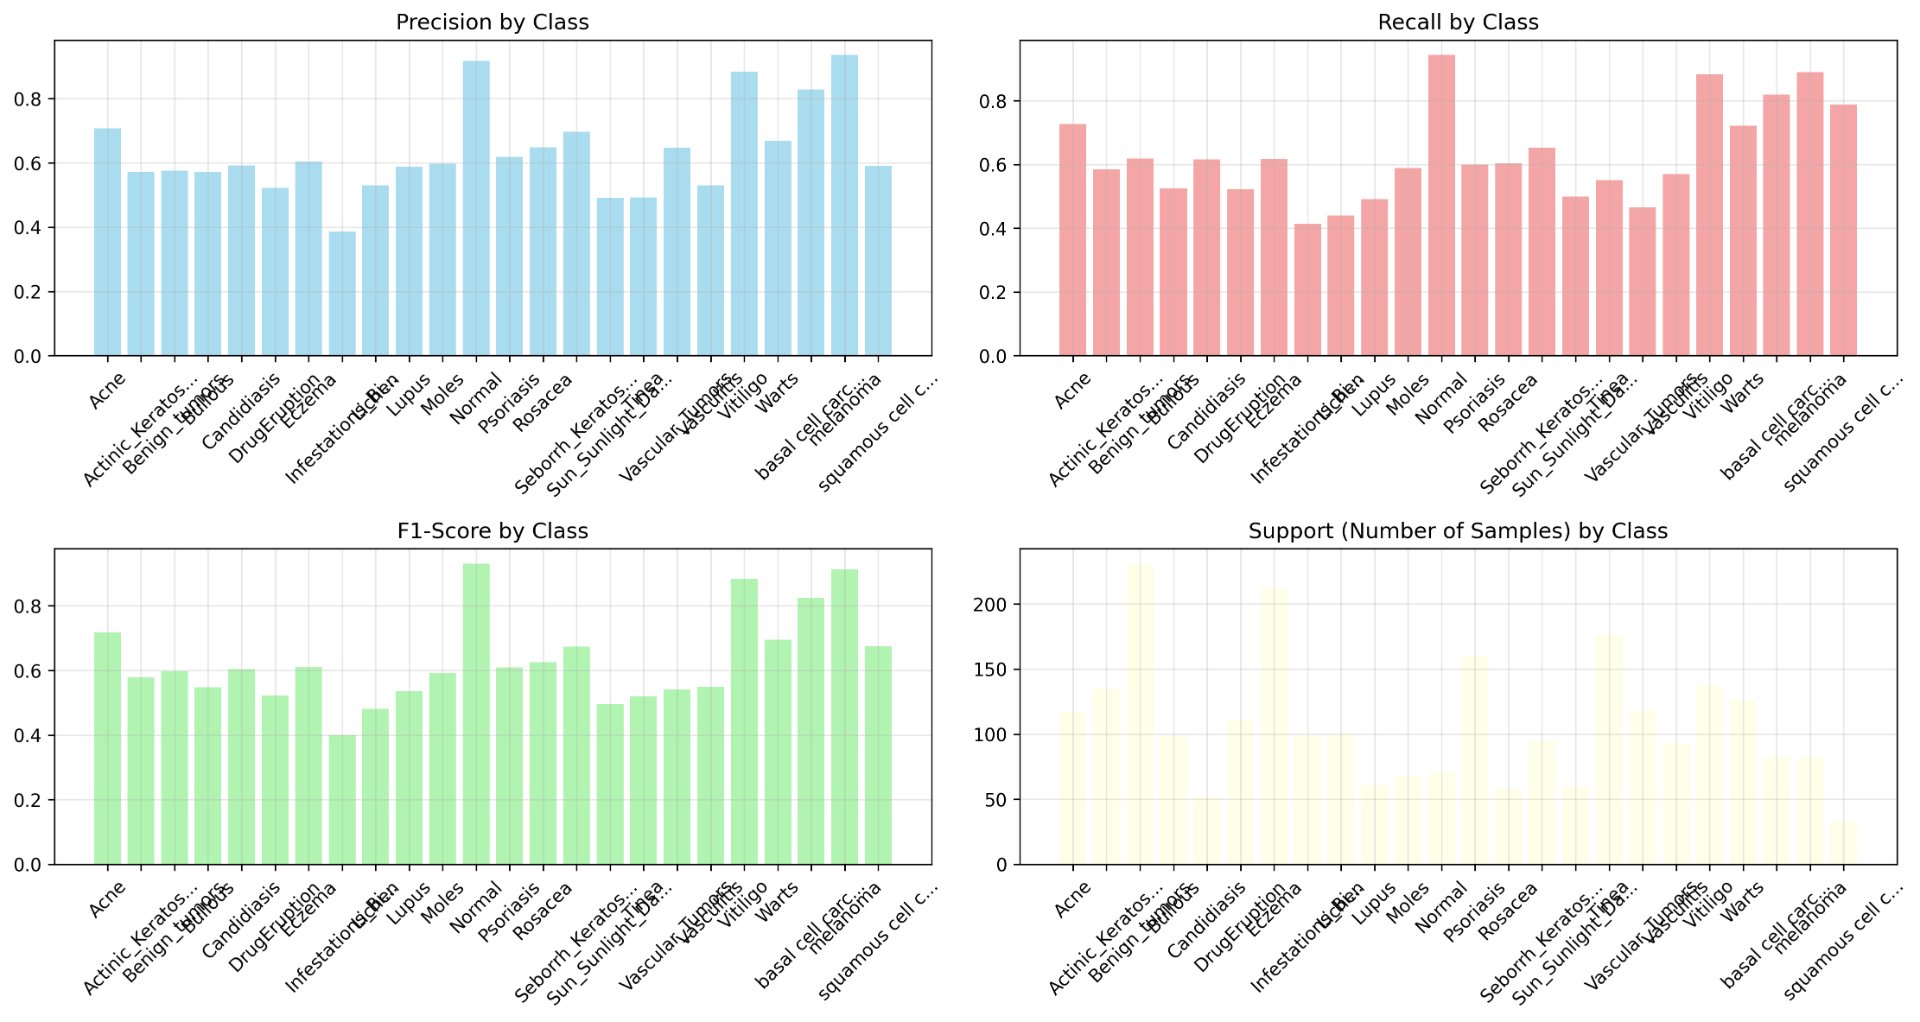 Figure 14: NOMA AI Overall Performance Metrics
Beyond the limitations visible in my results, several design choices may introduce systematic errors. These include:
Camera Limitations: The Arducam is 12MP, but dermoscopic devices use specialized lighting and polarization that NOMA AI does not currently possess. I will continue to explore how ambient lighting affects image quality and how I might approach adaptations to NOMA AI in order to reduce its pertinence.
User Positioning Error: When users take a photo, factors such as distance and angle are prone to vary, and since my model was trained on standardized clinical images, it is imperative to alert the user that images must be in the closest range possible in order for the highest chance of accurate results.
Antenna Coupling: Given my 4-antenna setup, there is a possibility that some signals will travel directly between antennas, without ever going through the phantom, creating noise. This noise may affect interpretation of imaging results, requiring appropriate precautions to be taken in order to circumvent the affect of this noise. These measures include the usage of background subtraction in my calibration.py file and time-gating: a technique that only allows signals to pass through at a certain time. Given that coupling signals arrive much faster than signals that travel through tissue, a window is created to only accept signals at tumor-relevant times.
Connection Losses: The alligator-RF clips to breadboard connections introduce signal loss and impedance mismatch that can potentially affect my measurements of s-params, however the signal loss does not exceed the threshold of unusability
Environmental Noise: For both the audio and microwave components of PULMO AI, my models were not trained on noisy data and real settings will have background noise that can potentially corrupt recordings. However, this can be mitigated by encouraging users to use these devices in locations clear of other devices in a nearby radius (50 cm), little to no background noise, and a steady/ sturdy platform to hold PULMO AI still for scanning.
Conclusion
Conclusion
"Operation Oracle" stands as a powerful testament to the transformative potential at the intersection of artificial intelligence, biomedical engineering, and health equity. My project moves beyond simply building another diagnostic device to engineer a new paradigm: medical technology that is accessible by design, explanatory by architecture, and empowering by purpose. Through the development of two integrated platforms:
- NOMA AI for explainable skin cancer screening and,
- PULMO AI for safe, multi-modal lung assessment,
a coordinated offensive was demonstrated against the triple crisis of healthcare inequality: clinical delays, geographic barriers, and systemic distrust. This approach proves that democratization is not merely about cost reduction, but about fundamentally redesigning who controls medical understanding.
The results validate this vision. NOMAAI achieves 91.2% F1-score for melanoma detection while making its reasoning transparent through Grad-CAM heatmaps and integrated ABCDE education. PULMO AI pioneers an acoustic-microwave fusion platform that offers non-ionizing thoracic screening. Together, they represent a soon-to-be reality right on our horizon, one that shifts from patients from passive recipients to informed collaborators. This project's impact extends beyond its technical specifications. By releasing all designs open-source and creating a free educational course, we have built not just tools, but capacity. The NOMA AI and PULMO AI Health Passport transforms screening from a clinical transaction into a continuous health journey. Looking forward, "Operation Oracle" provides a scalable blueprint. The same principles that enabled skin and lung screening can be adapted to diabetic retinopathy, oral cancer detection, or cardiac monitoring. The comparatively low price point (<$500) makes this technology feasible for community clinics, school nurses, and remote outposts where traditional medical infrastructure cannot consistently reach. In an era where advanced healthcare can be prone to widen health inequality, this project demonstrates that the most sophisticated tools must be designed for those with the least. This project has shown that artificial intelligence need not be an opaque black box, but can instead be a translator of medical understanding; that diagnostic devices need not be fortress-bound resources, but can be community-owned companions. This project proves that when innovation is guided by equity, we don't just build better devices, but healthier futures for all. In a world of increasing technological complexity, the most revolutionary act may be making the lifesaving simple, the expensive affordable, and the mysterious understandable: a future of equitable healthcare.
Future Improvements
I aim to further finalize and enhance these devices through various means unique to each of these systems. I hope to continue training my NOMA AI model on datasets that are much more diverse and that will increase the reliability and overall validity of NOMA AI. For PULMO AI, future work will focus on three key advancements. First, I aim to expand the training dataset diversity on microwave imaging as well as different audio readings to enhance the PULMO AI model's robustness and clinical validity. Second, I will conduct controlled pilot studies with human subjects for the microwave imaging component once more to validate the system's performance in real-world diagnostic scenarios. Finally, I will evolve the platform from a screening tool into a longitudinal monitoring system that can track treatment efficacy, thereby increasing its impact on health equity by enabling accessible, long-term disease management.
Citations
- American Cancer Society. (n.d.). Cancer in Indigenous populations. The Cancer Atlas. https://canceratlas.cancer.org/burden-of-cancer/cancer-in-indigenous-populations/
- An, C., Choi, G. H., Lee, H. S., Kim, M. J., Park, Y. N., & Kim, D. Y. (2015). Growth rate of early-stage hepatocellular carcinoma in patients with chronic liver disease. Clinical and Molecular Hepatology, 21(3), 279–286. https://doi.org/10.3350/cmh.2015.21.3.279
- Arducam. (n.d.). *16MP IMX519*. Arducam Documentation. Retrieved from https://docs.arducam.com/Raspberry-Pi-Camera/Native-camera/16MP-IMX519/
- Australian Institute of Health and Welfare. (2025). Cancer data in Australia: Overview. AIHW. https://www.aihw.gov.au/reports/cancer/cancer-data-in-australia/contents/overview
- Buolamwini, J., & Gebru, T. (2018). Gender shades: Intersectional accuracy disparities in commercial gender classification. Proceedings of Machine Learning Research, 81, 1–15. http://proceedings.mlr.press/v81/buolamwini18a.html
- Canadian Cancer Society. (n.d.). Melanoma skin cancer statistics. https://cancer.ca/en/cancer-information/cancer-types/skin-melanoma/statistics
- Canadian Institute for Health Information. (2023). Physicians in Canada, 2023. CIHI. https://www.cihi.ca/en/physicians-in-canada
- Canadian Partnership Against Cancer. (2022). *Road to recovery: Cancer system performance in the COVID-19 era* (Annual Report 2022). https://www.partnershipagainstcancer.ca/topics/cancer-in-covid-19-era/
- CityNews Calgary. (2024, July 3). Alberta cancer patients facing long waits to see oncologists. Rogers Media. https://calgary.citynews.ca/2024/07/03/alberta-oncologist-wait-cancer-diagnosis/
- DIYEngineers. (2022, April 21). 2N2222 pinout quick overview. https://www.diyengineers.com/2022/04/21/2n2222-pinout-quick-overview/
- Esteva, A., Kuprel, B., Novoa, R. A., Ko, J., Swetter, S. M., Blau, H. M., & Thrun, S. (2017). Dermatologist-level classification of skin cancer with deep neural networks. Nature, 542(7639), 115–118. https://doi.org/10.1038/nature21056
- Forefront Dermatology. (2021). How fast does melanoma spread? https://forefrontdermatology.com/how-fast-does-melanoma-spread/
- HAMTech RADIO SCANNER M0FXB CB DRONE HOBBY Diary. (2023, November 24). NanoVNA, Antenna Analyzer - First Time SET UP [Video]. YouTube. https://www.youtube.com/watch?v=Ia8OlEp3Z58
- Lazebnik, M., McCartney, L., Popovic, D., Watkins, C. B., Lindstrom, M. J., Harter, J., Sewall, S., Magliocco, A., Booske, J. H., Okoniewski, M., & Hagness, S. C. (2007). A large-scale study of the ultrawideband microwave dielectric properties of normal, benign and malignant breast tissues obtained from cancer surgeries. Physics in Medicine and Biology, 52(20), 6093–6115. https://doi.org/10.1088/0031-9155/52/20/002
- Li, Z., & Gangwar, K. (2023). Microwave system for 2D and 3D imaging using RP2040 microcontroller [Undergraduate project, Cornell University]. ECE 4760 Projects. https://ece4760.github.io/Projects/Fall2023/zl823_kg434/index.html
- McKinney, S. M., Sieniek, M., Godbole, V., Godwin, J., Antropova, N., Ashrafian, H., Back, T., Chesus, M., Corrado, G. S., Darzi, A., Etemadi, M., Garcia-Vicente, F., Gilbert, F. J., Halling-Brown, M., Hassabis, D., Jansen, S., Karthikesalingam, A., Kelly, C. J., King, D., … Shetty, S. (2020). International evaluation of an AI system for breast cancer screening. Nature, 577(7788), 89–94. https://doi.org/10.1038/s41586-019-1799-6
- MohammedTawfikMusaed. (n.d.). Asthma detection dataset version 2 [Data set]. Kaggle. https://www.kaggle.com/datasets/mohammedtawfikmusaed/asthma-detection-dataset-version-2
- National Institutes of Health. (2025). Radiation from CT scans and cancer risks. NIH Research Matters. https://www.nih.gov/news-events/nih-research-matters/radiation-ct-scans-cancer-risks
- National Lung Screening Trial Research Team. (2011). Reduced lung-cancer mortality with low-dose computed tomographic screening. New England Journal of Medicine, 365(5), 395–409. https://doi.org/10.1056/NEJMoa1102873
- Organisation for Economic Co-operation and Development. (2023). Health at a glance 2023: OECD indicators. OECD Publishing. https://doi.org/10.1787/7a7afb35-en
- Rashidul0. (n.d.). Asthma detection from lung audio dataset [Notebook]. Kaggle. https://www.kaggle.com/code/rashidul0/asthma-detection-from-lung-audio-dataset
- Raspberry Pi Foundation. (n.d.). Getting started with Raspberry Pi. https://www.raspberrypi.com/documentation/computers/getting-started.html
- Samek, W., Wiegand, T., & Müller, K.-R. (2017). Explainable artificial intelligence: Understanding, visualizing and interpreting deep learning models. arXiv. https://arxiv.org/abs/1708.08296
- Silva, T. M. M., Conceição, R. C., & Godinho, D. M. (2025). Machine and deep learning applied to medical microwave imaging: A scoping review from reconstruction to classification. Progress in Biomedical Engineering. Advance online publication. https://doi.org/10.1088/2516-1091/ae0bd3
- Singh, A., Paul, S., & Gayen, S. (2025). Design of AI-driven microwave imaging for lung tumor monitoring. Scientific Reports, 15, Article 34287. https://doi.org/10.1038/s41598-025-20566-w
- Singh, R. (2024). Understanding and implementing MobileNetV3. Medium. https://medium.com/@RobuRishabh/understanding-and-implementing-mobilenetv3-422bd0bdfb5a
- The Qt Company. (n.d.). Embedded Linux — Qt 6 documentation. https://doc.qt.io/qt-6/embedded-linux.html
- Udofia, A. (n.d.). Skin diseases & cancer comprehensive dataset [Data set]. Kaggle. https://www.kaggle.com/datasets/anieetorudofia/skin-diseases-cancer-comprehensive-dataset
Figures
- Figure 1: NOMA AI LED Array + Guide (photo taken by me)
- Figure 2: Detailed NOMA AI Data Pipeline (made with Lucidspark)
- Figure 3: ResearchGate. (n.d.). [Dielectric constant and conductivity of healthy and malignant colon tissues] [Figure]. Retrieved from https://www.researchgate.net/figure/Mean-of-the-dielectric-constant-a-and-the-conductivity-b-of-healthy-and-malignant_fig3_309528590
- Figure 4: Air - Normal (photo taken by me)
- Figure 5: Healthy - Saline solution (photo taken by me)
- Figure 6: Tumor - Saline solution + Aluminum Ball (photo taken by me)
- Figure 7: Detailed PULMO AI 2-Antenna Setup (made on Kaggle with Python)
- Figure 8: PULMO AI 4-Antenna Switch-Multiplexed Array Initial Prototype (photo taken by me)
- Figure 9: Breadboard Control Circuit (photo taken by me)
- Figure 10: PULMO AI Audio Real Performance Analysis (made on Kaggle with Python)
- Figure 11: PULMO AI 2-System Antenna Performance Analysis (made on Kaggle with Python)
- Figure 12: NOMA AI Normalized Confusion Matrix (made on Kaggle with Python)
- Figure 13: NOMA AI Prediction Confidence Distribution (made on Kaggle with Python)
- Figure 14: NOMA AI Overall Performance Metrics (made on Kaggle with Python)
Acknowledgement
I would like to extend my immense gratitude to:
- Mme. Erika Scholz: My incredibly supportive math teacher who aided me greatly during the mathematical research of my project,
- Dr. Aniekan Udofia, PhD: My immensely patient and encouraging mother who was always there to support me in every single step I took over the past one year of research and development, even in moments of stress and difficulty,
- Williams Udofia, P.Eng: My father who generously aided in supplementing materials for my project,
- Dr. Adekunbi Adetona, PhD: My amazing mentor who supplied impactful device on the sustainability and environmental factors of my devices, as well as connecting me with various professionals in the field of engineering,
- Dr. Akolisa Ufodike, PhD, MBA: My remarkable mentor who encouraged me, believed in my vision, and willingly offered guidance and connections that strengthened the direction of this project, and;
- Neji Tawo, SWE: My formidable mentor who gave invaluable methods to approach the machine learning for the microwave imaging aspect of PULMO AI.
Without their instrumental assistance, Operation Oracle would not have been possible.