
Recognition of Muscle Fatigue Status Based on Clustering of Extracted EMG Features
Eunice Leung
Grade 12
Presentation
No video provided
Problem
- Muscular fatigue is defined as the decreased production of maximal force caused by exercise which is affected by differing types of muscle contractions in fatiguing exercises.
- It exacerbates constraints on daily functioning across diverse pathological scenarios, encompassing neurological, muscular, and cardiovascular disorders, along with the aging process.
- Recent evidence has revealed that fatigue induces alterations in muscle activation patterns and kinematics, potentially increasing the susceptibility to injuries affecting both muscles and bones. These findings emphasize the need to explore how fatigue-induced changes in muscle mechanics can influence injury risks and inform injury prevention strategies.
- Contemporary techniques for detecting muscle fatigue through electromyography (EMG) involve employing root mean square (RMS) for assessing muscle activity and median frequency (MDF) to characterize fluctuations in muscle activation.
- Time domain filtering using RMS is used to remove unwanted noise and provides an overall magnitude of the signal with average signal amplitudes over a given time period that represents the level of muscle activation. The slope calculated is used to examine change in EMG amplitude over time.
- In the frequency domain approach, the shift in the EMG frequency spectrum can be determined by the fast Fourier transform (FFT), and MDF.
- However, these isolated time or frequency domain methods may not consistently yield dependable fatigue recognition because EMG is non-stationary. Therefore, a time-frequency approach is more appropriate.
- Although wavelet transform has been applied to EMG signal analysis, the application is mainly focused on activity classification. For muscle fatigue identification, the time-frequency approaches predominantly conduct RMS analysis across varying frequencies or using short time Fourier transform to look at the instantaneous median frequency
Method
Here we used the EMG signal data sets collected in [1]. In their experiment, a Myo-armband with eight 200Hz EMG sensors was worn on the muscle midline of the forearm by 15 healthy young male adults. All participants were instructed to maintain a 90-degree flexion in their elbow while holding a 6-kilogram load with their right hand. Their forearms were positioned horizontally, with their palms facing upward during 120s of recording isometric contraction until fatigue was reached. 8 sensors were placed on the front and back of the forearm of the 15 participating individuals.
OUR PROPOSED METHOD: an unsupervised approach which requires no labeling of the EMG signals for fatigue/not fatigue.

The idea of the proposed method is represented by the following block diagram
We extract the time-frequency features from the EMG signals and then perform clustering to see whether the fatigue or not fatigue signals/features can form two nice clusters (well separated). If two distinct clusters are formed, muscle fatigue can be identified using this approach.
The time-frequency feature extraction is based on principal component analysis (PCA), either on spectrogram or representation of spectrogram using autoencoder. Typical EMG signal waveforms (channel 4 and channel 7, front and back) of individual #8 are shown as follows:
Given an EMG signal, we used non-overlapping windows to compute spectrograms as shown in the following diagram. The spectrogram is computed using discrete time Fourier transform.
PCA transforms each of these spectrograms into K principal components. For illustration, we chose K=3 over 120 frames as shown in the following figures. As we can see in both channels, PCAs with darker values are densely grouped on the left side and PCAs with yellow/green colors are more scattered on the right sides.
After PCA, the K-mean clustering algorithm is applied to the extracted features:
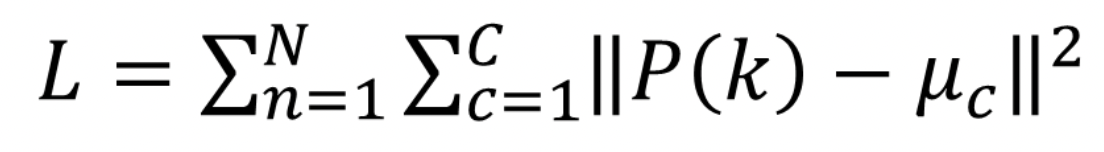
where µc is the cluster center, N is the number of samples C is the number of clusters (C= 2 here). P(k) are PCA values. If the PCA values clustered on the left mostly belong to non fatigue data and the PCA values on the scattered cluster are mostly belong to fatigue, then clustering will be an effective way to recognize muscle fatigue from the EMG signal.
Assume that the EMG signals at the beginning of the exercise are likely to be non-fatigue and those at the end of the EMG signals are more likely to be fatigue. We compute the distance of all PCA features to the "non-fatigue" cluster center (the left one) along their time indices. If the features at the beginning belong to this cluster, the distance should be small. On the other hand, for the PCA features extracted at the end of EMG signal, the distance should be larger if they are those scattered PCA features at the right.
Analysis
Checking time indices of the features, the more concentrated cluster on the left side contains mostly data collected at beginning (non-fatigue) and the more scattered data on the right are mostly at the end of the experiment (fatigue). It implies that two reasonably well separated clusters can be formed.
To understand whether this clustering approach is effective in identifying muscle fatigue, we computed the distance of all PCA features to the non-fatigue cluster center (left one) along their time indices.
If the features at the beginning belong to this cluster, the distance should be small. At the end of the experiment, the distance should be larger as they are expected to be fatigued.
We can fit a linear equation to these distance data as shown in the figures (left/right: channel 4/ channel 7). This process is like the standard RMS slope algorithm, but we apply this strategy to PCA features instead of RMS.
To evaluate the fatigue recognition performance, we compared the slope values based on RMS and the proposed method for all 15 individuals. We plot the results of channels 4 and 7 in the following figures.
Apparently, the proposed method outperforms RMS. The improvements are significant. The slope values are 2 or 3 times of those of RMS. In some cases, RMS failed (negative slopes) but the proposed method can distinguish the fatigue status successfully.
Conclusion
- An unsupervised learning approach is developed for muscle fatigue recognition. It does not require labeling the EMG signal which is hard to do for muscle fatigue.
- It uses PCA to extract time-frequency features to form clusters for fatigue and non-fatigue status. Experiment results show that these features can form reasonably well separated fatigue and non-fatigue clusters.
- Using the slope algorithm as in RMS, the proposed method significantly outperforms the RMS method for all data sets. It also successfully identifies fatigue in cases where RMS fails.
Citations
[1] A. Ebied, A. M. Awadallah, M. Abbass and Y.El-Sharkawy. “Upper limb muscle fatigue analysis using multi-channel EMG”, 2nd Novel Intelligent and Leading Emerging Science Conf., Giza, Egypt, 2020, 423-427.
Acknowledgement
I would like to express my gratitude to Professor Jalal Aboodarda, Department of Kinesiology, University of Calgary for his guidance and expertise. I would also like to thank Ms. Grelowski and Dr. Garcia for their help throughout this process.