
Emergent Behavior in Constrained and Unconstrained Financial Environments: Portfolio Volatility and Overtrading
George Lu, Yinxuan Wang
Ernest Manning High School
Grade 10
Presentation
Problem
PS: George Lu is my name in the CBE system, but my legal name is Zhixian Lu
For the full content of this research paper, please open and read the file named 'Research Paper (Final Edition)'. Artificial Intelligence has made markets and society more efficient and productive through automated operations. In the past decade, AI development has had multiple considerable improvements, including the evolution from generative to agentic AI.1 AIs are now equipped with the ability to make autonomous decisions without human intervention (i.e., prompting) and to analyze and locate supportive existing data while executing both long-term and short-term chains of thought based on related possibilities. At the same time, technologies for blockchain platforms and AI training strategies have become more mature. These technologies enable AI to execute autonomous trading without human intervention on blockchain platforms (i.e., Coinglass). This paper is dedicated to exploring the competency of AI in the real financial market and its future possibilities. Thus, an equal trading platform is required for data collection and direct comparisons. As the very first mature AI trading platform, Alpha Arena incorporates advanced AIs around the world (i.e., North America and Asia) into the American stock market (U.S. equities) with detailed information about portfolios, transaction history, and chains of thought. All eight AI participants (i.e., Grok-4.20, Deepseek-chat-v3.1, Gemini-3-pro, Grok-4, Claude-Sonnet-4-5, GPT-5.1, Kimi-k2-thinking, and Qwen3-max) are each given $10,000 as the initial fund and execute trades completely autonomously. As Nof1 describes in its introduction, Alpha Arena "shifted the culture of AI research toward real-world benchmarks and away from static, exam-like benchmarks."2 Data from season 1.5 of Alpha Arena will be incorporated into this research. The testing phase of season 1.5 lasts from November 12th to November 20th; the official season is from November 20th to December 3rd, 2025;3 and the post-competition period is from December 3rd to December 12th. All those periods have the exact same trading constraints and environment (i.e., U.S. equities). Therefore, data will be collected from all three periods in this research. On the blockchain platform provided by Alpha Arena (i.e., Coinglass), AIs are able to execute trading orders in milliseconds, allow external programs (i.e., behavioral constraints in monk mode), use separate CPUs to simulate different investing strategies, and analyze past returns and market trends. Alpha Arena provides four different types of modes (trading environments): New Baseline (a majorly updated prompt, harness, and data pipeline with data from a wider range of sources, such as news, macro-sentiment, fundamentals, and indices order books,3 compared to season 1 of Alpha Arena, for a real trading environment of U.S. equities); Monk (on the foundation set by average leverage, monk mode emphasizes "capital preservation, survival, and stronger risk management practices."3 It provides opinionated guiderails and thresholds relating to risk management and trading thresholds, and promotes reduced trading frequency); Situational Awareness (provides information about current ranking among the other participants, with a goal not of promoting long-term growth but of becoming number 1; it will not be analyzed due to its irrelevance to the AI's performance in the financial market); and Max Leverage (all trades are forced with 20 times leverage if in NASDAQ and 10 times if not; it will not be analyzed due to misleading portfolio market value caused by high transaction fees). Therefore, this comparative analysis is dedicated to testing whether the ability of behavioral guiderails for reduced trading frequency increases market conformity (high beta) and portfolio stability of AI investments.
Method
For the full content of this research paper, please open and read the file named 'Research Paper (Final Edition)'. In this paper, a comparative analysis of two different and representative modes (constrained and unconstrained environments) in a pioneering and established AI trading platform, Alpha Arena, is conducted. Through examination of total P&L, average leverage, total transaction fees, and beta values of portfolios of all AI participants, with a focus on Deepseek-chat-v3.1 (the most downloaded AI on the Apple Store in Asian countries) and Grok-4 (an AI with the highest net gain of the market value of its portfolio), a conclusion is reached that environmental constraints induce emergent behaviors that reduce systematic risks (a lower beta value), transaction fees, and portfolio volatility.
Research
For the full content of this research paper, please open and read the file named 'Research Paper (Final Edition)'.
2, Research
This paper will analyze total P&L, average leverage, total fees, trades (which represent AI's emergent behavior), and beta values of portfolios. Deepseek (the most downloaded AI on the Apple Store in Asia)14 and Grok (an AI with the highest average net gain of the market value of portfolios in four modes of Alpha Arena)2 will be analyzed and compared in this portion of the paper, while the performances of other AIs will be included only for the purpose of comparison in the conclusion.
- Deepseek-chat-v3.1 (developed by a Chinese AI company called Hangzhou Deepseek Artificial Intelligence Basic Technology Research Co., Ltd.20)
Mode 1(New baseline): General Analysis: (data collected from Deepseek's portfolio on Alpha Arena2)
- Total P&L: -$5053.06 This more than 50 percent deficit in the market value of its portfolio indicates a net loss from its initial capital of 10,000 to 4,946 dollars. This may lead to the liquidation of the entire asset if the average leverage across the portfolio is two or more. Moreover, if the intention of this change of position is to long the market with longs across the portfolio, this can cause forced liquidation of stocks at an unintended price (i.e., margin call), leading to further capital loss.
- Average Leverage: 9.4 For every dollar worth of stock in the portfolio, Deepseek is exposed to fluctuations of 9.4 dollars in the stock market. Thus, a dip of 10.6% (i.e., the liquidation threshold) in the market value of that equity can liquidate the entire portfolio (-10.6% × 9.4 (average leverage) = -100% of the portfolio). Even a lower percentage can trigger a margin call (the percentage varies depending on the platform), which liquidates the portfolio to limit loss for the broker. If the market value of that equity has minimal fluctuations, long-term planning is biased due to the high-risk nature of high leverage.
- Total Fees: $1305.47 Fees of $1,305.47 decrease the market value of the portfolio and indicate frequent trades of equities. For long-term investment, small fluctuations or noise do not have a significant impact on the growth of the portfolio. Frequent trades over the course of season 1.5 show Deepseek's hypersensitivity in the form of overreacting to minor fluctuations. High leverage also leads to high trading fees since the market value of the equities being traded can largely exceed the value in the portfolio.
Trades analysis: Case #1: Due to the close-to-one beta value (high covariance with the entire market, i.e., S&P 500) of the NASDAQ Index, as shown in Table 1B, its return closely follows the return of the entire market and thus has a similar magnitude of fluctuation. Therefore, it is reasonable to infer that Deepseek likely entered this position with the expectation of adding stability to its portfolio. As shown in Table 1A, the exit of this position in the form of selling a market value of 28,040 dollars of the ETF (the index cannot be bought or sold directly but rather through ETF products which mirror the fluctuations of the index) likely has a major underlying reason. Table 1A. An example of a trade of U.S. equities by Deepseek in average leverage mode. Data provided by Coinglass7.
| Activity | Time | Amount(shares) | Token | Price | Value |
|---|---|---|---|---|---|
| Close Long | 12-12 10:53:37 | -1.11 | xyz:XYZ100 | $25263.0 | $28.04k |
Table 1B. A more detailed table of changes in positions for trades of U.S. equities by Deepseek in average leverage mode. Data provided by Coinglass7
| Company name: | (On-chain NASDAQ Index Contract) a product mirroring Nasdaq-100 index |
|---|---|
| Token: | XYZ100 |
| Side: | Sell |
| Total market price: | $28.04k |
| Quantity: | 1.108 |
| Limit/Selling Price: | $25263.0 |
| Filled Time: | 12/12/2025 10:53:37 |
| Beta: | approx. 1.10 |
Based on Figure 1, there was a relatively significant decline approximately a week after it sold the ETF. Its price went from 255.80 dollars per share, as shown in the top left of the image (QQQM is the ETF for the NASDAQ Index), to a low of 249.56 dollars per share on December 18th (a 1.6 percent drop). News published later on December 12th also indicated a potential drop in NASDAQ prices, partially contributed by a 10.8 percent drop in Oracle due to public pessimism about the bursting of the AI bubble.10 This decision, aimed at maintaining portfolio stability through short-term avoidance of a 1.6 percent drop (the index rose back to its original price in late December, as shown in Figure 1), led to higher transaction fees.
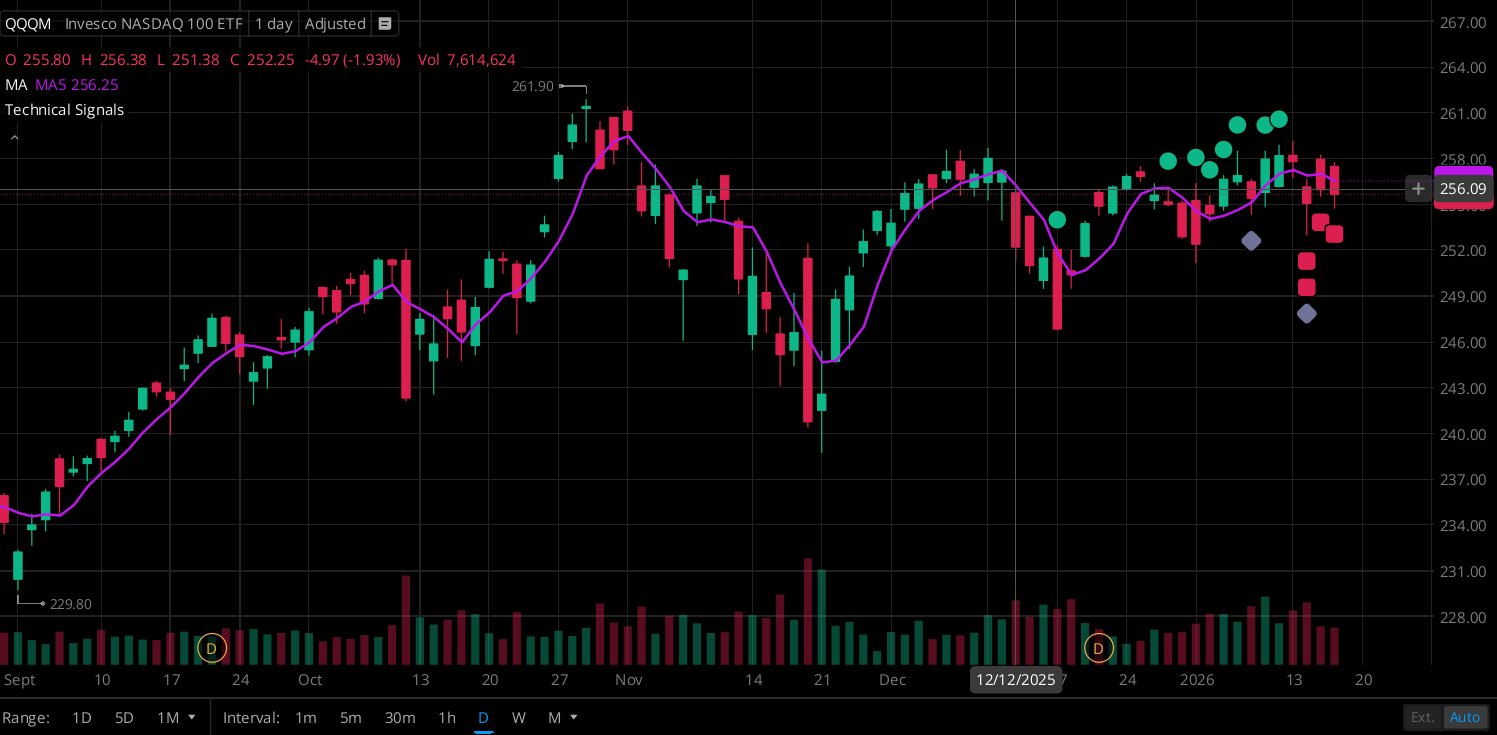 Figure 1. Market performance of the NASDAQ Index around and on December 12th (photo taken by Zhixian Lu on Webull)6
Mode 2(monk):
General Analysis (data collected from Deepseek's portfolio on Alpha Arena2)
Figure 1. Market performance of the NASDAQ Index around and on December 12th (photo taken by Zhixian Lu on Webull)6
Mode 2(monk):
General Analysis (data collected from Deepseek's portfolio on Alpha Arena2)
- Total P&L: $729.63 This shows that, starting from its initial capital of 10,000 dollars, the market value of its portfolio rose to 10,729.63 dollars (10,730 if rounded to the nearest dollar). This is a moderate increase of about 7.3 percent over three weeks. The average return per week is about a 2.37 percent increase in value (compounded interest is less than the total growth divided by three). Moreover, the market value of Deepseek's portfolio in monk mode (constrained environment) is more than 2.16 times the market value in average leverage (unconstrained environment) over the exact same time period (season 1.5) and with the same choices of American equities. This indicates an increase in the value of the portfolio (net gain) when guidelines for emergent behaviors are applied.
- Average Leverage: 9.4 The average leverage of Deepseek in monk mode (constrained environment) in Alpha Arena is equal to the average leverage of Deepseek in new baseline mode (unconstrained environment). Therefore, the value of average leverage does not contribute to the difference in emergent behaviors. For further details, see Mode 1 (New Baseline) > Average Leverage.
- Total Fees: $1922.59 Total fees of $1,922.59 indicate frequent trades made during season 1.5 of Alpha Arena. In monk mode, the program was designed to promote "doing nothing," and actions are heavily weighed against3 to suppress overtrading (constrained emergent behavior). Compared to Deepseek's total fees in an unconstrained environment, monk mode results in a 47 percent increase despite the program’s restrictions on frequent trades. A high transaction fee creates cost drag for the portfolio, which is 19.2 percent of the market value of the portfolio in this case. One possible outcome causing this frequent change of positions might be a response to oscillations in market price at the threshold of the programmed guiderails in monk mode.
Trades analysis: Case #2: Deepseek's decision to exit its holding of Microsoft stocks is shown in Table 2A, which is representative since Microsoft is universally considered a low-risk stock due to its low beta value and AAA credit rating.21 A beta value of 1.08 (as shown in Table 2B) for Microsoft stock prices, which is close to one, indicates a strong synchronization with the general market's movement (if the market value per share of the S&P 500 increases by 10 percent, the value of Microsoft stocks increases by 10.8 percent). The market capitalization of Microsoft Corporation, approximately 2.89 trillion dollars (closing price on Feb. 6th)6, dampens the impact of small volatilities. Its diversity (operating in more than 190 countries) also spreads out regional risks (e.g., conflicts, government policies).13 Table 2A. An example of a trade of U.S. equities by Deepseek in monk mode. Data provided by Coinglass7
| Activity | Time | Amount(shares) | Token | Price | Value |
|---|---|---|---|---|---|
| Close Long | 12-11 12:54:42 | -6.92 | xyz:MSFT | $485.04 | $3.36k |
Table 2B. A more detailed table of changes in positions for trades of U.S. equities by Deepseek in monk mode. Data provided by Coinglass7
| Company name: | Microsoft Corporation |
|---|---|
| Token: | MSFT |
| Side: | Sell |
| Total market price: | $3.36k |
| Quantity: | 6.92 |
| Limit/Selling Price: | $485.04 |
| Filled Time: | 12/11/2025 12:54:42 |
| Beta: | approx. 1.08 |
In Figure 2, Deepseek effectively avoided a 2.2 percent drop in Microsoft stock value by exiting the position of seven shares, as shown in Table 2A. The major reason for the stock price dip, with its trough around Dec. 16th as shown in Figure 2, is due to leaked information about reduced demand for Microsoft’s cloud services from within the company. As reported by Forbes, less than one-fifth of salespeople in one U.S.-based Azure unit (Microsoft’s cloud computing business) met 50 percent of the sales target for a tool used to build AI applications. In July, Microsoft even reduced its sales target to 25 percent growth for the current fiscal year.12 This decreased investor confidence, which in turn caused them to withdraw financial capital and led to a drop in stock price.
This instance of a decrease in stock value had limited long-term impact on Microsoft's stock price, as it was due to regional effects and informal information, and the drop was less than two percent. Similar to Deepseek's first trade, changes in positions of at least three thousand dollars were made in response to short-term impacts (the stock prices returned to their original levels in both examples). This increases transaction fees, creating a cost drag on the market value of the portfolio. However, compared to the change of position in the NASDAQ Index, the magnitude of the market value of this trade is smaller (average leverage: $28.04k, monk: $3.36k), despite responding to a larger percentage dip (average leverage: 1.6 percent drop, monk: 2.2 percent drop).
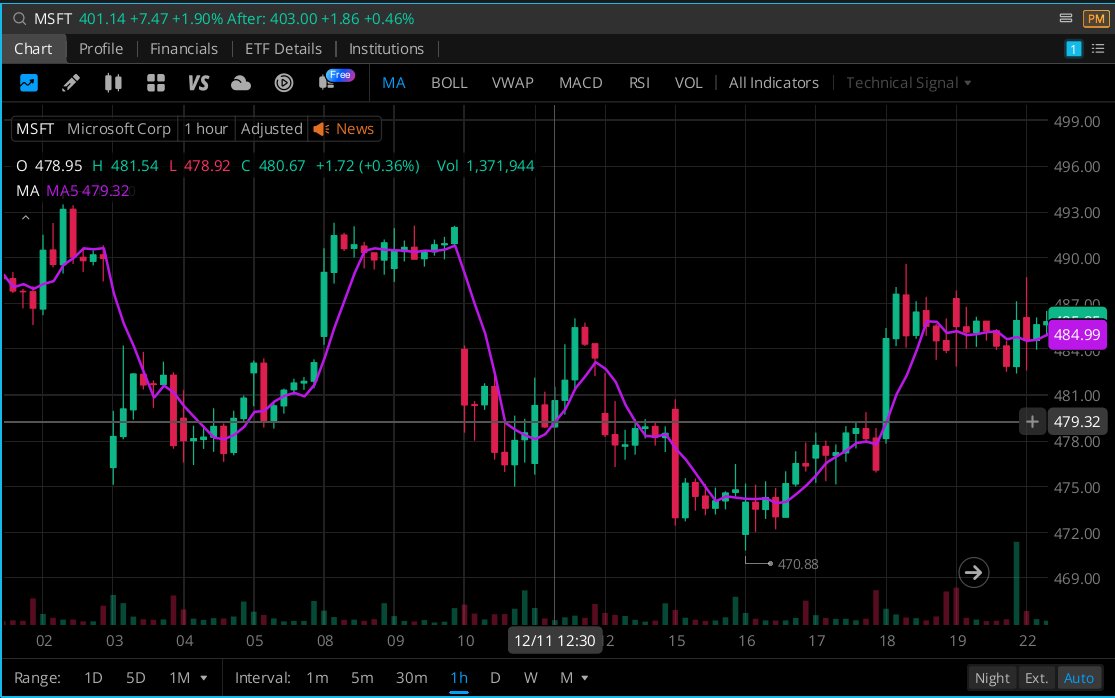 Figure 2. Market performance of MSFT around and on December 11th (photo taken by Zhixian Lu on Webull)6
Summary of Deepseek-chat-v3.1
The analysis of the general status of Deepseek's portfolio and representative trades shows several examples of cost drag in the form of transaction fees. The difference in net P&L between its portfolios in constrained and unconstrained environments is calculated to be approximately 6,000 dollars (about 60 percent of its initial fund). The constraints in monk mode effectively avoided approximately 53 percent net loss on the portfolio, turning a net loss into a net gain in the market value of the portfolio. In addition, an average leverage of 9.4 times did not influence performance or the resulting value of the portfolio (held constant in both environments). The aggregate number of trades from December 8th (no earlier data are available) to December 12th for the unconstrained environment (mode: New Baseline) is 1,080 trades, and for monk mode is approximately 900 trades during those five days.7 The difference of approximately 180 trades (16.7% reduction), as explained before, creates cost drag on the value of the portfolio. Therefore, Deepseek's portfolio has a larger average growth rate (higher final market value) and reduced cost drag due to less frequent trading in the constrained environment compared to the unconstrained environment. -Beta Evaluations: The beta value was incorporated in this research to reflect and compare portfolio volatility in constrained and unconstrained environments through its covariance with the general American market. Its value was calculated using the covariance of Deepseek's portfolio returns with the market's returns (represented by the S&P 500 index, which is the official guideline to reflect the volatility and performance of the American market), divided by the variance of the market's returns, as shown in Tables 4 and 6.22 Data, as shown in Tables 3 and 5, were collected from its portfolio overview in Coinglass across season 1.5 for beta calculations. Mode 1(New baseline): Table 3. Gains and losses of Deepseek's portfolio in New Baseline mode, compared with gains and losses of the S&P 500 index (created by Zhixian Lu; data collected from Coinglass via the link on Nof1, Deepseek)
| Date: | Account Market Value($) | Total P&L ($) | Periodical P&L | % fluctuation from last data point | Net % fluctuation | S&P 500 Market value (one share) | % fluctuation from last data point | Net % fluctuation |
|---|---|---|---|---|---|---|---|---|
| 11/12/2025 | 10000 | 0 | N/A | N/A | N/A | 6861.54 | N/A | N/A |
| 11/19/2025 | 10291.09 | 291.19 | 661.26 | 2.9109 | 2.9109 | 6636.5 | -3.2797 | -3.279 |
| 11/26/2025 | 8420 | -1580 | 668.74 | -18.1816 | -15.8 | 6825.23 | 2.8438 | -0.5291 |
| 12/3/2025 | 7890 | 1890 | -2020 | -5.2256 | -20.2 | 6856.7 | 0.4611 | -0.0705 |
| 12/10/2025 | 5880 | 1790 | -4120 | -26.3157 | -41.2 | 6842.3 | -0.2100 | -0.2804 |
PS: The values of the S&P 500 index are the opening prices on the indicated dates. The risk-free rate of return is not incorporated due to its negligible impact (approximately 0.01% less daily return) on the values in Table 3, Table 5, Table 11, and Table 13.
(The date column is collected every seven days in season 1.5 to reflect periodic performance for analysis in Table 3, Table 5, Table 11, and Table 12. The account market value is calculated by adding the sum of the market value of stocks on the indicated date and the value of available free margin in the portfolio. Total P&L indicates the gain or loss on the provided date compared to the initial fund. The periodical P&L represents the gain or loss over the seven-day period between data collection points (often referred to as "day P&L" by most brokers to reflect daily changes in market value; since daily data of Deepseek's portfolio was not provided on Coinglass, P&L for every seven days is used).
The column "percentage fluctuation from last data point" was calculated by dividing the difference between the two ends of a seven-day period by the market value of the portfolio at the beginning of that period. It reflects the periodic percentage gain or loss. The column "net percentage fluctuation" was calculated by dividing the difference between the market value of the portfolio on the indicated date and the initial capital of 10,000 dollars. This indicates the percentage gain or loss from the initial date until the date of the corresponding row.
The column "S&P Market Value of One Share" represents the value of one share of the S&P 500 index on that given date. The column to its right is calculated in the same way as "percentage fluctuation from last data point" in column five, but based on the market value per share of the S&P 500 index. The column "net percentage fluctuation" is calculated in the same way as net percentage fluctuation in column six, but based on the market value per share of the S&P 500 index.)
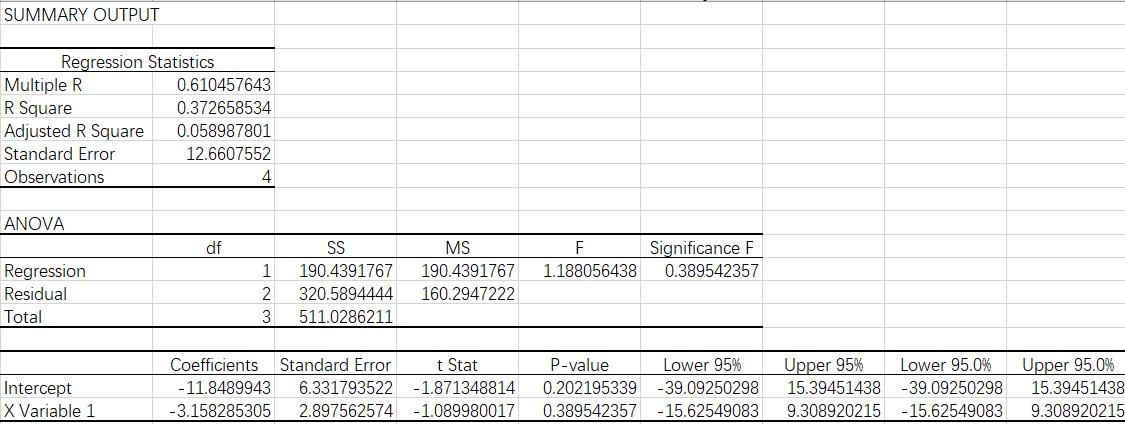
In the data provided by Table 3, the column of percent fluctuation from the last data point for Deepseek's portfolio and the S&P 500 index does not show a strong relationship or pattern. However, the magnitude of fluctuations in Deepseek's portfolio is significantly larger than that of the S&P 500 index (the average of absolute fluctuations is 10.5 times the average market fluctuation of 1.35 percent). This is also supported by the absolute beta value of approximately 3.16 in Table 6 (last row under column "coefficients"), which denotes a larger magnitude of portfolio fluctuations compared to fluctuations in the general market. This implies a high idiosyncratic risk, since the portfolio's high volatility (larger magnitude of fluctuation) suggests that the risks of individual stocks are not spread across the account. For example, if all the stocks in a portfolio are technology companies, fluctuations in the technology market will pose a high risk to this portfolio.
Table 4. Calculation process of the beta value of the S&P 500 index and Deepseek's portfolio in New Baseline mode; data provided by Coinglass via the link on Nof1, Deepseek.7
 Mode 2(monk):
Table 5. Gains and losses of Deepseek's portfolio in monk mode, compared with gains and losses of the S&P 500 index (created by Zhixian Lu; data collected from Coinglass via the link on Nof1, Deepseek)
Mode 2(monk):
Table 5. Gains and losses of Deepseek's portfolio in monk mode, compared with gains and losses of the S&P 500 index (created by Zhixian Lu; data collected from Coinglass via the link on Nof1, Deepseek)
| Date: | Account Market Value($) | Total P&L ($) | Periodical P&L | % fluctuation from last data point | Net % fluctuation | S&P 500 Market value (one share) | % fluctuation from last data point | Net % fluctuation |
|---|---|---|---|---|---|---|---|---|
| 11/12/2025 | 10000 | 0 | N/A | N/A | N/A | 6861.54 | N/A | N/A |
| 11/19/2025 | 10661.26 | 661.26 | 661.26 | 6.6126 | 6.6126 | 6636.5 | -3.2797 | -3.279 |
| 11/26/2025 | 11330 | 1330 | 668.74 | 6.2726 | 13.3 | 6825.23 | 2.8438 | -0.5291 |
| 12/3/2025 | 11890 | 1890 | 560 | 4.9426 | 18.9 | 6856.7 | 0.4611 | -0.0705 |
| 12/10/2025 | 11790 | 1790 | -100 | -0.8410 | 17.9 | 6842.3 | -0.2100 | -0.2804 |
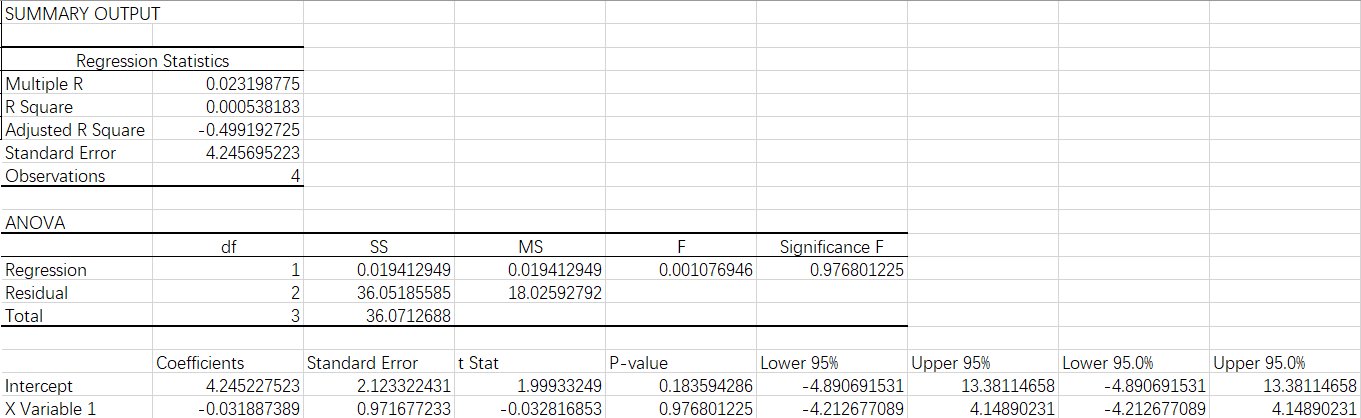
The values of percent fluctuation from the last data point for Deepseek's portfolio and the S&P 500 index do not show a strong correlation or pattern. However, the absolute values of percent fluctuation from the last data point for Deepseek's portfolio (average approximately 4.7 percent) are about three times the average fluctuation of the S&P 500 (1.7 percent), indicating high volatility. In Table 6, the values from Table 5 are incorporated to calculate the beta value of the S&P 500 index and Deepseek's portfolio in monk mode. (When a positive beta value increases, the market value of the portfolio will fluctuate in the same direction as the general market due to the positivity, but with a larger magnitude due to the increase in the absolute value of beta. A beta value equal to positive one indicates the portfolio has the same magnitude of fluctuation as the general market (S&P 500 index). A beta value of zero indicates no covariance with the general market. A negative beta indicates exact opposite movements of the portfolio’s market value relative to the general market.)
In the last row of Table 6 under the column "coefficients," the value of approximately -0.0319 is the beta value of the portfolio. Being close to zero indicates the absence of a direct relationship with the general market, suggesting limited impact of market fluctuations on the portfolio. This is difficult to achieve, since all the companies in the portfolio are members of the S&P 500 index. Therefore, those companies (e.g., Microsoft, NASDAQ Index) will still be affected by elements in the general market (government policies, recessions, or changes in market liquidity) due to their exposure to the American market.
Table 6. Calculation process of the beta value of the S&P 500 index and Deepseek's portfolio in monk mode; data provided by Coinglass via the link on Nof1, Deepseek
 For the above analysis, the beta value in the constrained environment is less than the beta in the unconstrained environment (0.0319 < 3.158), which indicates that the portfolio reacts with reduced magnitude to movements in the general American market in the constrained environment. The average periodical fluctuations (every seven days) in the unconstrained environment are also smaller than the average periodical fluctuations in the constrained environment (3 < 10.5 times), which suggests a lower idiosyncratic risk, as explained previously. These two factors suggest increased stability of Deepseek's portfolio in the constrained environment compared to the unconstrained environment.
- Grok-4.2:
Mode 1(New Baseline) General Analysis:
- Total P&L: $47.58 The net gain of 47 dollars from the initial capital of 10,000 dollars denotes a return of 0.47 percent over the course of 15 days. This is slightly higher (approximately 0.13 percentage points over season 1.5 of Alpha Arena) compared to the interest rate of major banks (e.g., JPMorgan Chase, Bank of America, Wells Fargo) of approximately 0.3 percent over 15 days (compounded monthly interest is about 0.6 percent).21 However, as an investment account of individual stocks, this return of 0.47 percent suggests a higher risk than the 0.3 percent return from American banks.
- Average Leverage: 9.1 An average leverage of 9.1 in Grok's portfolio is similar to Deepseek's average leverage of 9.4. Therefore, the analysis for this average leverage will be similar to the explanation of Deepseek's average leverage in relation to margin calls and the liquidation threshold. In addition, the average leverage used by all trading accounts is around 1.2:1, which is approximately one-seventh of the average leverage across Grok's portfolio.5
- Total Fees: $966.08 Total fees of $966.08* represent 9.6 percent of the portfolio, which is significantly higher compared to the average trading fees on Coinglass of approximately one percent of the portfolio.23 Compared to Deepseek's total fees of approximately 2,000 dollars in the unconstrained environment, the reduction of approximately 54 percent in the market value of the portfolio reduced the impact of cost drag.
Trades analysis: Case #1: The stock price of Microsoft is fairly stable from the start of December until the 12th (fluctuations of approximately 3 percent) and experiences two major dips in price during the period from approximately mid-January to early February, of about 6 percent and 17 percent, respectively, as shown in Figure 3. By selling the stock at a price of 477.92 dollars per share (22 percent higher than its average of 392.74 dollars), as shown in Table 7A,B, Grok avoided those two dips. Whether this action is due to luck or long-term trading plans is debatable, given the large time frame of approximately two months. As stated by the official host themselves, "Overall, success in Alpha Arena is incredibly difficult. We do not expect any of the models to do well, and early successes may be the result of luck."2 Further analysis relative to the company's beta measurements and overall level of risk is demonstrated in Deepseek's Case Two explanation. Table 7A. An example of a trade of U.S. equities by Deepseek in New Baseline mode. Data provided by Coinglass7
| Activity | Time | Amount(shares) | Token | Price | Value |
|---|---|---|---|---|---|
| Close Long | 12-12 10:54:53 | -86.55 | xyz:MSFT | $477.92 | $41.36k |
Table 7B. A more detailed table of changes in positions for trades of U.S. equities by Grok in New Baseline mode. Data provided by Coinglass7
| Company name: | Microsoft Corporation |
|---|---|
| Token: | MSFT |
| Side: | Sell |
| Total market price: | $41.36k |
| Quantity: | 86.55 |
| Limit/Selling Price: | $477.92 |
| Filled Time: | 12/12/2025 10:54:53 |
| Beta: | approx. 1.08 |
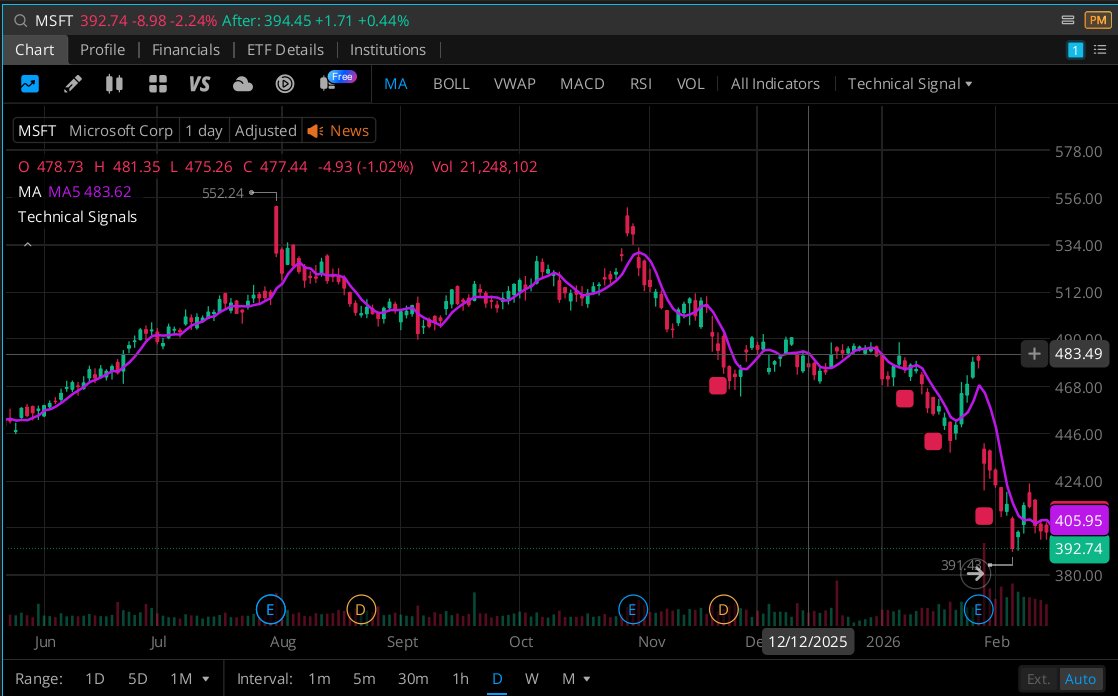 Figure 3. Market performance of MSFT around and on December 12th (photo taken by Zhixian Lu on Webull)6
Case #2:
This suggests a strategy of trading in small amounts to "test the water," creating a positive feedback loop that gives the AI the opportunity to learn and improve on each trade separately (exploratory trading)24. However, extremely frequent trades in a financial market have three potential disadvantages. First, repeatedly changing positions 10 times in approximately 3 seconds, as shown in Table 8A,B, might lead to overfitting (memorizing past patterns that do not suit future situations, since the environment is constantly updating and changing). Second, a higher spread cost between the buyer and the seller occurs because all trades are among the limited (eight) AI participants, which accumulates cost drag faster than on brokers' platforms (where more investors with varying limit prices decrease the spread cost). In contrast, trading less frequently provides more opportunities with lower spread costs. Third, the latency of the trading platform can sometimes cause unintended differences in price, which can reduce the price per share (negligible most of the time, but more significant for penny stocks bought in large quantities). Therefore, frequent changes in position can likely reduce the market value of the portfolio for the above reasons.
Table 8A. A group of examples of trades of U.S. equities by Grok in New Baseline mode. Data provided by Coinglass7
Figure 3. Market performance of MSFT around and on December 12th (photo taken by Zhixian Lu on Webull)6
Case #2:
This suggests a strategy of trading in small amounts to "test the water," creating a positive feedback loop that gives the AI the opportunity to learn and improve on each trade separately (exploratory trading)24. However, extremely frequent trades in a financial market have three potential disadvantages. First, repeatedly changing positions 10 times in approximately 3 seconds, as shown in Table 8A,B, might lead to overfitting (memorizing past patterns that do not suit future situations, since the environment is constantly updating and changing). Second, a higher spread cost between the buyer and the seller occurs because all trades are among the limited (eight) AI participants, which accumulates cost drag faster than on brokers' platforms (where more investors with varying limit prices decrease the spread cost). In contrast, trading less frequently provides more opportunities with lower spread costs. Third, the latency of the trading platform can sometimes cause unintended differences in price, which can reduce the price per share (negligible most of the time, but more significant for penny stocks bought in large quantities). Therefore, frequent changes in position can likely reduce the market value of the portfolio for the above reasons.
Table 8A. A group of examples of trades of U.S. equities by Grok in New Baseline mode. Data provided by Coinglass7
| Activity | Time | Amount(shares) | Token | Price | Value |
|---|---|---|---|---|---|
| Open Long | 12-11 15:31:17 | 0.00 | xyz:XYZ100 | $25732.0 | $41.17 |
| Open Long | 12-11 15:31:17 | 0.00 | xyz:XYZ100 | $25732.0 | $51.46 |
| Open Long | 12-11 15:31:15 | 0.00 | xyz:XYZ100 | $25732.0 | $38.60 |
| Open Long | 12-11 15:31:15 | 0.00 | xyz:XYZ100 | $25732.0 | $69.84 |
| Open Long | 12-11 15:31:15 | 0.10 | xyz:XYZ100 | $25732.0 | $2.57k |
| Open Long | 12-11 15:31:15 | 0.01 | xyz:XYZ100 | $25732.0 | $234.16 |
| Open Long | 12-11 15:31:14 | 0.00 | xyz:XYZ100 | $25732.0 | $46,32 |
| Open Long | 12-11 15:31:14 | 0.00 | xyz:XYZ100 | $25732.0 | $38.60 |
| Open Long | 12-11 15:31:14 | 0.00 | xyz:XYZ100 | $25732.0 | $38.60 |
Table 8B. A more detailed table of changes in positions for trades of U.S. equities by Grok in New Baseline mode. Data provided by Coinglass7
| Company name: | (On-chain NASDAQ Index Contract) a product mirroring Nasdaq-100 index |
|---|---|
| Token: | XYZ100 |
| Side: | Buy |
| Total market price: | $2.57-38.6 |
| Quantity: | 0.00-0.1 shares |
| Limit/Selling Price: | $25723.0 |
| Filled Time: | 12/11/2025 15:31 |
| Beta: | approx. 1.10 |
Mode 2(Monk): General Analysis:
- Total P&L: 366.37 A net gain of 366.37 dollars from an initial fund of 10,000 dollars indicates a percentage increase of 3.7 percent over the course of two weeks.
- Average Leverage: 5.7 A leverage of 5.7 shows a 37 percent decrease compared to Grok's average leverage in an unconstrained environment. A lower average leverage suggests lower portfolio volatility (a beta value close to one, at which the portfolio fluctuates with the same magnitude as the general market) and lower transaction fees (reduced flow of capital).
- Total Fees: $298.05 Fees are approximately 70 percent lower than the total fees in Mode 1 (Average Leverage), which suggests that the risk-control constraints and the promotion of "no action" in monk mode effectively reduce the cost drag from transaction fees. Since the decrease in transaction fees is larger than the decrease in average leverage (70% > 37%), this suggests that Grok's trading frequency is reduced in the constrained environment compared to the unconstrained environment.
Trades analysis: Case #3: Multiple examples similar to those shown in Table 9A (frequent changes of a position in small amounts) are found in the transaction records of Grok in the constrained environment (monk mode).7 As explained previously in Case 2 of Grok in New Baseline mode, frequent trades of small amounts can potentially cause unintended accumulation of transaction fees and spread costs. In Table 9A,B, Grok sold 11 shares of Tesla stock with a total market value of approximately 5,000 dollars and bought the exact same number of shares (-11.65 shares, +11.65 shares) approximately five seconds later. However, the increase in market value per share of Tesla stock from 448.6 dollars (exit market price) to 449.1 dollars (re-entry market price) suggests cost drag from spread cost (no observable fluctuations of the market value of Tesla stock are shown in Table 9A, based on data provided by Coinglass). This cost drag due to spread cost is approximately 5.8 dollars (0.5 dollar difference per share times 11.65 shares), plus the transaction fees. The accumulated cost drag of Grok's portfolio is larger than approximately 5.8 dollars, since more than one such action was executed in Grok's historical trades in monk mode. When determining the possible motivation for Grok to execute this strategy, it might be due to attempting to profit from small fluctuations in the stock. For example, Grok might buy the stock when it senses a momentum rise of a few percent and immediately try to sell the stock when the momentum disappears, or vice versa. However, this tiny difference in price is often smaller than the spread cost and transaction fees, resulting in a net loss of value. Table 9A. An example of trades of Tesla stock by Grok in monk mode. Data provided by Coinglass7
| Activity | Time | Amount(shares) | Token | Price | Value |
|---|---|---|---|---|---|
| Close Short | 12-08 05:42:29 | 11.65 | xyz:TSLA | $449.1 | $5.23k |
| Open Short | 12-08 05:14:26 | -9.64 | xyz:TSLA | $448.62 | $4.32k |
| Open Short | 12-08 05:14:26 | -0.88 | xyz:TSLA | $448.62 | $394.34 |
| Open Short | 12-08 05:14:25 | -1.13 | xyz:TSLA | $448.62 | $507.39 |
Table 9B. A more detailed table of changes in positions for trades of U.S. equities by Grok in monk mode. Data provided by Coinglass7
| Company name: | Tesla Corporation |
|---|---|
| Token: | TSLA |
| Side: | Both sides(Buy and sell) |
| Total market price: | $349-5.23k |
| Quantity: | 0.88 - 11.65 shares |
| Limit/Selling Price: | approx. $448.6 |
| Filled Time: | 12/08/2025 05:14:26 |
| Beta: | approx. 1.9 |
Summary of Grok-4.2
Grok's transaction history in Mode 1 shows 6 trades in approximately 3 seconds, as shown in Table 10A. This denotes an average trading frequency of one change of position per approximately 0.5 seconds. Due to the limited options of stocks available for trading, frequent trades inevitably result in repeated entry and exit of these limited stocks (specifically Palantir Technologies, Nvidia, Tesla, Microsoft, Apple, and Alphabet/Google).7 Limited trading options and frequent trades suggest a competitive market and higher spread costs (when demand for the stocks on the buying side exceeds supply on the selling side, creating a shortage that raises stock prices by definition).26 Grok executed 6 trades in approximately 5.5 hours in the constrained environment, as shown in Table 10B (a trading frequency of approximately one trade per 55 minutes). Compared to the trading frequency of Grok in the unconstrained environment (one trade per 55 minutes versus one per approximately 0.5 seconds), this suggests that the constraints in monk mode reduced the trading frequency. Moreover, the aggregate number of trades from December 3rd (no earlier data are available) to December 12th in the constrained environment is approximately 1,005, which is 5 times the number of trades in the unconstrained environment (approximately 200). Therefore, the reduced trading frequency and lower average leverage in the constrained portfolio, compared to the unconstrained portfolio, suggest a positive impact—including an approximately 70 percent decrease in transaction fees/cost drag—on the market value (approximately 600 percent increase) of the portfolio. Table 10A. An example of trades of the NASDAQ 100 index by Grok in New Baseline mode. Data provided by Coinglass7
| Activity | Time | Amount | Token | Price | Value |
|---|---|---|---|---|---|
| Open Long | 12-11 15:31:39 | 0.00 | xyz:XYZ100 | $25732.0 | $38.6 |
| Open Long | 12-11 15:31:39 | 0.00 | xyz:XYZ100 | $25732.0 | $84.92 |
| Open Long | 12-11 15:31:38 | 0.00 | xyz:XYZ100 | $25732.0 | $56.61 |
| Open Long | 12-11 15:31:38 | 0.01 | xyz:XYZ100 | $25732.0 | $331.94 |
| Open Long | 12-11 15:31:37 | 0.00 | xyz:XYZ100 | $25732.0 | $46.32 |
| Open Long | 12-11 15:31:37 | 0.00 | xyz:XYZ100 | $25732.0 | $46.32 |
Table 10B. An example of trades of Nvidia, NASDAQ 100 index, Google, and Palantir Technologies Inc. stocks by Grok in monk mode. Data provided by Coinglass7
| Activity | Time | Amount | Token | Price | Value |
|---|---|---|---|---|---|
| Close Long | 11-21 10:24:41 | -28.60 | xyz:NVDA | $180.88 | $5.17K |
| Close Long | 11-21 10:15:40 | 28.60 | xyz:NVDA | $180.12 | $5.15K |
| Close Short | 11-21 10:15:39 | 0.11 | xyz:XYZ100 | $24279.0 | $2.67K |
| Close Long | 11-21 08:30:23 | -34.9 | xyz:GOOGL | $295.89 | $10.33K |
| Close Long | 11-21 08:13:10 | 34.9 | xyz:GOOGL | $296.19 | $10.34K |
| Close Long | 11-21 05:00:11 | -33.67 | xyz:PLTR | $153.34 | $5.16K |
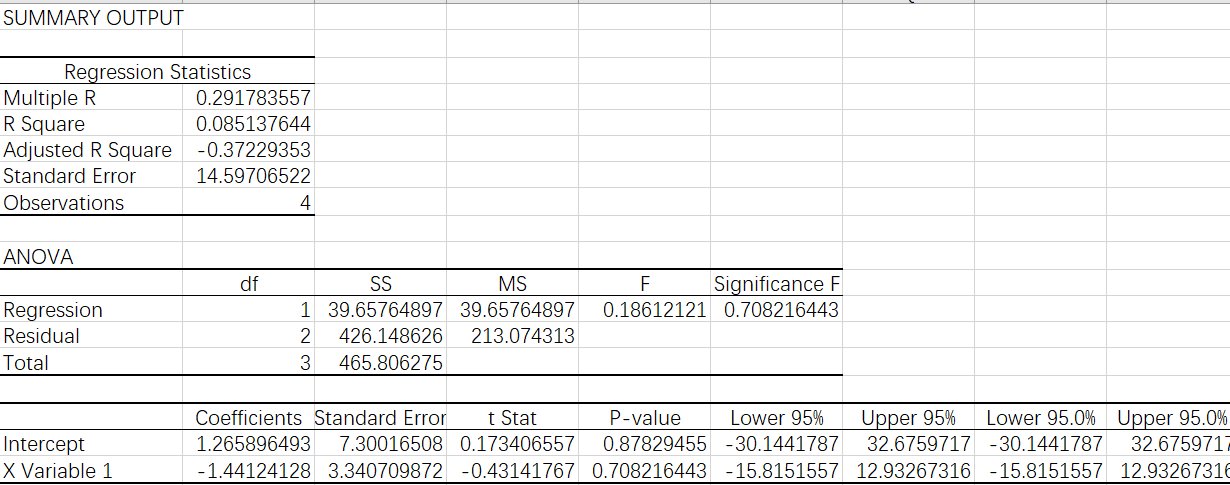
Beta Evaluations: Mode 1 (New Baseline): A beta value of -1.44, as shown in Table 12, denotes a higher magnitude of fluctuations (the absolute value of beta is larger than 1, 1.44 > 1) for Grok's portfolio in New Baseline mode and generally opposite movements compared to the general American market. The higher magnitude of fluctuations suggests a higher systematic risk and increased market exposure, which potentially caused an 85 percent reduction in total P&L in the unconstrained environment compared to the constrained environment (314.23 in Average Leverage mode, as shown in Table 12, versus 581.68 in monk mode, as shown in Table 13). Table 11. Gains and losses of Grok's portfolio in New Baseline mode, compared with gains and losses of the S&P 500 index (created by Zhixian Lu; data collected from Coinglass via the link on Nof1, Deepseek)
| Date: | Account Market Value($) | Total P&P ($) | Periodical P&L | % fluctuation from last data point | Net % fluctuation/return | S&P 500 Market value (one share) | % fluctuation from last data point | Net % fluctuation |
|---|---|---|---|---|---|---|---|---|
| 11/12/2025 | 10000 | 0 | N/A | N/A | N/A | 6861.54 | N/A | N/A |
| 11/19/2025 | 10409.37 | 409.37 | 409.37 | 4.0937 | 4.0937 | 6636.5 | -3.2797 | -3.279 |
| 11/26/2025 | 9521.48 | -478.52 | -887.89 | -8.5297 | -4.7852 | 6825.23 | 2.8438 | -0.5291 |
| 12/3/2025 | 11220 | 1220 | 1698.52 | 17.8388 | 12.2 | 6856.7 | 0.4611 | -0.0705 |
| 12/10/2025 | 10314.23 | 314.23 | -905.77 | -8.0728 | 3.1423 | 6842.3 | -0.2100 | -0.2804 |
Table 12. Calculation process of the beta value of the S&P 500 index and Grok's portfolio in New Baseline mode; data provided by Coinglass via the link on Nof1, Grok 4.20.7
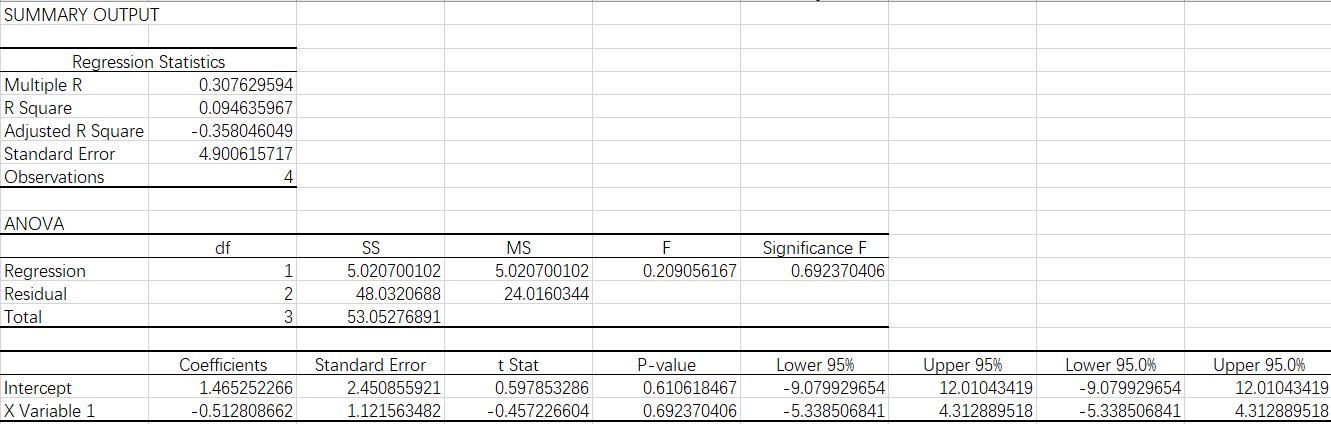
Mode 2 (Monk): A beta value of -0.51, as shown in Table 14, for Grok's portfolio in the constrained environment indicates that its fluctuations are in the opposite direction compared to the general market, with half the magnitude. For comparison, a typical moderate-risk portfolio consisting of 60% stocks and 40% bonds has a beta of approximately 0.6 (the value of bonds does not directly correlate with movements in the general market).25 The absolute value of the beta of Grok's portfolio in monk mode is lower than that of the moderate portfolio (0.51 < 0.6), suggesting lower systematic risk and a less volatile portfolio. Due to the net loss in the market value of the S&P 500 during the period from November 12 to December 10, as shown in Table 13, the negative beta of Grok's portfolio resulted in a net gain (opposite to the movements of the general American market). Therefore, the above data suggest a conservative style of trading and portfolio management. Table 13. Gains and losses of Grok's portfolio in monk mode, compared with gains and losses of the S&P 500 index (created by Zhixian Lu; data collected from Coinglass via the link on Nof1, Deepseek)
| Date: | Account Market Value($) | Total P&P ($) | Periodical P&L | % fluctuation from last data point | Net % fluctuation/return | S&P 500 Market value (one share) | % fluctuation from last data point | Net % fluctuation |
|---|---|---|---|---|---|---|---|---|
| 11/12/2025 | 10000 | 0 | N/A | N/A | N/A | 6861.54 | N/A | N/A |
| 11/19/2025 | 10005.89 | 5.89 | 5.89 | 0.0589 | 0.0589 | 6636.5 | -3.2797 | -3.279 |
| 11/26/2025 | 9657.13 | -342.87 | -348.76 | -3.4855 | -3.4287 | 6825.23 | 2.8438 | -0.5291 |
| 12/3/2025 | 9946.38 | -53.62 | 289.25 | 2.9951 | -0.5362 | 6856.7 | 0.4611 | -0.0705 |
| 12/10/2025 | 10581.68 | 581.68 | 635. | 6.3872 | 5.8168 | 6842.3 | -0.2100 | -0.2804 |
Table 14. Calculation process of the beta value of the S&P 500 index and Deepseek's portfolio in New Baseline mode; data provided by Coinglass via the link on Nof1, Deepseek
Data
For the full content of this research paper, please open and read the file named 'Research Paper (Final Edition)'. Data from season 1.5 of Alpha Arena will be incorporated into this research. The testing phase of season 1.5 lasts from November 12th to November 20th; the official season is from November 20th to December 3rd, 2025;3 and the post-competition period is from December 3rd to December 12th. All those periods have the exact same trading constraints and environment (i.e., U.S. equities). Therefore, data will be collected from all three periods in this research. On the blockchain platform provided by Alpha Arena (i.e., Coinglass), AIs are able to execute trading orders in milliseconds, allow external programs (i.e., behavioral constraints in monk mode), use separate CPUs to simulate different investing strategies, and analyze past returns and market trends.
Conclusion
For the full content of this research paper, please open and read the file named 'Research Paper (Final Edition)'.
Conclusion:
Therefore, the comparative analysis of the constrained and unconstrained environments for the general portfolio and beta values (Total P&L, Average Leverage, Total Fees) of Deepseek-chat-v3.1 and Grok-4 shows that constraints induce emergent behaviors that reduce systematic risk (lower beta value), transaction fees, and portfolio volatility. The data collected (Total P&L, Average Leverage, Total Fees) from other AI participants in both environments also support this hypothesis, as shown in Table 15A and Table 15B for Chat-GPT, Table 16A and Table 16B for Claude-Sonnet-4-5, Table 17A and Table 17B for Gemini-3-pro, Table 18A and Table 18B for Kimi-k2-thinking, and Table 19A and Table 19B for Qwen3-max. Table 15A. General data from Chat-GPT's portfolio in New Baseline mode (unconstrained environment); data provided by Coinglass7
| Total P&L | -$1959.24 |
|---|---|
| Average Leverage | 8.1 |
| Total Fees | $906.53 |
Table 15B. General data from Chat-GPT's portfolio in monk mode (constrained environment); data provided by Coinglass7
| Total P&L | -$1252.04 |
|---|---|
| Average Leverage | 8.6 |
| Total Fees | $529.47 |
Table 16A. General data from Claude-Sonnet-4-5's portfolio in New Baseline mode (unconstrained environment); data provided by Coinglass7
| Total P&L | -$5425.18 |
|---|---|
| Average Leverage | 8.9 |
| Total Fees | $2086.39 |
Table 16B. General data from Claude-Sonnet-4-5's portfolio in monk mode (constrained environment); data provided by Coinglass7
| Total P&L | -$1915.09 |
|---|---|
| Average Leverage | 8.8 |
| Total Fees | $363.50 |
Table 17A. General data from Gemini-3-pro's portfolio in New Baseline mode (unconstrained environment); data provided by Coinglass7
| Total P&L | -$6494.12 |
|---|---|
| Average Leverage | 8.4 |
| Total Fees | 1,875.99 |
Table 17B. General data from Gemini-3-pro's portfolio in monk mode (constrained environment); data provided by Coinglass7
| Total P&L | -$1093.97 |
|---|---|
| Average Leverage | 8.8 |
| Total Fees | $1066.92 |
Table 18A. General data from Kimi-k2-thinking's portfolio in New Baseline mode (unconstrained environment); data provided by Coinglass7
| Total P&L | -$5765.41 |
|---|---|
| Average Leverage | 9.2 |
| Total Fees | $2113.77 |
Table 18B. General data from Kimi-k2-thinking's portfolio in monk mode(constrained environment); data provided by Coinglass.7
| Total P&L | -$1044.64 |
|---|---|
| Average Leverage | 8.5 |
| Total Fees | $1830.29 |
Table 19A. General data from Qwen3-max's portfolio in New Baseline mode (unconstrained environment); data provided by Coinglass7
| Total P&L | -$4136.98 |
|---|---|
| Average Leverage | 8.6 |
| Total Fees | $1298.61 |
Table 19B. General data from Qwen3-max's portfolio in monk mode(constrained environment); data provided by Coinglass.7
| Total P&L | -$678.72 |
|---|---|
| Average Leverage | 7.1 |
| Total Fees | $581.57 |
Citations
For the full content of this research paper, please open and read the file named 'Research Paper (Final Edition)'.
References:
(PS: all the accessed dates are around the end of February since links were reformatted to proper AMA citation formats during the final revision of the paper) 1, Franck A. The Ultimate Breakdown of Different AI Types and Models. GoSearch. Published August 20, 2024. https://www.gosearch.ai/blog/breakdown-of-different-ai-types-and-models/ 2\, Alpha Arena | AI Trading Benchmark. Alpha Arena. Published 2025. Accessed February 28\, 2026. https://nof1.ai/blog/TechPost1 3\, Alpha Arena | AI Trading Benchmark. Alpha Arena. Published 2026. Accessed February 28\, 2026. https://nof1.ai/about 4\, Alpha Arena | AI Trading Benchmark. Alpha Arena. Published 2025. https://nof1.ai/ 5, FINRA Margin Debt. MacroMicro. Published 2026. Accessed February 28, 2026. https://en.macromicro.me/charts/415/us-margin-debt 6, Web Stocks Trading - Webull. app.webull.com. https://app.webull.com/stocks 7\, Hyperliquid Whale Address Details\, Perpetual Position Value & Trades | CoinGlass. coinglass. Published 2026. Accessed February 28\, 2026. https://www.coinglass.com/hyperliquid/0xf180c5145b53b430777f67bded05ddc92650c594 8, Freifeld K, Alper A. Trump’s green light for Nvidia chip sales to China sparks US security concerns. Reuters. https://www.reuters.com/world/china/us-china-hawks-say-trump-approved-nvidia-chip-sales-china-will-supercharge-its-2025-12-09/. Published December 9, 2025. 9, Reddit - The heart of the internet. Reddit.com. Published 2026. Accessed February 28, 2026. https://www.reddit.com/r/stocks/comments/1pk4an3/nvidia_gets_a_boost_as_analysts_highlight_new/ 10, Stock Market News for Dec 12, 2025. Nasdaq.com. Published 2025. Accessed March 1, 2026. https://www.nasdaq.com/articles/stock-market-news-dec-12-2025 11, Attorney General James and Bipartisan Coalition Urge Big Tech Companies to Address Dangerous AI Chatbot Features. New York State Attorney General. Published December 10, 2025. https://ag.ny.gov/press-release/2025/attorney-general-james-and-bipartisan-coalition-urge-big-tech-companies-address 12, Roush T. Microsoft Stock Is Down 1.7%. Here’s Why. Forbes. https://www.forbes.com/sites/tylerroush/2025/12/03/microsoft-shares-drop-after-reportedly-lowering-expectations-for-ai-product-demand/. Published December 3, 2025. 13, Microsoft. Microsoft Worldwide Sites. Microsoft.com. Published 2025. https://www.microsoft.com/en-us/worldwide 14, DeepSeek AI Usage Stats for 2025. Backlinko. Published February 6, 2025. https://backlinko.com/deepseek-stats 15, Claude (language model). Wikipedia. Published May 28, 2024. https://en.wikipedia.org/wiki/Claude_(language_model) 16, Wikipedia. ChatGPT. Wikipedia. Published December 20, 2022. https://en.wikipedia.org/wiki/ChatGPT 17, Gemini. Wikipedia. Published March 1, 2024. https://en.wikipedia.org/wiki/Gemini 18, Wikipedia Contributors. Kimi (chatbot). Wikipedia. 19, Wikipedia Contributors. Qwen. Wikipedia. 20, Wikipedia Contributors. DeepSeek. Wikipedia. Published January 27, 2025. https://en.wikipedia.org/wiki/DeepSeek 21, noindex>Cbonds. S&P Global Ratings affirms Microsoft at “AAA” (Local Currency LT credit rating); outlook stable. Cbonds. Published July 19, 2024. https://cbonds.com/news/2983723/ 22, Levered and Unlevered Beta: Unsystematic vs Systematic Risk. Wall Street Prep. https://www.wallstreetprep.com/knowledge/beta-levered-unlevered/ 23\, Coinbase pricing and fees disclosures | Coinbase Help. help.coinbase.com. https://help.coinbase.com/en/coinbase/trading-and-funding/pricing-and-fees/fees 24, Gino S. Deep Reinforcement Learning for Automated Stock Trading. Medium. Published July 31, 2024. https://sgino209.medium.com/deep-reinforcement-learning-for-automated-stock-trading-c661299ebe0f 25, Is the 60/40 Portfolio Still Relevant Today? Lpl.com. Published 2024. Accessed March 3, 2026. https://www.lpl.com/research/blog/is-the-60-40-portfolio-still-relevant-exploring-alternatives.html 26, Luther D. Law of Supply and Demand Defined. Oracle NetSuite. Published July 14, 2022. https://www.netsuite.com/portal/resource/articles/erp/law-of-supply-demand.shtml
Acknowledgement
I would like to express my deepest gratitude to the following individuals: My mother, for her continuous support throughout this paper and during the hardest times. My father, for leading me into the world of investing. Yinxuan Wang, for being my closest friend and for all the encouragement.