
Ethylene Consumption in Arctic Soil
Marlea Wang
Western Canada High School
Grade 12
Presentation
No video provided
Hypothesis
Ethylene will negatively impact or kill the majority of methanotrophs with the exception of some resistant microbes. This is supported by the idea that in these wetlands and rice paddies which contain lots of ethylene, methane is still being consumed.
Research
Greenhouse gases or GHG are natural gases that affect earth’s temperature and climate. Methane, CH4, is one of the most abundant GHG, second right after carbon dioxide, CO2. Although there isn’t as much methane in the atmosphere, it is about 28 times more potent than carbon dioxide at trapping heat in the atmosphere. Meaning bigger reductions in CH4 will cause more significant, rapid lowering on atmospheric warming and mitigation of climate change. (US EPA, 2025)
Similar to the other natural cycles, methane can be sourced both naturally or anthropogenically as seen in Figure 1. (US EPA, 2025) Natural methane production begins with methanogens which are a type of archaea or microbe that lives in deep, anaerobic (oxygen-poor) conditions. (NOAA, n.d.) This environment is most commonly seen in the form of wetlands, bogs, marshes, fens, permafrost, etc. Wetlands account for 80% of the natural sources for methane and favour methanogens during the decomposition of organic material. They also satisfy the anaerobic conditions and create roughly 140-280 million metric tons (Tg) of methane. (US EPA, 2025) Anthropogenic or human sources can come through fermentation from livestock, fossil fuel use, biomass burning, landfills, and much more. One of the most notable sources is rice agriculture in rice paddies which accounts for 9% of the total human causes. Methane is produced during flooded rice cultivation where the conditions are oxygen-poor, moist, and have lots of organic matter creating the ideal environment that creates 7.4 Tg. (US EPA, 2025)
 Figure 1: Methane Cycle
CH4 in soil moves up through the layers and reaches the surface where it can be emitted into the environment or consumed methanotrophs. (US EPA, 2025) Methanotrophs are bacteria that oxidize methane to produce carbon dioxide and are one of the most important “sinks” for being nature’s biofilter. (Fisher et al., 2018) Aerobic methanotrophy consumes 43% - 90% of all CH4 produced in soil, or 7% - 10% of all atmospheric CH4. (Chowdhury & Dick, 1998) In its most basic form, the global reaction for methane oxidation is CH4 + 2O2 ⇌ CO2 + H2O. (Bendtsen et al., 1998) However, this reaction is far from simple and goes through many stages to create the final products. Going from alkane → alcohol → aldehyde → carboxylic acid → CO2 as can be seen in the following figure. (Chiemchaisri et al., 2011)
Figure 1: Methane Cycle
CH4 in soil moves up through the layers and reaches the surface where it can be emitted into the environment or consumed methanotrophs. (US EPA, 2025) Methanotrophs are bacteria that oxidize methane to produce carbon dioxide and are one of the most important “sinks” for being nature’s biofilter. (Fisher et al., 2018) Aerobic methanotrophy consumes 43% - 90% of all CH4 produced in soil, or 7% - 10% of all atmospheric CH4. (Chowdhury & Dick, 1998) In its most basic form, the global reaction for methane oxidation is CH4 + 2O2 ⇌ CO2 + H2O. (Bendtsen et al., 1998) However, this reaction is far from simple and goes through many stages to create the final products. Going from alkane → alcohol → aldehyde → carboxylic acid → CO2 as can be seen in the following figure. (Chiemchaisri et al., 2011)
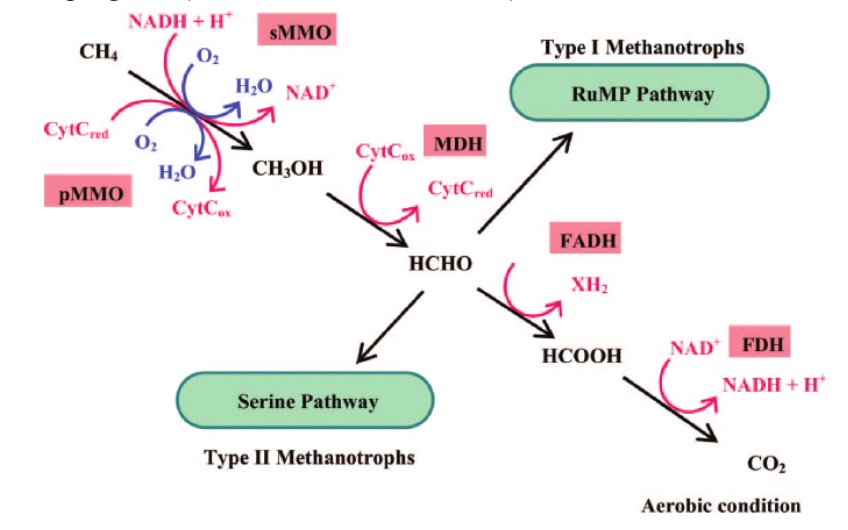 Figure 2: Methane Oxidation
The first step of methane oxidation includes methane monooxygenases or MMOs which are enzymes that catalyze this reaction turning methane into methanol in bacteria or methanotrophs. (Sirajuddin & Rosenzweig, 2015) MMOs are further divided into two categories: pMMOs and sMMOs. sMMOs are soluble and cytoplasmic, they also contain iron, Fe. Most methanotrophs are pMMOs which means they are membrane-bound and particulate enzymes that contain copper, Cu. (Ro & Rosenzweig, 2018) pMMOs will be the main focus for this project. As seen in figure 2, from alcohols to aldehydes an enzyme called methanol dehydrogenase (MDHs) is used. (Ro & Rosenzweig, 2018) From here, methanotrophs can also be divided into Type I and Type II. Type I methanotrophs follow the RuMP or ribulose monophosphate pathway and have monounsaturated 16C (16:1) phospholipids. They also are gammaproteobacteria as contrasted to Type II which is alphaproteobacteria. Type II methanotrophs follow the serine pathway and have monounsaturated 18C (18:1) phospholipids. (Chowdhury & Dick, 1998)
Ethylene, C2H4, is another naturally occurring gas primarily produced by plants. (IARC Lyon France, 1994) It is often used as a hormone by fruits and vegetables which can be seen when they ripen. It is also extremely prevalent in both wetlands and rice paddies. (Phartyal et al., 2022) (Yin et al., 2017)
pMMO is promiscuous meaning it can catalyze more than one chemical but only in the presence of a growth substrate, methane. In the case of methane and ethylene, it will co-oxidize because the enzyme can not tell the difference between the substrate and the competitive inhibitor. (Toppings et al., 2024) As seen in Figure 2, when methane attaches to pMMO it creates methanol. But when ethylene attaches to pMMO it creates epoxyethane via epoxidation which is toxic to methanotrophs, which is shown in Figure 3. (Xin et al., 2017) In the real world, when small amount of ethylene exists, methane oxidation slows down but does not completely stop. Methanotrophs will oxidize ethylene slowly as a defensive response, only when more ethylene is present will methane oxidation stop completely. However there have been studies that have shown that a survival mechanism exists where a gene called etnE becomes more active when ethylene is present and breaks down epoxyethane. (Toppings et al., 2024) This adaptation is a sort of detox system used to help the survival of methanotrophs.
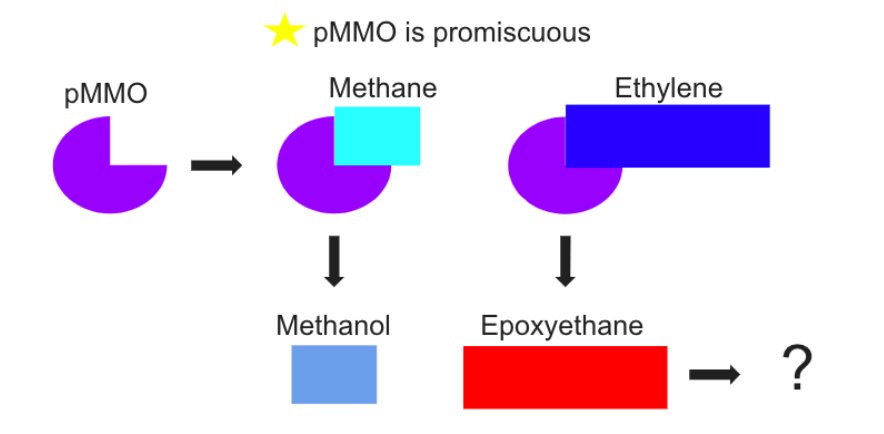 Figure 3: Methanotrophs Co-oxidation
Research Question: What is the effect of ethylene on methanotrophic communities in arctic peat soil?
Variables
MV: The manipulated variable is the different gas treatments in each of the bottles, in which there are 12C CH4, 12C C2H4, 13C CH4, 1’3C C2H4, 12C mix, and 13C mix.
RV: The responding variable is the amounts of methane and ethylene consumed measured using gas chromatography, which were then used to calculate the rate at which they were consumed.
Experimental Controls: There was an autoclaved control which was used to prove that in the absence of any methanotrophs or microbes in the soil the amount of 12C CH4 and 12C C2H4, was constant. Additionally, there was a no gas control to show that other bacteria may grow but methanotrophs wouldn’t be consuming or growing.
Procedure
Objectives
- Monitor substrate consumption across the enrichments
- Observe changes in community composition
- Next-generation sequencing of 16S rRNA amplicon libraries
- Phospholipid fatty acid analysis (PLFA)
Observations
 Figure 9: Amounts of methane and CO2 consumed during the pre-enrichment period (Day 1-9)
 Figure 10: Amount of methane consumed in both pre-enriched and non-pre-enriched samples over time
The red arrows indicate the days that we regassed the samples. Prior to day 10 was the pre-enrichment period for half of the samples, which can be seen on the left. After day 21, all samples were switched to larger bottles to make it easier to see how fast the methane was being consumed. From these graphs, we see that from day 23 to around day 35 was when consumption of methane was faster in the non-pre-enriched samples. This could be because the peak for methane consumption for the pre-enriched happened sooner when in the smaller bottles, it is possible we missed it. The treatments with methane alone seemed a bit faster at consuming methane but over time they seemed to become closer or the same. To more clearly illustrate this, we constructed rate graphs.
 Figure 11: Rate of methane consumption during three periods of time
From the graph on the left, the rates of methane consumption show that the non-pre enriched seem to consume methane faster than the pre-enriched. Which we saw from before where we said that the peak methane consumption for pre-enriched samples could have happened in the small bottles. We are just seeing this peak later in the non pre-enriched samples. On the other side, it seemed that the ethylene had an impact on the methanotrophs likely killing some off by day 42. However it seems that the pre enriched consumed more methane at around day 35-37.
 Figure 12: Amount of ethylene consumed in both pre-enriched and non-pre-enriched samples over time
Ethylene was introduced to both pre and non-pre enriched at the same time. On the left, it is seen that the “mix” samples were faster overall. The “non-mix” samples started to get faster at around day 38. On the right side, a similar trend can be observed where the mixes were faster up until after day 38 where all treatments started consuming ethylene quickly.
 Figure 13: Rate of methane consumption during three periods of time
Ethylene consumption seems to increase over time. In the case of ethylene by itself, it seems to be going up quite a bit. While the mixes seem to be not increasing as much. In the case of the pre-enriched it may be staying the same or even decreasing.
 Figure 14: Amount of CO2 produced in both pre-enriched and non-pre-enriched samples over time
These graphs show us that our microbes were growing and producing CO2.
Analysis
 Figure 15: Bacteria relative abundance table for samples ID 14-20 August 27, 2024
Some important features:
- All the other category includes the bacteria that was present in less than 0.01%
- The biggest bar on the Ethylene samples (ID 14-16) was Mycobacterium
- The biggest bar on the Mix samples (ID 17-20) was Methylocystis
- Another big bar was Uncultured (f_methylollgellacea) but looks about the same in all samples
- Candidatus is a new genus, falls under verrucomicrobia
- If a sample is named uncultured it means it doesn’t fall under a specific genus
- The bracketed naming is the next closest phylum (f), class (c), or order (o)
- JGI_0001001-H03 is a blastocatellaceae or actinobacteria
- KD4-96 is chloroflexi
- IMCC26256, KD4-96, MB-A2-108, are all actinobacteria
- Ellin6055, SWB02, KF_JG30-B3 are all proteobacteria
 Figure 16: Comparing relative frequencies of Methylocystis and Mycobacterium
This graph takes the average of the ethylene and methane samples. We see that Methylocystis, which is a type II methanotroph does indeed consume methane but also tolerates ethylene. In contrast to Mycobacterium which likely grows on ethylene.
 Figure 17: Phospholipid Fatty Acid Data Analysis (PLFA)
Using this data we see that actinobacteria consume 13C ethylene and in the methane treatments both types of methanotrophs consume 13C methane which makes sense. In the mix treatments, 13C mix was still consumed especially in methanotrophs type II but looking at the scale it was in much less quantities than the other two. Using the PLFA and DNA sequencing data they confirm that actinobacteria or mycobacterium does consume ethylene which shows that some methanotrophs may grow on ethylene but not as much as their growth on methane. This analysis also shows that Type II Methanotrophs or methylocystis also consume methane, even in higher quantities when exposed to both methane and ethylene. Which could constitute its greater growth. (Garner et al., 2024)
Conclusion
Overall, this project has made advancements towards proving how methanotrophs consume methane and ethylene in a peat bog permafrost thawing area. It showed that there may be methanotrophs that consume and grow on ethylene which contradicts regular biology that stated the product, epoxyethane, would only kill these methanotrophs.
Application
Future directions for this project include carrying out SIP or stable isotope probing to identify which microorganisms actively assimilate 13C ethylene. (Xiong et al., 2024) SIP works by extracting the DNA then using CsCl to ultracentrifuge. Then using gradient fractionation to calculate and extract the heavier 13C. Lastly, sequencing this DNA to now compare with PLFA and the initial sequencing. Whatever shows up on SIP will be microbes that consume methane and ethylene and tolerate epoxyethane. Whichever microbes are shown on sequencing will be consuming methane and tolerating ethylene and epoxyethane. Additionally, doing more DNA extractions and sequencing for the methane treatments and our experimental controls to better compare all methanotrophs that exist to just the ones that are also tolerating or consuming ethylene and some baseline bacterium in the samples.
Sources Of Error
A source of error could be the initial use of 120mL bottles. As stated before, these bottles made it difficult to precisely and accurately measure the amount of consumption happening in the bottles. There wasn’t enough airspace and that allowed the methanotrophs to consume everything we gave them way too quickly. In the future, immediately starting off with the 1L bottles would help to get better measurements and a more concrete answer about whether or not pre-enrichment makes a difference. Which leads to the next source of error which was the pre-enrichment step. After switching to the bigger bottles enabling us to be able to get more concrete measurements it was observed that methane consumption rate was higher in non-pre-enriched samples as opposed to pre-enriched. This gives evidence that the initial peak methane consumption for the pre-enriched samples likely occurred when in the small bottles and we missed it. So, for future improvements starting with the 1L bottles would minimize these errors.
Citations
16S and ITS rRNA Sequencing | Identify bacteria & fungi with NGS. (n.d.). https://www.illumina.com/areas-of-interest/microbiology/microbial-sequencing-methods/16s-rrna-sequencing.html Auman, A. J., Speake, C. C., & Lidstrom, M. E. (2001). NIFH sequences and nitrogen fixation in Type I and Type II methanotrophs. Applied and Environmental Microbiology, 67(9), 4009–4016. https://doi.org/10.1128/aem.67.9.4009-4016.2001 Bendtsen, A. B., Glarborg, P., & Dam-Johansen, K. (1998). Chemometric analysis of a detailed chemical reaction mechanism for methane oxidation. Chemometrics and Intelligent Laboratory Systems, 44(1–2), 353–361. https://www.sciencedirect.com/science/article/abs/pii/S0169743998001154#:\~:text=For%20methane%20oxidation%2C%20the%20global,rate%20of%20production%20(ROP). CanalDivulgación. (2014, April 20). PCR - Polymerase Chain Reaction (IQOG-CSIC) [Video]. YouTube. https://www.youtube.com/watch?v=iQsu3Kz9NYo Chiemchaisri, C., Chiemchaisri, W., Kumar, S., & Wicramarachchi, P. N. (2011). Reduction of methane emission from landfill through microbial activities in cover soil: A brief review. Critical Reviews in Environmental Science and Technology, 42(4), 412–434. https://doi.org/10.1080/10643389.2010.520233 Chowdhury, T. R., & Dick, R. P. (2013). Ecology of aerobic methanotrophs in controlling methane fluxes from wetlands. Applied Soil Ecology, 65, 8–22. https://www.sciencedirect.com/science/article/abs/pii/S0169743998001154#:\~:text=For%20methane%20oxidation%2C%20the%20global,rate%20of%20production%20(ROP) Dunfield, P. F., Yuryev, A., Senin, P., Smirnova, A. V., Stott, M. B., Hou, S., Ly, B., Saw, J. H., Zhou, Z., Ren, Y., Wang, J., Mountain, B. W., Crowe, M. A., Weatherby, T. M., Bodelier, P. L. E., Liesack, W., Feng, L., Wang, L., & Alam, M. (2007). Methane oxidation by an extremely acidophilic bacterium of the phylum Verrucomicrobia. Nature, 450(7171), 879–882. https://doi.org/10.1038/nature06411 Fisher, O. S., Kenney, G. E., Ross, M. O., Ro, S. Y., Lemma, B. E., Batelu, S., Thomas, P. M., Sosnowski, V. C., DeHart, C. J., Kelleher, N. L., Stemmler, T. L., Hoffman, B. M., & Rosenzweig, A. C. (2018). Characterization of a long overlooked copper protein from methane- and ammonia-oxidizing bacteria. Nature Communications, 9(1). https://doi.org/10.1038/s41467-018-06681-5 Frsc, D. T. P. (2024, March 12). Gas Chromatography – How a gas chromatography machine works, how to read a chromatograph and GCXGC. Analysis & Separations From Technology Networks. https://www.technologynetworks.com/analysis/articles/gas-chromatography-how-a-gas-chromatography-machine-works-how-to-read-a-chromatograph-and-gcxgc-335168 Garner, C. T., Sankaranarayanan, K., Abin, C. A., Garner, R. M., Cai, H., Lawson, P. A., & Krumholz, L. R. (2024). Methylocystis suflitae sp. nov., a novel type II methanotrophic bacterium isolated from landfill cover soil. International journal of systematic and evolutionary microbiology, 74(1), 10.1099/ijsem.0.006239. https://doi.org/10.1099/ijsem.0.006239 Gupta, N. (2019, May). DNA Extraction and Polymerase Chain Reaction. NIH. https://pmc.ncbi.nlm.nih.gov/articles/PMC6425773/ IARC Lyon France. (1994). IARC Monographs on the Evaluation of Carcinogenic Risks to Humans (Vol. 60) [Website]. World Health Organization. https://www.ncbi.nlm.nih.gov/books/NBK507450/#_p45_a_ Importance of methane | US EPA. (2025\, March 3). US EPA. https://www.epa.gov/gmi/importance-methane Microbial Insights. (2025\, February 14). Phospholipid Fatty Acid Analysis {PLFA} | Microbial Insights. https://microbe.com/plfa/#:\~:text=D.C.%20White%2C%20phospholipid%20fatty%20acid\,skin%E2%80%9D)%20of%20all%20microbes. Phartyal, S. S., Rosbakh, S., Gruber, M., & Poschlod, P. (2022). The sweet and musky scent of home: biogenic ethylene fine‐tunes seed germination in wetlands. Plant Biology, 24(2), 278–285. https://doi.org/10.1111/plb.13385 Quick Biochemistry Basics. (2019\, August 22). Gas chromatography | GC [Video]. YouTube. https://www.youtube.com/watch?v=UycPljfrnWo Ro, S. Y., & Rosenzweig, A. C. (2018). Chapter Twelve - Recent Advances in the Genetic Manipulation of Methylosinus trichosporium OB3b. Methods in Enzymology, 605, 335–349. https://www.sciencedirect.com/science/article/abs/pii/S0076687918300673 Semrau, J. D., DiSpirito, A. A., & Murrell, J. C. (2008). Life in the extreme: thermoacidophilic methanotrophy. Trends in Microbiology, 16(5), 190–193. https://www.sciencedirect.com/science/article/abs/pii/S0966842X08000826 Sheet, S. (n.d.). The methane cycle. https://gml.noaa.gov/outreach/info_activities/pdfs/CTA_the_methane_cycle.pdf Sirajuddin, S., & Rosenzweig, A. C. (2015). Enzymatic oxidation of methane. Biochemistry, 54(14), 2283–2294. https://doi.org/10.1021/acs.biochem.5b00198 Toppings, N., Marshall, M., Smirnova, A. V., Sheremet, A., Pasala, A. S., Nwosu, F. C., Hepburn, M., Lewis, I., Coleman, N. V., & Dunfield, P. F. (2024). Ethylene and epoxyethane metabolism in methanotrophic bacteria: comparative genomics and physiological studies using Methylohalobius crimeensis. Microbial Genomics, 10(10). https://doi.org/10.1099/mgen.0.001306 Xin, J., Xu, N., Ji, S., Wang, Y., & Xia, C. (2017). Epoxidation of Ethylene by Whole Cell Suspension of Methylosinus trichosporium IMV 3011. Journal of Chemistry, 2017, 1–6. https://doi.org/10.1155/2017/9191382 Xiong, Y., Mueller, R. S., Feng, S., Guo, X., & Pan, C. (2024). Proteomic stable isotope probing with an upgraded Sipros algorithm for improved identification and quantification of isotopically labeled proteins. Microbiome, 12(1). https://doi.org/10.1186/s40168-024-01866-1 Yin, C., Zhao, H., Ma, B., Chen, S., & Zhang, J. (2017). Diverse roles of ethylene in regulating agronomic traits in rice. Frontiers in Plant Science, 8. https://doi.org/10.3389/fpls.2017.01676
Acknowledgement
Thank you Dr. Peter F. Dunfield, Andriy Sheremet, and Gabriel Ramos Stella for giving me the opportunity to come into their lab! Additionally, to my parents who have supported me throughout this project. Lastly to Greg and Chenlu from the University of Waterloo for providing the PLFA Data.
We acknowledge the support of the Natural Sciences and Engineering Research Council of Canada (NSERC).
