
Developing An Artificial Pancreas Using Arduino Technology
Vasundhara Joshi
Grade 9
Presentation
Problem
The problem being addressed through this experiment is the need for more effective management of diabetes, particularly for individuals with type 1 diabetes who rely on insulin therapy. Despite advancements in technology, managing blood glucose levels can be challenging and time-consuming, leading to potential health complications if levels are not properly regulated. By developing and refining an artificial pancreas model, the goal is to create a system that can automate insulin delivery, mimicking the natural function of the pancreas, and ultimately improving the quality of life for individuals with diabetes. This project seeks to contribute to the future of healthcare by advancing the development of technologies that can alleviate the burden of diabetes management and enhance the overall well-being of affected individuals. Research shows that almost 1 in 10 Canadians aged 20 years and older has been diagnosed with diabetes. In the years leading up to the pandemic (2016 to 2019), almost 1 in 10 Canadian adults aged 20 to 79 (9%) had diabetes. With the development of an artificial pancreas, we can use advanced technology to solve medical problems for our people.
Question:
How does the implementation of Arduino technology affect the accuracy and efficiency of an artificial pancreas in regulating glucose levels?
Hypothesis:
I hypothesize that incorporating Arduino technology into the design of an artificial pancreas will result in more precise and rapid glucose regulation compared to traditional methods leading to improved overall performance in glycemic control.
Purpose:
This experiment aims to explore the functionality of an artificial pancreas system in regulating blood glucose levels. By creating a simplified model using an Arduino microcontroller and electronic circuitry, the experiment aims to mimic the pancreas's natural function of insulin regulation. Through this simulation, the project seeks to understand how effectively insulin delivery can be automated in response to changes in blood glucose levels, thereby potentially contributing to advancements in diabetes management technology.
Method
Materials:
Science Buddies Electronics Kit for Arduino, available on their website.
You will need these items from the kit:
- Arduino-compatible microcontroller board
- USB cable
- Breadboard
- Jumper wires
You will also need to gather these items, not included in the kit:
1. 5V peristaltic liquid pump (note: a 12V version of this pump is also available, but it requires an external power supply. The 5V version can be powered directly from your Arduino.)
2. N-channel MOSFET
3. 100 kΩ resistor
4. Alligator clip leads
5. Recommended: multimeter
6. Bowls or food storage containers (2)
7. Aluminum foil
8. Tape
9. Corks or packing foam
10. Toothpick
11. Tap water
12. Distilled water
13. Optional: food coloring
14. Dish towels or paper towels
15. Fine-tipped permanent marker
16. Computer with:
- Access to the Arduino IDE (either installed local version or web-based editor).
- USB port
Procedure:
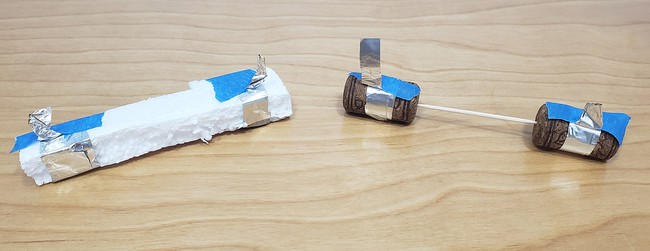
- Build your conductivity sensor using two strips of aluminum foil and a piece (or pieces) of floating material. There are several options to build one (Figure 4). Make sure the sensor fits in the container you will use for water (Figure 5).
- The general idea is that it should have two strips of aluminum foil, spaced apart by several inches, so they will sit at opposite ends of your water container.
- The sensor should float so that the amount of submerged surface area on the aluminum foil stays constant while you add water (the amount of submerged surface area will affect the conductivity reading).
- You will need to grab onto each piece of aluminum foil with an alligator clip, so make sure you leave part of each piece sticking up.
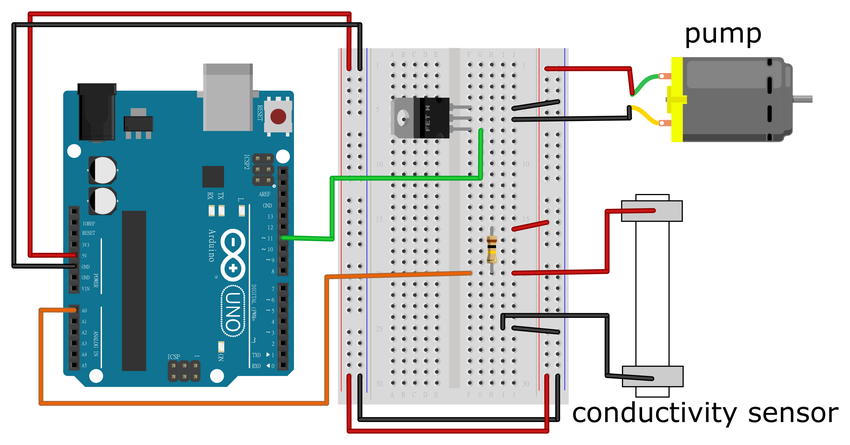
- Build the circuit. Do not connect your Arduino to the USB cable yet. This will ensure that your circuit remains powered down while you build it.
- Connect 5V on your Arduino to the power (+) bus on your breadboard.
- Connect the left and right power buses to each other.
- Connect GND on the Arduino to the ground (-) bus on your breadboard.
- Connect the left and right ground buses to each other.
- Put the MOSFET in the breadboard with the large metal tab facing to the left, and the writing on the front facing to the right. Each pin on the MOSFET should be in a different row of the breadboard.
- Connect the MOSFET's first pin on the left (when the writing is facing you, so the bottom-most pin in Figure 6) to Arduino digital pin 11.
- Connect the MOSFET's third pin to the ground bus.
- Put the 100 kΩ resistor into two different rows on the breadboard. Connect one end of the resistor to the power bus. Connect the other end to Arduino analog input pin A0.
- Use jumper wires and alligator clips to connect your conductivity sensor. Connect one end of the sensor to the same end of the resistor that is connected to pin A0. Connect the other end to the ground bus.
- Use jumper wires and alligator clips to connect the pump. Connect the tab labeled with a "+" to the power bus. Connect the other tab to the middle pin of the MOSFET.
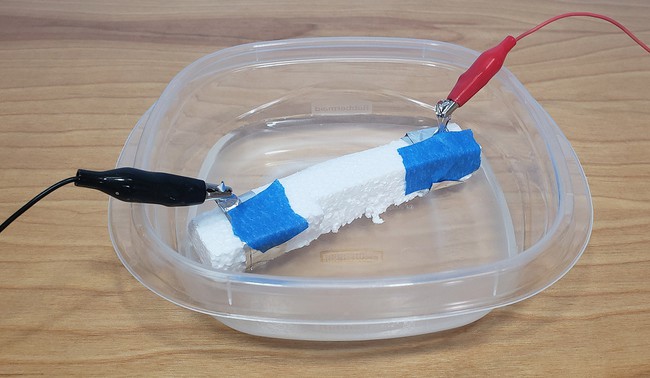
- Before you continue, you will need to calibrate your conductivity sensor. Fill one of your containers about halfway with distilled water. Place your conductivity sensor in the container. Make sure it floats. You may need to adjust the alligator clips.
- Temporarily disconnect one alligator clip from the pump so it does not turn on during the calibration process.
- Plug one end of the USB cable into your Arduino and the other end into your computer. This will power up the Arduino and provide power to your circuit. There are two different ways to take the calibration reading. Using a multimeter is not required, but it can be more convenient since you do not need to use a computer.
- If you have a multimeter available, set it to measure DC voltage and connect it to the circuit as shown in Figure 7.
- Connect the multimeter's black probe to the ground bus and connect the red probe to the breadboard row that is connected to Arduino pin A0.
- Record the voltage reading. Convert it to an equivalent analogRead value by dividing it by 5, then multiplying by 1023 and rounding (for example, if your reading is 4 volts, the value would be 4/5×1023 = 818.4, which rounds to 818).
- If you do not have a multimeter available, download the calibration code to your computer. Then upload it to your Arduino. In the Arduino IDE, select Tools→Serial Monitor. The code will print out the analogRead value from the conductivity sensor. The value might fluctuate slightly. This is OK. Record the average value over a few seconds.
- Fill your other container about halfway with tap water. Optionally, add a few drops of food coloring to make it easier to distinguish from the distilled water. Remove your conductivity sensor from the container with distilled water, dry it off with a towel, place it in the tap water, and the calibration procedure in step 5.
- The values you recorded in steps 5 and 6 are the maximum and minimum "blood sugar" values in your model. This can be a voltage (between 0 and 5 volts) or a number between 0 and 1023 (from the analogRead) function. To be clear, your Arduino code will use the number between 0 and 1023, not a number between 0 and 5, so if you measured a voltage, you need to convert it to the 0 1023 range as described in step 5. The "high" value corresponds to pure distilled water, and the "low" value corresponds to pure tap water. When you mix tap water and distilled water, you will get a number somewhere in between those two values. Your goal is to start the conductivity sensor out in a container of pure distilled water (which represents high blood glucose). Your code will measure the voltage from the conductivity sensor and automatically turn on the pump to start adding tap water to the container (to simulate adding insulin). This will cause the voltage to start dropping. When the voltage drops below a certain threshold that you define, the code will automatically turn the pump off. This models the behavior of an artificial pancreas, which would monitor blood glucose levels and apply insulin until glucose levels dropped (or were predicted to drop) to an acceptable level. Remember that your system is a model and responds to changes very quickly (within a few seconds), whereas changes in blood glucose levels can take much longer.
- Before you continue, you need to make sure you know which way water flows in your pump. Place both ends of the pump's tubing in the container with distilled water. Use alligator clips and jumper wires to connect the pump's electrical tabs directly to 5V (+) and GND (-) on your breadboard (the tab labeled "+" on the pump should go to 5V). This will turn the pump on. One at a time, carefully lift each of the pump's tubes out of the water. Watch closely to observe the direction of water flow (which tube has water dripping out of it?). Use a marker to draw arrows in the direction of water flow for each tube (Figure 8). Note that if you reverse the connections between 5V and GND, water will flow in the opposite direction. When you are done, disconnect the pump's negative wire from the GND pin.
- Leave the pump's outlet tube in the container of distilled water and place the inlet tube in the container of tap water.
- Remove the conductivity sensor from the container of tap water, rinse it off with some distilled water, and put it back in the container of distilled water.
- Download the code. Remember that this should be between the minimum and maximum values you recorded earlier (using the 0–1023 scale, not the 0–5 voltage scale). For example, if you recorded a minimum value of 200 and a maximum value of 800, you could set the threshold for the pump to turn off at 300. Upload the code to your Arduino and make sure you have the serial monitor open.
- Reconnect the pump's negative wire to the middle pin of the MOSFET on the breadboard. The pump should start right away, pumping tap water into the container with distilled water (Figure 9). As it pumps, use the pump's outlet tube to gently stir the distilled water container. This will help evenly distribute the tap water throughout the container. Watch the output on the serial monitor, and/or your multimeter reading if you have it connected.
- Does the pump turn off once the value reaches your defined threshold?
- Does the value keep changing after the pump turns off?
- If your pump does not turn on at all, unplug the USB cable from your Arduino. Double-check your wiring, especially the connections to the MOSFET, since it controls the pump.
- If your pump never turns off, unplug the USB cable from your Arduino.
- Double-check your wiring, especially the connections between the resistor, conductivity sensor, and analog input pin.
- Make sure the value you chose for the "threshold" value makes sense, as described in step 9.
Figure 9. The experimental setup, with the pump arranged to pump tap water into the container of distilled water.- Continue to stir the water for a minute or so after the pump turns off. Once you are confident the pump is staying off, disconnect the USB cable from your Arduino. This will stop it from printing data to the serial monitor.
- (Note: the instructions in this step are for a Windows computer. You will need to figure out how to do it if you are using another operating system). Click in the serial monitor and press CTRL+A to select all of the data. Press CTRL+C to copy it, and then open a .txt file in a program like Notepad and paste the data in. Save this file.
- You will need to import your data into a spreadsheet program like Microsoft Excel® or Google Sheets®. Most spreadsheet programs can import text files and split the data into different columns. For example, Excel can import text files using a "delimiter," a special character (like a tab or a space), to indicate a new column. Import your data so you have the time in one column and the analog reading in a separate column.
- Make a graph of your sensor reading (y axis) vs time (x axis).
- How quickly does your sensor reading reach the threshold value after the pump initially turns on?
- Does the sensor reading overshoot, or go past, the threshold value?
- Where does the sensor reading eventually stabilize?
- Now it is time to apply the engineering design process and iterate to improve your model. Look at the Arduino code and think of ways to improve it. How can you get to the threshold value quickly without overshooting too much? This is an open-ended problem. Here are some suggestions to get you started.
- You can control the pump's speed using the analogWrite command. analogWrite accepts a value between 0–255 that corresponds to the pump's speed (e.g., 0 is off, 127 is about half-speed, and 255 is full-speed). What happens if you run the pump at a lower speed?
- You could try a different type of feedback control instead of basic on/off control. For example, instead of running it a constant speed, a proportional controller changes the pump's speed based on the measurement error, or the difference between the target sensor reading and the actual sensor reading. In other words, when the error is large (the actual reading is very far away from the target reading), the pump will run faster. As the error gets smaller, the pump will start to slow down.
- Advanced students can look up other types of control like proportional-integral-derivative (PID) control, which involves more advanced mathematical functions and calculus.
- Try editing the Arduino code, re-uploading it, and testing your model again. In between tests, rinse and dry your containers and conductivity sensor. You should start out with fresh distilled water each time.
- Compare your new graph of voltage vs. time to your previous graph. It may help to plot them on the same axes, with the x-values shifted if needed
Analysis
In this study, voltage readings obtained from an artificial pancreas system developed using Arduino technology were analyzed to simulate blood glucose regulation. The system, representing the physiological function of the human pancreas, employed distilled water to mimic blood with high resistance and tap water to emulate insulin with low resistance. The voltage measurements, collected via a multimeter, served as proxies for blood glucose levels. Consistently higher voltage readings observed in distilled water compared to tap water indicated differences in electrical conductivity between the two solutions. These distinctions mirrored the respective impedance characteristics of blood and insulin, with elevated voltage readings suggesting increased resistance akin to elevated blood glucose levels and lower readings corresponding to enhanced conductivity resembling higher insulin presence and decreased blood glucose levels. Fluctuations in voltage readings potentially reflected dynamic changes in simulated blood glucose levels, offering insights into the system's ability to regulate glucose. This analysis highlights the potential of Arduino-based systems in simulating complex physiological processes and underscores their utility in biomedical research and diabetes management. Further refinement and validation of such systems could lead to innovative solutions for personalized healthcare and improved patient outcomes. The whole point of this experiment was to use Arduino technology to figure out how to create a system where the water pumps automatically and stops when it reaches at a certain level. I will keep advancing and adding improvements to make it achieve this goal!
Conclusion
So let me restate my question and hypothesis:
My questions for this project were, how does the implementation of Arduino technology affect the accuracy and efficiency of an artificial pancreas in regulating glucose levels? My research, experiment, and testing provided and supported my hypothesis that incorporating Arduino technology into the design of an artificial pancreas will result in more precise and rapid glucose regulation compared to traditional methods leading to improved overall performance in glycemic control.
In conclusion, the utilization of Arduino technology in the development of an artificial pancreas system demonstrates promising potential in advancing glycemic control for individuals with diabetes. Through the simulation of blood glucose regulation and automated insulin delivery, this experiment sheds light on the feasibility of employing electronic circuitry and microcontrollers to mimic the physiological function of the pancreas. The analysis of voltage readings, serving as proxies for blood glucose levels, provides valuable insights into the system's ability to respond dynamically to changes in glucose concentrations, thereby enhancing our understanding of diabetes management technology.
The Arduino-based system offers the flexibility to incorporate advanced features such as real-time monitoring and adaptive algorithms, enhancing the system's ability to regulate glucose levels with precision. The implementation of Arduino technology enhances the accuracy and efficiency of an artificial pancreas in regulating glucose levels, aligning with the hypothesis and suggesting promising advancements in diabetes management technology.
Citations
- https://www.cdc.gov/diabetes/basics/diabetes.html#:~:text=With%20diabetes%2C%20your%20body%20doesn,vision%20loss%2C%20and%20kidney%20disease.
- https://www.mayoclinic.org/diseases-conditions/diabetes/symptoms-causes/syc-20371444
- https://www.cdc.gov/diabetes/basics/index.html
- https://www.nih.gov/news-events/news-releases/bionic-pancreas-improves-type-1-diabetes-management-compared-standard-insulin-delivery-methods
- https://www.utsouthwestern.edu/newsroom/articles/year-2022/october-bionic-pancreas.html
- https://www.niddk.nih.gov/health-information/diabetes/overview/what-is-diabetes
- https://www.homesciencetools.com/product/science-buddies-electronics-kit-for-arduino/?aff=SB1
Acknowledgement
I want to acknowledge my science teacher, and my program coordinator, Mr.Neil, who supported me with this project! I would also like to acknowledge Active Technology, which provided the materials and guidance for my project!