Pen-embedded sensor-based positioning system for note digitization
Grade 11
Presentation
Problem
1. Introduction
In a digital world, pen-and-paper writing has become increasingly less popular. However, research indicates that traditional longhand writing offers significant advantages over typing, particularly in memory retention [1].
This project seeks to bridge the gap between digital convenience and the cognitive benefits of handwriting by developing a pen that digitizes writings without external components like a screen or encoded notebook as seen in other smart pens [2]. The rationale for eliminating external components is to enhance user practicality and accessibility, encouraging widespread adoption and usage.
2. Research Question and Hypothesis
How can a pen without external components effectively digitize handwritten notes?
It is hypothesized that the synergy of low-cost sensors embedded in a pen along with data processing carried out by open-source and ad hoc algorithms can ensure a digital replica of handwriting on a drafting page without external components.
Method
3. Design and Methodology
3.1 Hardware
To accurately compute and process the position of the pen’s tip, the pen is equipped with the following instrumentation (Figure 1): camera, digital gyroscope, optical mouse sensor, microcontroller, battery, charging port, and wires. Note that this configuration represents a theoretical design assuming no manufacturing constraints.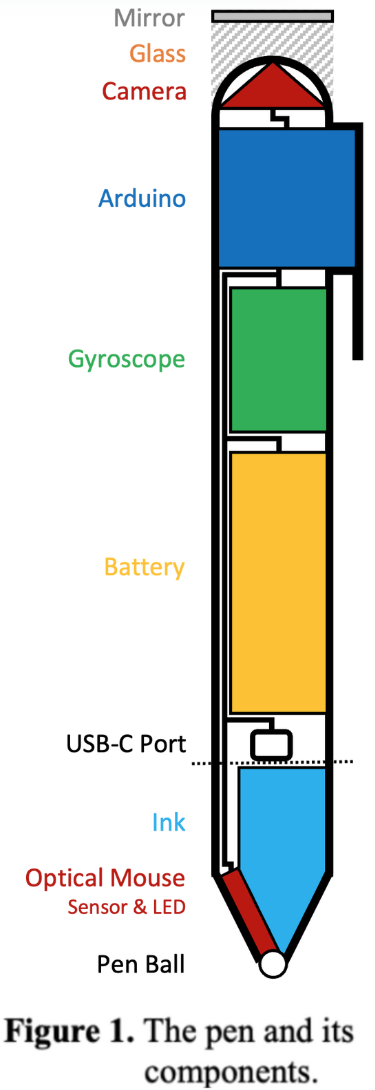
The camera is mounted at the top end of the pen. The orientation of the camera is parallel to the pen’s axis ensuring that images captured will project the pen’s tip at the central pixel. To facilitate the camera’s power supply without obscuring the scene with wires, the camera will face up, and a mirror integrated into the camera's lens at the top of the pen will reproject the drafting page onto the camera. Images will be corrected for distortions introduced by the camera’s lens (tangential and radial) [3]. The corresponding distortion coefficients will be derived after processing images of a checkerboard grid during a one-time camera configuration. These coefficients will then be used to autocorrect all future images taken by the camera.
The digital gyroscope is integrated into the body of the pen to calculate its three-dimensional orientation, specifically measuring the angular deviation of the pen's axis from the normal vector of the drafting page. Gyroscope calibration takes place during the pen's initialization phase, as outlined in Section 3.2.1.
The optical mouse sensor is mounted at the bottom end of the pen facing the ball. Its role is to accurately trace the movement of the pen’s tip, while in writing mode.
Data collected by the above sensors will be transmitted to the microcontroller through a network of wires. The microcontroller is integrated into the body of the pen and its role is to process all input data, calculate the instant locations of the pen’s tip, digitally encode the written scripts, and transmit the digital replicas to an external computer device via Bluetooth communication.
The pen’s battery will provide the sensors and microcontroller with power. The battery will be recharged through a designated charging port. The ink cartridge and charging port will be accessible by detaching the bottom end of the pen, along the dotted line in Figure 1.
3.2 Software
As shown in Figure 2, a sequence of software modules is carried out in the following order to create the digital replica of the handwriting: initialization of the pen, positioning of the pen’s top (camera’s center point), positioning of the pen’s tip, tracking of the mouse cursor’s movement (while in writing mode), and digitization of written scripts. After the initialization phase, an iterative process alternates between two consecutive states of the pen: down (writing mode starts) and up (writing mode pauses). The following subsections describe the software modules in more detail.
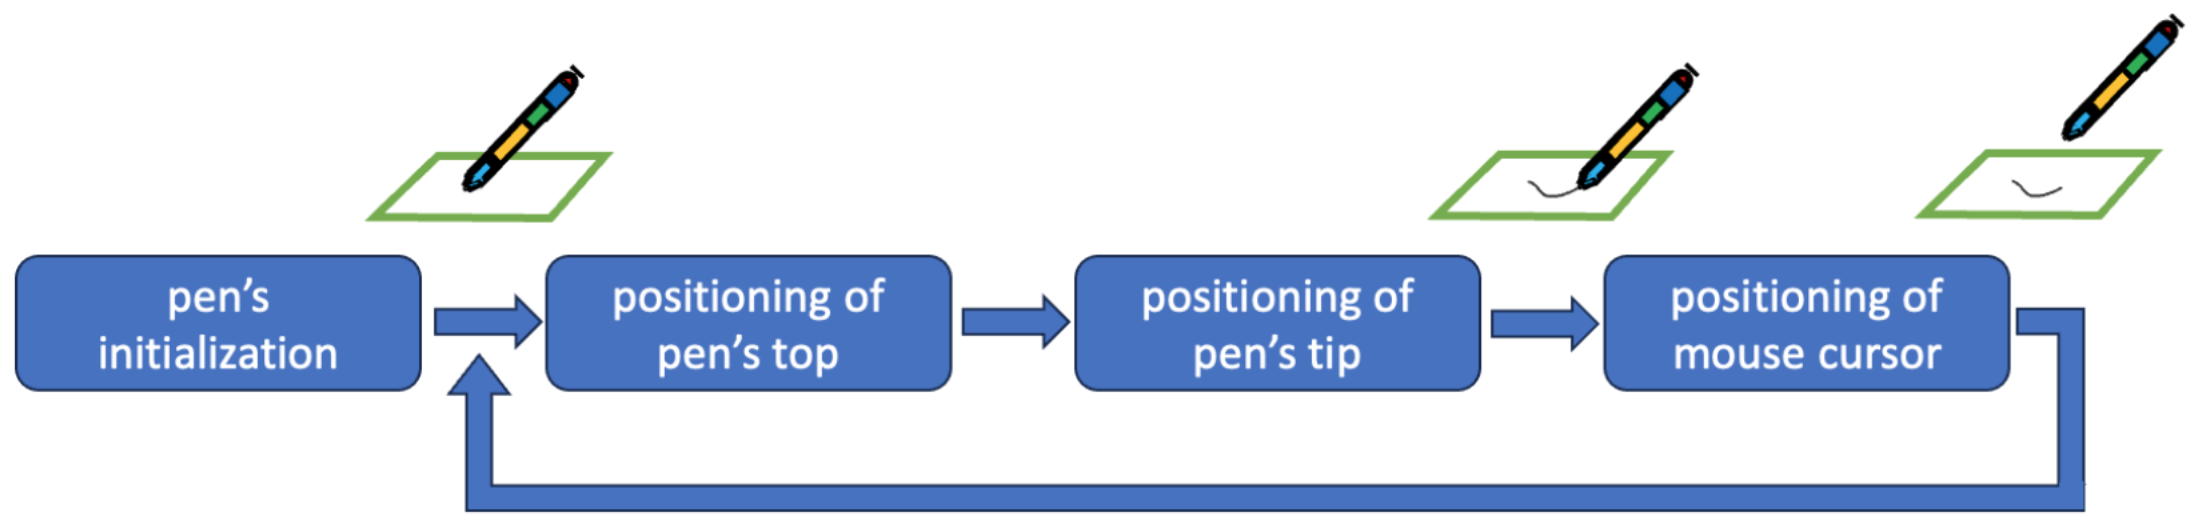
Figure 2. The sequence of modules and the iterative process for pen digitization.
3.2.1 Initialization of the pen
The initialization phase is carried out in two steps to calibrate the pen’s sensors and capture the drafting page’s properties, respectively.
The calibration of the gyroscope is carried out in the first step, as shown in Figure 3a. By aligning the pen with the relative left or right edges on the drafting page, the reference plane for the gyroscope (and the corresponding normal vector of the drafting page) can be calculated. The camera will also collect sample color signatures to identify the color range of the drafting page. This color range will be used as an input parameter to facilitate the image segmentation process, as explained in Section 3.2.2.
The second step of the initialization phase calculates the dimensions of the drafting page, i.e., the size of the short and long edges. By placing the pen on the page so that the camera has visibility to at least three corner points, as shown in Figure 3b, the page’s dimensions can be calculated. The calculations are described in Section 3.2.2, as they are relevant to those applied for positioning of the pen’s tip. However, this method is not recommended as errors in measuring the page dimensions can affect the accuracy of subsequent calculations for positioning the pen’s top. Instead, users are advised to manually input the true dimensions of the page whenever possible.
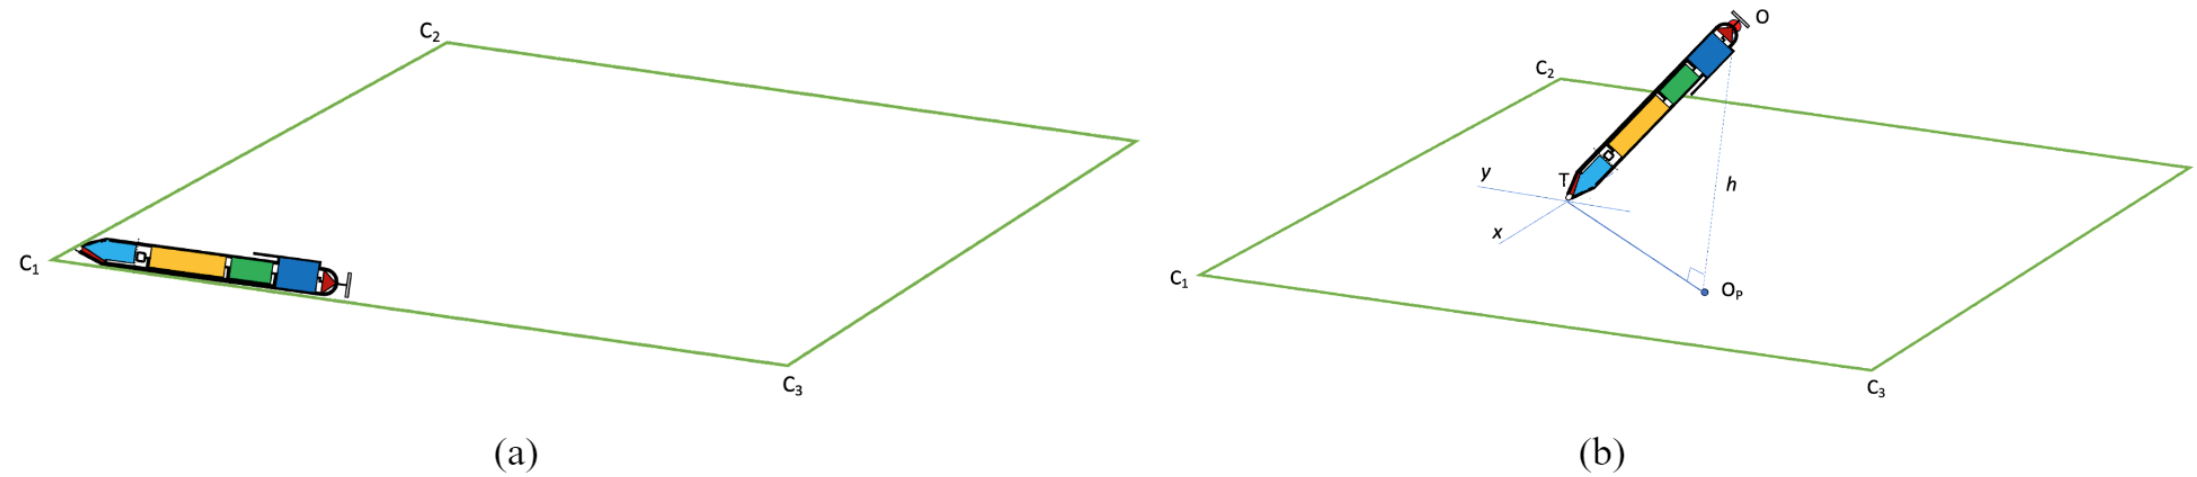
Figure 3. Initialization of the pen: (a) step 1, and (b) step 2.
3.2.2 Positioning of the pen’s top
The camera will capture wide-angle images, which can be processed to determine the position of the pen’s top (camera’s center point) using the corner points of the drafting page.
First, a color segmentation method will be applied to separate the drafting page from the image background. For this task, a well-established algorithm known as Random Walker segmentation [4], available in the OpenCV Python library [5], will be adopted. The color range of the drafting page (captured at the initialization phase; Section 3.2.1) will serve as an input parameter for this algorithm to ensure more accurate segmentation.
Next, a conventional corner detection algorithm, known as Harris Corner Detection [6], also available in the OpenCV Python library [5], will be applied. This algorithm will identify the location of the page’s corner points on the image.
Given a camera with focal length f positioned at a height h from the drafting page, pointing perpendicular to point OP, the three corner points C1, C2, and C3 of the page will be projected onto points C’1, C’2, and C’3 in the image, as illustrated in Figure 4a. The formulas in Figure 4b, derived from similar triangles (OOPC1 and OO’C’1) and (OOPC2 and OO’C’2) associate the page dimensions with the corresponding image projections. By measuring the lengths of these projections in the image, the dimensions of the page can be calculated.

Figure 4. Geometry for a perpendicular pen (h equals the pen’s length).
In general, the pen’s axis is not perpendicular to the drafting page [7]. To calculate the position of the pen’s top, the tilted image needs to be rectified so that the formulas in Figure 4b are still valid. The image rectification involves a projective transformation based on the pen’s tilt and rotation angles calculated by the gyroscope. A common image rectification algorithm, known as Warp Perspective Transformation [8], also available in the OpenCV Python library [5], can be applied to rectify the image’s geometry. Figure 5a shows the initial orientation, the direction of the pen, and the image captured by the camera (represented with a small circle and triangle). Figure 5b shows the rectified image as a result of three angular corrections that turn the pen’s axis perpendicular to the drafting page.
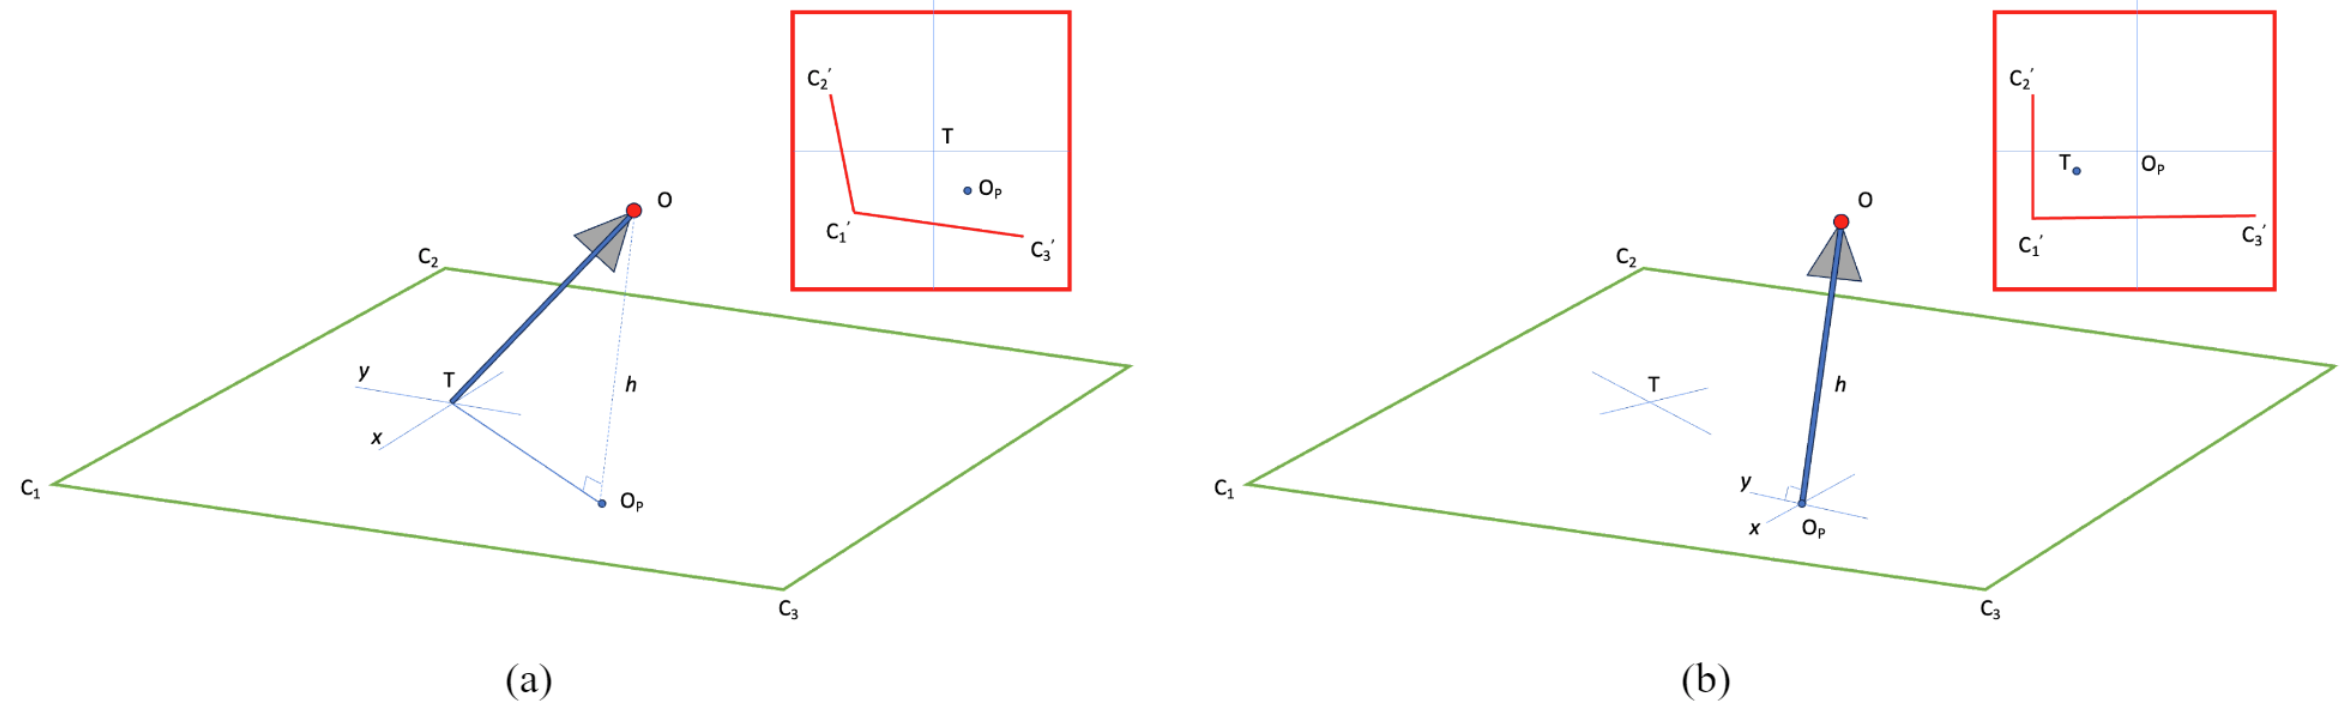
Figure 5. Rectification of the image by turning the pen’s axis perpendicular to the drafting page.
Figure 6a shows the geometry of a page with its three corner points C1, C2, and C3 projected as C’1, C’2, and C’3 onto the rectified image. The formulas in Figure 6b calculate the coordinates of the pen’s top as a function of the short dimension (d) of the drafting page. Notice that these computations require the camera to capture only two corner points of the drafting page. The measurements of the gyroscope can be used to identify which pair of corner points (and corresponding dimension; short or long) are depicted in the image.
The calculation of the drafting page dimensions can be carried out at the initialization phase and by applying the same configuration and formulas. From the similar triangles in Figure 4a the short dimension C1C2 is given by the formula: C1C2 = C’1C’2 h / f, where h represents the actual offset of the camera from the page and can be extracted by rearranging the formulas in Figure 6. Similarly, the long dimension C1C3 can be calculated. To calculate both the short and long dimensions of the drafting page, at least three corner points must be captured from the camera at the initialization phase.

Figure 6. Calculation of the pen’s top coordinates from the rectified image.
3.2.3 Positioning of the pen’s tip
Given the projection of the camera’s center (pen’s top) on the drafting page OP(xo,yo), the adjusted rotation angle provided by the gyroscope φx, and the adjusted tilt angle φz as shown in Figure 7a, the coordinates of the pen’s tip T(xT,yT) can be calculated using the formulas in Figure 7b.
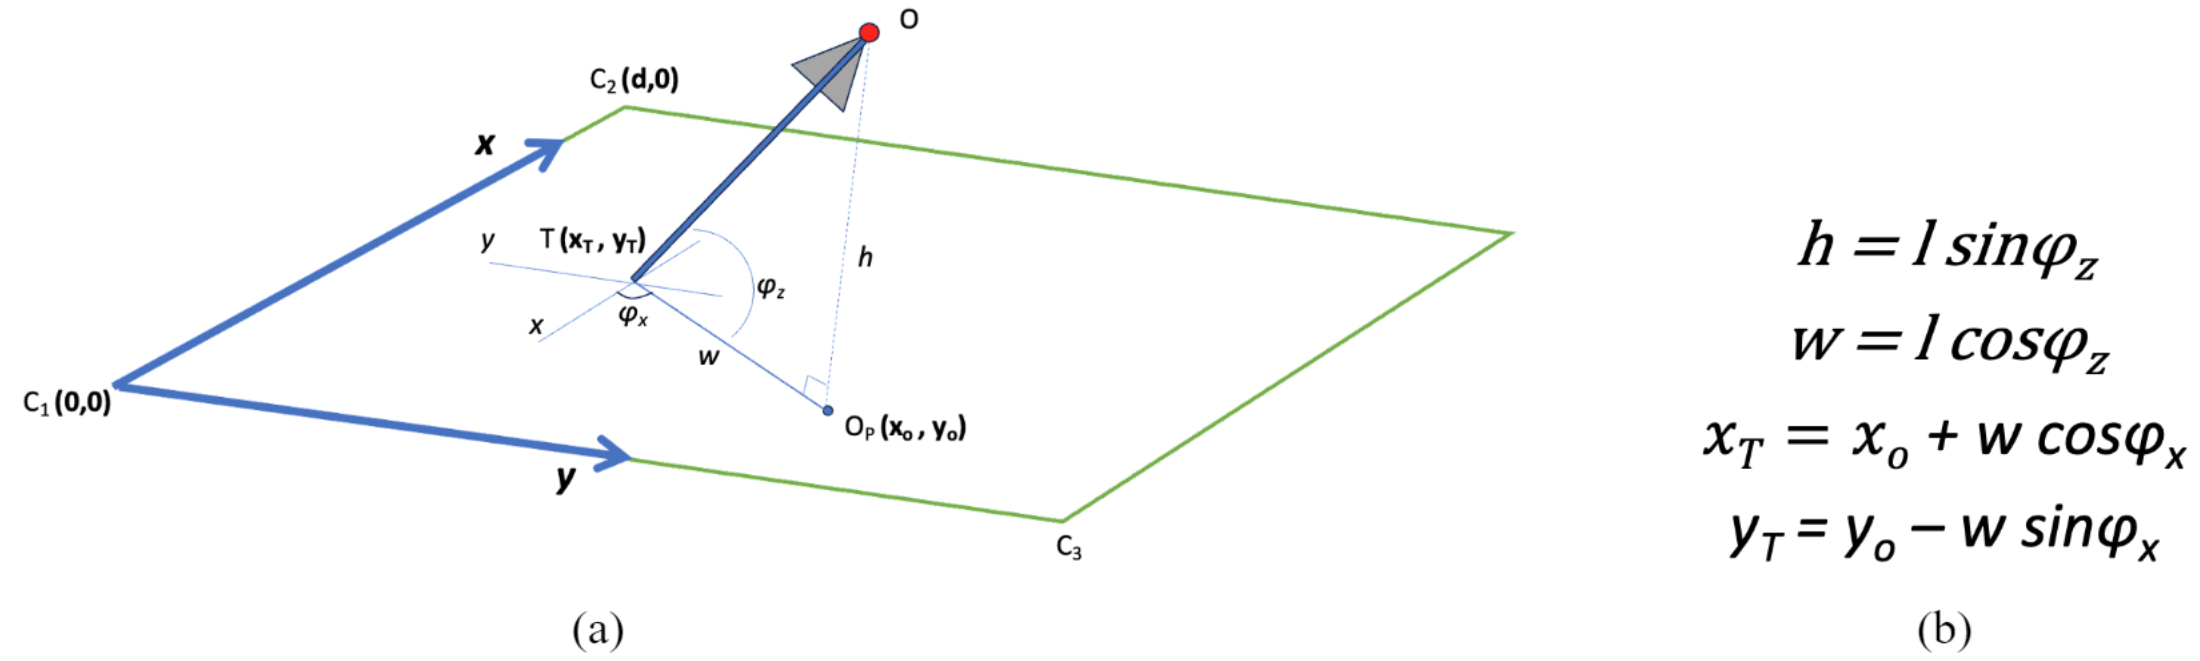
Figure 7. Calculation of the pen’s tip coordinates.
3.2.4 Tracking of the mouse cursor movement and digitization of written scripts
When the pen is in writing mode, the pen's ball rotates through friction, releasing ink from the cartridge. This rotation is detected by the optical mouse sensor which traces the position of the pen’s tip and synchronously transmits this data to the microcontroller for further processing.
To translate the mouse cursor to actual distances on the transcription, both the physical size of the drafting page and the mouse sensor’s resolution are required [9]. A designated software program running on the microcontroller will carry out the corresponding calculations. These calculations combined with other sensor data will position written elements onto the exact location in the digital replica of the script.
3.2.5 Image processing
To accurately detect corners on a drafting page, the image captured by the camera must be processed following the steps presented in Figure 8. The implementation includes a Python notebook (see the attached file) developed in Google Colab that consists of a sequence of modules to carry out these steps as explained in the next sections. Note: The image used in this process was captured using an iPhone 14 Pro and downscaled to HD resolution (1280x720 pixels) for faster processing and reduced noise.
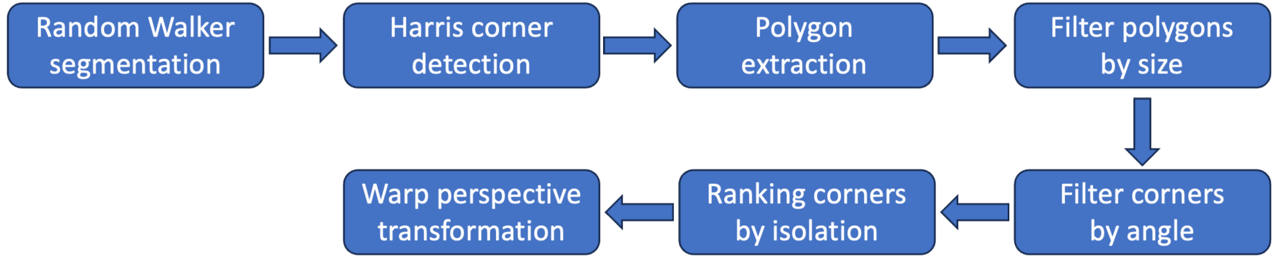
Figure 8. The image processing steps.
3.2.5.1 Random Walker Segmentation
As described in Section 3.2.2 the random walker segmentation algorithm will first be applied to separate the drafting page from the image background or foreground by extracting all areas of the image with a color similar to the drafting page (e.g., white color) as identified in the initialization phase (see Section 3.2.1). Figure 9 presents the result of this step for an example image.
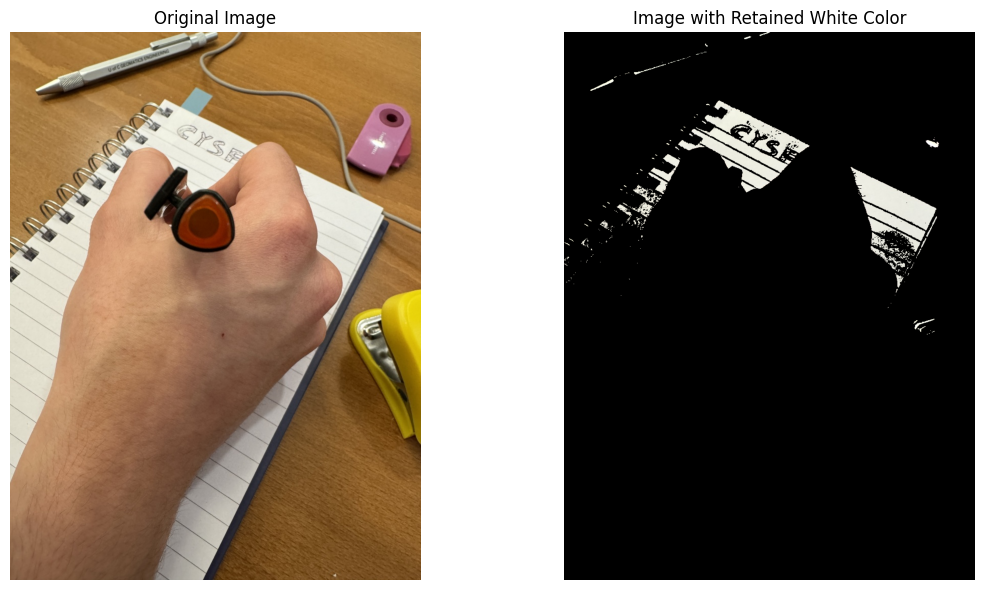
Figure 9. Example of the image segmentation to extract all areas of the image in the RGB range [220|220|220, 255|255|255].
3.2.5.2 Harris corner detection
This step will identify the location of the page’s corner points for all areas on the image separated in the previous step. This will be accomplished by applying the Harris corner detection algorithm (see Section 3.2.2). Figure 10 presents the outcome of this algorithm for the segmented image in Figure 9.
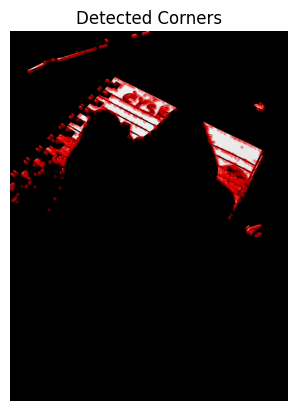
Figure 10. An example of the corner detection for the segmented image in Figure 9. All corners have been colored in red dots (number of detected corners: 21,819).
3.2.5.3 Polygon extraction
This step will further process the segmented image to extract contour lines (i.e., segments) that form polygons enclosing the extracted areas (Section 3.2.5.2). This step will be accomplished using an existing function available in the OpenCV library. Given the complexity of the geometry, the number of contours will be very high as shown in Figure 11.
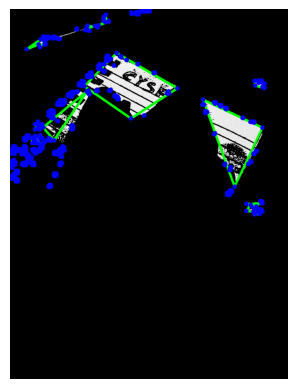
Figure 11. Extraction of polygons from the segmented image in Figure 9. The blue dots show the corner points and the green lines (wherever visible) show the polygon outlines (contours).
3.2.5.4 Filter corners by polygon size
This step will minimize the noise by filtering the vertices (corners) for all tiny polygons generated in the previous step. This is accomplished by calculating the area of all polygons generated in the previous step and eliminating those polygons (and their corner points) with an area smaller than a threshold area value. Figure 12 shows the result of this step for the polygons in Figure 11.
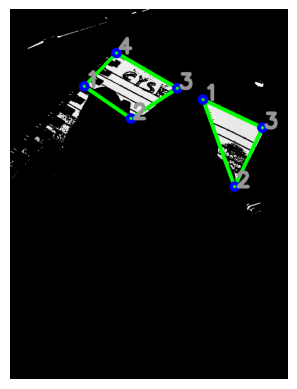
Figure 12. Filtering the corners for all polygons in Figure 11 with an area smaller than 100 sq pixel size. This results in two polygons delimited by 3 and 4 vertices.
3.2.5.5 Filter corners by angle
As the edges are expected to meet at the corner point of the page in a right angle, those corner points of the polygons generated in the previous step with an acute or obtuse angle will be irrelevant and can be eliminated. Figure 13 shows how the corner points in Figure 12 can be filtered by angle.
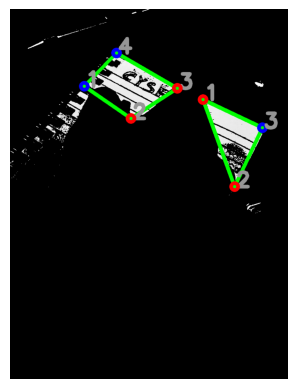
Figure 13. The corner points in Figure 12 with an angle outside the range [70-110] degrees have been colored red.
3.2.5.6 Ranking corners by isolation
There are corner points that meet the angle condition in the previous step without being located at a page corner. An example is point 1 at the left polygon in Figure 13. To eliminate these points, their vicinity will be tested against the corner points generated by the Harris corner detection (Section 3.2.5.2). Corners located in non-page corner positions always have more noise (i.e., points generated by the Harris corner detection) in their vicinity, due to the higher complexity of local geometry. Based on this observation, all eligible (blue) corner points as filtered in the previous step, will be ranked in the reverse order based on their local level of noise. The level of noise corresponds to the total number of the points detected by the Harris algorithm (shown in Figure 10) falling within a range of 5 pixels along x and y axis around each eligible (blue) point. The top two corner points, i.e., those with the least noise in their vicinity will represent the page corners. Figure 14 shows the two most isolated corners for those (blue) corners generated in Figure 13. These corners will be used as a reference to compute the location of the pen’s tip (see Section 3.2.3).
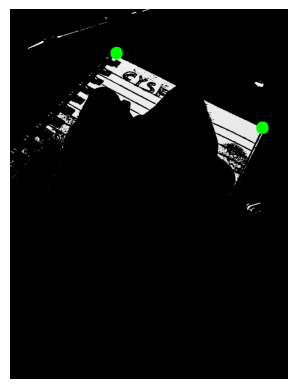
Figure 14. The two page corners as identified by ranking the blue points in Figure 13 (colored as green dots).
3.2.5.7 Warp perspective transformation
The last step of the image processing involves the geometric rectification of the tilted image to the vertical. For this step, a Warp perspective transformation will be applied (see Section 3.2.2). Given the three-dimensional rotation parameters of the camera as calculated by the embedded gyroscope, an algorithm from the OpenCV library will be used to implement the rectification (Figure 15).
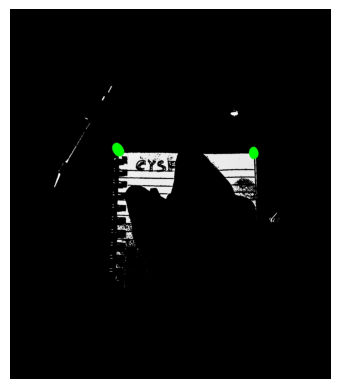
Figure 15. The result of the Warp perspective transformation of the image in Figure 14. The 3D rotation parameters around the axes x, y, and z were reported by the gyroscope as: (25, 3, -31) (in degrees).
4. Implementation
Transitioning from theoretical design to practical application is a crucial step toward improved precision and functionality of the device. To facilitate this transition, I acquired the Arduino Nicla Vision ABX00052 [10] (with an embedded camera and 3-axis gyroscope). In the subsequent sections, I will present the processes and algorithms developed for the prototype.
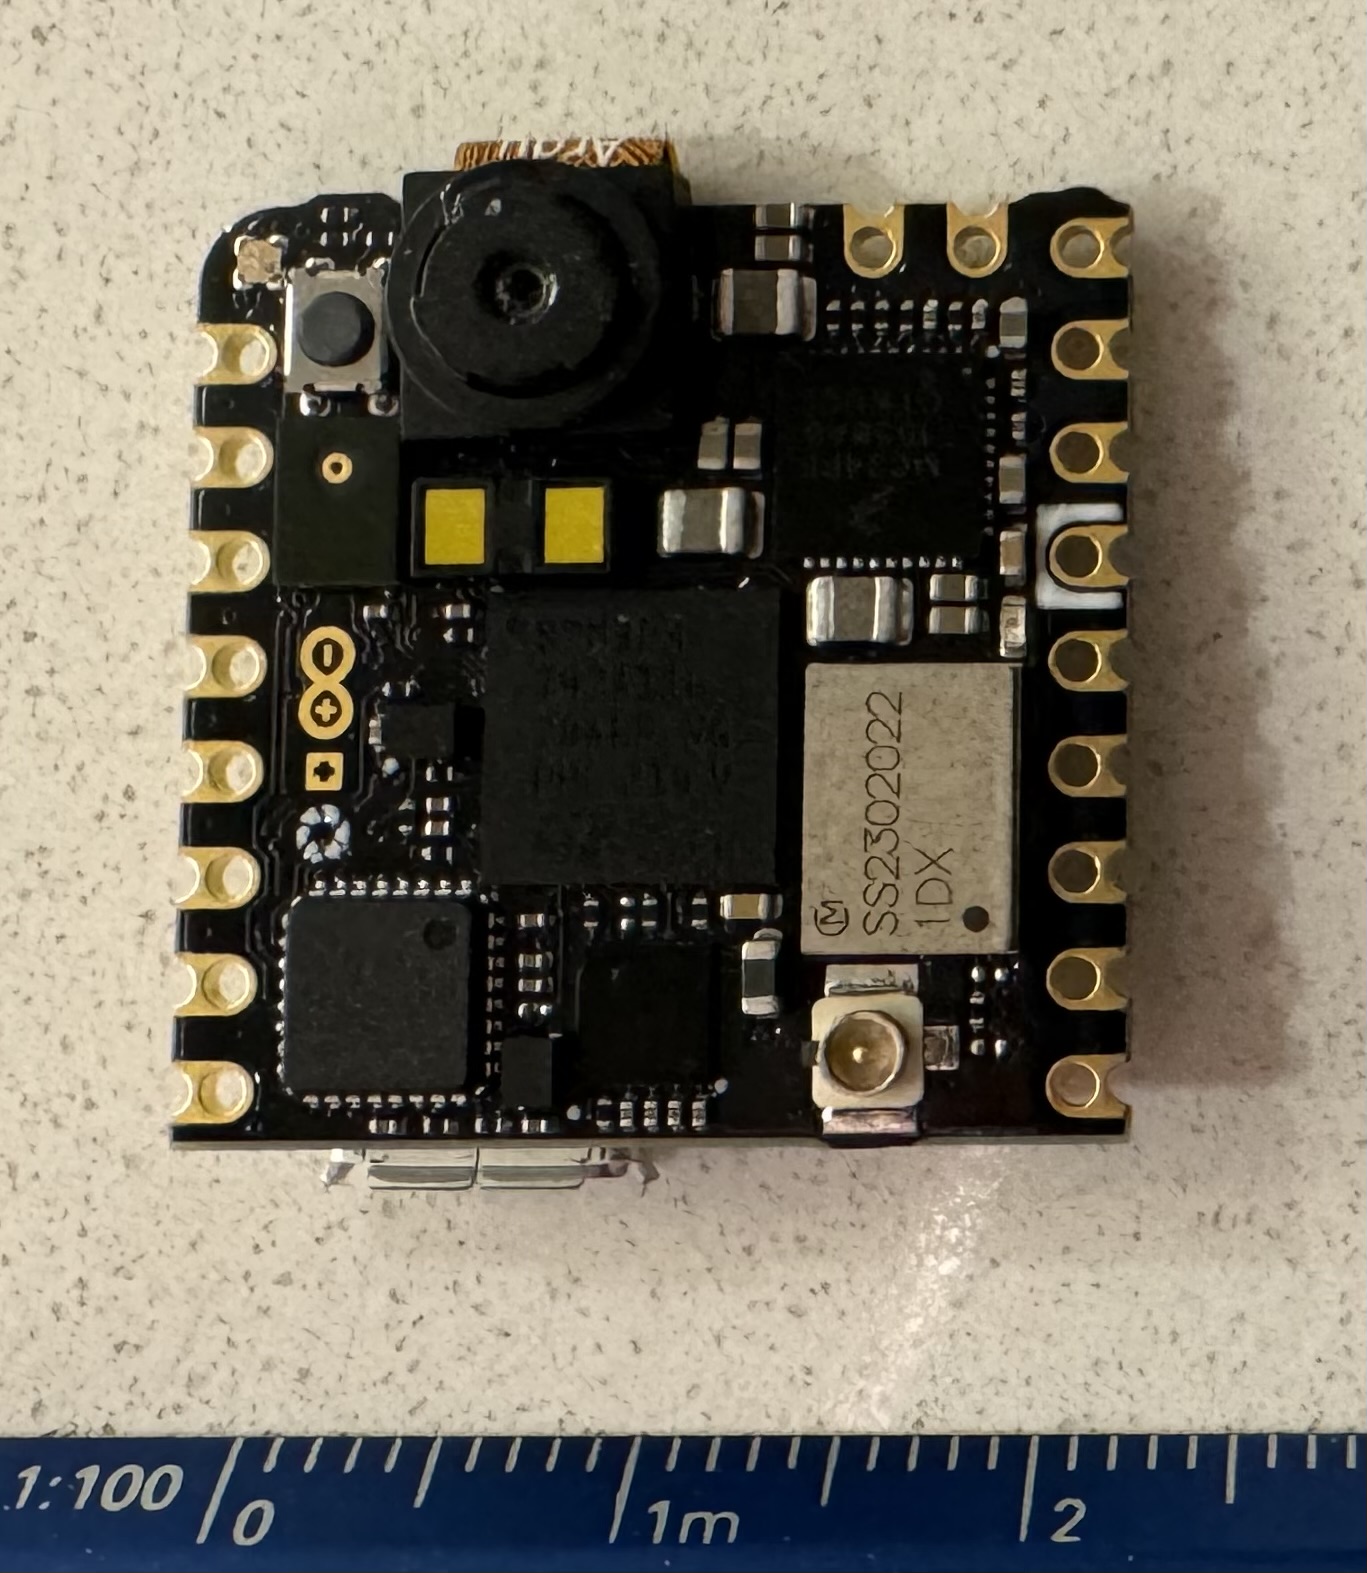
Figure 16. The Arduino NIcla Vision
4.1 Testing gyroscope accuracy and drift
A gyroscope measures angular velocity rather than directly measuring angles. By integrating angular velocity data over time, one can determine the angular displacement. Accurately measuring the gyroscope's precision using manual methods, such as a protractor, introduces a significant margin of error. Therefore, this experiment will not focus on the immediate accuracy of angular displacement measurements but will instead assess the long-term drift of the Arduino Nicla Vision’s 3-axis gyroscope (specifically, the LSM6DSOXTR model from STMicroelectronics). This will provide insight into the gyroscope's stability and reliability to ensure that the gyroscope's readings accurately depict the pen's orientation throughout its operation.
Materials:
- Arduino Nicla Vision with the LSM6DSOXTR 3-axis gyroscope
- Computer with OpenMV [12] installed (where I will collect and record data from the Arduino)
- Thermometer (to ensure a consistent temperature testing environment)
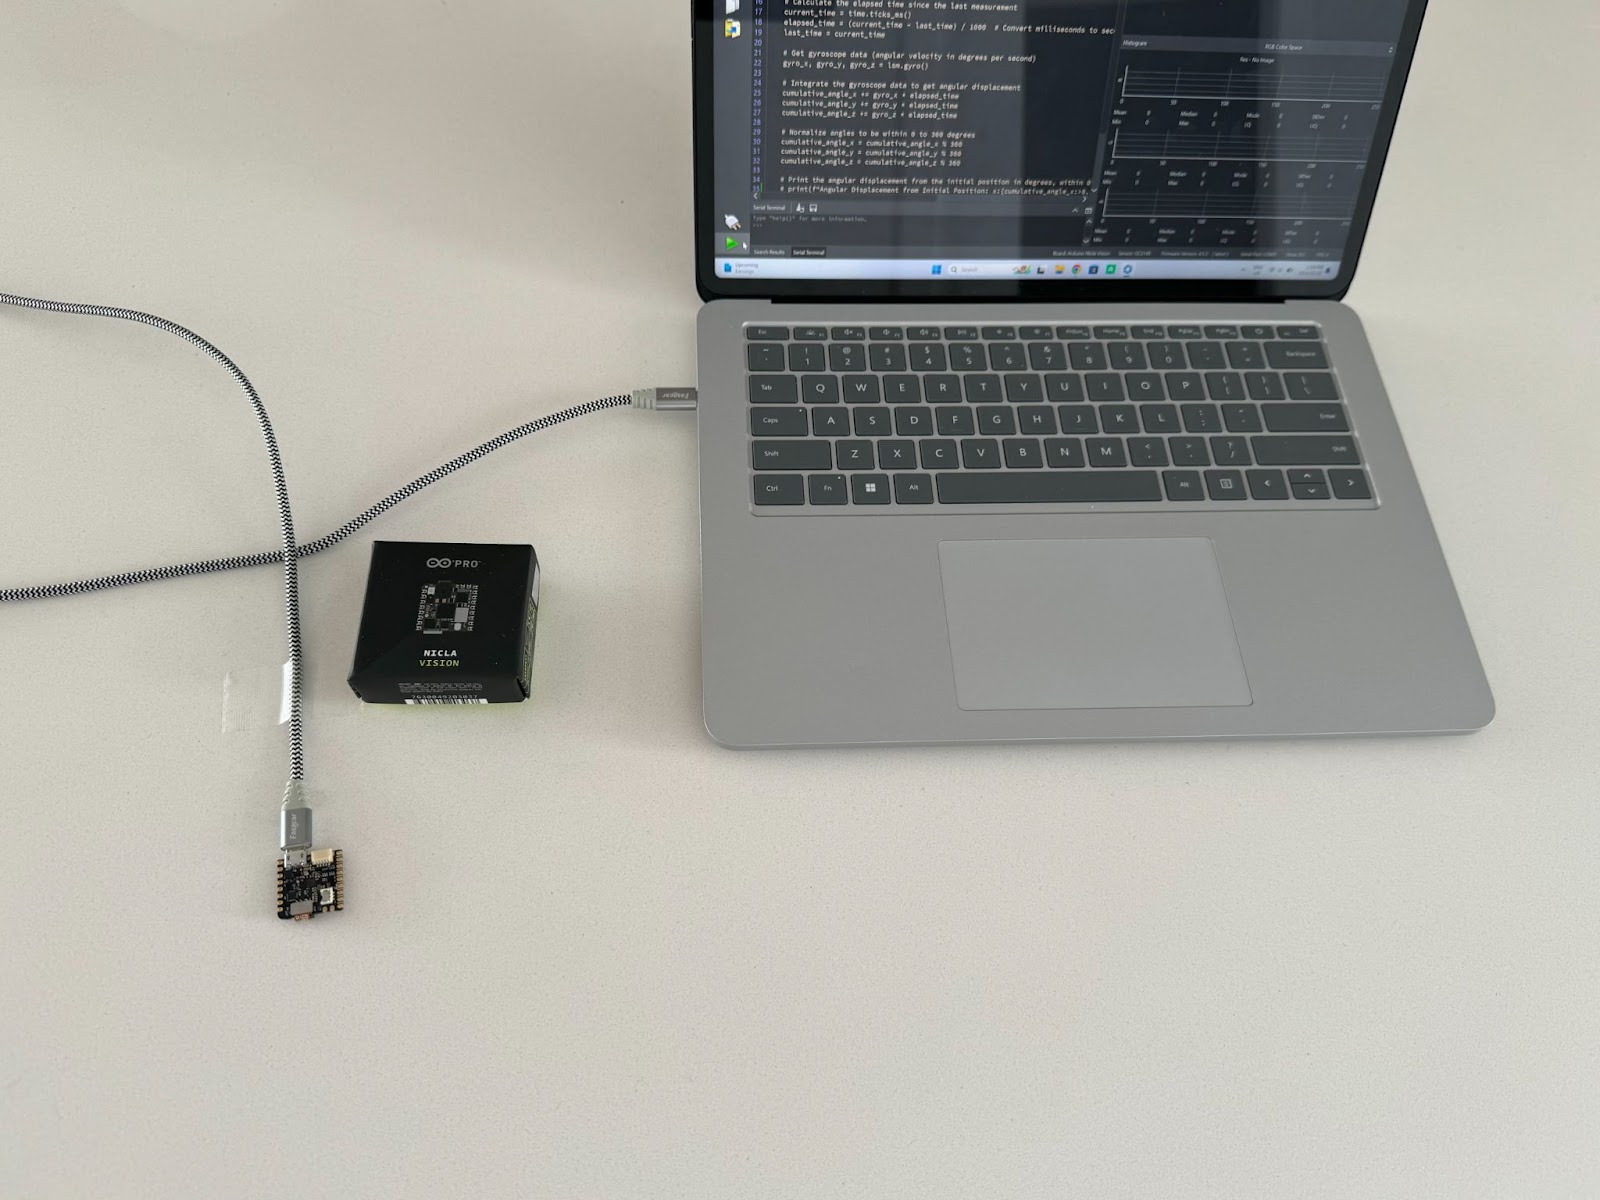
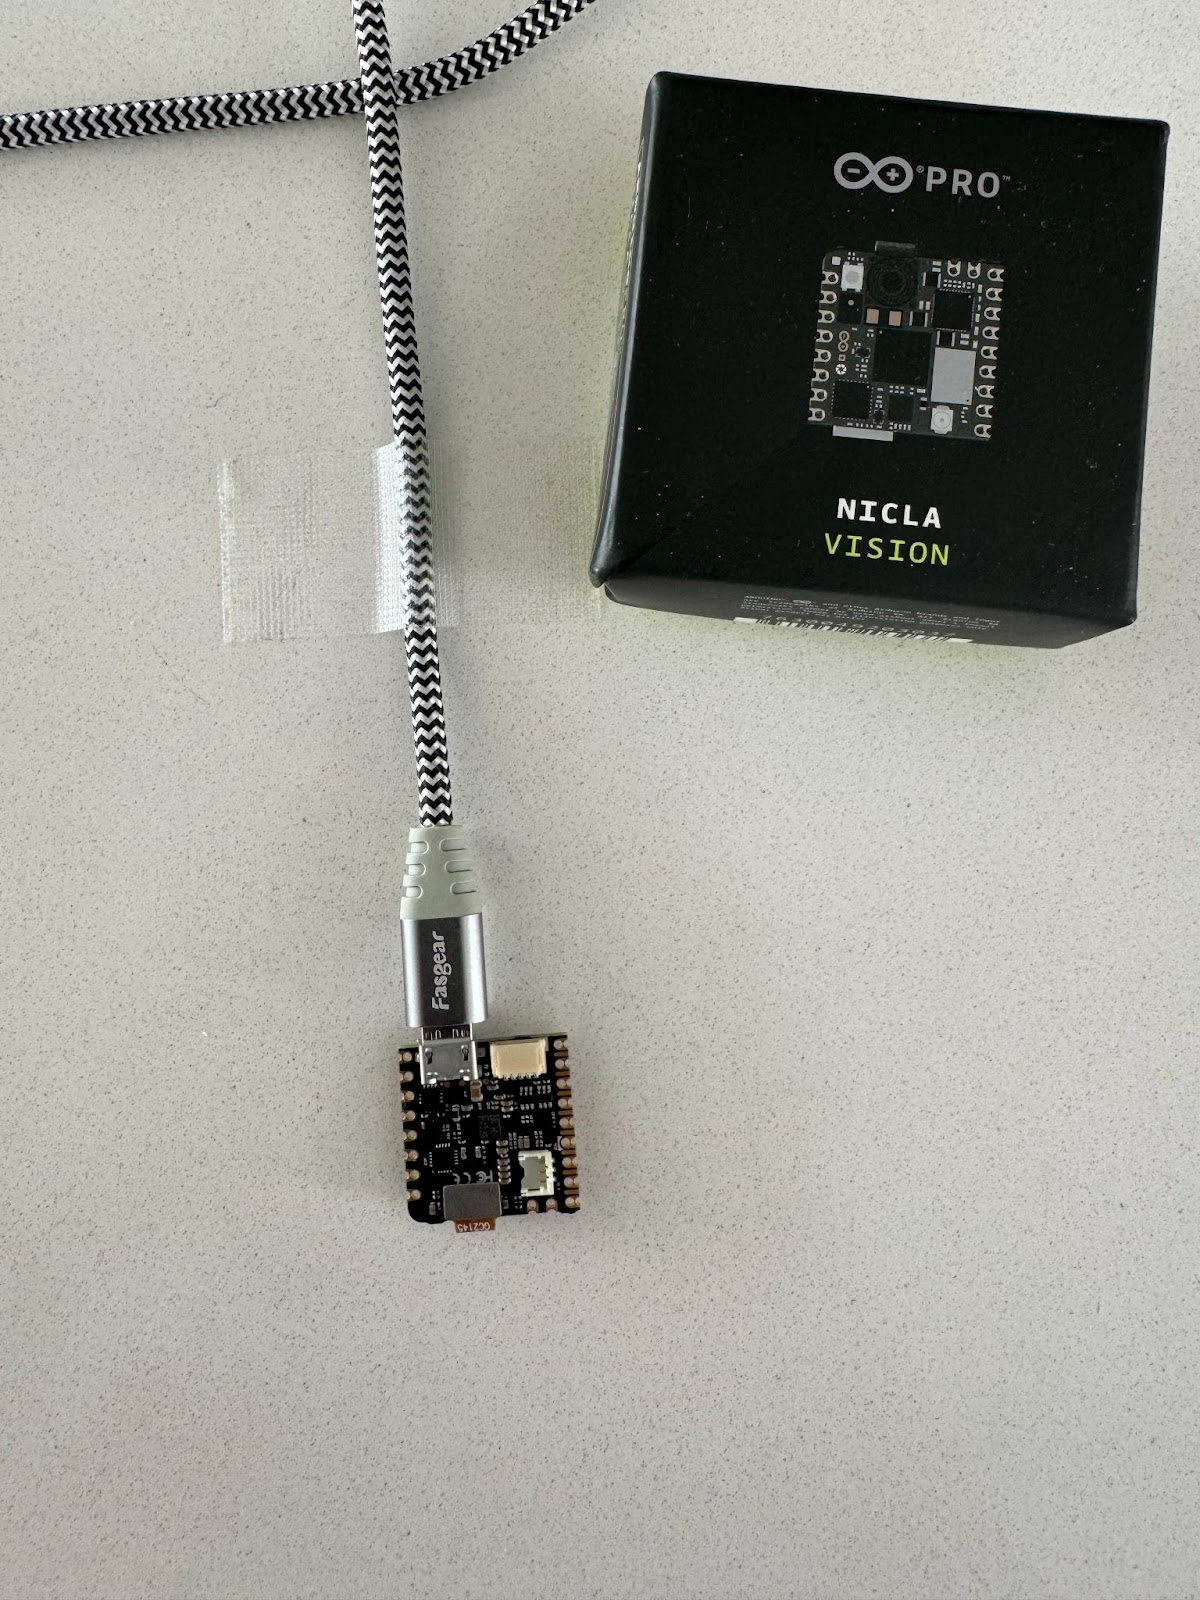
Figure 17. The materials used in the experiment.
Variables:
- Independent: Time
- Dependent: Angular drift readings from the gyroscope in 3 dimensions
- Controlled: Environmental temperature, device placement stability
Setup
I secured the Nicla Vision on a stable, non-moving surface to eliminate any external influences on its orientation. I monitored and recorded the ambient temperature throughout the experiment to ensure it remained constant, recognizing that temperature variations could impact the sensor's performance. The device was undisturbed during the data collection period to avoid any artificial introduction of angular displacement.
Data collection:
I performed a series of experiments to collect angular measurements for temporal intervals of 10 minutes with a frequency of 10 readings per second to a total of 6,000 rotation values for each of the three dimensions (X-angle, Y-angle, Z-angle). The long interval and high frequency were chosen to capture the writing period on a single page and the movement of the writer’s hand, respectively.
For the gyroscope to provide precise angular measurements, calibration is required. In the following two Sections, I describe the data collected from the gyroscope in two experiments. The first experiment collects data from a non-calibrated gyroscope with significant drift errors in all three dimensions. This data was analyzed to calibrate the gyroscope for the second experiment, where high-precision measurements were achieved.
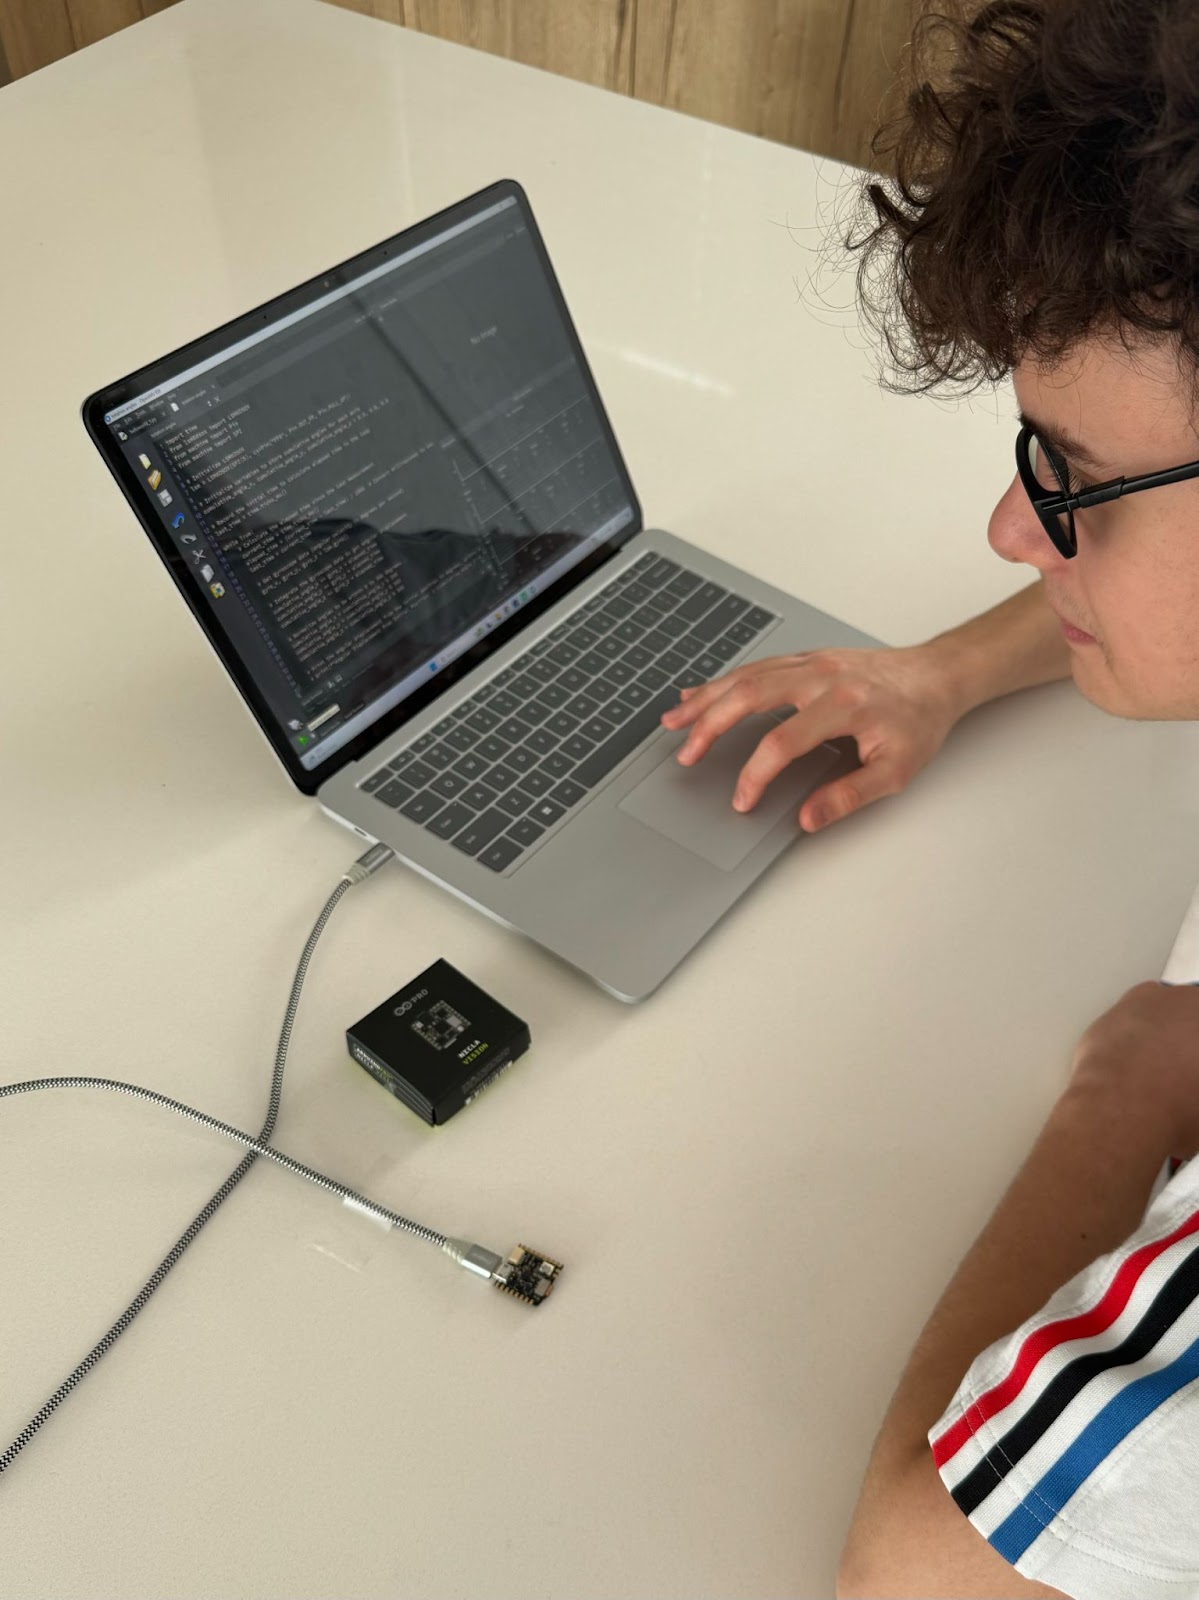
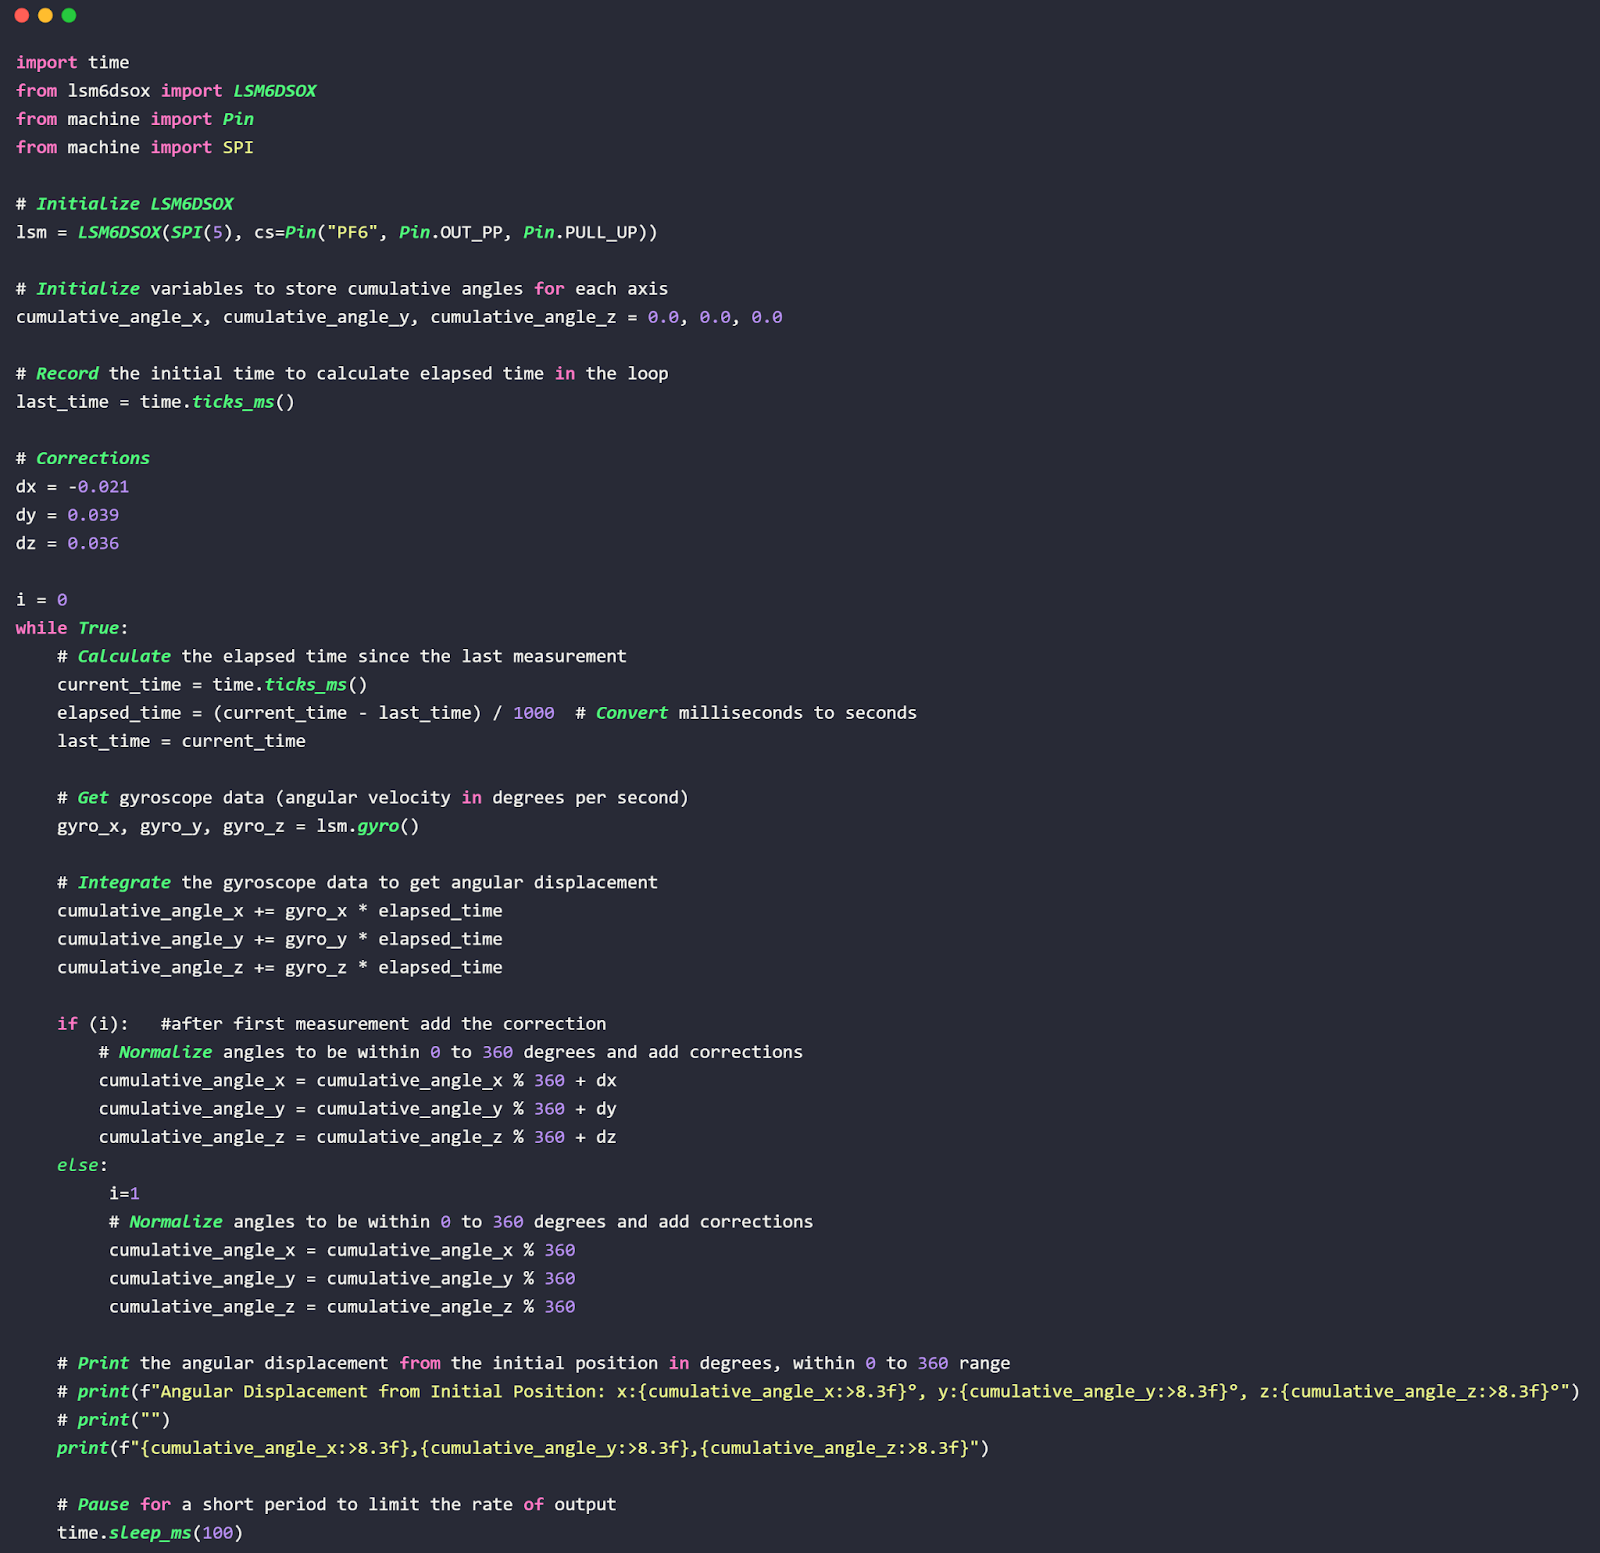
Figure 18. Gyroscope calibration and excerpt of the OpenMV code.
Before calibration:
As anticipated the first experiment reported inaccurate angular measurements given the presence of systematic errors in the non-calibrated gyroscope. As shown in the graph in Figure 19, angular drift will exceed 10 degrees within the first few seconds. The table in Figure 19 reports the average, (signed) maximum, and (signed) minimum differences (dX, dY, dZ) between temporal successive pairs of angular measurements in three dimensions (X-angle, Y-angle, Z-angle). The differences are very similar for each dimension along the 10 minutes and correspond to systematic errors of the gyroscope. The average values listed at the top of the table were used to calibrate (i.e., correct) each measurement in the second experiment (see the code in Figure 18).
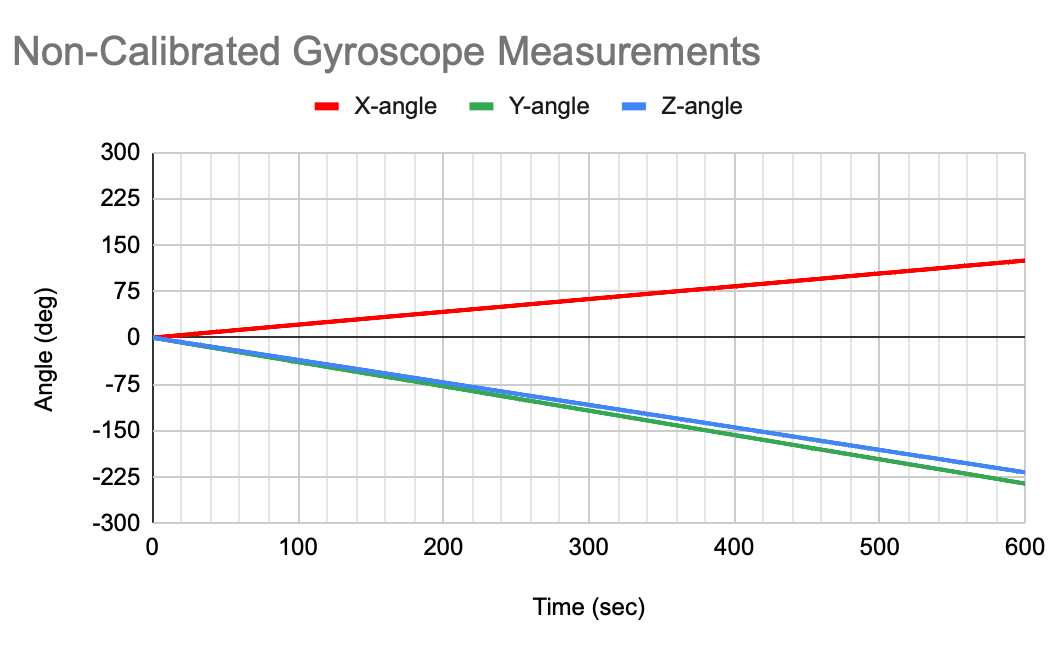
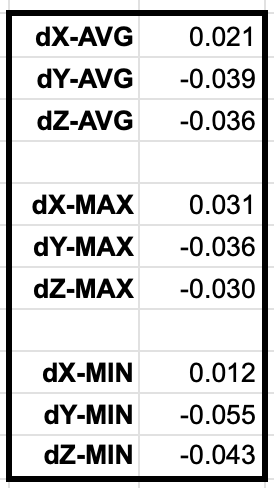
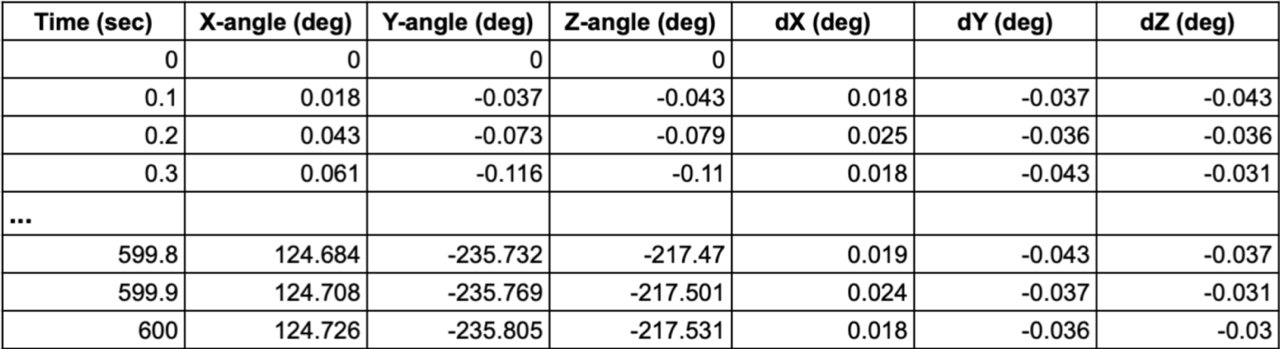
Figure 19. Non-calibrated gyroscope measurements for a period of ten minutes.
After calibration:
In the second experiment, each gyroscope measurement was calibrated using the following formulas (Figure 18):
calibrated_X-angle = measured_X-angle + dX-AVG, where dX-AVG = -0.021
calibrated_Y-angle = measured_Y-angle + dX-AVG, where dY-AVG = 0.039
calibrated_Z-angle = measured_Z-angle + dX-AVG, where dZ-AVG = 0.036
As shown in Figure 20, the angular drift remains very low in all three dimensions and did not exceed 1 degree or 5 degrees after 2 or 5 minutes, respectively. This experiment was repeated multiple times with equivalent angular errors.
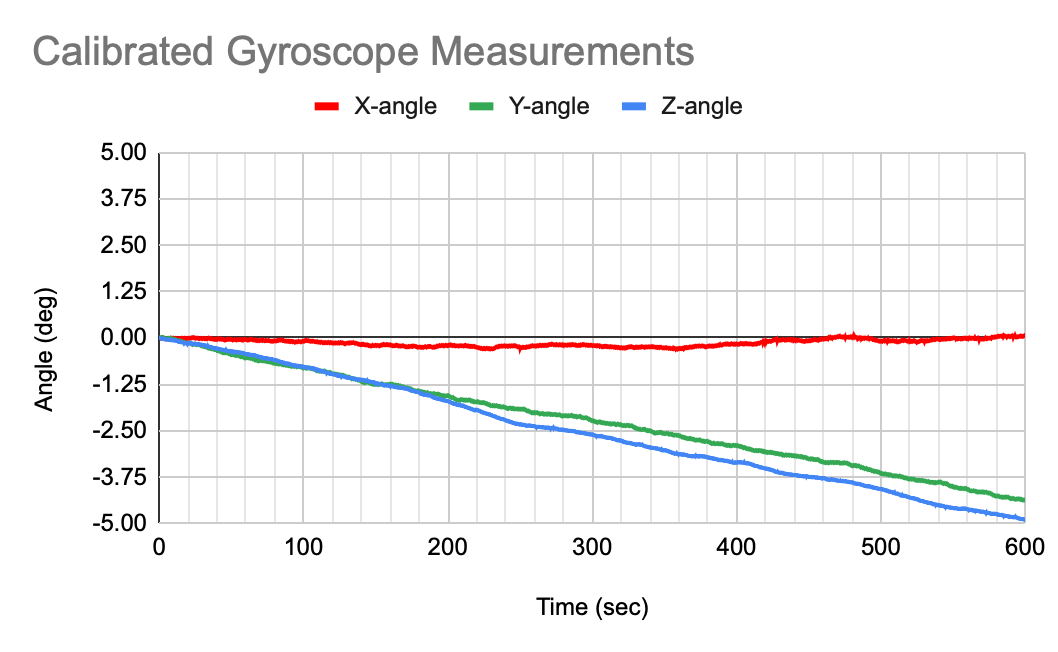
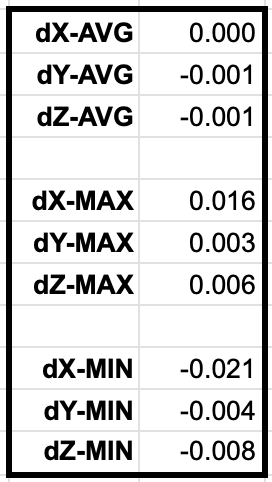
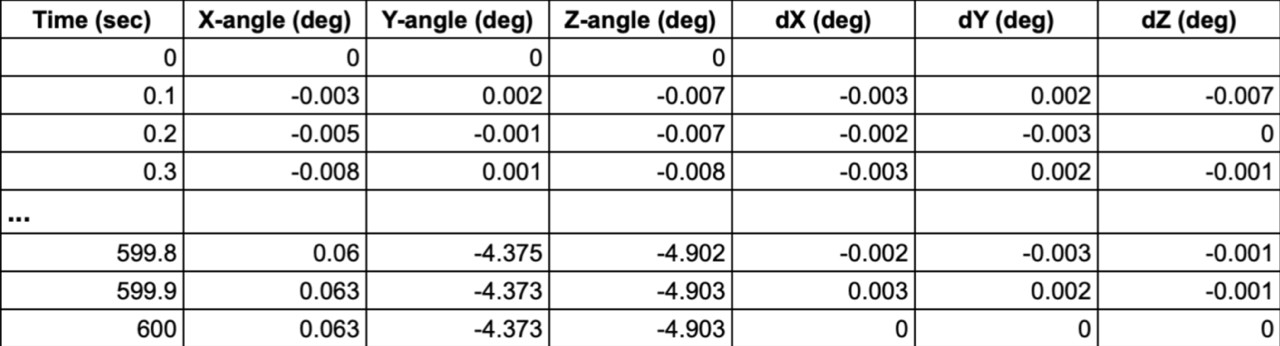
Figure 20. Calibrated gyroscope measurements for a period of ten minutes.
Data Analysis:
The outcomes of the above experiments demonstrate that a gyroscope can effectively be used to compute the pen’s orientation, which is required for the positioning of the pen’s tip. However, the gyroscope needs to be calibrated at the initialization phase to keep the angular errors low. The following Section discusses the impact of angular errors in the positioning of the pen;’s tip.
4.2 Estimated accuracy
The accuracy of the pen's tilt measurement, determined by the gyroscope, is prone to angular errors. An estimate of the displacement d of the pen's tip caused by an angular error θ of the gyroscope can be derived by the formula d = l sin θ, where l represents the distance from the camera to the pen’s tip. As shown in Figure 21, the displacement can be in any direction. For l = 13 cm, the measure of the displacement ranges from 2 to 11 mm for an angular error θ equal to 1 to 5 deg. respectively.
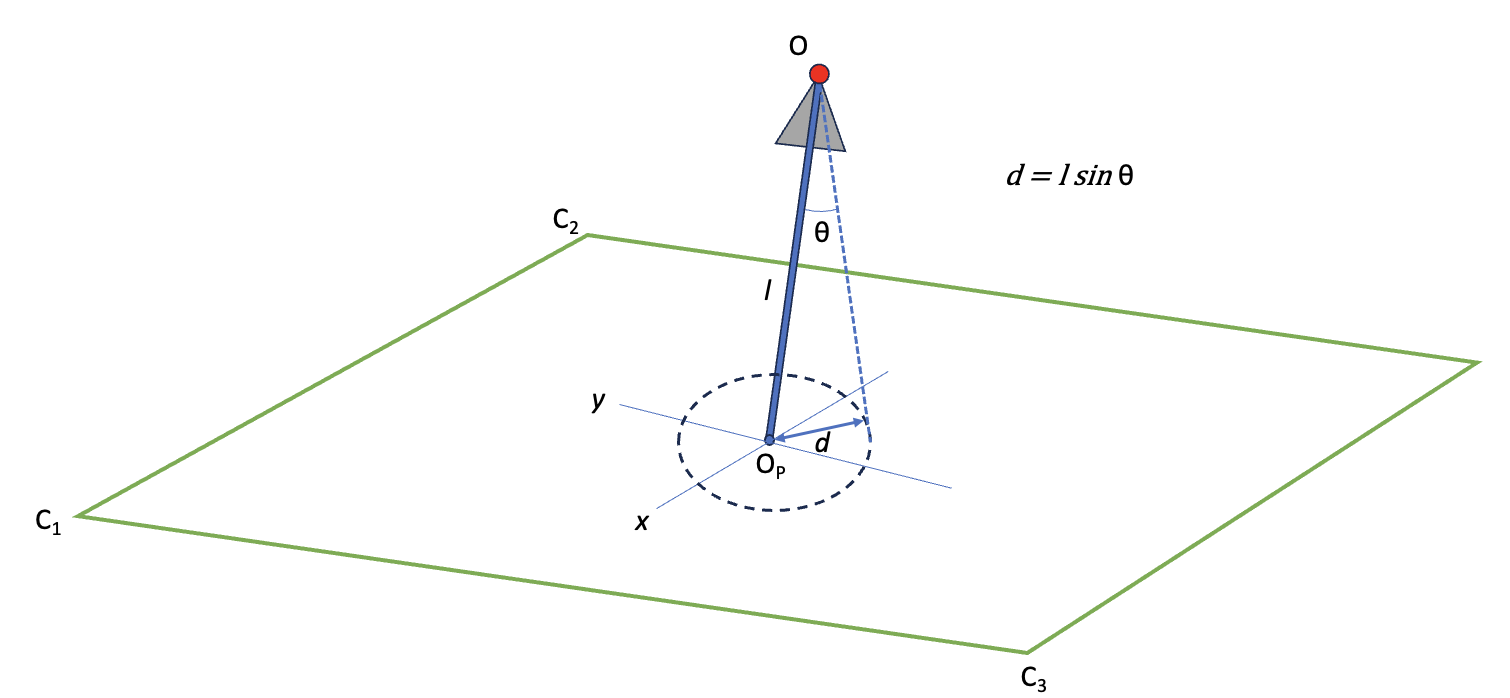
Figure 21. Displacement caused by an angular error θ of the pen’s tilt determined by the gyroscope.
4.3 Prototype
In developing the prototype, I programmed the microcontrollers using C++ in the Arduino IDE [22]. For the software running on the computer, I used Python with Visual Studio Code [23].
Materials:
- Arduino Nicla Vision
- Arduino Nano 33 IoT [26]
- PAA5100JE Optical Tracking SPI Breakout [27]
- Micro USB to USB-C cable and computer
- Tanstic 1-12mm Precision Chrome Steel Bearing Balls Assortment Kit [28]
- RASWLF.031 1OZ Chip Quik non-lead solder wire [29]
- 30-watt soldering iron
- 10 AWG wires
4.3.1 Hardware and communication
The prototype contains two microcontrollers: the Arduino Nano 33 IoT and the Arduino Nicla Vision, connected to a computer. See Figure 22 for details on how these components are connected.
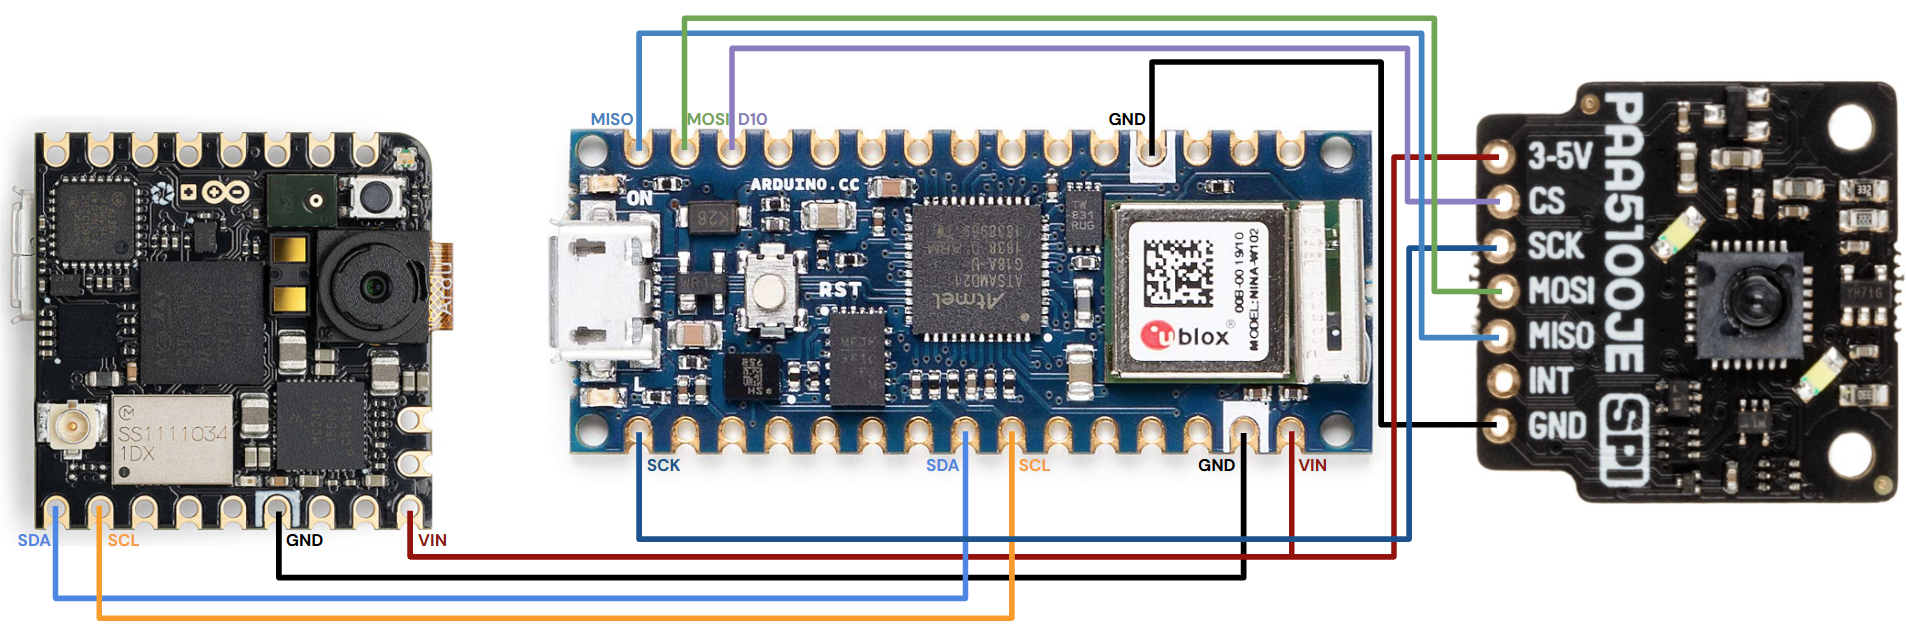
Figure 22. The wired connections between the Arduino Nicla vision (left), Arduino Nano 33 IoT (middle), and PAA5100JE Optical Tracking SPI Breakout (right)
Since communication with the computer is necessary for displaying the data, processing has also been migrated; this approach allows the use of a less powerful chip in the pen, making its hardware simpler and more affordable by reducing the need for an expensive, high-performance microcontroller.
The pen is wired for power and communication to simplify testing over Bluetooth and ensure reliable data transfer. A major challenge was syncing data from multiple sensors, as Arduinos are single-core and cannot handle parallel processing efficiently. To address this, the Nicla Vision collects and transmits data from the Nano, reducing delays that would occur if the Nicla Vision had to process optical flow data as well. This setup ensures efficient communication and minimizes latency.
Microcontrollers:
1. Arduino Nano 33 IoT
The Arduino Nano 33 IoT is responsible for reading data from the optical flow sensor and transmitting it to the Arduino Nicla Vision. For a detailed visualization of how the Nano 33 IoT integrates into the system and communicates with other components, refer to Figure 23.

Figure 23. Arduino Nano 33 IoT operation flowchart
2. Arduino Nicla Vision
The Arduino Nicla Vision processes the data from the Nano 33 IoT, integrates inputs from its camera and IMU, and transmits the refined data to the computer. For an overview of its operational role, refer to Figure 24.
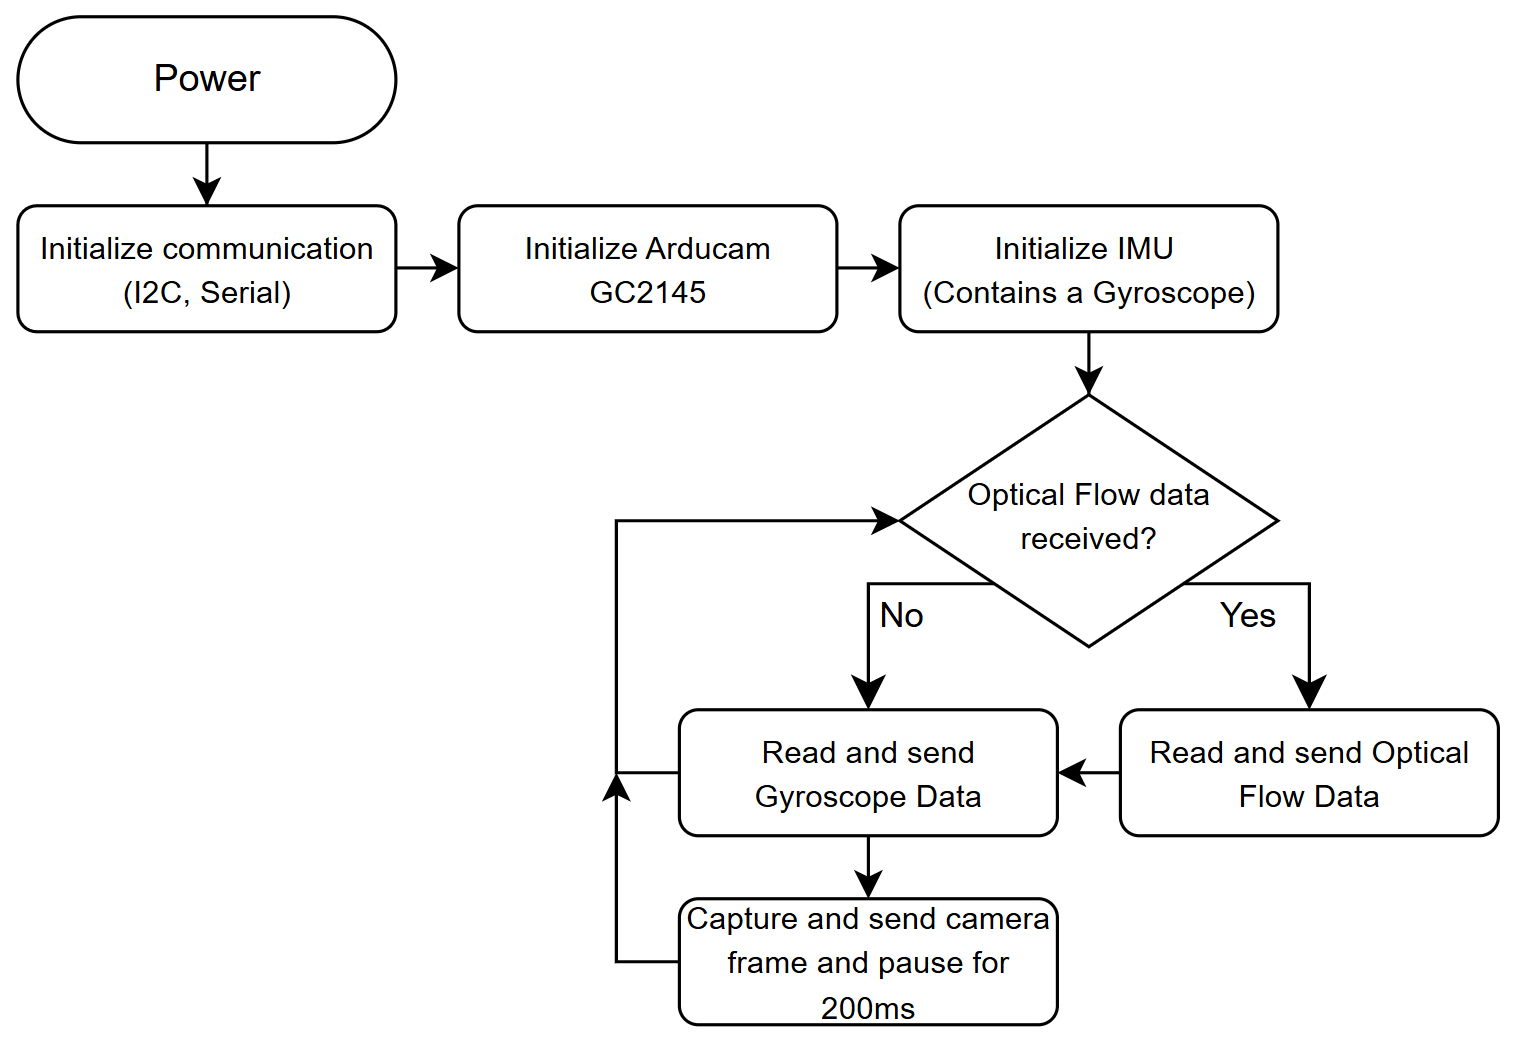
Figure 24. Arduino Nicla Vision operation flowchart
3. Computer
The computer receives processed data from the Arduino Nicla Vision and digitizes it. The flowchart shows the sequence of operations performed by the computer to complete the digitization of the handwritten notes.
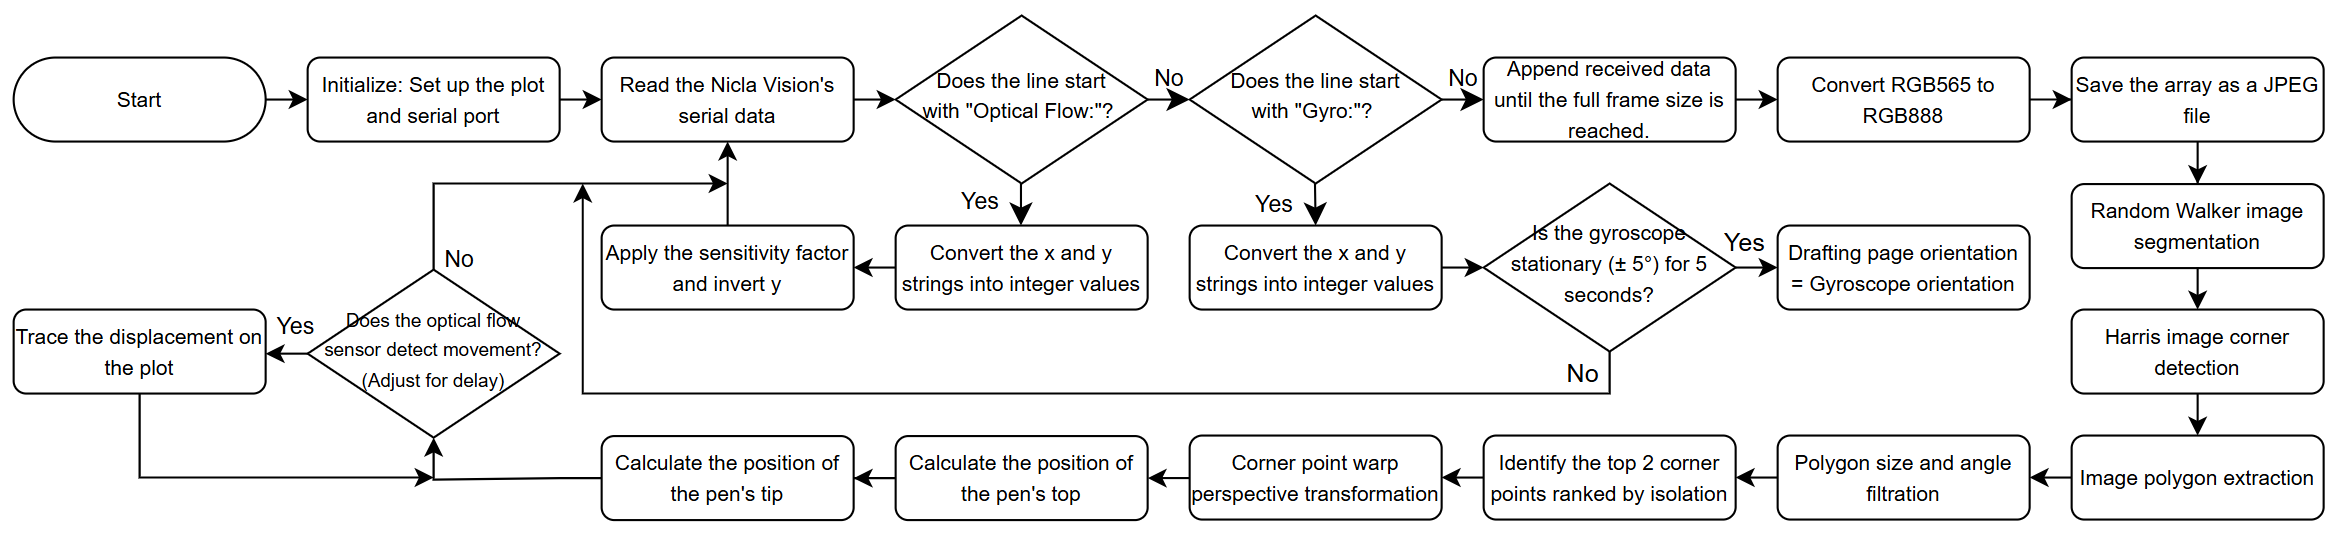
Figure 25. The computational procedure carried out by the computer
4.3.2 Tracking of the mouse cursor movement
In this prototype, the tracking of the mouse cursor movement is achieved using an optical flow sensor, specifically the PAA5100JE Optical Tracking SPI Breakout. This sensor is chosen over alternatives like mechanical trackballs or odometers due to its precision, reliability, and suitability for the small-scale requirements of the prototype. Mechanical trackballs, while historically used in early computer mice, are not commercially available in compact forms suitable for integration into Arduino projects or as standalone sensors. Additionally, they suffer from issues like dust accumulation and mechanical wear, which degrade their accuracy over time. Odometers are inherently one-dimensional and cannot support multi-directional tracking. Additionally, they lack a high refresh rate, typically taking measurements only once per wheel rotation, making them unsuitable for real-time tracking.
The optical flow sensor operates on principles similar to those used in modern computer mice. It captures sequential images of the surface at a high frame rate (up to 242 frames per second, PAA5100JE) and analyzes the changes between these images to detect motion. By comparing the displacement of patterns in the images, the sensor calculates the direction and velocity of movement. This process relies on the brightness consistency assumption, a foundational concept in optical flow theory, which posits that the intensity of pixels corresponding to the same object remains constant between consecutive frames [24]. This assumption allows the sensor to track motion by identifying shifts in pixel intensity over time.
In this design, the optical flow sensor is pointed at a trackball (similar to a ballpoint pen mechanism) rather than directly at the paper. This configuration ensures that the distance between the sensor and the tracked surface remains consistent, improving the accuracy and reliability of motion detection. The trackball rotates as the pen moves, and the sensor captures the displacement of the ball's surface, translating this movement into displacement coordinates. This approach maintains versatility by mimicking the natural feel of a traditional ballpoint pen, allowing users to hold and use the pen in a familiar way without requiring specific grip angles or orientations. Unlike other smart pens, such as the Livescribe, which rely on specific holding positions (dependent on an infrared camera that detects patterns on encoded notebooks), this design eliminates the risk of obstruction and ensures seamless usability across various writing surfaces.
4.3.3 Camera position
Optimizing the camera's position on the pen is critical to maximizing its versatility, especially given the narrow diagonal field of view (DFOV) of 80 degrees. Positioning the camera at the top of the pen along its axis, as outlined in Section 3.2.2, simplifies the geometry and calculations involved. However, this arrangement restricts the camera's field of view, potentially missing the two corner points of the drafting page necessary for pen positioning, an issue further amplified by the increased thickness of the prototype due to the use of non-specialized retail components. Instead, the camera will be positioned on an upper side of the pen, requiring the user to have a specific grip to keep the camera's view unobstructed. Note that this temporary arrangement in the prototype phase is due to the use of non-specialized retail components; in the final product, custom-manufactured components will allow for optimal camera placement without these constraints.
Design objectives and considerations:
1. The pen should remain as compact as possible to encourage widespread adoption. The Nicla Vision features a flexible camera wire, which allows for various orientations. Identifying the most compact configuration is crucial, given the pen's cylindrical shape and the need to manage wire connections effectively. See Figure 26. for the various camera orientations.
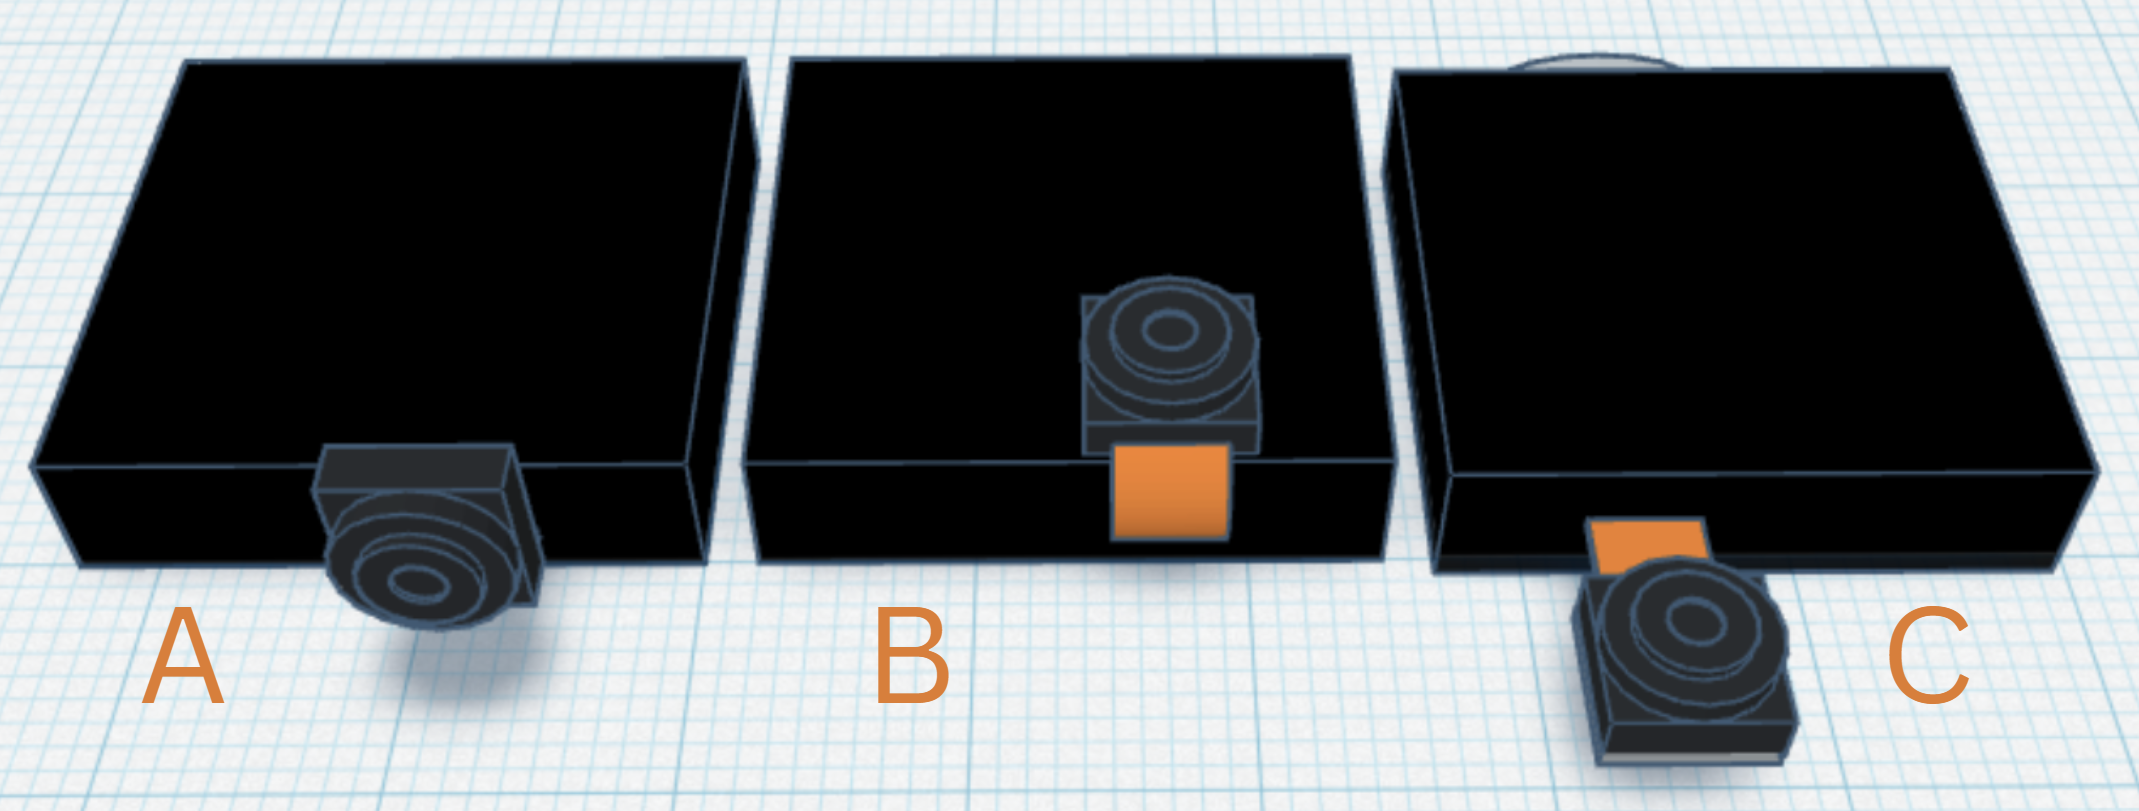
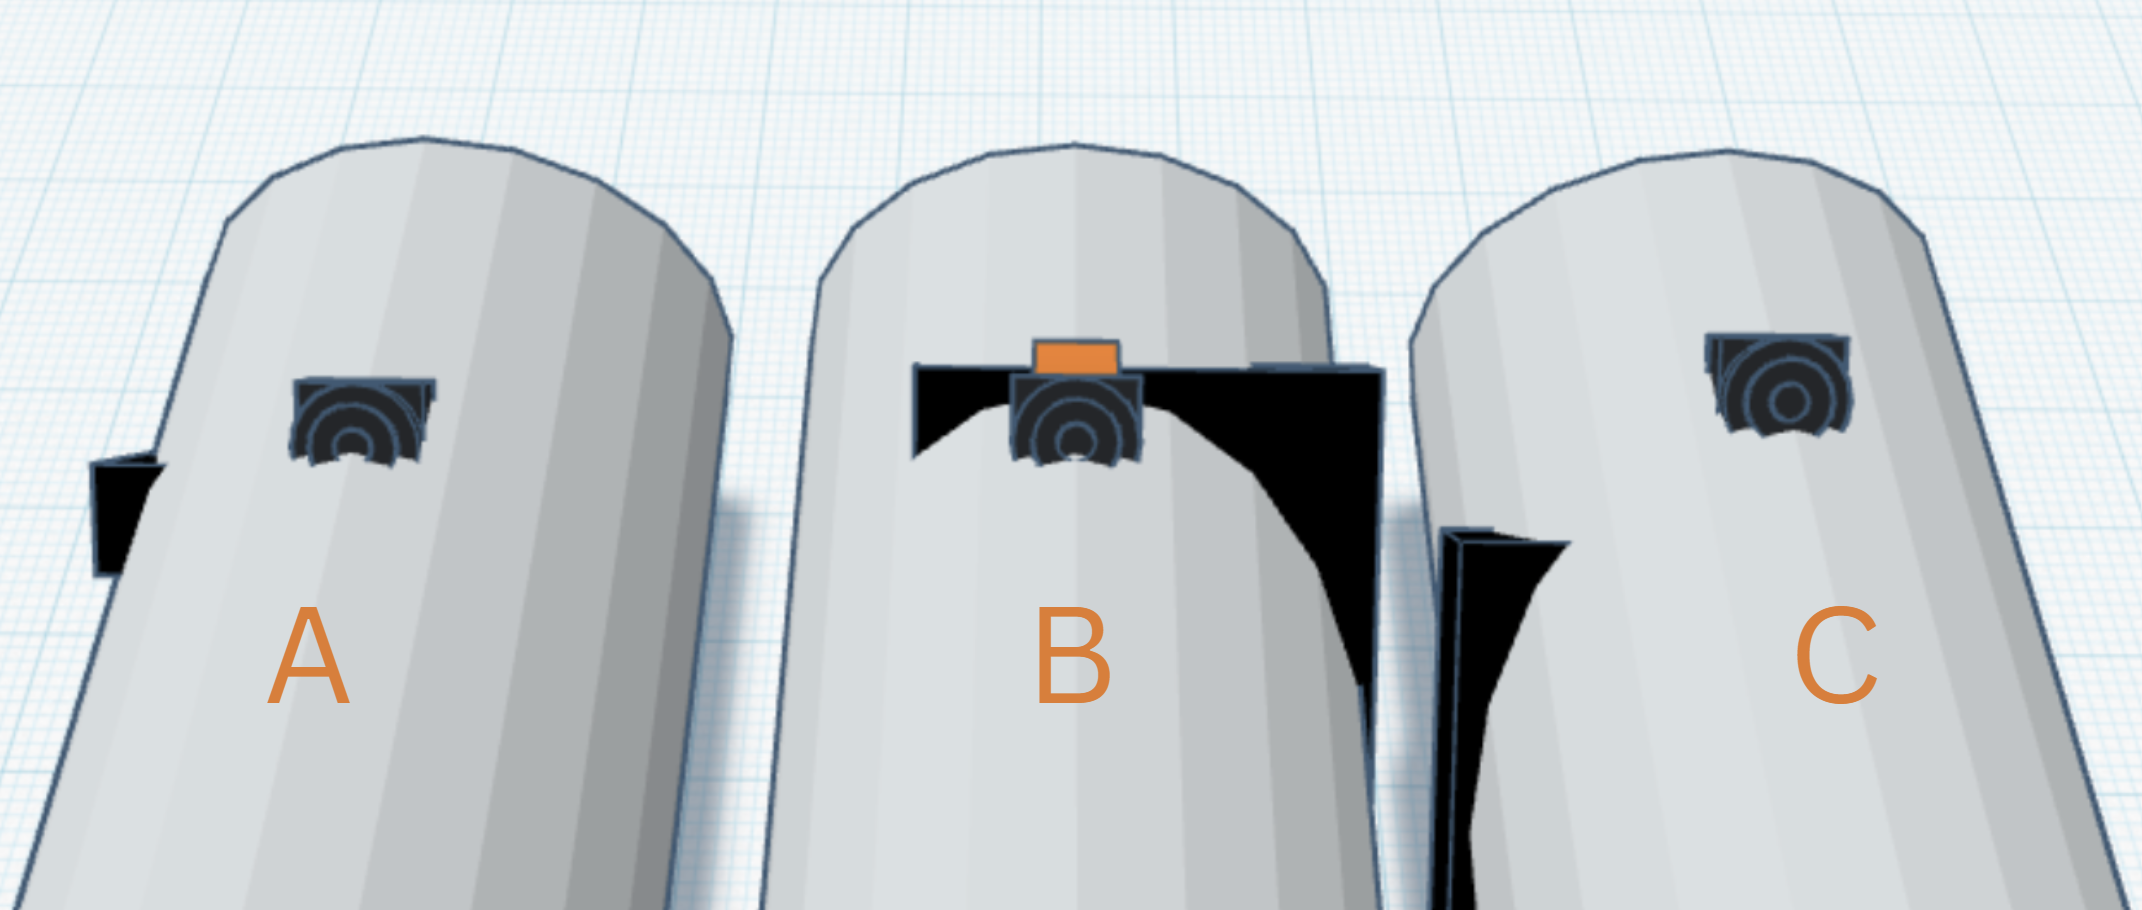
Figure 26. Alternative configurations of the camera (left) and their respective mount position on the pen
2. Position the Nicla Vision, which includes the camera and gyroscope, away from the grip area to avoid blockage by the user's hand. Placing it further from the grip enhances its ability to detect the larger movements that occur while writing because the gyroscope measures movement more effectively when it can leverage longer distances. This distance amplifies the mechanical movements of the pen, translating small hand motions into more significant and detectable sensor data.
3. The camera must be centered on the pen's axis to simplify positioning calculations when translating the corner points to the pen's center, thereby enhancing the accuracy of these measurements. This configuration also ensures a balanced field of view (FOV) with minimal obstruction.
4. The horizontal field of view (HFOV) should be greater than the vertical field of view (VFOV) to adequately capture the drafting page's width and corner points. Horizontal coverage is prioritized because, while the VFOV can be adjusted by tilting the camera, it is primarily influenced by the size of the paper. For most standard paper sizes, the existing VFOV is sufficient, making it unnecessary to adjust the camera's orientation relative to the paper's x-axis for effective digitization. Figure 27 depicts the Nicla vision's field of view parameter values.
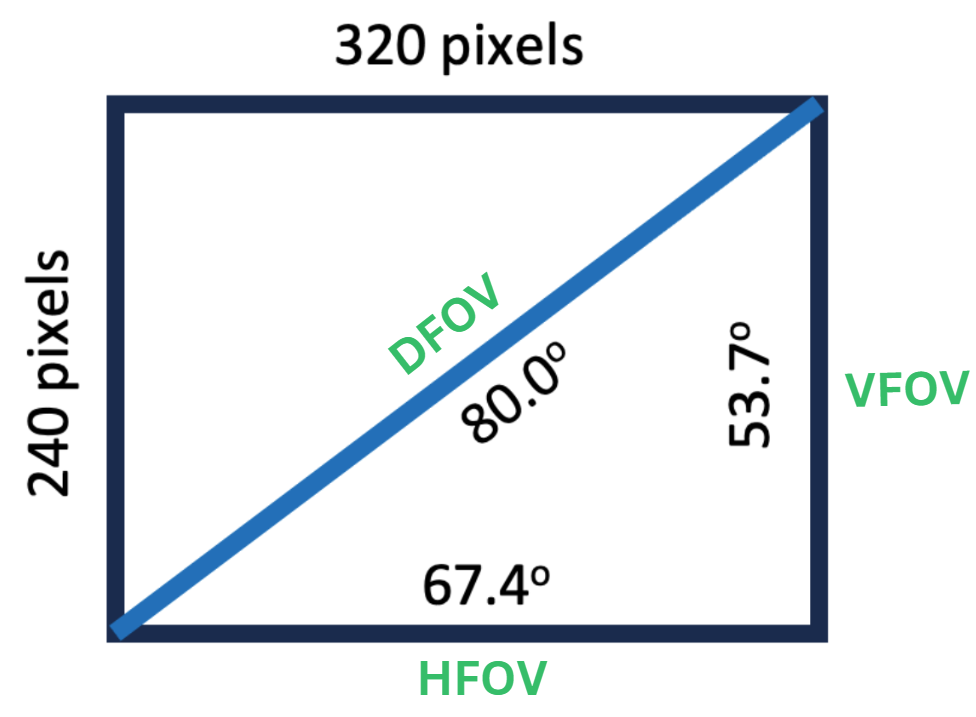
Figure 27. The 2MP GC2145 Color DVP Camera's field of view
After testing various configurations on Tinkercad [25], option A was the selected camera orientation because it met all 4 design considerations. With this configuration decided, the next question to address is: what would be the optimal angle for positioning the camera on the prototype?
Its y-axis relative to the drafting page is its vertical field of view. For simplicity and because of low manufacturing precision, I will round to 54 degrees. Note that the average hold for writing utensils is ~ 60 degrees.
Without adjustment (90°)
The pen would have a poor view of the corner points.
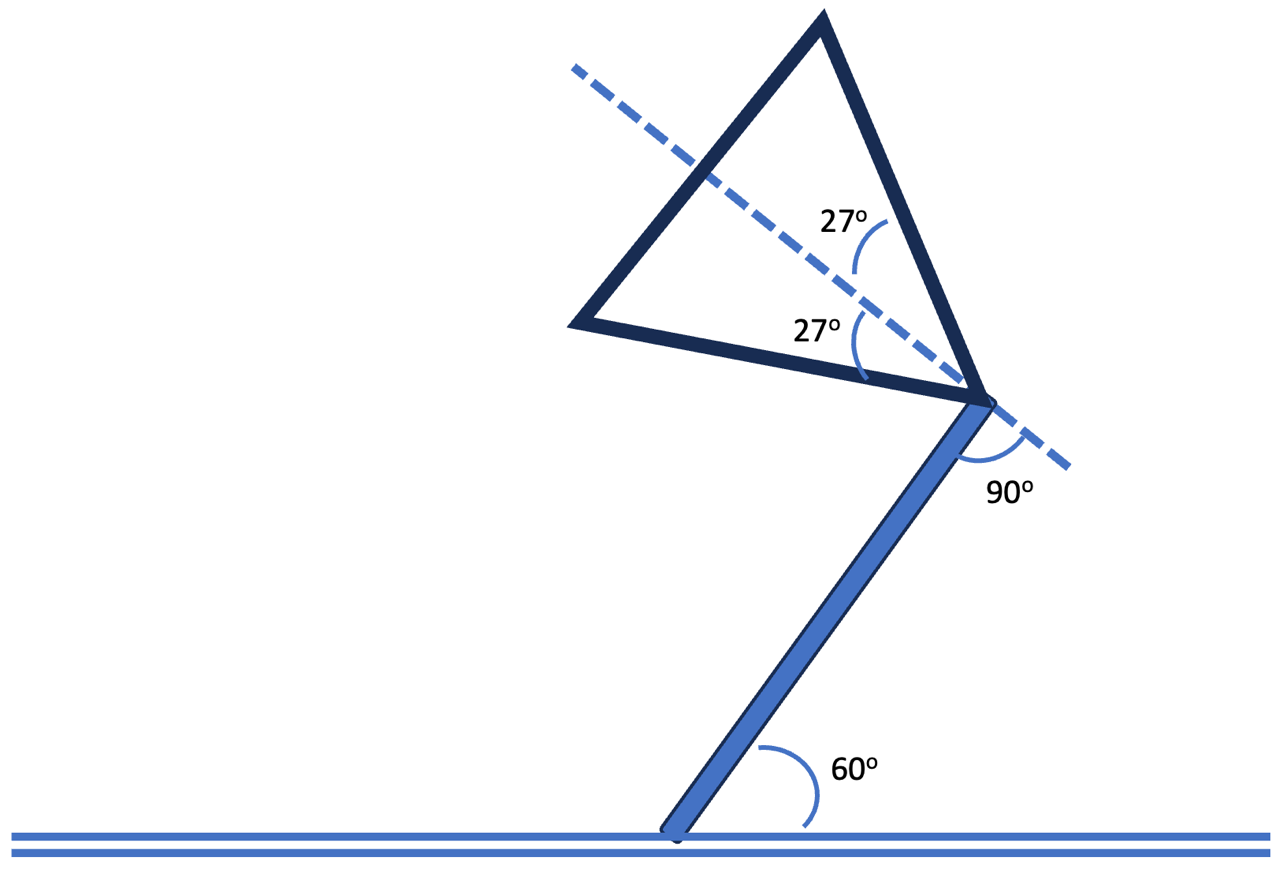
Figure 28. The camera mounted on the side with its axis perpendicular to the pen’s axis.
Adjustment (27°)
When the camera is tilted 27 degrees from the pen's exterior, the vertical field of view can see corners very near the pen's tip, making it compatible with small drafting pages; this angle will be used in the prototype to maximize versatility.
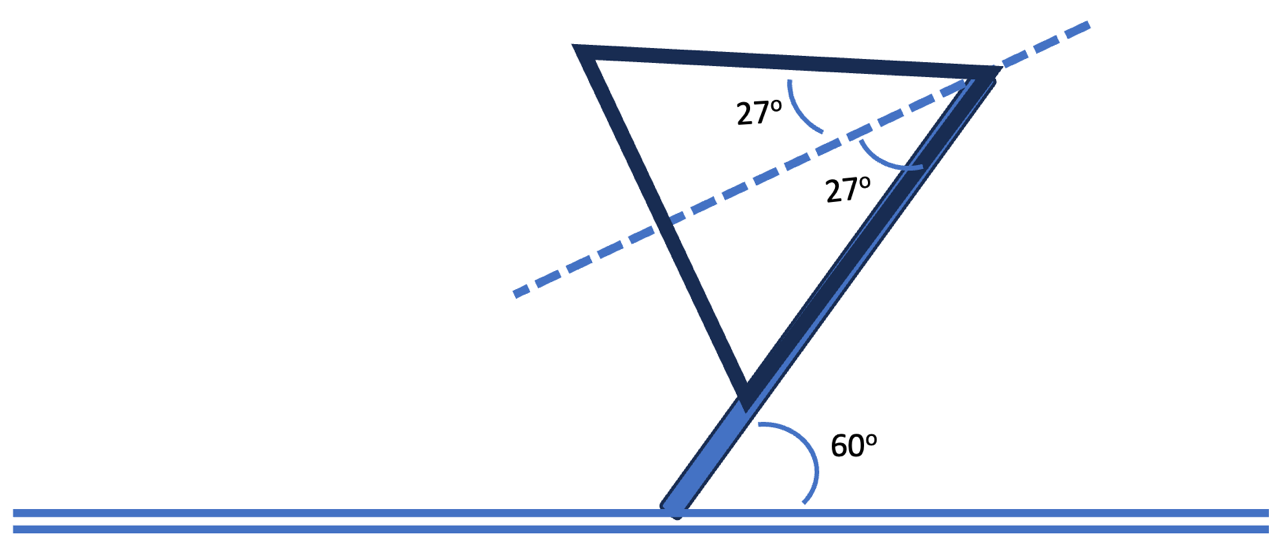
Figure 29. Optimal mounting of the camera on the side of the pen to maximize its view coverage on the drafting page.
This position not only broadens the field of view, allowing the camera to capture the page corners but also enables the conversion of side camera image coordinates to those of a hypothetical top-mounted camera. This adjustment ensures the validity of the photogrammetric calculations discussed in earlier Sections, as proven in Figure 30.
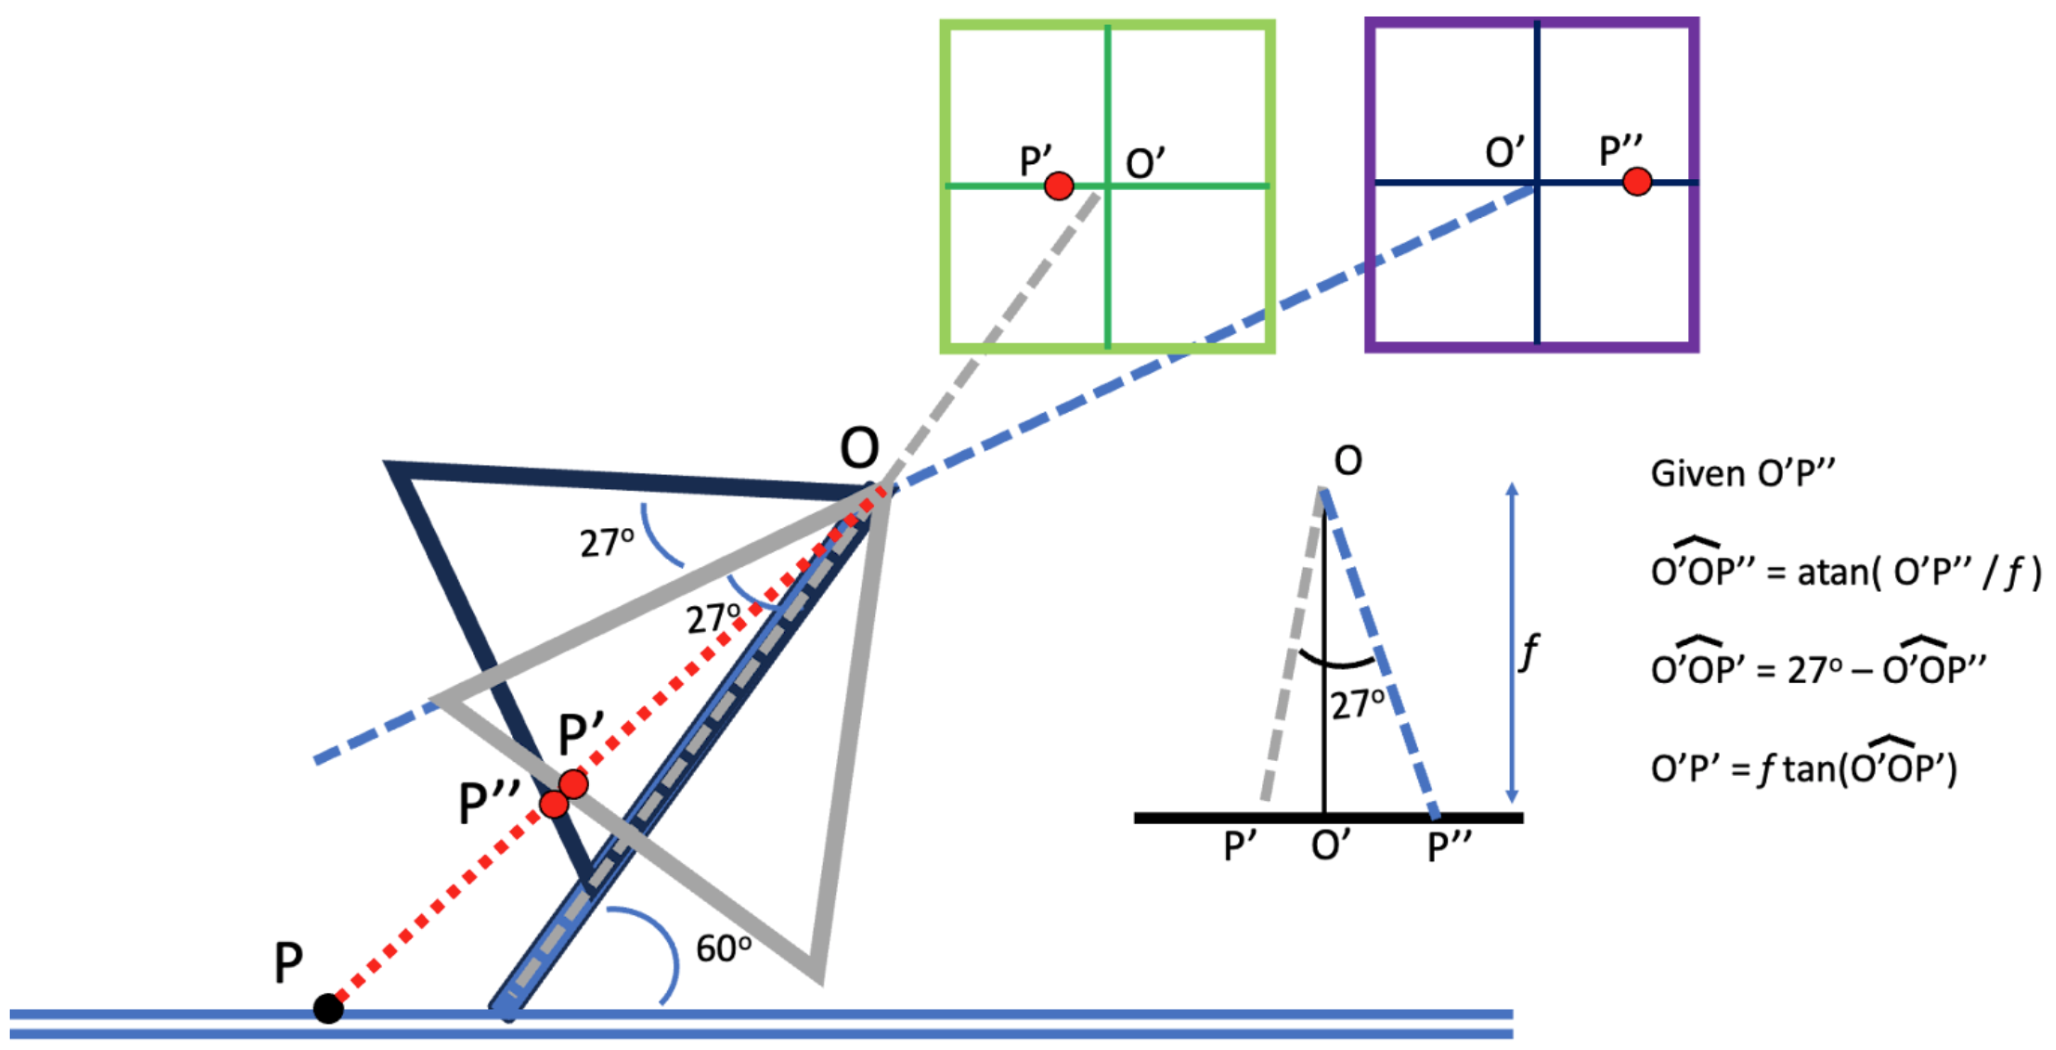
Figure 30. Transforming the image coordinates from a side-mounted camera to those of a hypothetical camera mounted at the top and center.
4.3.4 Frame Design
I used Tinkercad by Autodesk to design the pen’s frame, iterating through multiple versions to address structural and functional issues. Below is an overview of the design evolution and improvements made.
Frame version 1.0
The initial frame design was a good starting point, but several issues prevented effective testing.
Problems:
- Tip Interlocking Shapes: The interlocking shapes at the tip did not fit properly, causing the tip to shift forward and making the ball loose.
- Ball Size: The 5mm ball was too small for the optical flow sensor to detect movement effectively.
- Wire Hole: The hole on the side wall near the left end for the wires was too small, making it difficult to pass wires through.
- USB Port Hole: The micro-USB port hole at the cap (far left) was too narrow for the USB connector to fit.
- Optical Flow Sensor Cover: The cover for the optical flow sensor (the bump near the tip) was too thin and had 3D printing errors in that area.
- Inner Cylinder Shape: At the left middle frame area on the inner piece, the cylinder shape was made using two "round roof" shapes in Tinkercad, which had more edges than the standard cylinder used for the outer covers. This difference made it impossible to assemble the two pieces together.
- Middle Piece Design: The middle piece was designed under the false assumption that electronic components could be added after assembly, making assembly impossible due to blockage.
- Sliding Piece Fragility: The sliding piece connected to the middle cover (where it says "1.0") was only 1mm thick, making it fragile and prone to breaking. Increasing its width would improve durability.
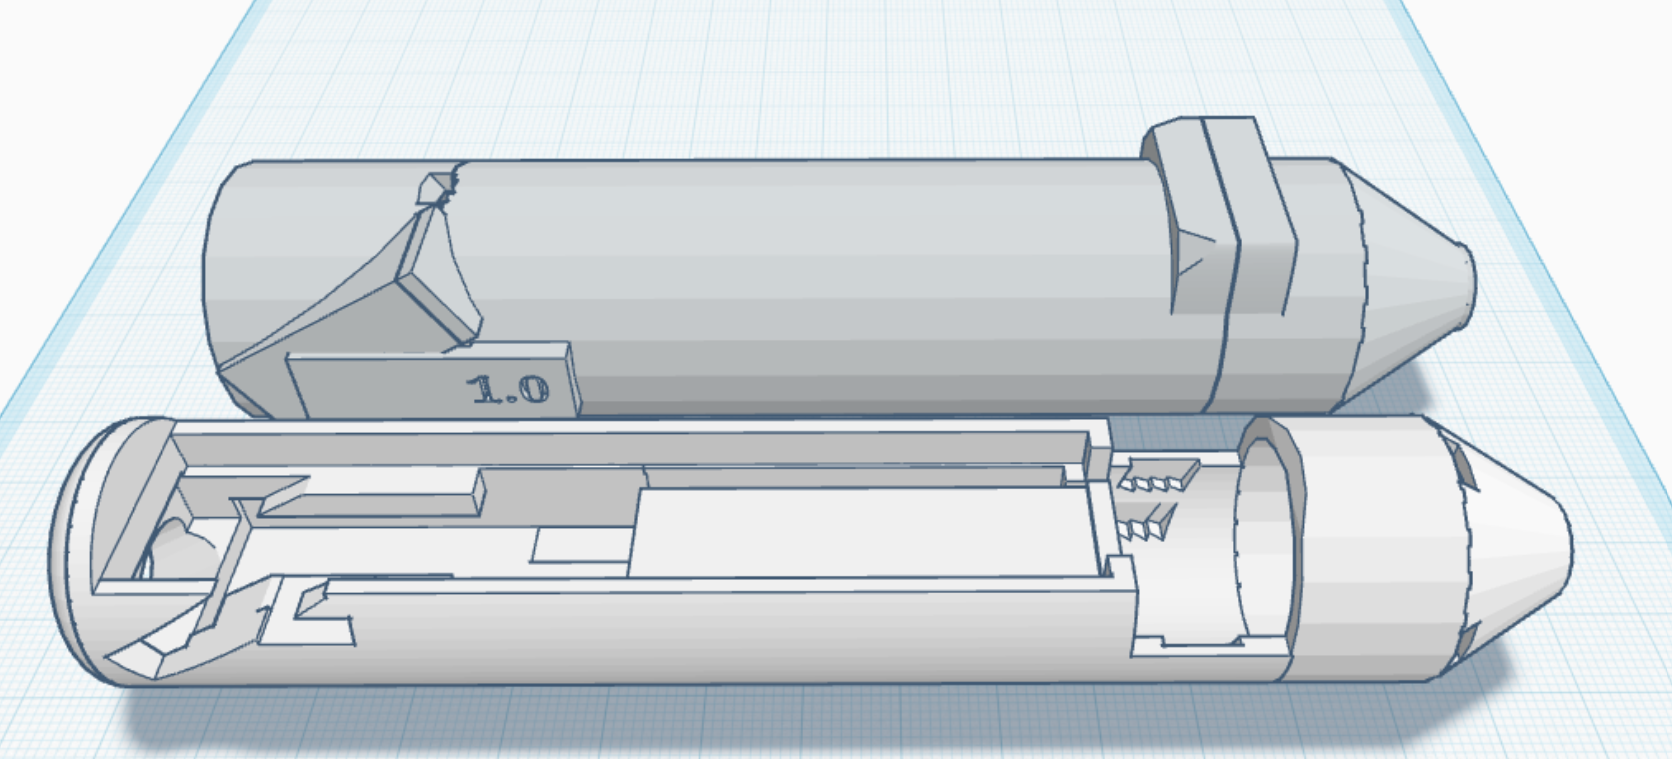
Figure 31. The initial 3d model of the prototype
Frame version 2.0
The 2.0 design addressed all the issues from the 1.0 version and included the following improvements:
- Ball Size: Replaced the 5mm ball with a 12mm ball for better optical flow sensor detection.
- Ball Distance: Reduced the distance between the ball and the optical flow sensor from 30mm to 20mm
- Middle Lid Stability: Added interlocking square frames for the middle lid to improve stability.
- Camera Hole: Increased space in the camera hole to ensure a proper fit.
- Ball-Holding System: Redesigned the ball-holding system to be more compact and increase the ball’s viewable area.
Problems:
- Printing Orientation: Printing the inside vertically (tail to tip) might reduce roughness at the bottom.
- Ball Friction: The ball has too much friction against the frame, making rotations difficult to track.
- Pen Length: When I reduced the ball distance, I also decreased the length by 10mm, this made the camera's height shorter, decreasing its height relative to the tip to 110mm rather than 120mm.
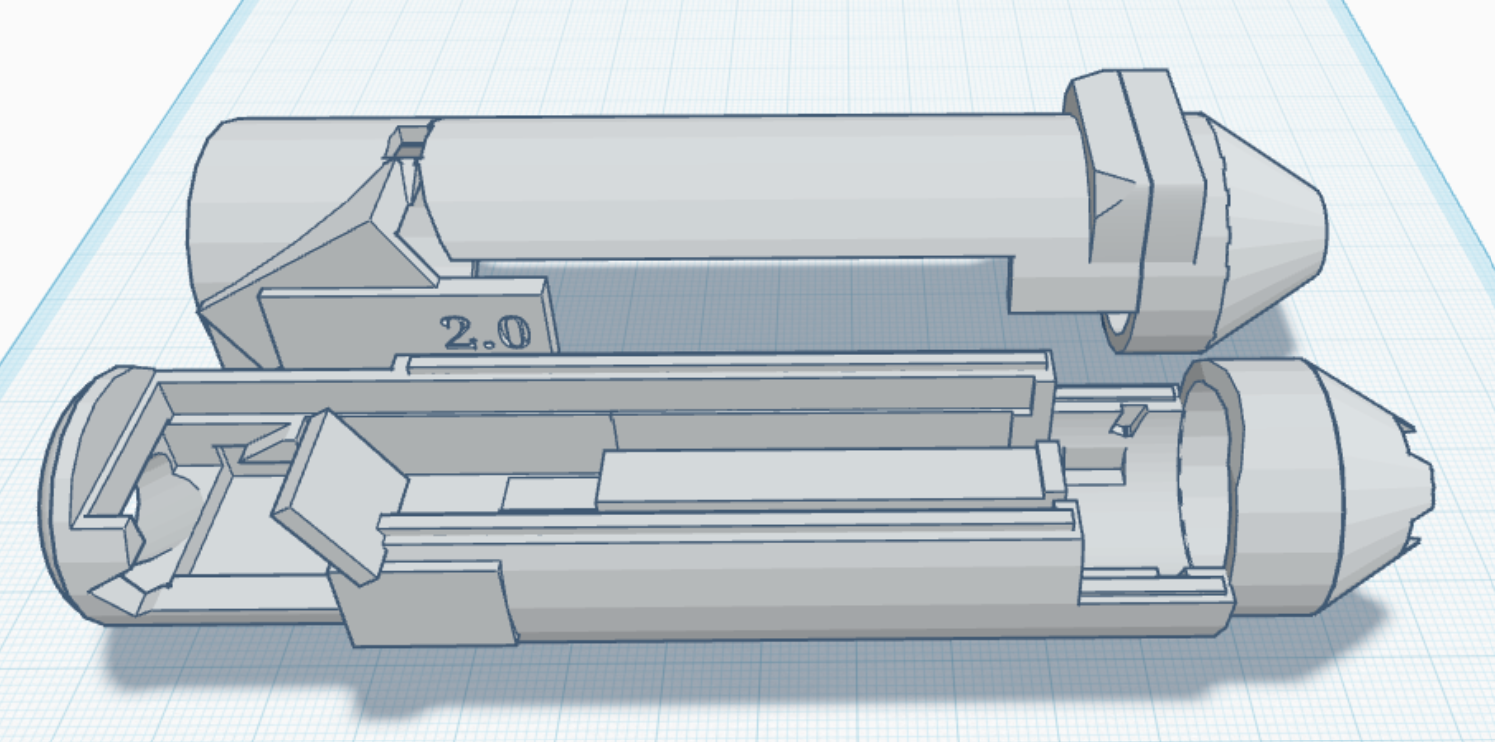
Figure 32. The second 3d model of the prototype
4.3.5 Applied image processing
All image processing in this prototype will be performed by the computer upon receiving the raw data from the Arduino Nicla Vision. The Arduino Nicla Vision is responsible for capturing images using its onboard camera and transmitting the raw image data to the computer for further processing.
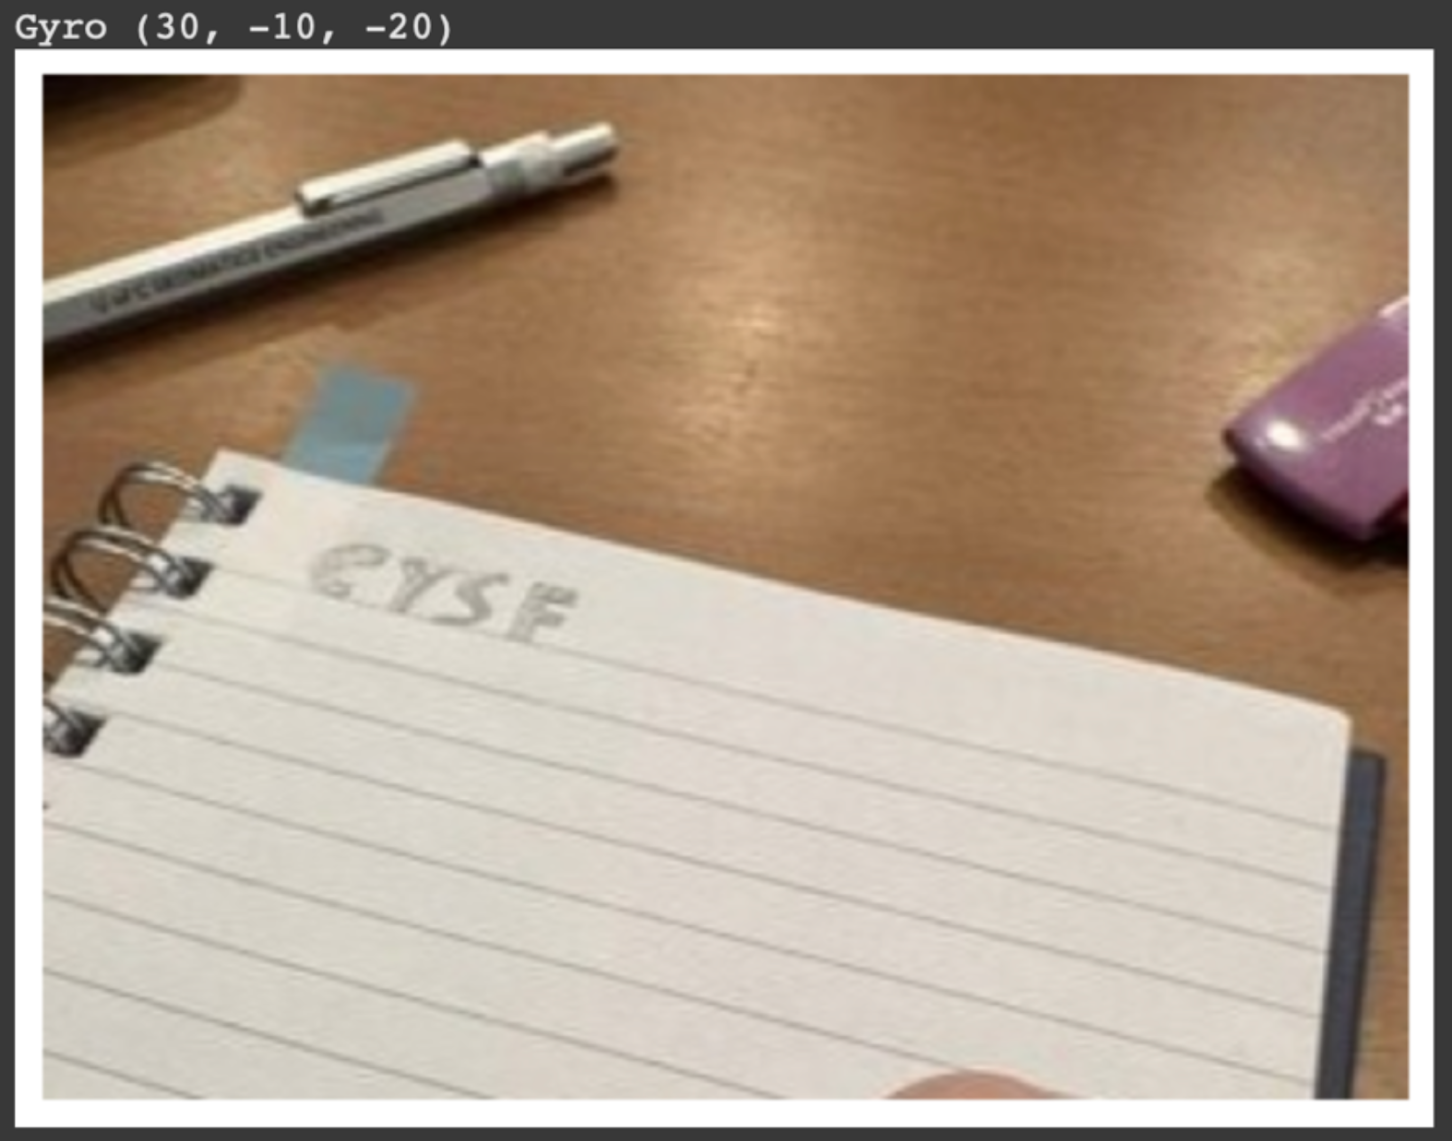
Figure 33. Image captured by the Arduino Nicla Vision’s onboard camera (resolution: 320x240).
Next, the image will undergo processing as outlined in Figure 8 and detailed in Section 3.2.5, ensuring accurate corner detection on a drafting page. This process will utilize input parameters that include gyroscope angles across three dimensions, as illustrated at the top of Figure 33. Following successful code execution, as depicted in Figure 34, the two top corners of the drafting page will be identified and highlighted with green dots. The image coordinates of these corners are displayed at the top of Figure 34. Additionally, the paper coordinates of both the pen's top and tip have been calculated and reported at the bottom of Figure 34.
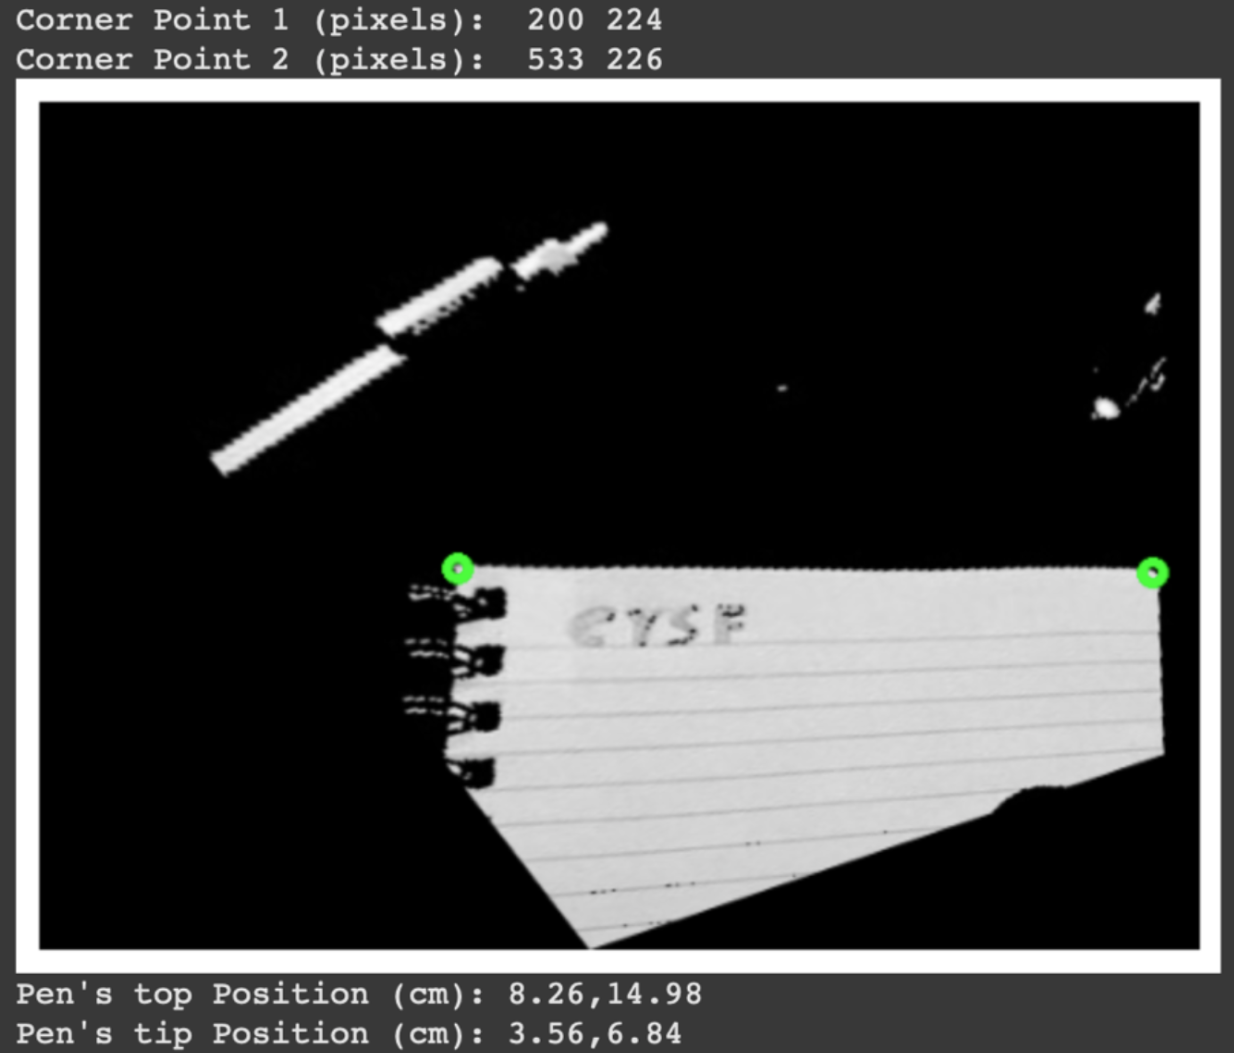
Figure 34. Successful identification of the top corner points (marked with green dots) of the drafting page and the calculated paper coordinates for both the top and tip of the pen.
4.3.6 Testing the accuracy of the pen tip’s position
The following experiment was conducted in a controlled setting to assess the accuracy of the pen tip's position. As explained below, the measurements were taken to minimize gyroscope angular drift (see Section 4.1), ensuring high accuracy in the pen's tilt throughout the experiment.
Materials
- Arduino Nano 33 IoT
- Arduino Nicla Vision (includes LSM6DSOXTR 3-axis gyroscope and 2MP GC2145 Color DVP Camera)
- Micro USB to USB-C cable and computer
- 1 Tanstic 12mm Chrome Steel Bearing Ball
Variables
- Independent: Angular drift readings from the gyroscope in 3 dimensions; the parameters of the drafting page (width, height, color); and the location of two corner points of the page.
- Dependent: the coordinates of the pen tip’s location (X, Y) on the drafting page
- Controlled: Gyroscope’s angular drift (using a protractor)
The prototype pen was placed at ten specified points on the drafting page depicted in Figure 1, whose locations were known. The coordinates (XR, YR) for these points were initially determined with a ruler. The coordinate system used has its origin at the top left corner of the page, with the X-axis running parallel to the top edge and the Y-axis parallel to the left edge. The coordinates for the ten points are listed in the second and third columns of Table 1.
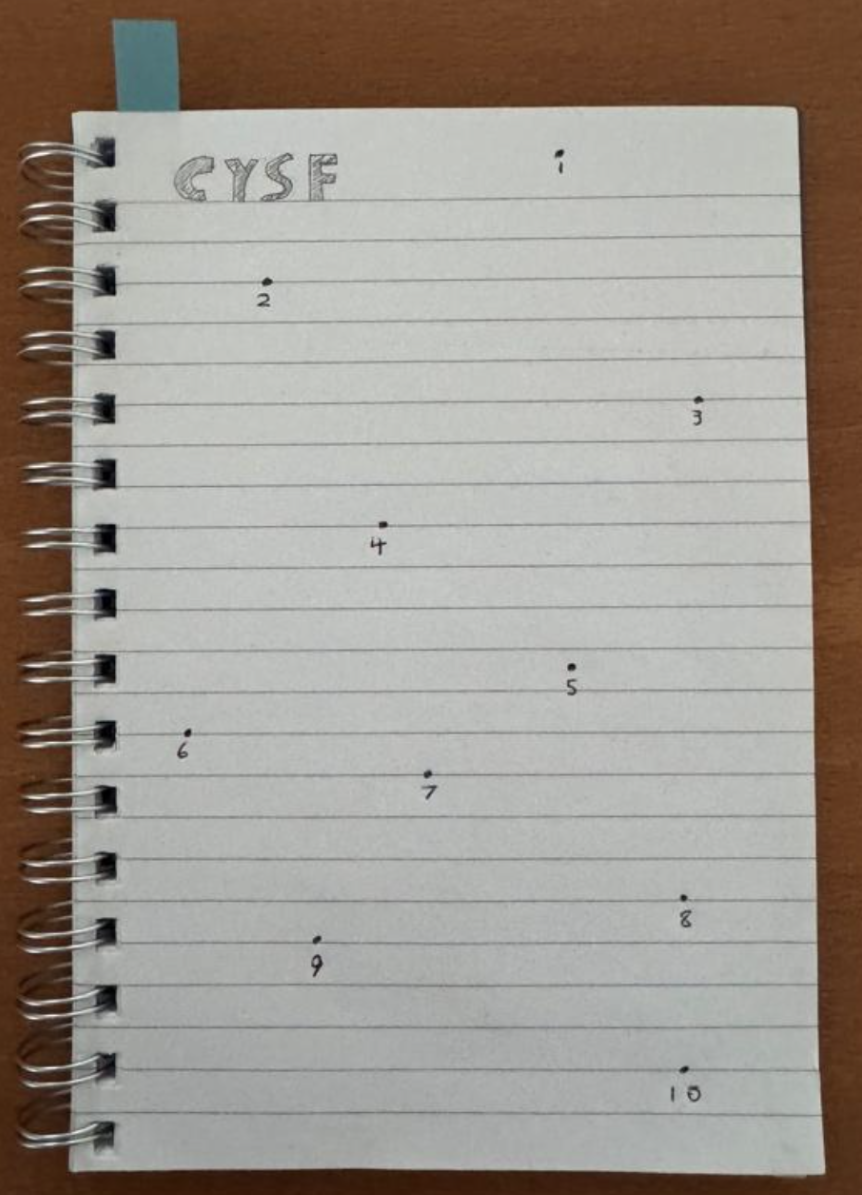
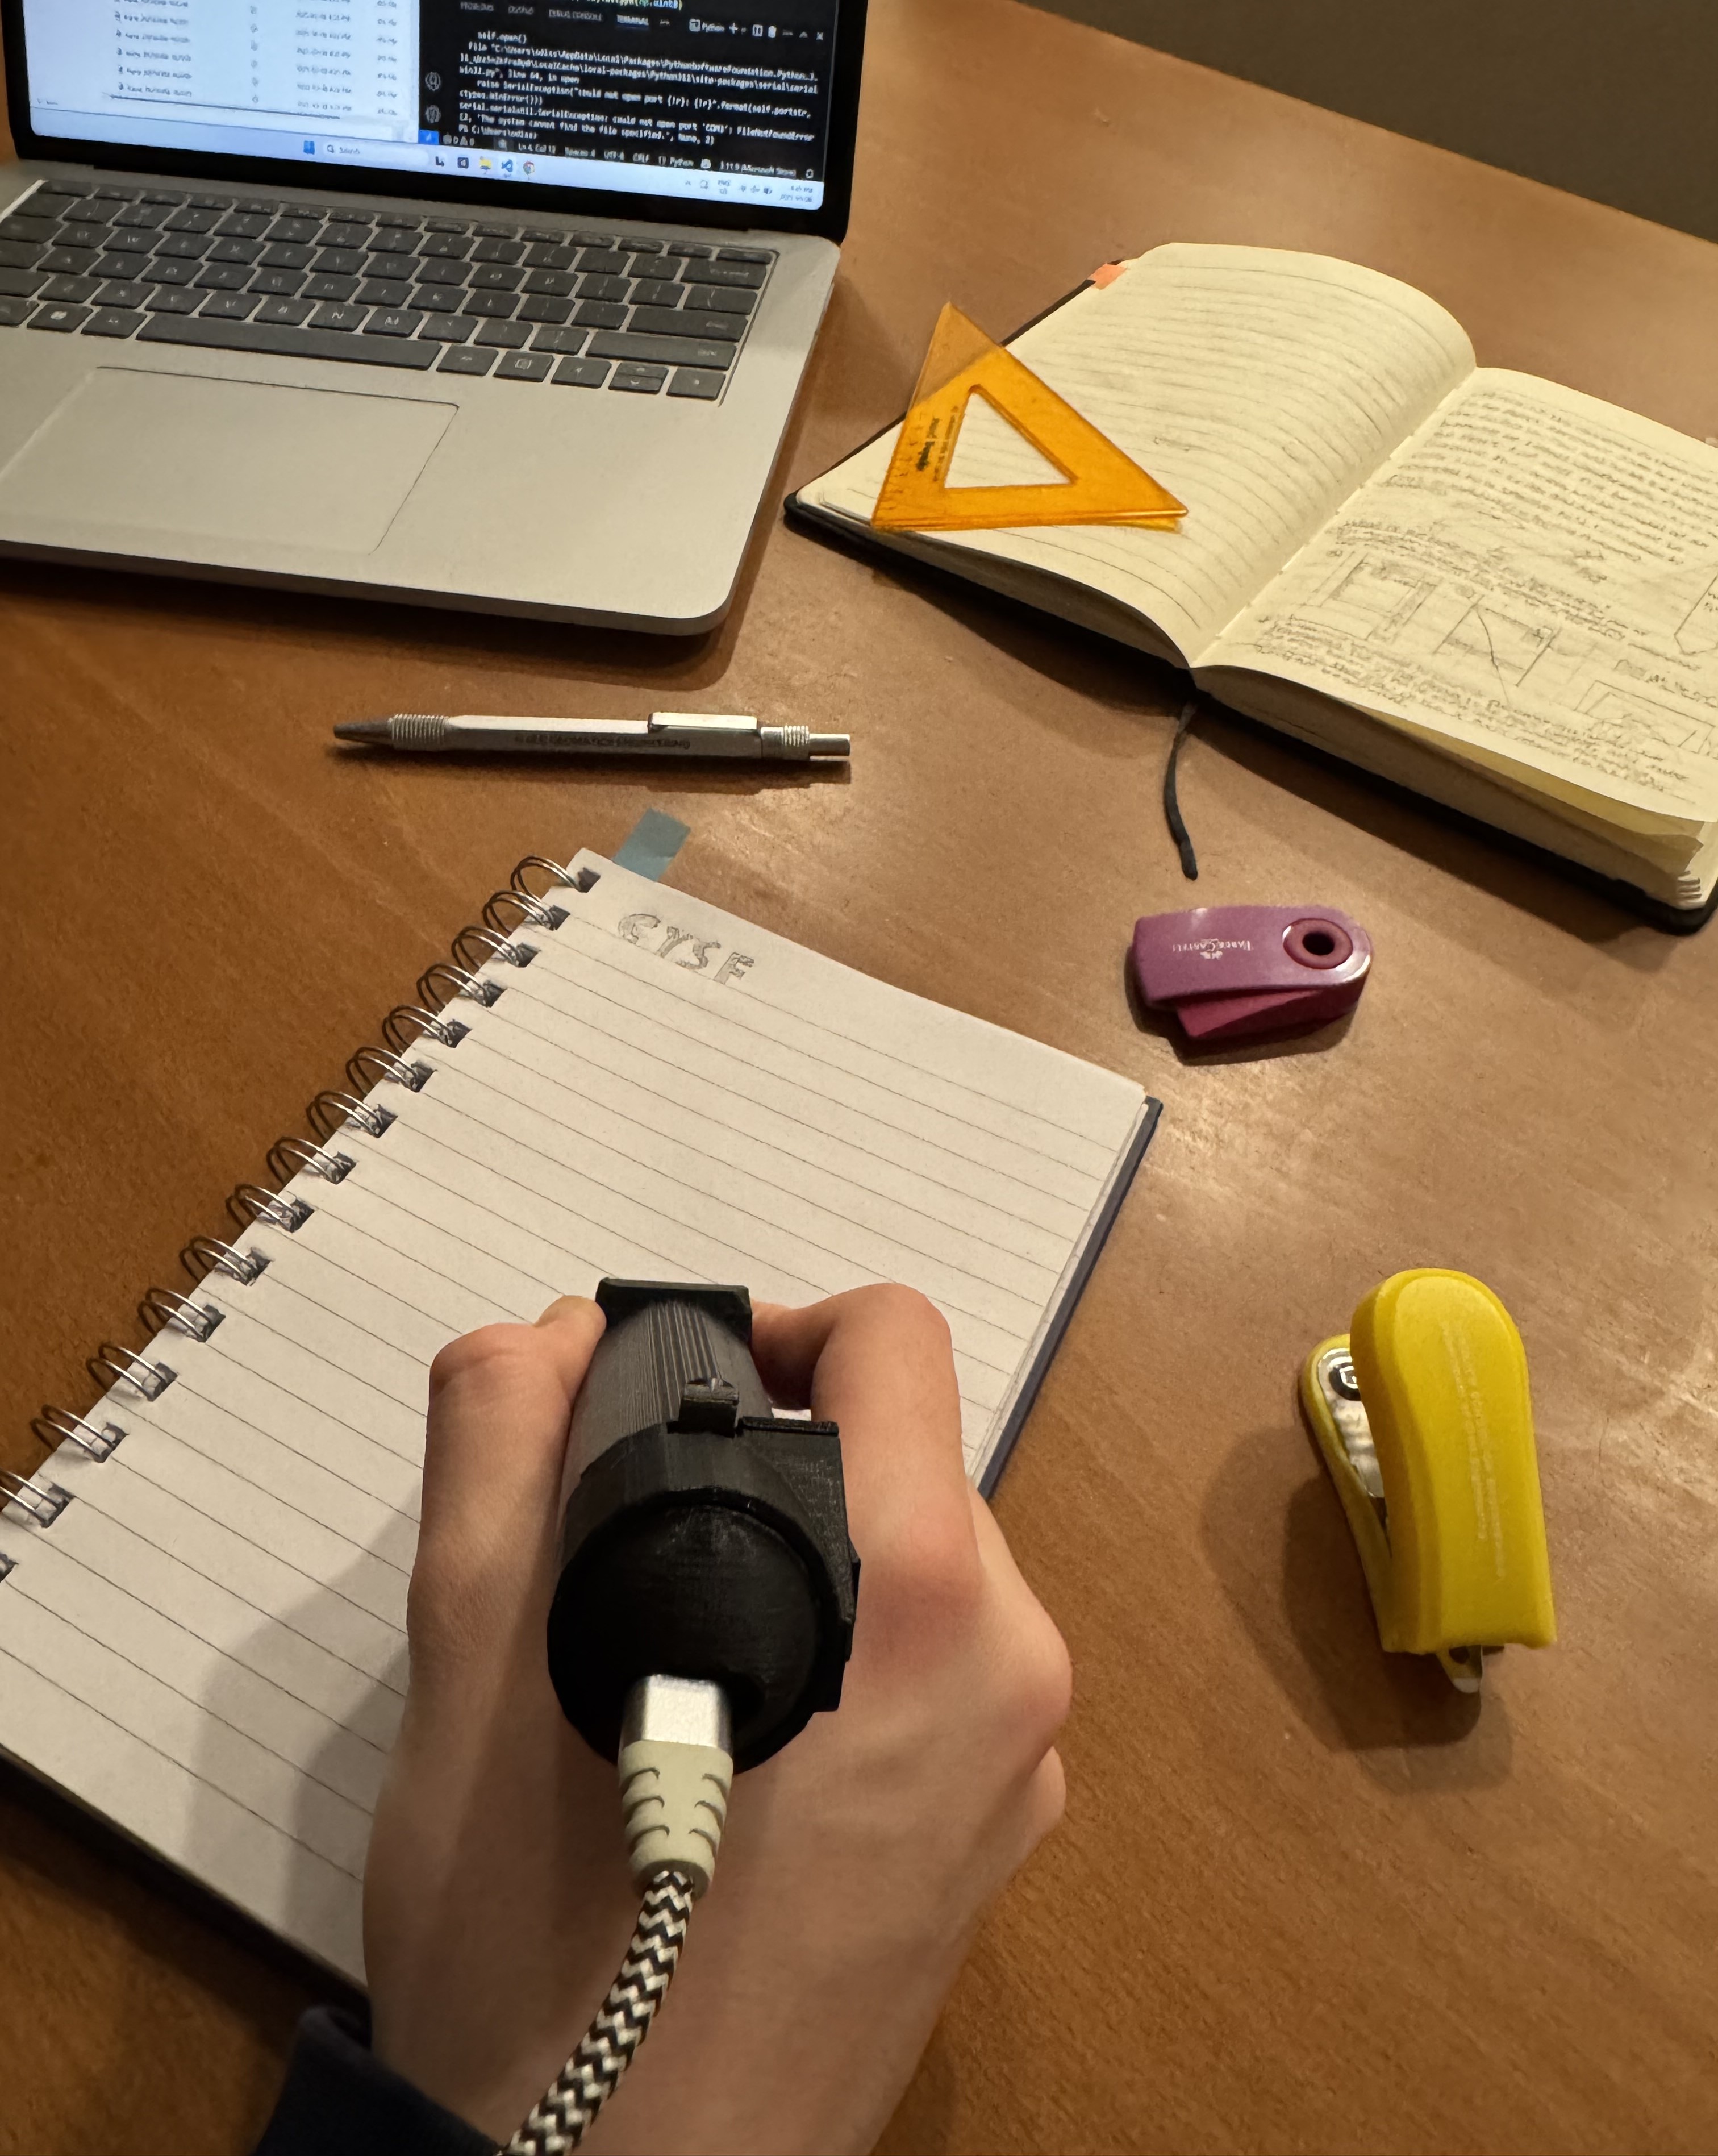
Figure 35. The drafting page used in the experiment (left). Ten points distributed across the page were used for testing. The top two corners of the page served as control points for the initialization (see Section 3.2.1). Placing the pen on a point (right).
Data Collection
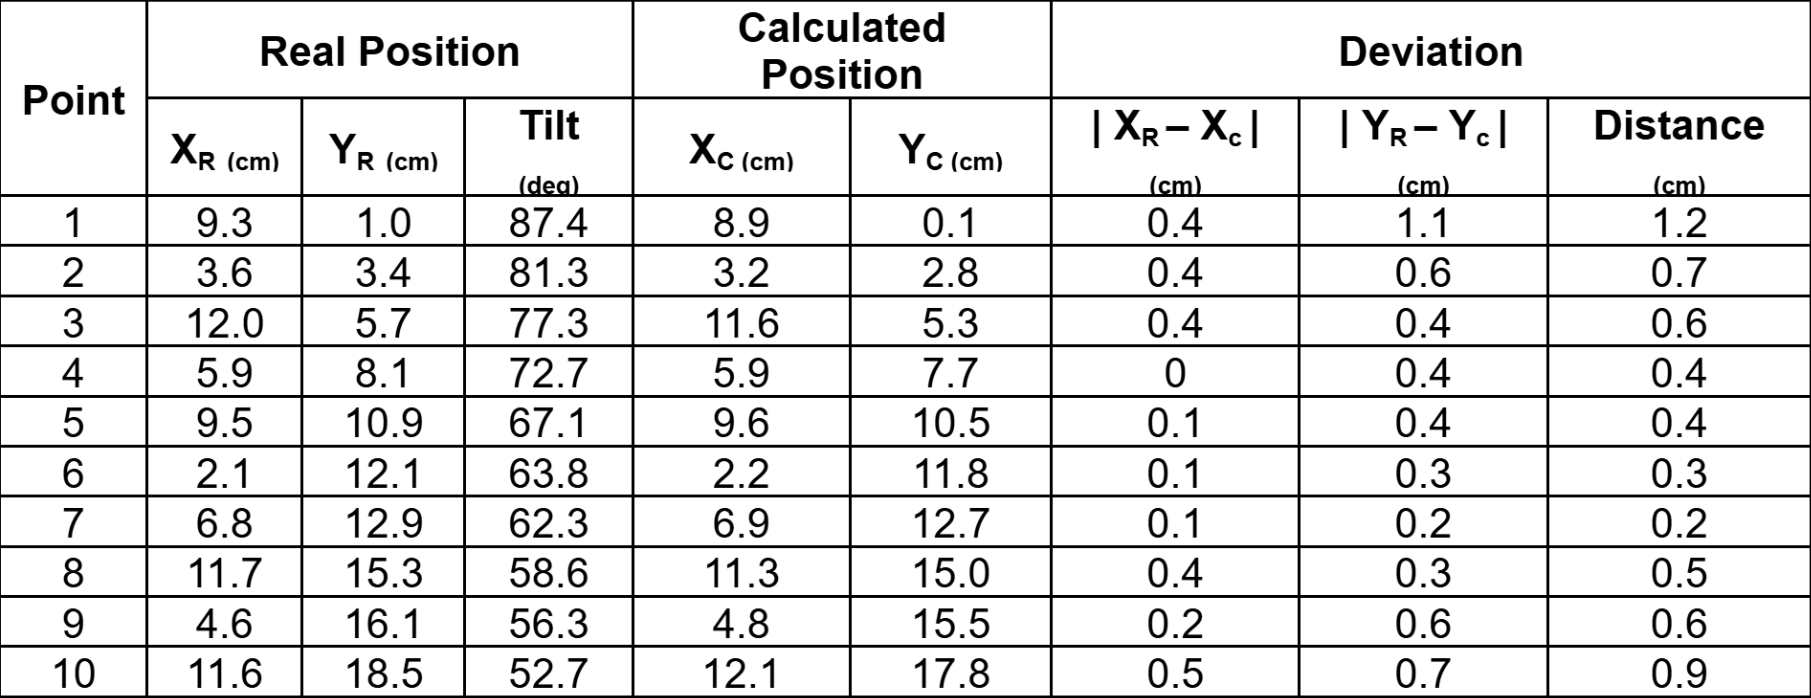
The pen was sequentially placed on each of the ten points. Before positioning the pen on a point, the gyroscope was initialized to minimize angular drift, and the pen was aligned such that its axis remained parallel to the Y-axis and perpendicular to the X-axis. The angular tilt of the pen from the page surface was recorded and used as an input parameter for processing the image captured by the pen's camera at the instance when the tip was positioned on the point. The tilt values (as listed in column 4 of Table 1) decrease as one moves toward the bottom of the page to ensure that the image consistently captures the two control points located at the top corners of the page.
The image, along with the tilt value, was processed by a Python script on an external computer device to determine the position of the pen's tip (Xc, Yc). The results of these calculations for all ten points are presented in columns 5 and 6 of Table 1.
Table 1. Experiment: Testing the Accuracy of Pen Tip Positioning for the 10 points in Figure 35.
Data Analysis
To assess the accuracy of the pen tip's position, the computed coordinates (Xc, Yc) were compared with the measured (real) coordinates (XR, YR). Columns 7 and 8 of Table 1 detail the differences for each coordinate of each point, while column 9 presents the displacement between the calculated and actual positions, expressed in centimeters.
The deviation in the position varies from 2 to 12 mm. The most accurate estimation of the pen tip’s position occurs in the middle of the page, with errors increasing towards the top and bottom of the page (Figure 36).
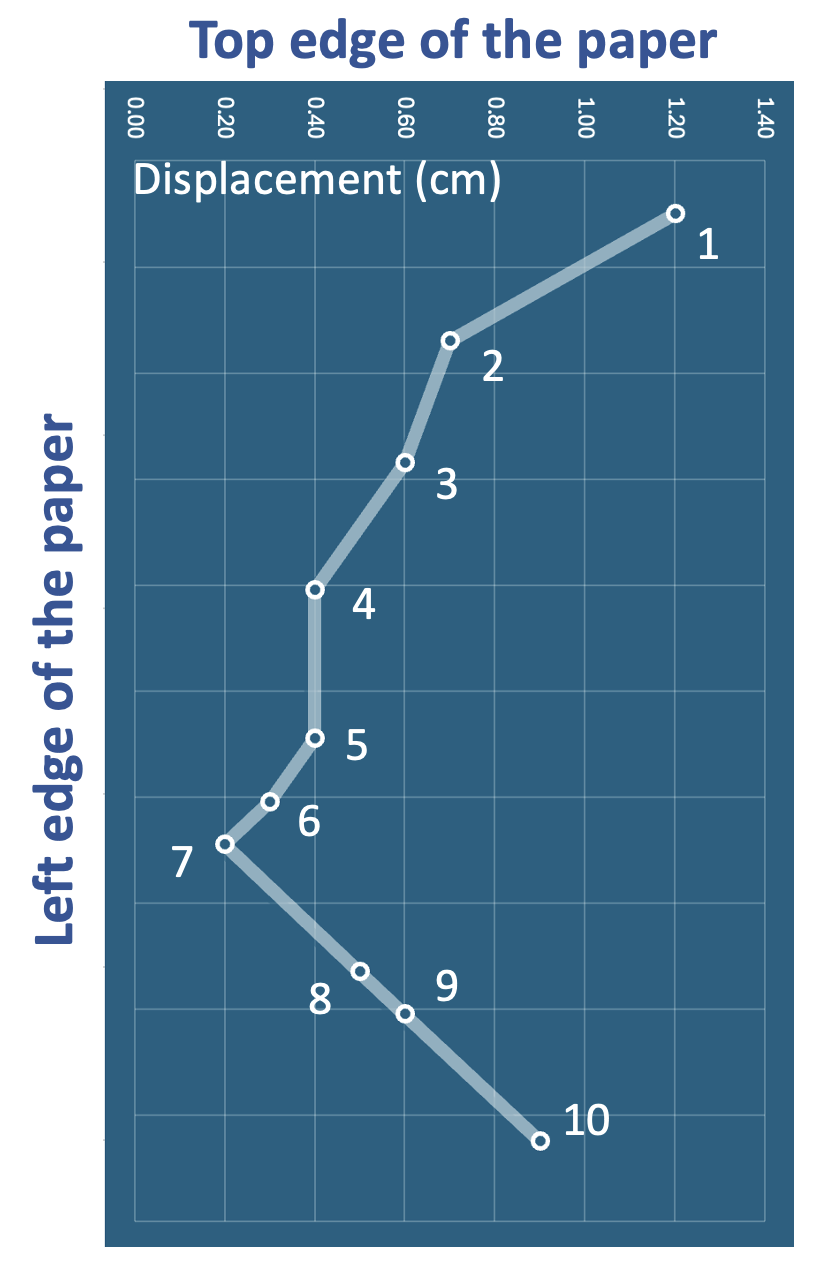
Figure 36. The deviation in the pen tip’s position varies from 2 to 12 mm, with lower values in the middle of the page.
4.3.7 Testing the accuracy of the pen tip’s position
The experiment was conducted in a controlled environment to measure a distance on a drafting page by tracking mouse cursor movements with an optical flow sensor. Due to the current optical flow sensor's inability to accurately detect trackball movements, the optical sensor was directly tested on the page, as described below.
Materials
- Arduino Nano 33 IoT
- Arduino Nicla Vision (includes LSM6DSOXTR 3-axis gyroscope)
- Micro USB to USB-C cable and computer running Python scripts to process data collected from the optical flow sensor and transmitted through the Arduino
- 1 Tanstic 12mm Chrome Steel Bearing Ball
- PAA5100JE Optical Tracking SPI Breakout
Variables
- Independent: images of the surface at a high frame rate and duration of movement (time)
- Dependent: distance traveled by the sensor on the drafting page
- Controlled: velocity of movement (constant)
Setup
A modified version of the prototype pen was employed, with the front part and trackball removed. This modification enables the optical flow sensor to directly view the drafting page, either perpendicularly or at a tilted angle, as illustrated in Figure 37.
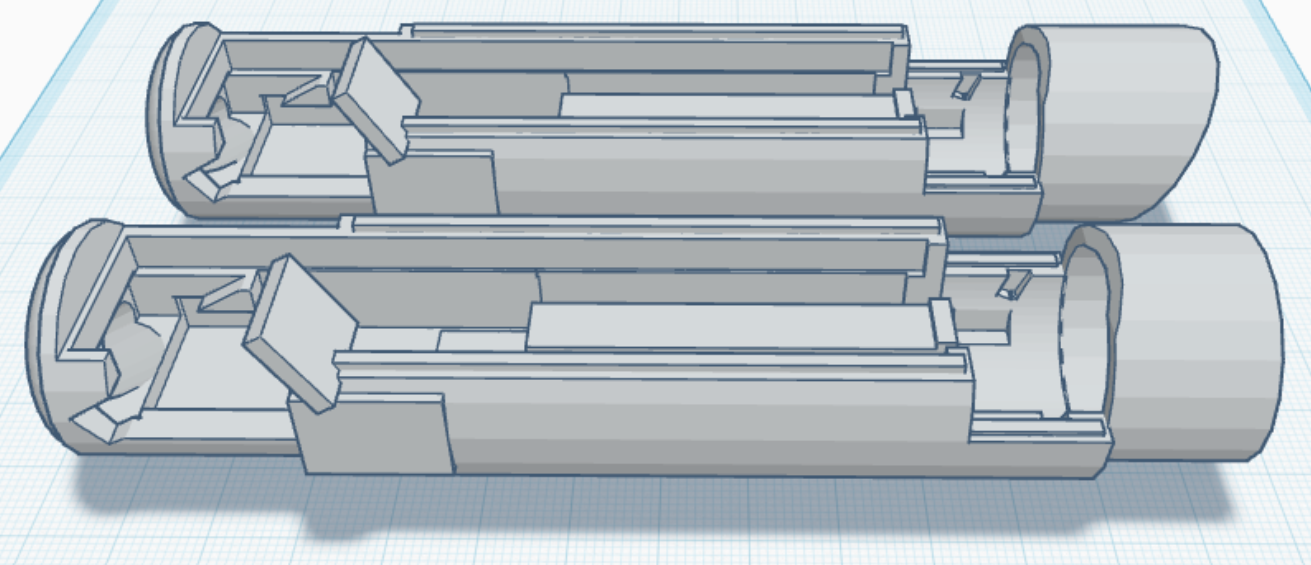
Figure 37. Variations of the prototype pen enable the optical flow sensor to directly view the drafting page, either perpendicularly (bottom) or at a tilted angle (up).
Data Collection
A circle with a radius of 5 centimeters (R = 5 cm) and a circumference of C = 2πR = 31.42 cm was traced on the drafting page, as shown in Figure 38a, using pen variations that maintained a consistent speed. The optical flow sensor gathered data, which were then sent to a computer via the Arduino for analysis with Python scripts. Figure 38b displays the digital representation of the drawn circle. The processing involved calculating the total length of the path traced by the pen (CT) based on the sequence of instant displacements of the optical flow sensor.
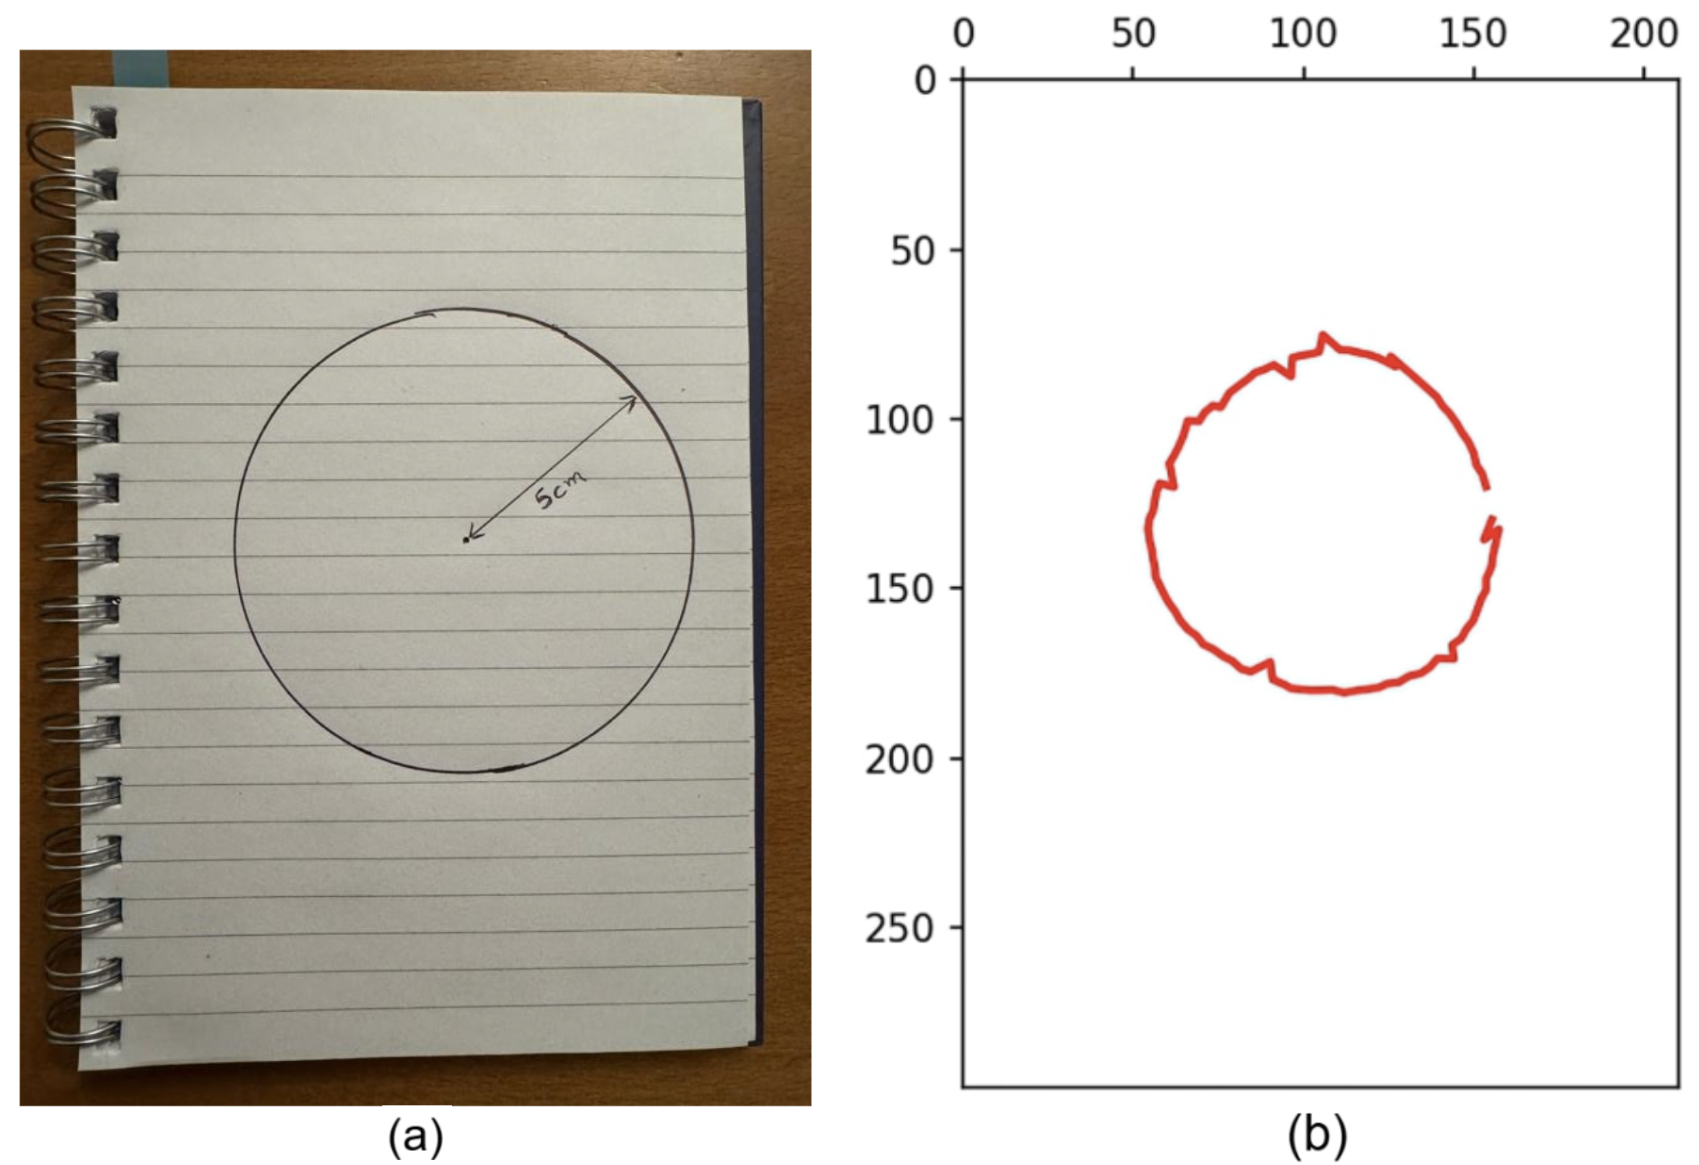
Figure 38. (a) A circle drawn on the drafting page (R=5cm; C = 2πR = 31.42 cm); and (b) the digital representation of the drawn circle (with an accumulated displacement equal to 31.7 cm; units of the graph in mm).
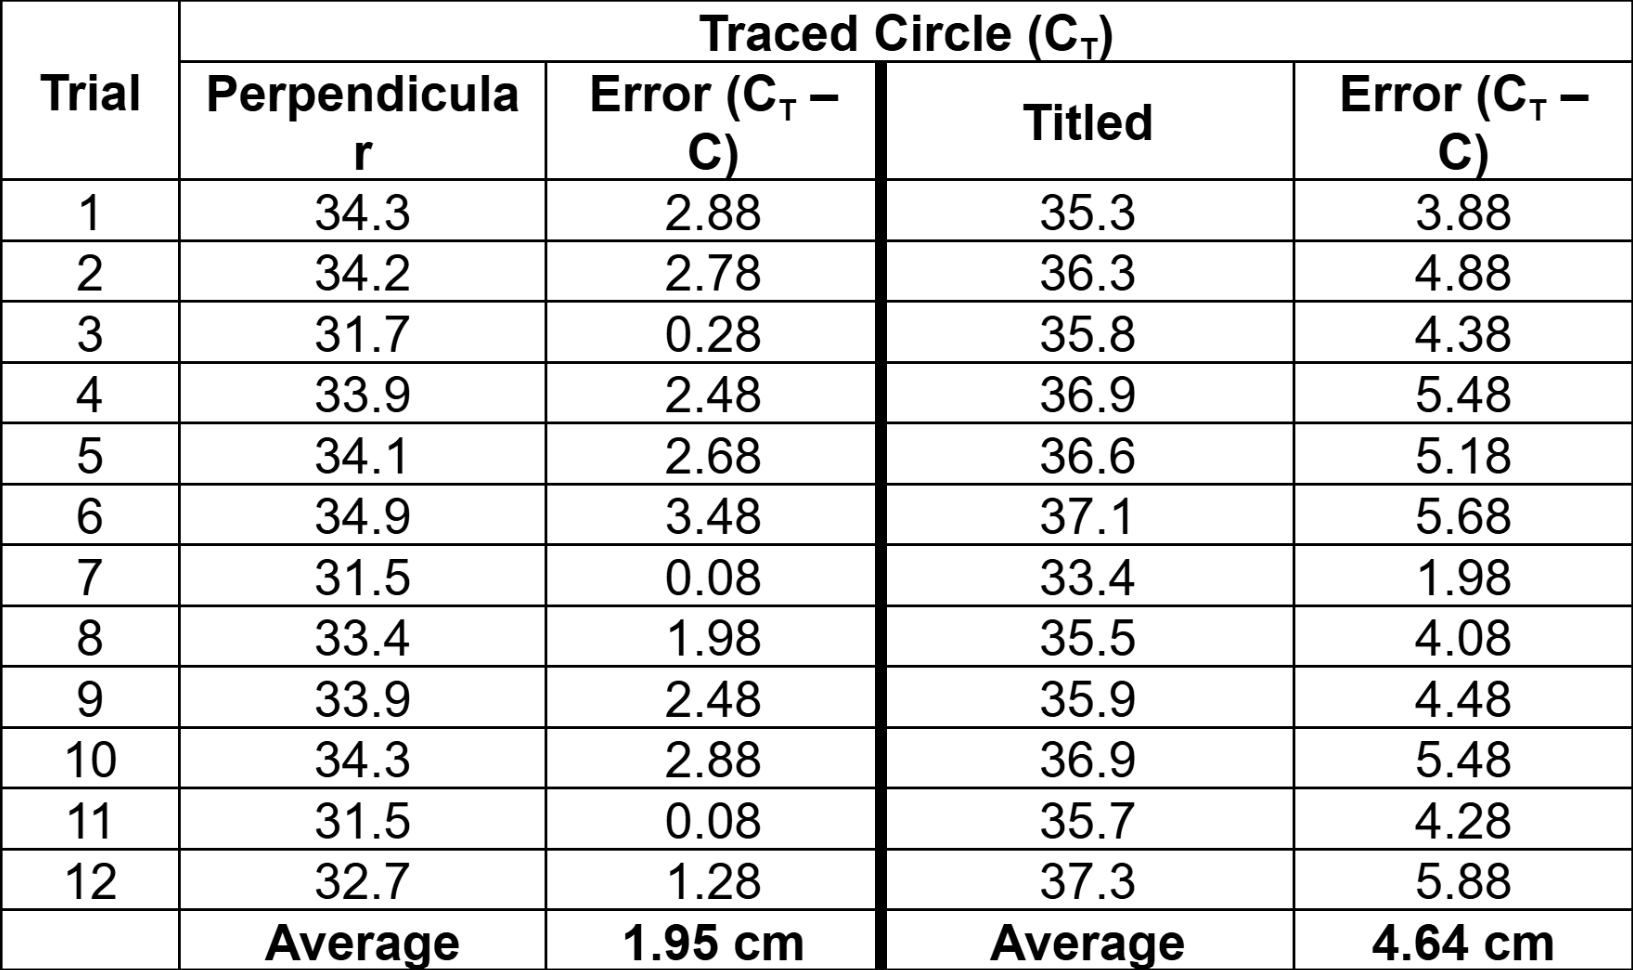
The experiment was conducted 12 times, with the results summarized in Table 2. Due to the inherent instability of human hand movement, the traced path, which typically resembles a curly line, will always be longer than the actual circumference of the circle on the drafting page.
Table 2. Experiment: Lenth of the circumference of the digital representation of the circle (CT) using the two pen variations in Figure 38.
Data Analysis
The data in Table 2 indicate that the optical flow sensor provides a reliable estimate of the circle's circumference, supporting the hypothesis that the pen can be used as a measuring tool for distance. The perpendicular alignment of the sensor demonstrates a clear superiority in measuring distances compared to the tilted configuration. This is because when the sensor is tilted, it struggles to accurately calculate the dimensions of the pixels and convert these into the corresponding distance displacements.
5. Risk and safety
Safety will be taken with utmost consideration during the manufacturing and disposal of the pen and its materials. To ensure a safe work environment, proper use and handling of equipment such as box cutters and soldering irons will strictly adhere to safety guidelines regarding precautions, personal protective equipment, and first aid measures [13][14]. Furthermore, all activities will be conducted in a closed environment, as such, proper ventilation will be a top priority, especially during soldering activities. Finally, materials requiring special disposal, such as batteries, wires, and plastics, will be recycled at local drop-off and recycling centers. Any remaining components that do not pose a risk will be disposed of in compliance with environmental standards and regulations [15].
Analysis
6. Challenges Encountered During Prototype Development
6.1 Handling RGB565 Data
The Arduino Nicla Vision is configured to capture images in RGB565 format, a 16-bit color format where each pixel is represented by two bytes. The code initializes the camera and sets it to capture images at a resolution of 320x240 pixels with a frame rate of 30 fps. The captured frames are then sent as raw binary data over the serial connection to the computer.
One of the main challenges in processing the raw data is ensuring the correct byte order for each pixel in the RGB565 format. In RGB565, each pixel is represented by two consecutive bytes:
-
The first byte contains the upper 5 bits of the red channel (R[4:0]) and the upper 3 bits of the green channel (G[5:3]).
-
The second byte contains the lower 3 bits of the green channel (G[2:0]) and the upper 5 bits of the blue channel (B[4:0]).
If the byte order is incorrect (e.g., the second byte is sent before the first), the color representation of the image will be distorted. This issue arises because the Arduino code currently sends the raw buffer without explicitly ensuring the correct byte order.
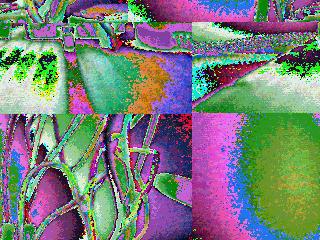
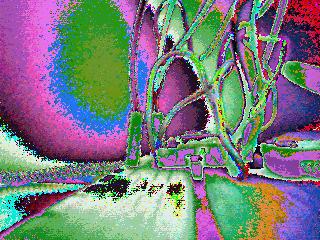
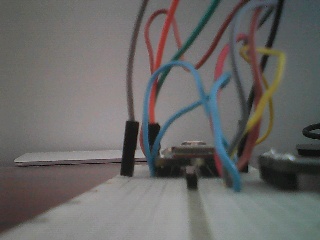
Figure 39. Examples of RGB565 Data Capture Issues (Left) Incorrect Color and Frame Mixing, (Middle) Color Distortion Only, (Right) Correct Data Capture
To address this issue, the code must ensure that the lower byte is sent first, followed by the higher byte. This is the typical order expected by most systems when interpreting RGB565 data.
Another challenge is that the image sometimes contained pixels from other frames due to data misalignment, so a terminator was added to the code to ensure proper frame separation and data integrity.
7. Implications
This project seeks to merge the benefits of digital technology and traditional handwriting, thereby fostering cognitive development and educational engagement. Furthermore, the pen facilitates online learning, particularly for students in remote communities, enabling instantaneous sharing and collaboration between peers and teachers [16].
The significance of this project extends beyond academic domains, including healthcare. The embedded gyroscope could efficiently detect movement abnormalities in the handwriting process and help early diagnosis or monitoring of patients with Parkinson’s disease or those recovering from severe head injury or a stroke [17][18][19]. Finally, the optical flow technology developed for the pen can serve as a precise measuring tool, enabling quick and accurate measurement of both circular and linear shapes. This capability makes it highly practical for manufacturing applications or as a convenient standalone product, particularly for measuring complex shapes that are difficult to assess with traditional tools.
7.1 Tremor Detection
The embedded gyroscope in the pen has the potential to detect tremors, which are involuntary, rhythmic movements often associated with neurological conditions such as Parkinson’s disease. By continuously measuring angular displacement while the pen is in use, the gyroscope can identify oscillations in hand movements characteristic of tremors. The gyroscope reads data every 50 milliseconds (equivalent to a sampling rate of 20 Hz), allowing for real-time monitoring of angular displacement (Figure 40). This data can be visualized on a graph, with time on the x-axis and angular displacement on the y-axis, clearly representing tremor severity and frequency.
Potential Applications
-
Early Diagnosis: The pen could help identify early signs of Parkinson’s disease or other tremor-related conditions by detecting subtle abnormalities in handwriting movements.
-
Monitoring Disease Progression: Regular use of the pen could track changes in tremor severity over time, providing valuable data for clinicians to assess the effectiveness of treatments or therapies.
-
Rehabilitation: For patients recovering from strokes or head injuries, the pen could monitor improvements in motor control and provide feedback to support rehabilitation efforts.
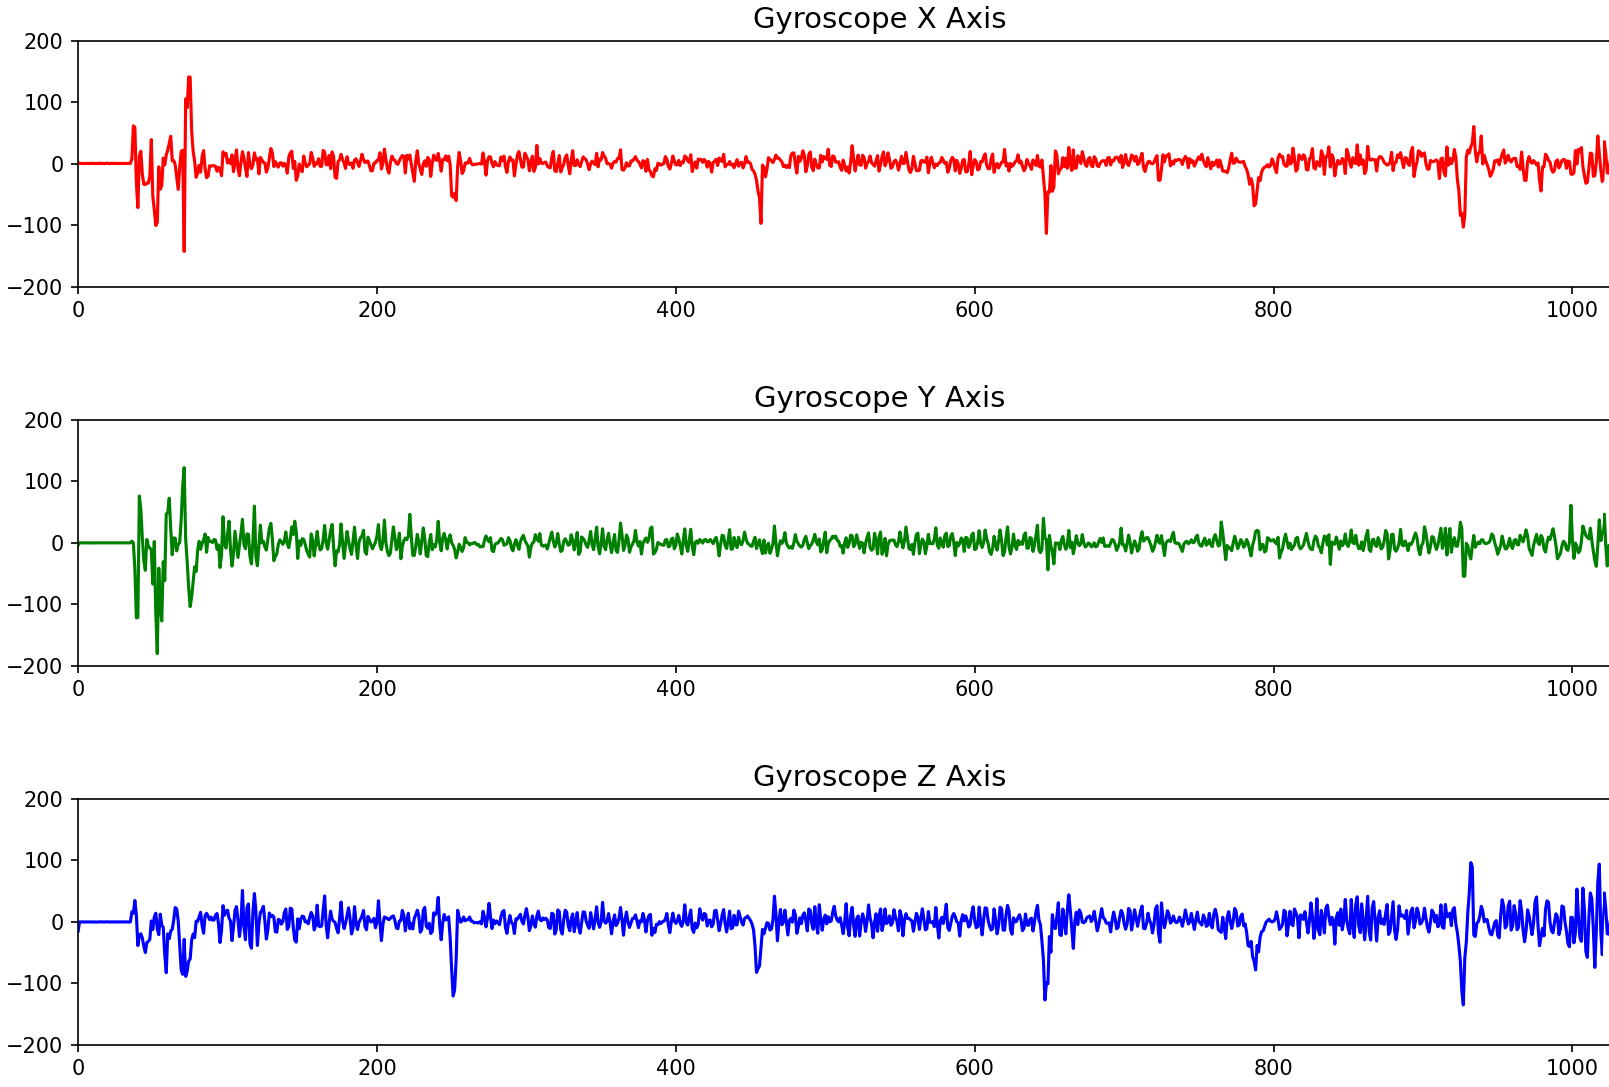
Figure 40. Gyroscope angular displacement measurements in all three axes for 50 seconds while writing
Due to ethical considerations surrounding human testing, particularly involving individuals with tremor-related conditions, this feature could not be tested or validated in real-world scenarios. Future work could focus on establishing partnerships with medical institutions and obtaining the necessary ethical clearances to test and refine the tremor detection capabilities of the pen in a controlled and responsible manner.
8. Limitations
8.1 Positioning error
Though sensors embedded in the pen can provide accurate measurements, they have some limitations that can lead to random or systematic errors. The digital gyroscope requires a sporadic initialization as bias instability or noise could cause a significant angular drift [20][21].
To address this issue, I implemented a tolerance mechanism that accounts for instances where the pen's displacement measurement remains within a 2-degree range for more than 5 seconds.
In addition, image processing algorithms may become unreliable when light conditions deviate from those present at the initialization phase or when there is low contrast between the drafting page and other adjacent items. The pen’s camera relies on sufficient contrast between the drafting page and the surrounding environment to accurately detect and process the page’s edges and corner points. In scenarios where the drafting page has a white or light-colored background with minimal contrast against adjacent surfaces (e.g., a white desk or light-colored table), the image segmentation algorithms may struggle to distinguish the page from its surroundings. While the subsequent steps, such as corner detection and contour extraction, typically function as intended because contours still exist, the initial segmentation errors caused by low contrast can lead to a drop in performance.
To minimize this issue, the initialized color range is set to 100 units greater than the measured value during initialization, ensuring a broader tolerance for variations in lighting and contrast so that the subsequent image processing steps can function reliably.
It is important to note that the optical flow sensor is unaffected by low contrast, as it operates in a closed environment with its own dedicated lighting. To mitigate the camera’s contrast-related issues, users should write in an environment where the paper is a slightly different color from the background and ensure adequate lighting.
8.2 Moving the drafting page
The initialization of the gyroscope sets the angular origin parallel to the direction of the relative left or right edges of the drafting page (Figure 3a). It is assumed that the drafting page will remain stationary during handwriting. Should the page move, the pen must be re-initialized. An external sensor connected to the page could prevent this re-initialization; however, integrating such a sensor goes beyond the scope of this proposal.
8.3 Battery’s capacity
The pen incorporates multiple high-refresh-rate sensors and a microcontroller for data processing and wireless communication, leading to substantial battery depletion. A high-capacity battery could mitigate the need for frequent recharging. However, this may result in increased size and weight of the pen, compromising ergonomics. An effective alternative is to introduce an automatic power saver when the pen is idle, increasing the battery’s overall lifespan.
8.4 Optical flow
The optical flow sensor’s performance is influenced by the size and curvature of the ball it tracks. As the ball becomes smaller, its curvature increases, which reduces the sensor’s ability to detect motion accurately. This is because optical flow relies on tracking patterns and textures on a surface, and higher curvature distorts these patterns, making it harder for the sensor to compute displacement.
Conclusion
9. Conclusion
In conclusion, this project successfully addresses the research question by demonstrating the feasibility of a pen that digitizes handwritten notes in real time without external components. The design integrates low-cost sensors and efficient algorithms to digitize handwriting accurately, thereby combining the cognitive benefits of traditional writing with digital convenience. A prototype pen was developed and tested in a controlled environment to demonstrate a proof of concept. Current efforts are focused on enhancing both the hardware and software components to progressively improve the pen's efficiency and reliability in more realistic, non-controlled settings.
Future developments in implementing my concepts can be classified into short and long-term tasks.
Short-term tasks include:
- Enhance the design and 3D print of the pen to reduce surface roughness and minimize the friction between the pen’s ball and the frame, ensuring smoother rotations that are easier to track.
-Conduct experimental work to further refine the hardware and software for managing gyroscope angular drift over time and reducing contrast sensitivity between the drafting page and its surroundings, potentially using LiDAR as it provides reliable spatial data unaffected by lighting or surface contrast.
- Employ more precise hardware components, such as a more accurate gyroscope, since the Nicla Vision does not specialize in this area, while maintaining overall cost-effectiveness.
Long-term tasks include:
- Design a pen that incorporates custom hardware components (see Section 3.1), and establish a flawless execution of the positioning.
- Testing, validation, and commercialization of the final product.
Citations
References
[1] Mueller, P.A., Oppenheimer, D.M. (2014) The Pen Is Mightier Than the Keyboard: Advantages of Longhand Over Laptop Note Taking. Psychological Science Online. SAGE. https://doi.org/10.1177/0956797614524581 [Visited on 14 June 2024]
[2] Luckhurst, S. (2018) Livescribe Smartpen: The pen will always be mightier than the keyboard. Arts Computing Office Newsletter. University of Waterloo. https://uwaterloo.ca/arts-computing-newsletter/spring-2018/spring-2018/livescribe-smartpen [Visited on 7 June 2024]
[3] Sadekar, K. (2023) Camera Calibration: Understanding Lens Distortion. OpenCV. https://learnopencv.com/understanding-lens-distortion/ [Visited on 7 June 2023]
[4] random_walker() https://scikit-image.org/docs/stable/auto_examples/segmentation/plot_ random_walker_segmentation.html#random-walker-segmentation [Visited on 23 July 2024]
[5] OpenCV Library https://pypi.org/project/opencv-python/ [Visited on 23 July 2024]
[6] CornerHarris() https://docs.opencv.org/4.x/dc/d0d/tutorial_py_features_harris.html [Visited on 23 July 2024]
[7] Slama, C.C., Theurer, C., and Hendrikson, S.W. (Eds) (1980) Manual of Photogrammetry. 4th Edition, American Society of Photogrammetry, Falls Church, Va.
[8] WarpPerspective() https://docs.opencv.org/4.x/da/d54/group__imgproc__transform.html [Visited on 24 July 2024]
[9] Ng, T.W. (2003) The optical mouse as a two-dimensional displacement sensor. Sensors and Actuators A: Physical, 107(1) , pp. 21-25. Elsevier. http://doi.org/10.1016/S0924-4247(03)00256-5 [Visited on 3 October 2024]
[10] Arduino Nicla Vision ABX00052 https://docs.arduino.cc/tutorials/nicla-vision/user-manual/ [Visited on 4 October 2024]
[11] GY-271 HMX5883L Compass Magnetometer https://handsontec.com/dataspecs/sensor/GY-271%20HMC5883L.pdf [Visited on 8 December 2024]
[12] OpenMV IDE https://openmv.io/ [Visited on 9 December 2024]
[13] Box Cutter Safety, Environmental Health and Safety, University of Washington. https://www.ehs.washington.edu/system/files/resources/Box-cutter-safety.pdf [Visited on: Visited on 8 December 2024]
[14] Soldering Safety, Department of Engineering Health and Safety, University of Cambridge https://safety.eng.cam.ac.uk/safe-working/copy_of_soldering-safety [Visited on 8 December 2024]
[15] Inspiring a future without waste. Alberta Recycling Management Authority. https://www.albertarecycling.ca [Visited on 8 December 2024]
[16] Layton, J. (2024) Distance as a Factor for First Nations, Métis, and Inuit High School Completion. Education, learning, and training: Research Paper Series, Statistics Canada. https://www150.statcan.gc.ca/n1/pub/81-595-m/81-595-m2023002-eng.htm [Visited on 9 December 2024]
[17] Lees, A.J., (2022) How Handwriting Analysis Helps Diagnose Parkinson's Disease.The value of a pen and pencil in neurology. Psychology Today. 21 Jan 2022. https://www.psychologytoday.com/ca/blog/brainspotting/202201/how-handwriting-analysis-helps-diagnose-parkinsons-disease [Visited on 9 December 2024]
[18] Adhavi Shri, A.S., Praveen Kumar, S., and Aravind, T. (2013) Design of Mems Gyroscope to detect and monitor Parkinson's disease - A study. International Conference on Smart Structures and Systems (ICSSS'13), IEEE Explore, pp. 77-81, doi: 10.1109/ICSSS.2013.6623005
[19] San-Segundo, R., Zhang, A., Cebulla, A., Panev, S., Tabor, G., Stebbins, K., Massa, R.E., Whitford, A., de la Torre, F., Hodgins, J.(2020) Parkinson’s Disease Tremor Detection in the Wild Using Wearable Accelerometers. Sensors 20, 5817. https://doi.org/10.3390/s20205817
[20] Fraden, J. (2015) Handbook of Modern Sensors: Physics, Designs, and Applications. 5th edition. Springer.
[21] Encyclopaedia Britannica (Eds) (2023) Gyroscope, Britannica https://www.britannica.com/technology/gyroscope [Visited on 7 June 2023]
[22] Arduino IDE, https://www.arduino.cc/en/software [Visited on 19 March 2025]
[23] Visual Studio Code, https://code.visualstudio.com/ [Visited on 19 March 2025]
[24] TorontoU (2011) Optical Flow Estimation, CSC2503: Foundations of Computational Vision (Fall 2011), University of Toronto, https://www.cs.toronto.edu/~fleet/courses/2503/fall11/Handouts/opticalFlow.pdf [Visited on 19 March 2025]
[25] Autodesk Tinkered, https://www.tinkercad.com [Visited on 19 March 2025]
[26] Arduino Nano 33 IoT, https://store.arduino.cc/products/arduino-nano-33-iot?srsltid=AfmBOorXTflCI1J7RoQWS-sKMfIsBOMGslTfp8F2glpNiorDvC-heUjG [Visited on 19 March 2025]
[27] Pimoroni, PAA5100JE Near Optical Flow SPI Breakout, https://shop.pimoroni.com/products/paa5100je-optical-tracking-spi-breakout?variant=39315330170963 [Visited 19 on March 2025]
[28] Steel Balls, Tanstic 330Pcs 16 Size Metric Precision 304 Stainless Steel Bearing Steel Ball Assortment https://www.amazon.ca/dp/B09C1J2JPS?ref=ppx_yo2ov_dt_b_fed_asin_title [Visited on 20 January 2025]
[29] RASWLF.031 1OZ, https://www.digikey.ca/en/products/detail/chip-quik-inc/RASWLF-031-1OZ/9681997 [Visited on 19 January 2025]
Acknowledgement
I would like to acknowledge Pantelis Stefanakis, Electrical and Computer Engineer for his advice and support throughout my project. His support included helping me validate my research and find effective experimental methods to test the prototype. Thank you to Spiros Ratsiatos, Computer Scientist for walking me through the programming tools used in this project and the debugging of my programming scripts. Finally, I would like to thank George Tritakis, Medical Doctor for his insights on the potential implications of my project in healthcare and safety practices.