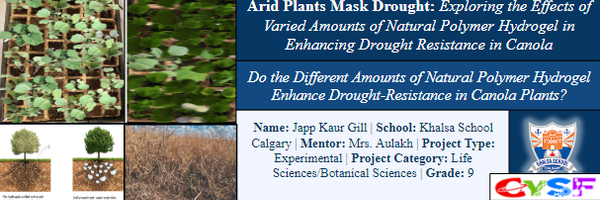
Arid Plants Mask Drought: Exploring the Effects of Varied Amounts of Natural Polymer Hydrogel in Enhancing Drought Resistance in Canola
Japp Kaur Gill
Grade 9
Presentation
Hypothesis
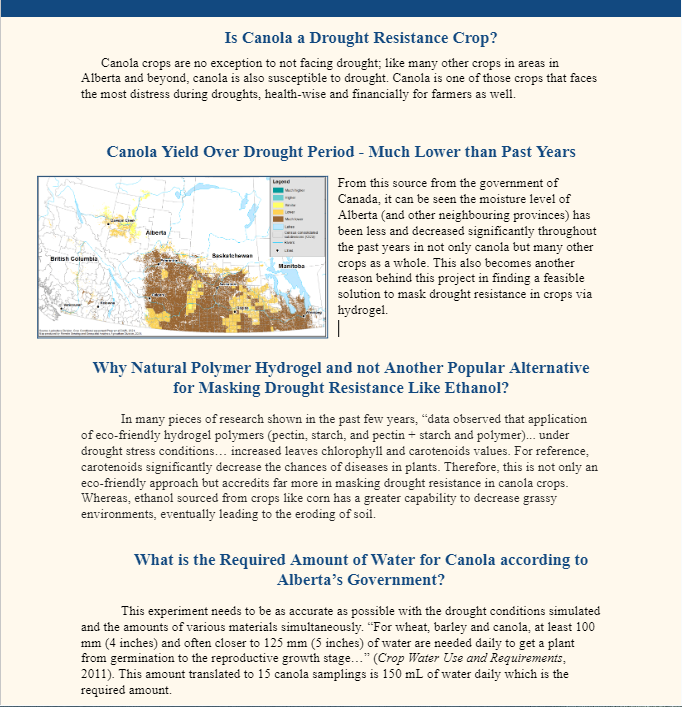
Based on a recent study, “Lignin-based hydrogel alleviates drought stress in maize,” it was suggested that hydrogel could be used as a “soil additive to increase water availability to crops experiencing drought stress that will not release undesirable byproducts” (Mazloom et al., 2020). With the current state of canola, especially in Southwestern Alberta, “Recent… arid conditions in Western Canada have led to catastrophic yield losses of canola…” (Generation of Canola Lines with Increased Heat and Drought Tolerance by Regulating Phospholipid: Diacylglycerol Acyltransferase Activity, n.d.). This is where hydrogel enhances drought resistance since “hydrogel may prove as a convenient and eco-friendly feasible option to achieve the goal of crop productivity under conditions of water scarcity” (Yadav & Kumar, 2023). By augmenting the rate of photosynthesis (one of the factors that determines drought resistance) and other metrics e.g. length/number of leaves, average height, R.W.C., and photosynthetic flotation measures drought resistance in a conceptualized idea that they all show a plant’s productivity under water stress. The recommended application of hydrogel is 2580mg/1030 cm3 which is my hypothesis as “for almost all types of crops to soil type and climate of the country, a meagre application rate of hydrogel i.e. 2.5-5.0 Kg/ha is effective” (Yadav & Kumar, 2023). This is my hypothesis for the most effective amount of hydrogel to ask for drought resistance. In response to these metrics, it is hypothesized that a 2580 mg section/grow tray with the applied hydrogel will have an R.W.C. (leaf relative water content - in %) that will lie in between or be equivalent to the average R.W.C. of canola plants, the average root length will be higher than 5 cm, the average height will be higher than the rest of the samples (estimated < 6), the photosynthetic flotation will lie in between 7-13 minutes (average for canola). Hence, these conclusions are made to the hypothesized amount of hydrogel that will enhance drought resistance the most: 2580 mg:1030 cubic cm.
Research
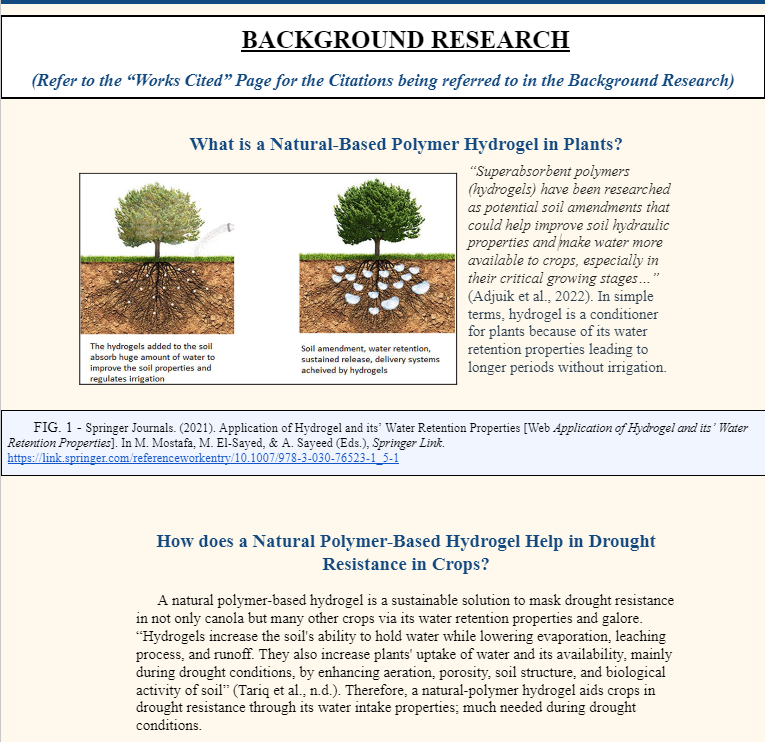
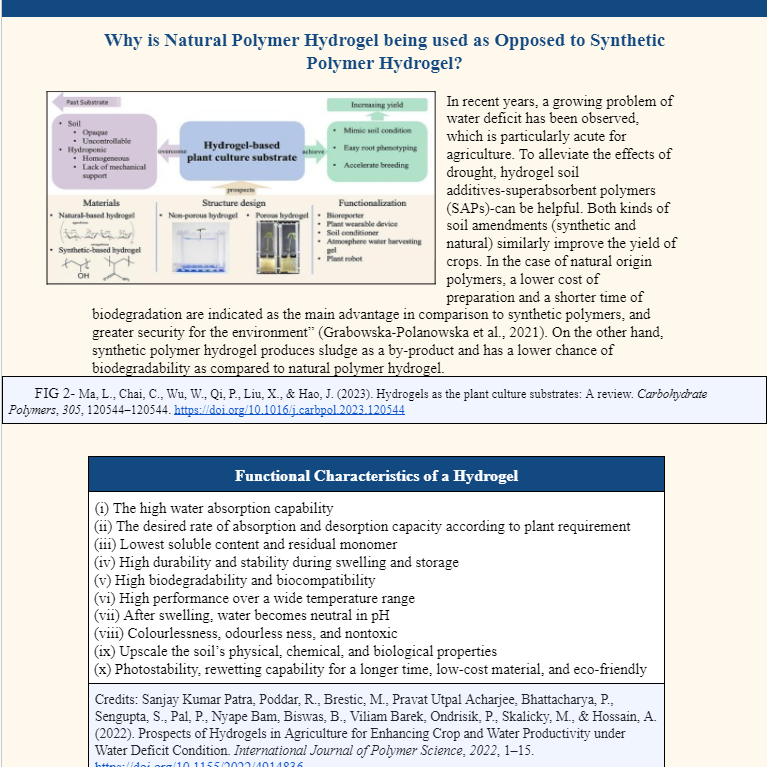
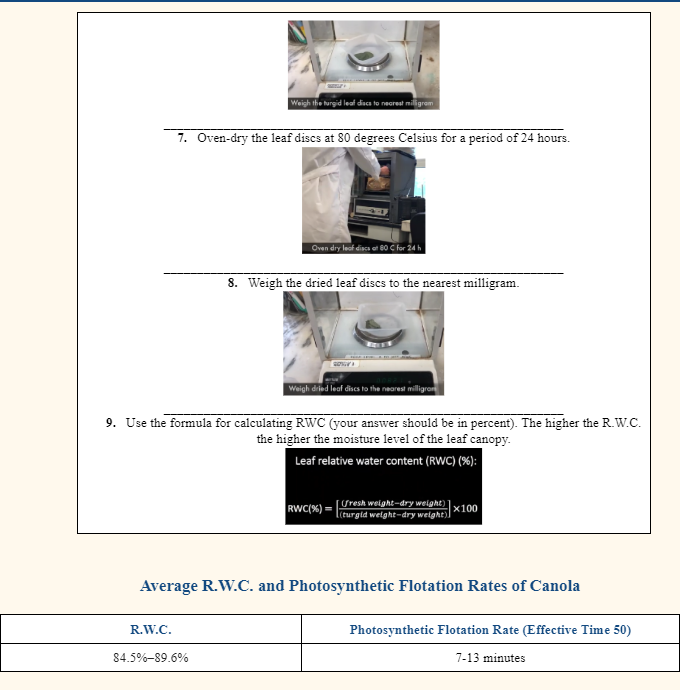
BACKGROUND RESEARCH(Refer to the “Works Cited” Page for the Citations being referred to in the Background Research) |
Variables
Procedure
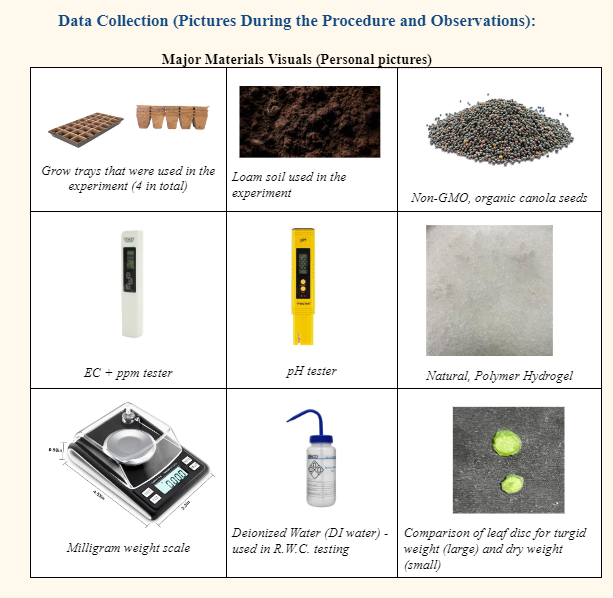
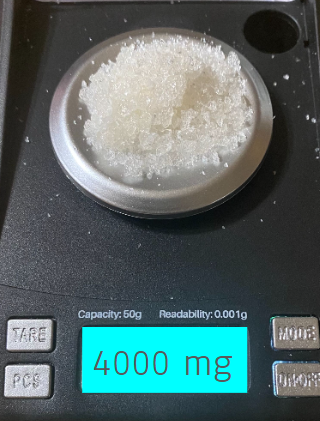
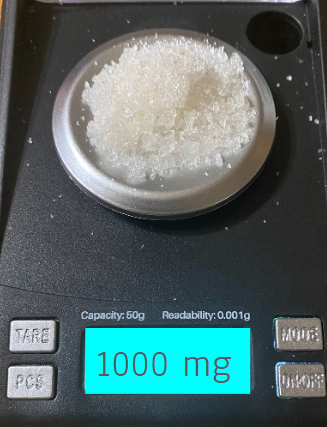
Major Materials Visuals (Personal photographs)
Procedure:
Observations
Observations/Data Collection
|
Day # |
Observation during the Respective Day |
||||||||||||||||||||||||||||||||||||||||||
|
Qualitative Data (Photographs) |
Qualitative Data (Description of Observations on Respective Day with Average Height - height of all 24 trials can be seen in the quantitative data/logbook/graph page in the lab report and other metrics) |
||||||||||||||||||||||||||||||||||||||||||
|
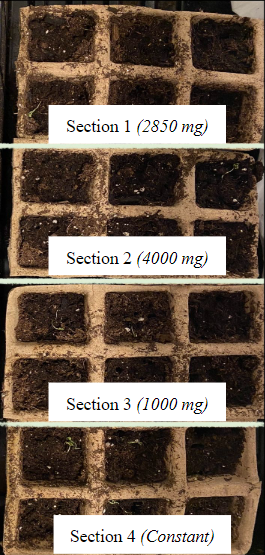
Germination Period (1 Day) |
|
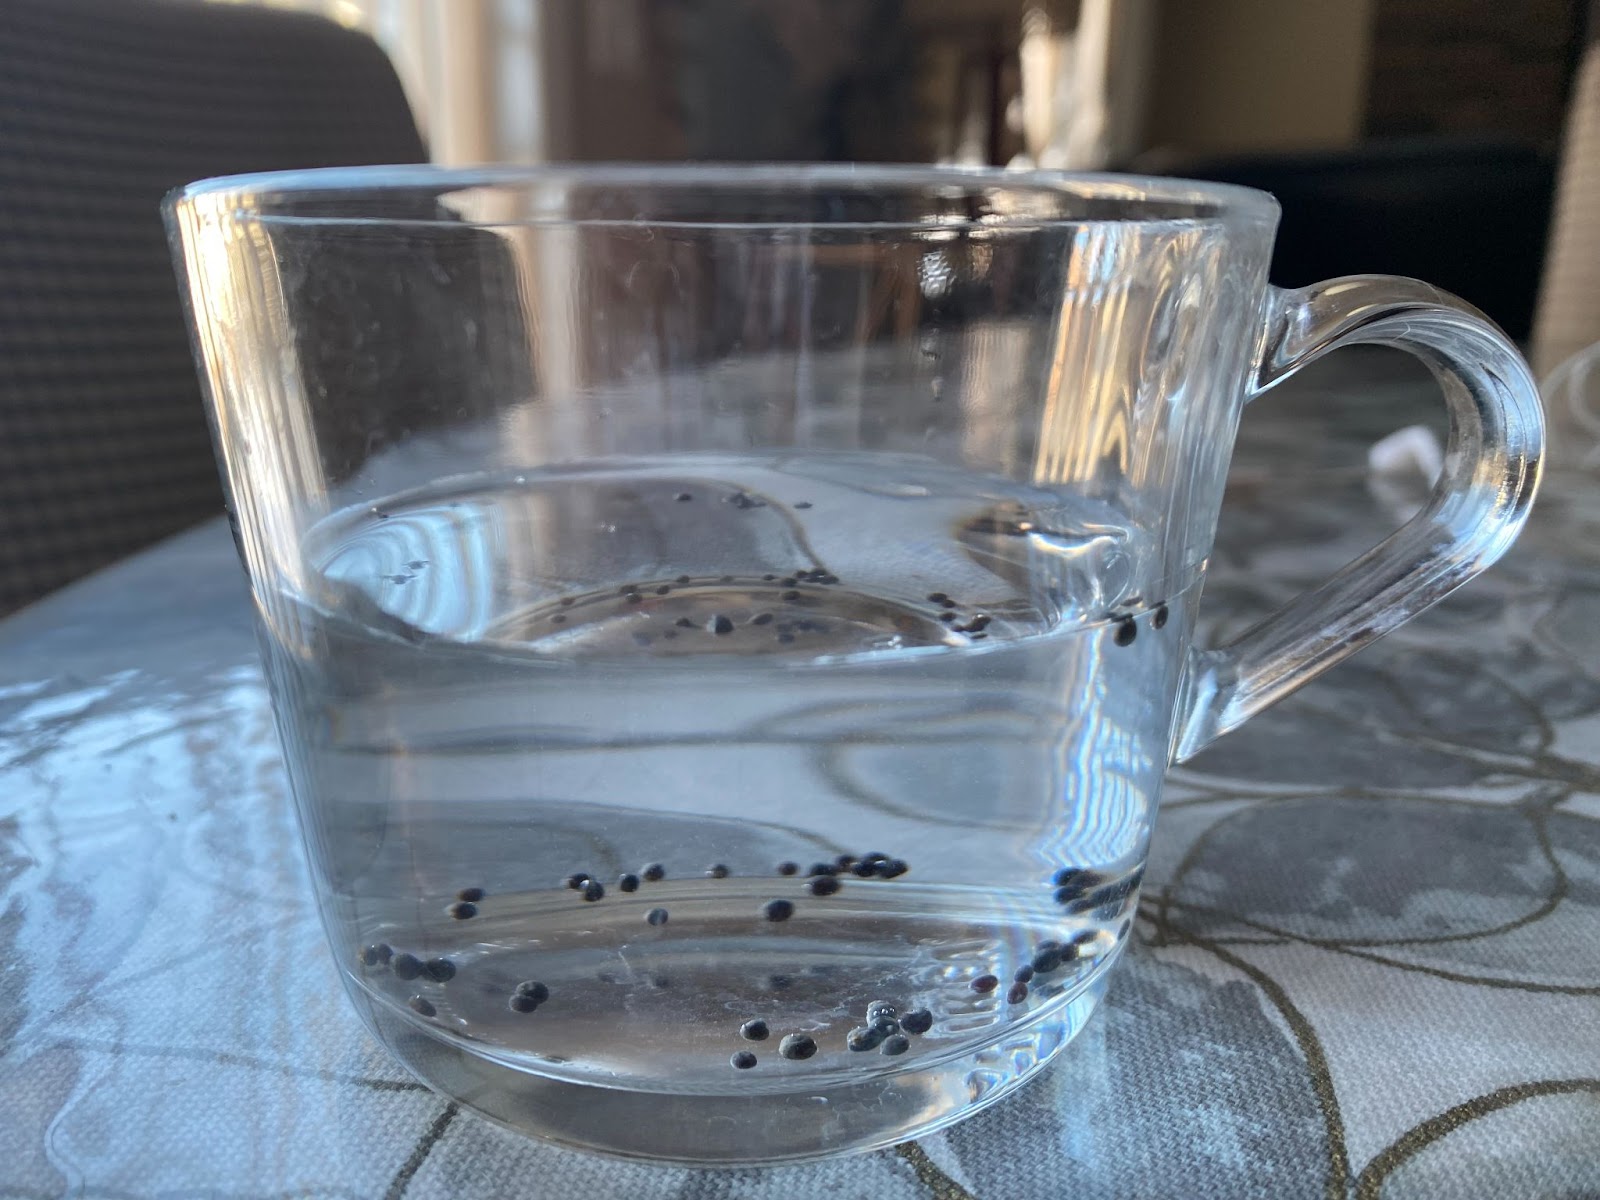
The 24 canola non-GMO, organic seeds were soaked for 1 day (24 hours) in water to increase the rate of germination. |
|||||||||||||||||||||||||||||||||||||||||
|
Day 1 |
|
Day 1 of the Growth Period
The average heights of all the sections were recorded (the growth of every single trial can be seen in the Quantitative Data Section which includes the logbooks and Graphs):
Section 1 (Recommended): 0 cm Section 2: 0 cm Section 3: 0 cm Section 4 (Constant): 0 cm |
|||||||||||||||||||||||||||||||||||||||||
|
Day 5 |
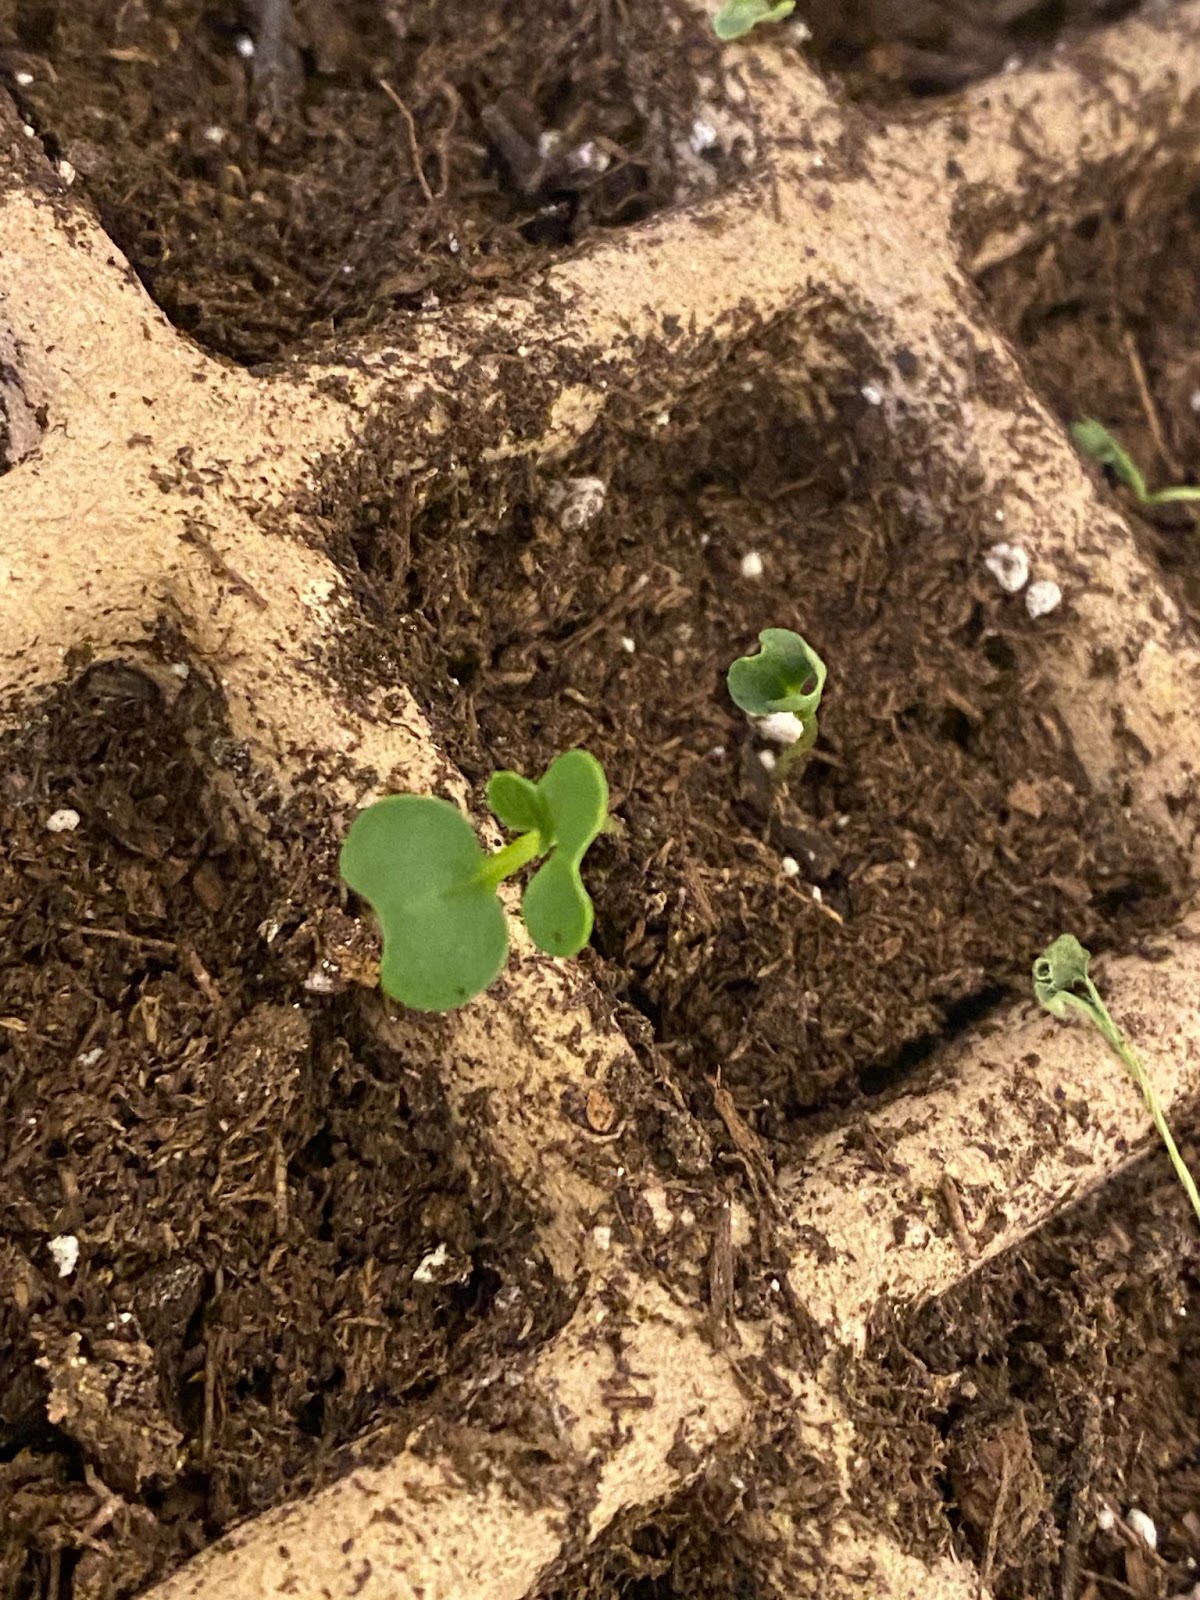 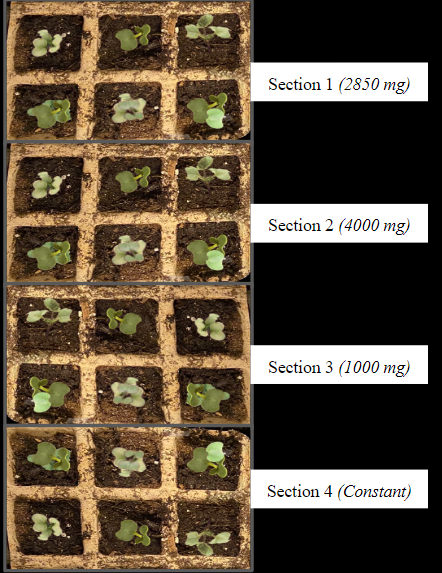 |
Day 5 of the Growth Period:
The average heights of all the sections were recorded (individual samples were kept account of - can’t be mentioned due to excess samples shown in observations - can be seen in the logbook section with graphs and tables):
Section 1 (Recommended): 0.3 cm Section 2: 0.3 cm Section 3: 0.3 cm Section 4 (Constant): 0.3 cm |
|||||||||||||||||||||||||||||||||||||||||
|
Day 10 |
|
The average heights of all the sections were recorded (individual samples were kept account of - can’t be mentioned due to conciseness of information) - which can be seen in the Quantitative data with tables and graphs |
|||||||||||||||||||||||||||||||||||||||||
|
Day 15 |
    |
|
|||||||||||||||||||||||||||||||||||||||||
|
Day 20 |
 |
8-day Drought Stimulation period, which is a good sign |
|||||||||||||||||||||||||||||||||||||||||
|
Day 25 |
 |
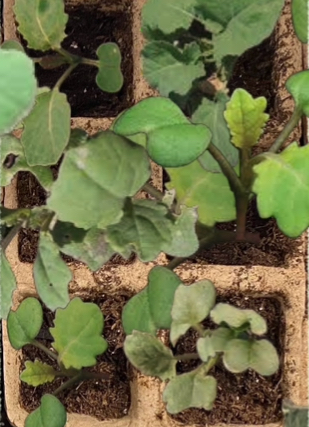
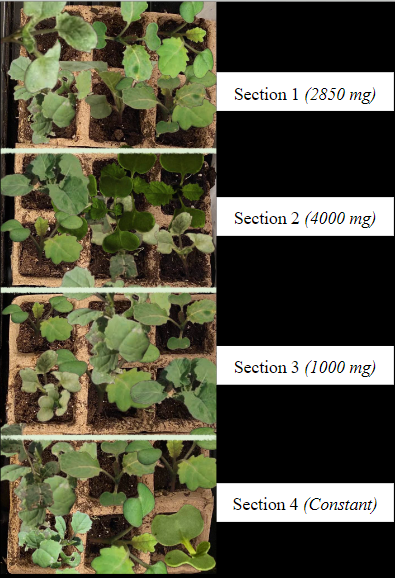
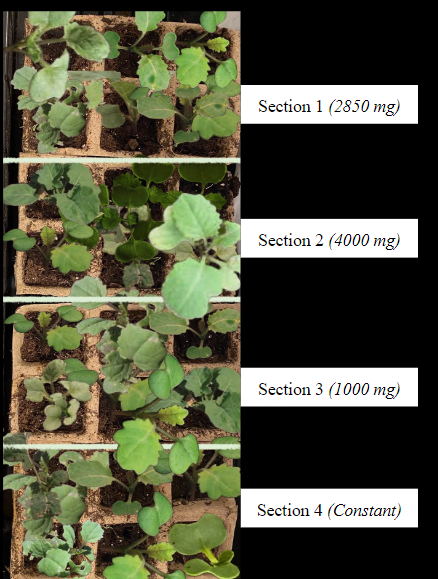
Notable differences could be seen as the pigmentation of the samples overall was getting darker, conveying that the health of the canola samples was thriving
Height was pretty much the same as the 20th day with only some growth
Overall, the internodal length increased significantly which showed consistent growth |
|||||||||||||||||||||||||||||||||||||||||
|
Day 30 |
|
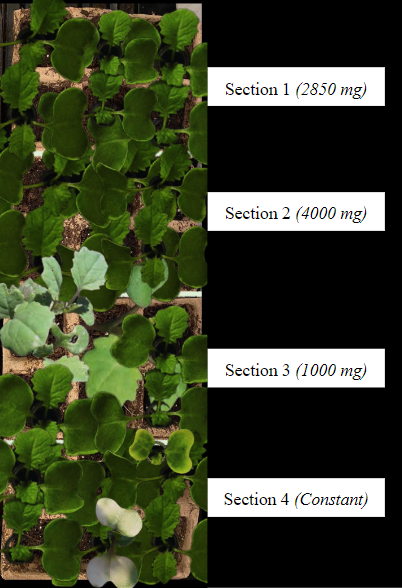
Last Day of Growth Period (30th Day)
No notable difference could be seen in the samples
From the background research, it can be inferred that the actual decisive data is the R.W.C. and photosynthetic flotation as it shows the plant's condition internally (more in-depth changes in plants’ response to water stress/drought) |
|||||||||||||||||||||||||||||||||||||||||
|
Day 1 |
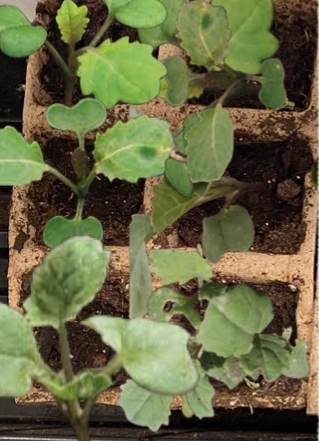
Section 1 Section 2
Section 3
Section 4 (N/A - Constant)
|
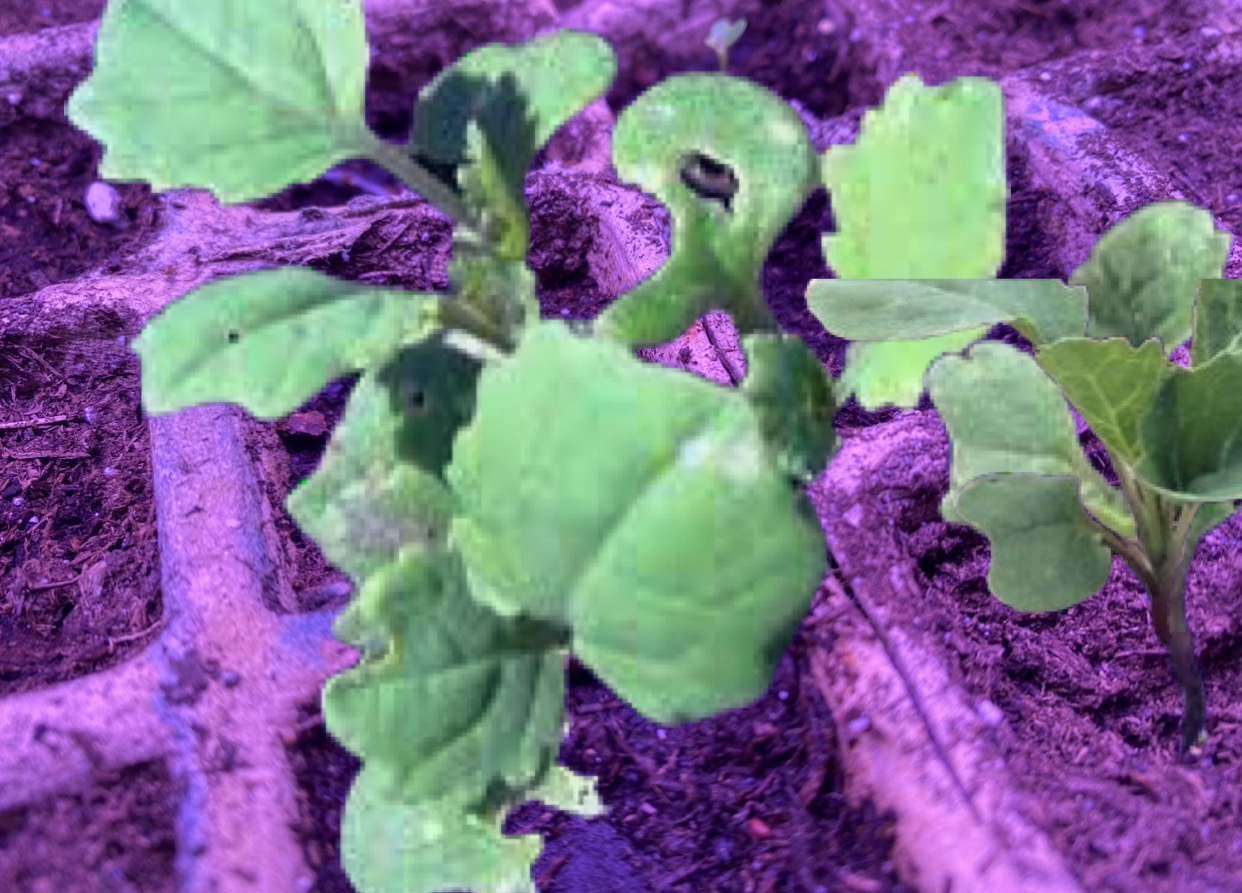
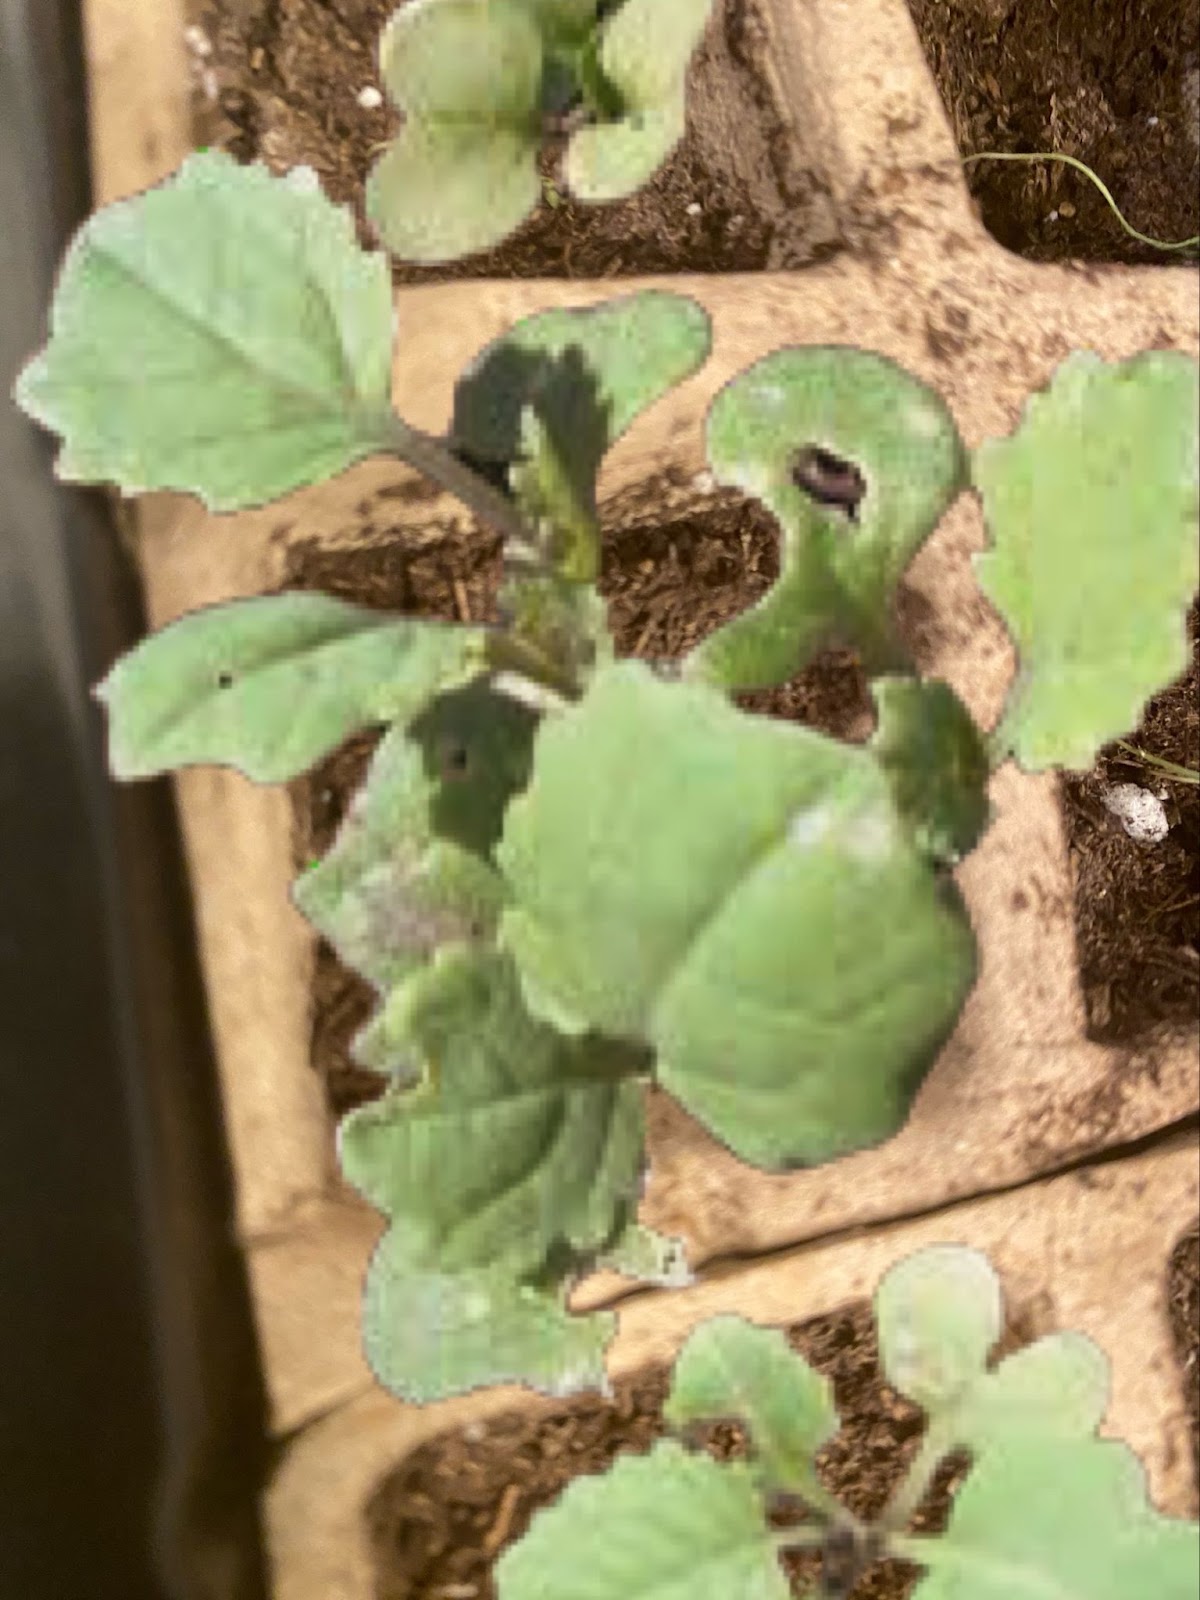
1st Day of Drought Stimulation Period (10 Days) and Hydrogel Application
No notable difference could be seen in the samples as it is the 1st day of hydrogel application and the drought stimulation period
From the background research, it can be inferred that the actual decisive data is the R.W.C. and photosynthetic flotation as it shows the plant's condition internally (more in-depth changes in plants’ response to water stress/drought)
|
|||||||||||||||||||||||||||||||||||||||||
|
Day 3 |
|
3rd Day of Drought Stimulation Period (5 Days) and Hydrogel Application
|
|||||||||||||||||||||||||||||||||||||||||
|
Day 8 |
|
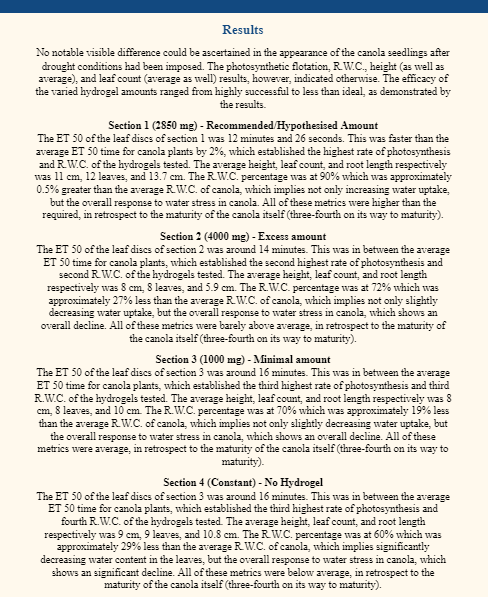
Analysis of all Metrics (Section 1)
Analysis of all Metrics (Section 2)
Analysis of all Metrics (Section 3)
Analysis of all Metrics (Section 4)
Results: Section 1 was the most effective hydrogel in masking drought resistance in canola plants. |
|||||||||||||||||||||||||||||||||||||||||

Analysis
Analysis (In words)
Quantitative Data: Statistical Data and Analysis (Graphs and Table/Logbook)
STATISTICAL ANALYSIS TABLES:-
|
Irrigation Water Analysis:
|
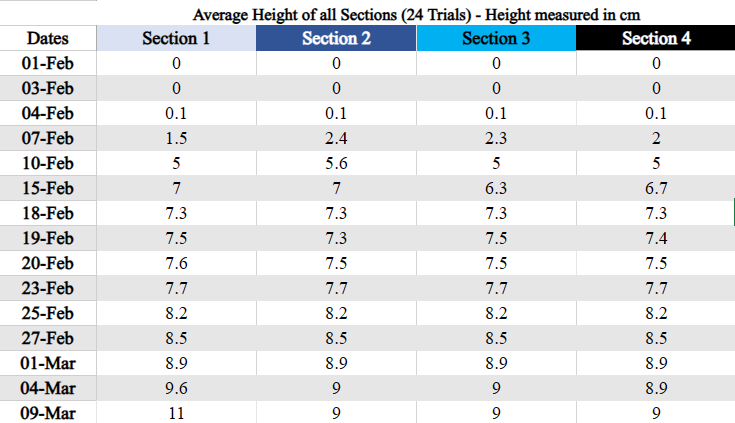
Average Height of all Sections at the end of Growth Period:
|
||||||||||||||||||||||||||||||||||||||
|
R.W.C. and Photosynthetic Flotation - Section 1
|
R.W.C. and Photosynthetic Flotation - Section 2
|
||||||||||||||||||||||||||||||||||||||
|
R.W.C. and Photosynthetic Flotation - Section 3
|
R.W.C. and Photosynthetic Flotation - Section 4
|
||||||||||||||||||||||||||||||||||||||
|
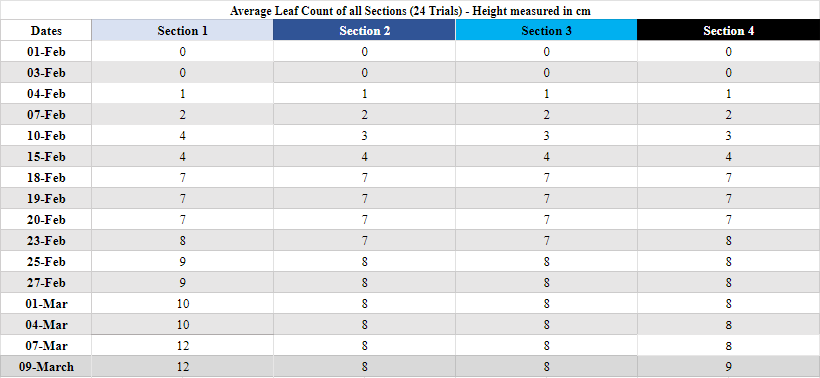
Average Leaf Count of all Sections at the End of the Drought Period:
Analysis of all Metrics (Section 2)
|
Analysis of all Metrics (Section 1)
Analysis of all Metrics (Section 3)
|
||||||||||||||||||||||||||||||||||||||
|
Analysis of all Metrics (Section 4)
|
|||||||||||||||||||||||||||||||||||||||
|
Quantitative/Numerical Data: Logbook/Table and Graphs for Data (Average Height - cm, Leaf Count and Others)
TABLE + GRAPH 1 - #1.1 - 1.4 = Height Data TABLE + GRAPH 2 - #2.1 - 2.4 = Leaf Count Data TABLE + GRAPH 3 - #3 = Photosynthetic Flotation Data TABLE + GRAPH 4 - #4.1 - 4.2 = Root Length Data TABLE + GRAPH #5 = R.W.C. Data |
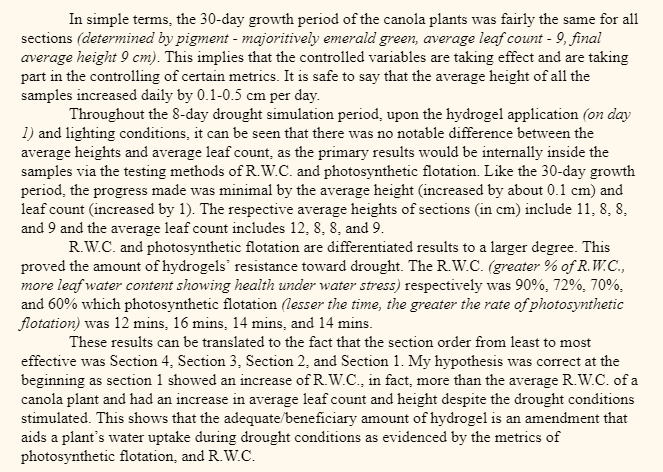
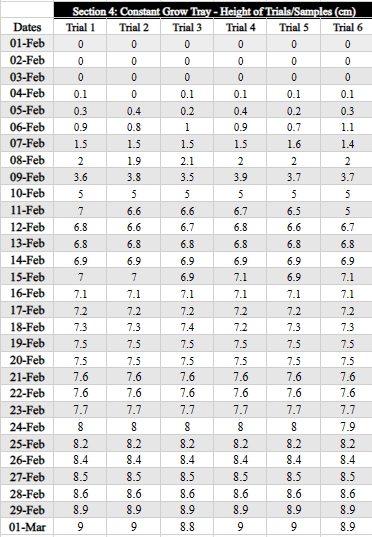
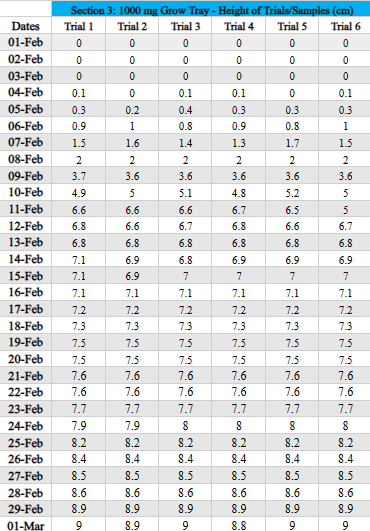
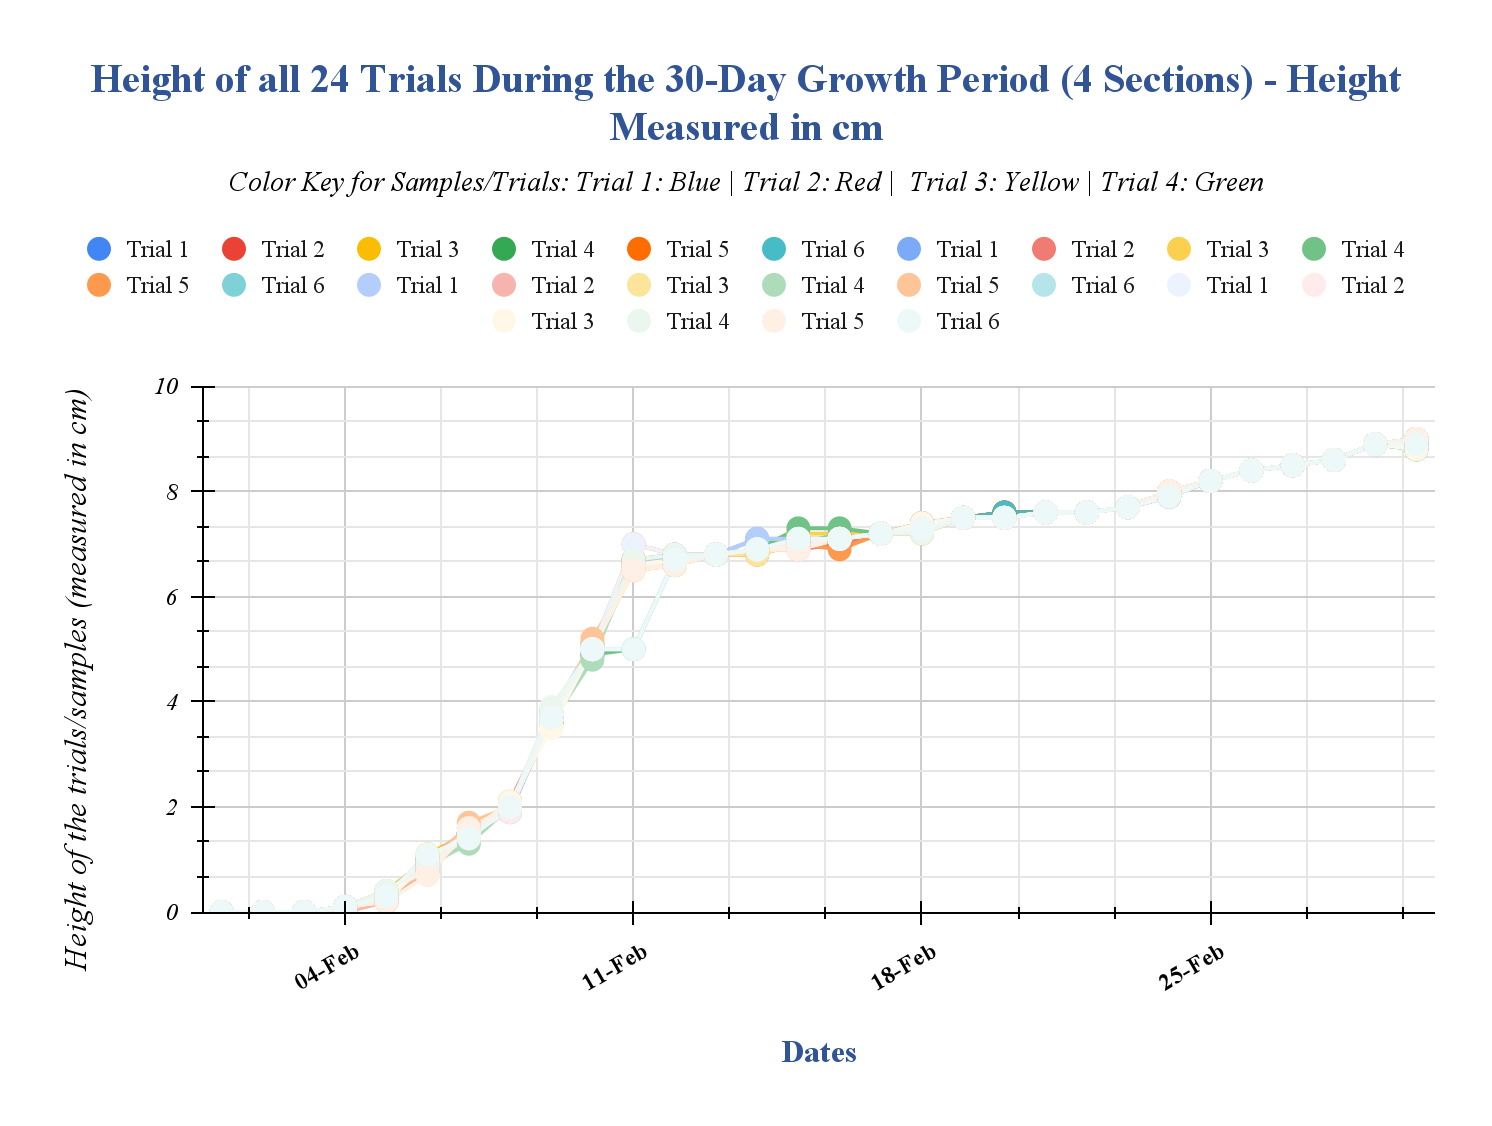
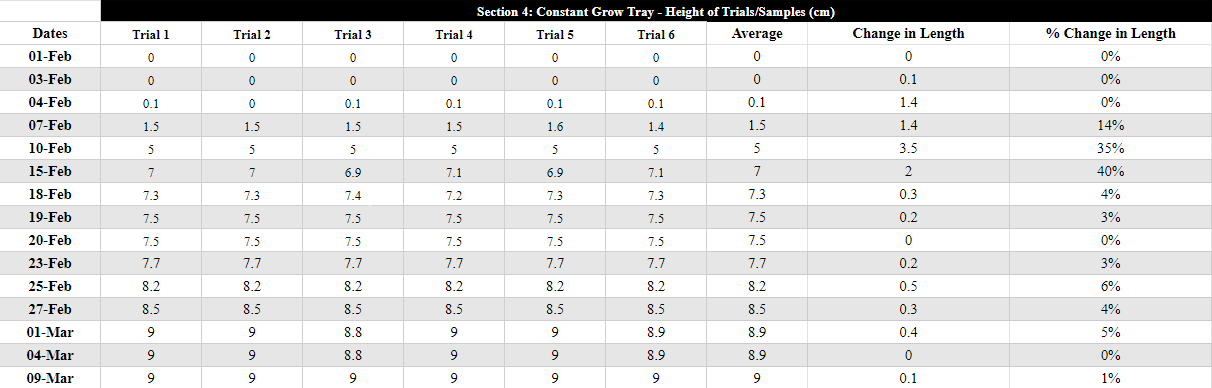
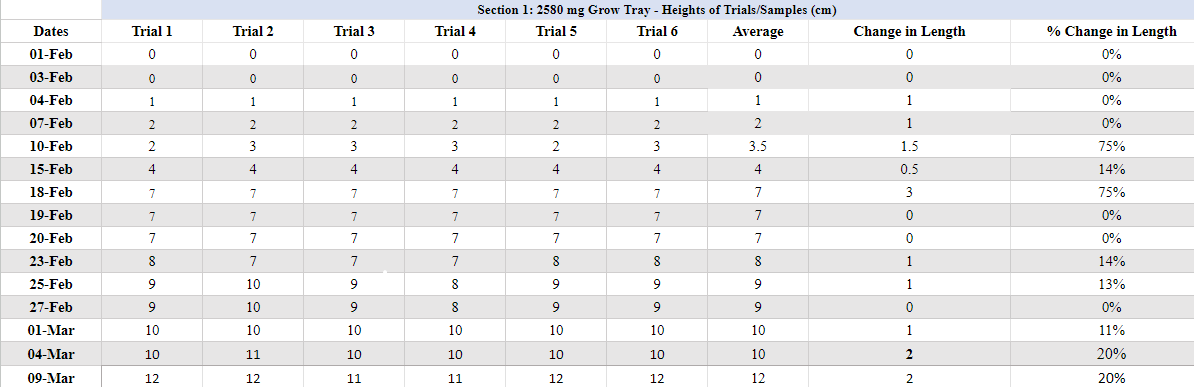
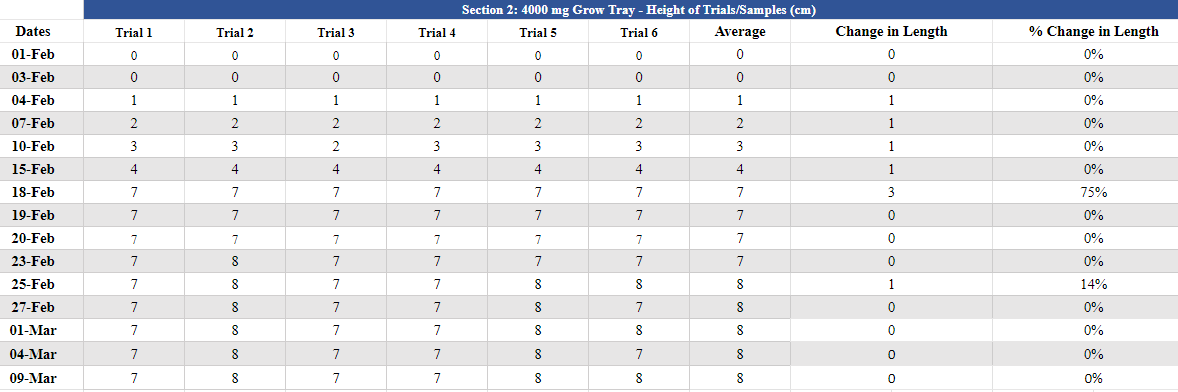
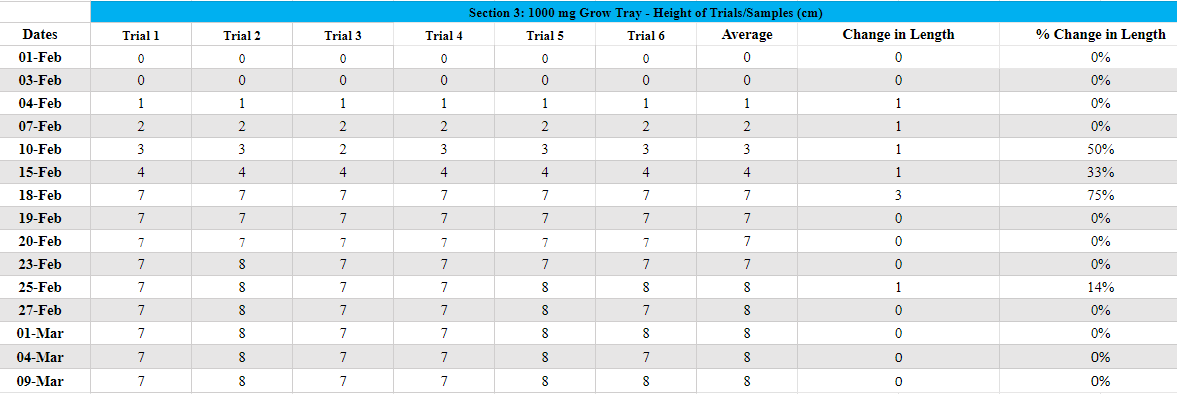
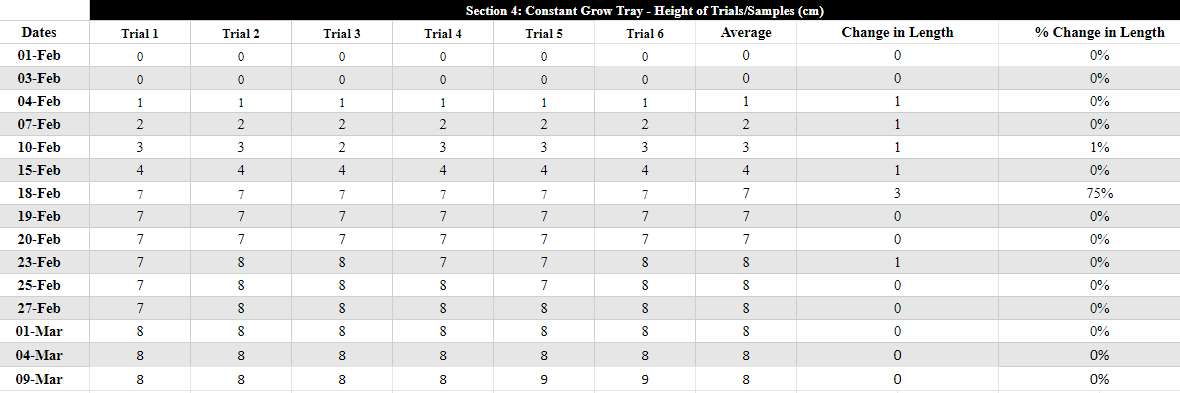
#1.1: Height of all 24 Trials (4 Sections) During the 30-Day Growth Period (4 Sections) - Height in cm
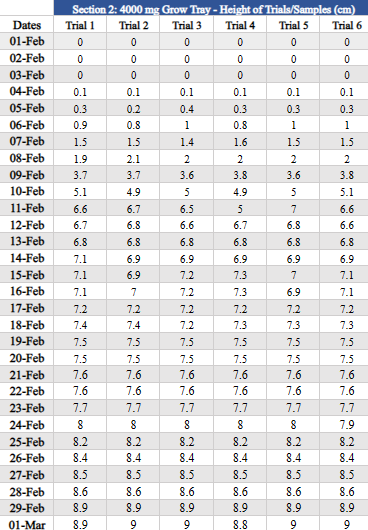
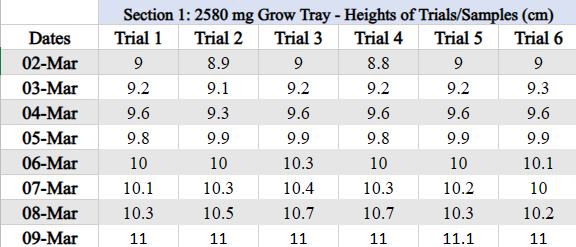
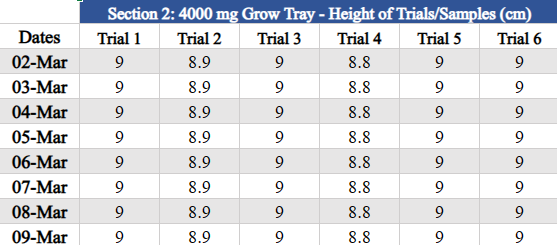
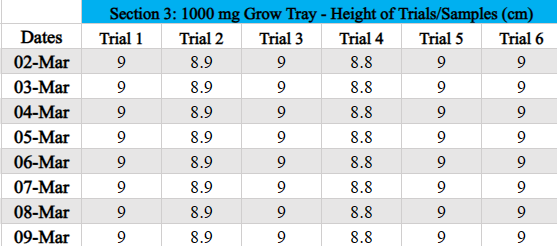
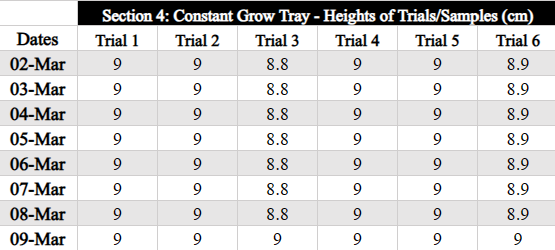
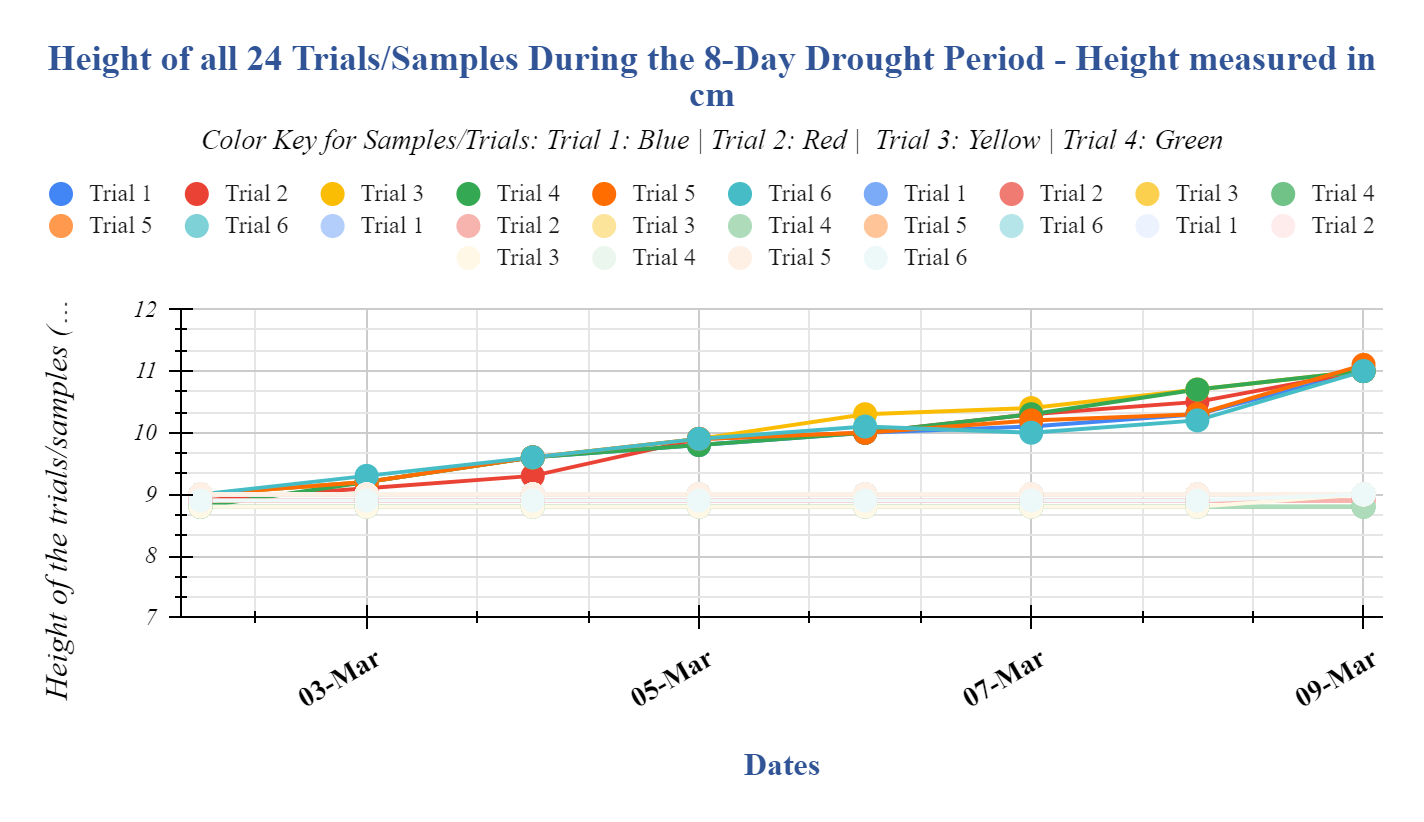
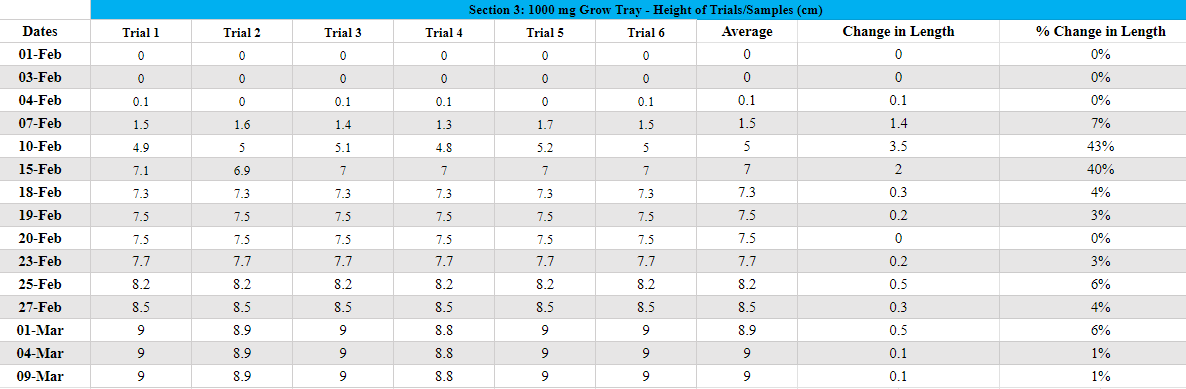
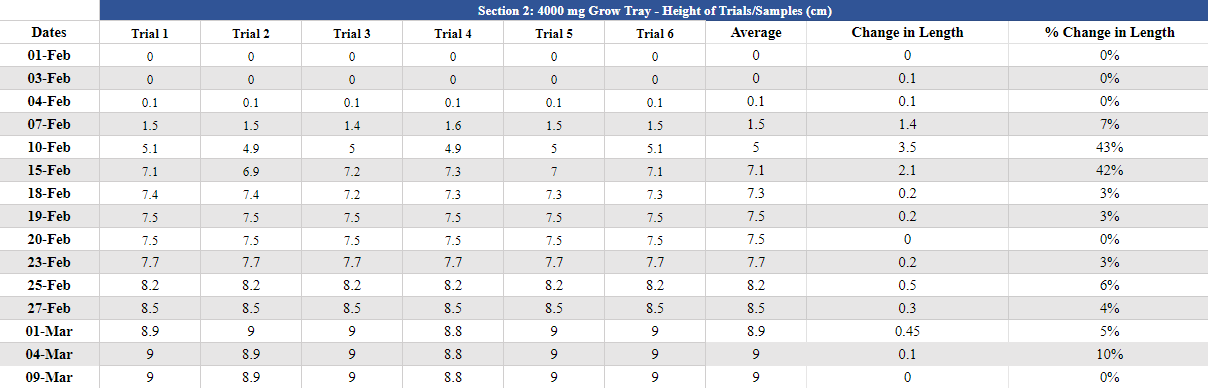
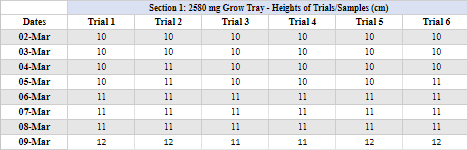
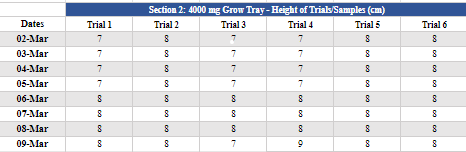
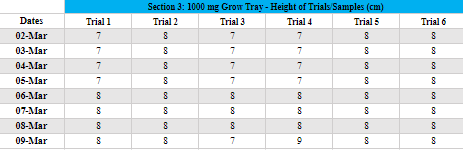
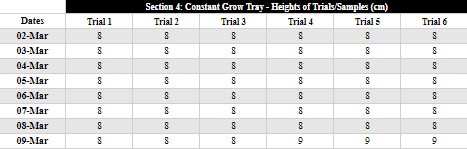
#1.2: Height of all 24 Trials (4 Sections) During the 8-Day Drought Period (4 Sections) - Height in cm
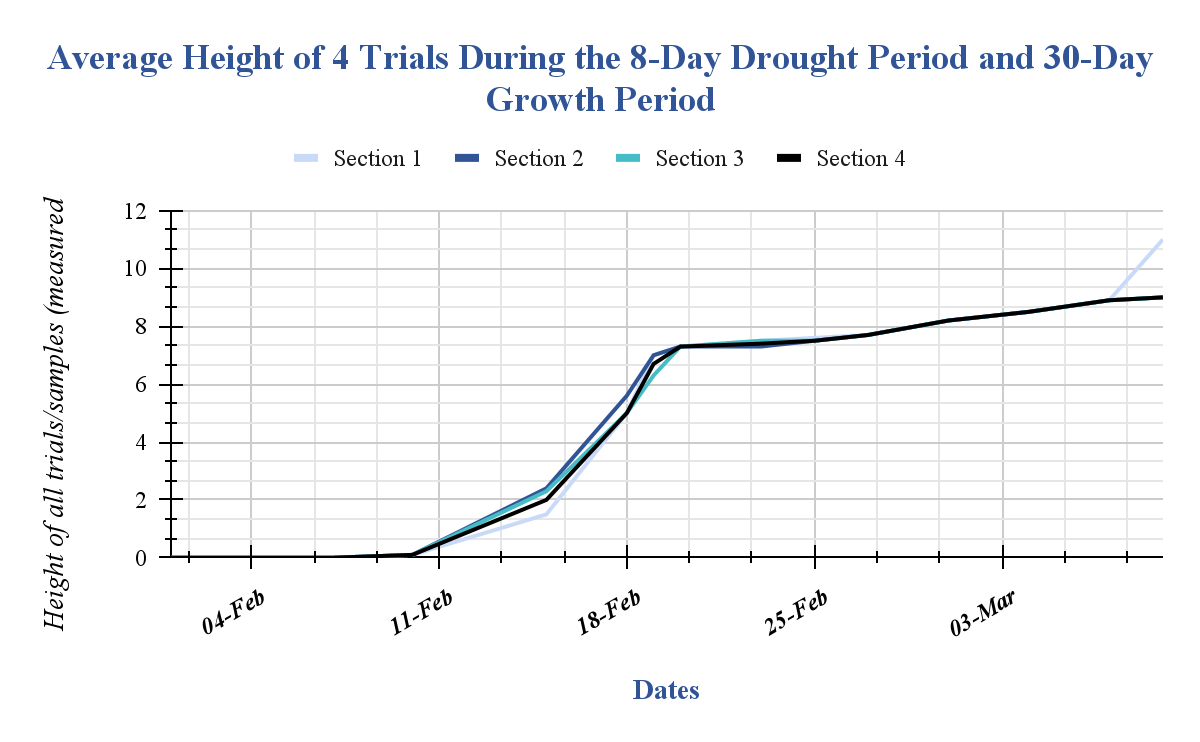
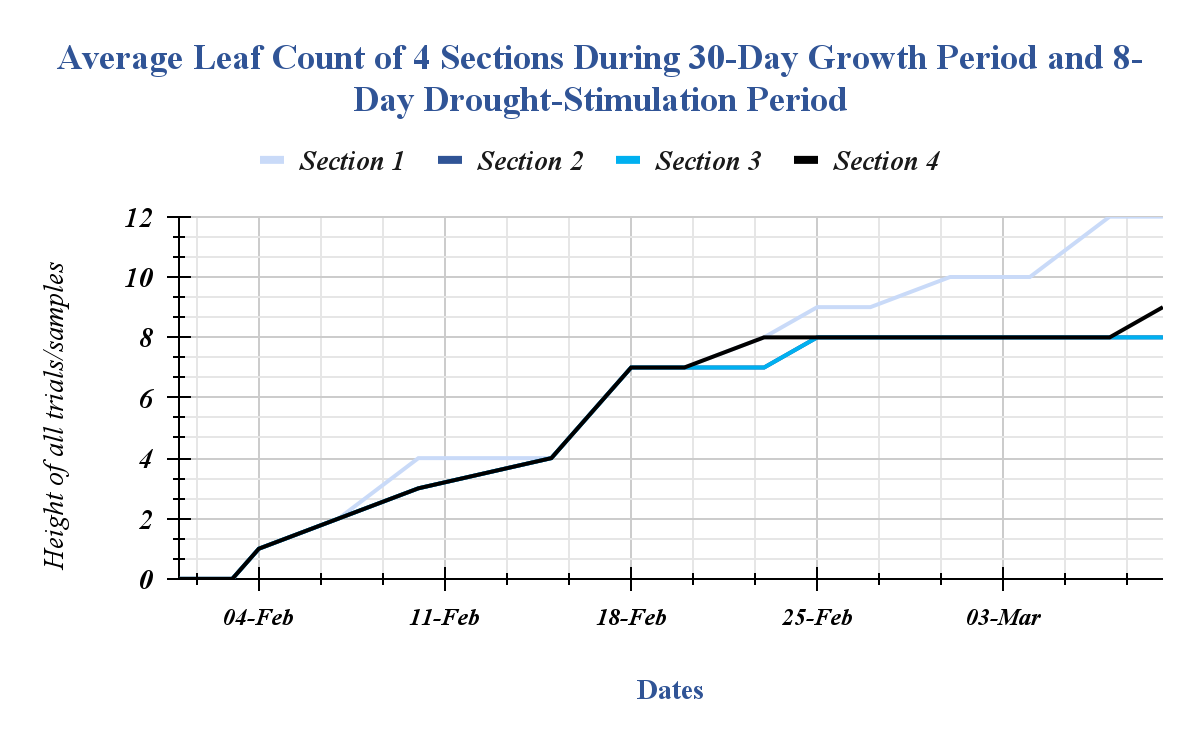
#1.3: Average Height of 24 Trials (4 Sections) During the 30-Day Growth Period and 8-Day Drought Period - Height in cm
#1.4: E.E.I. (Extended Experimental Investigation) - Statistical Data for Height During the 30-Day Growth Period and 8-Day Drought Stimulation Period (4 Sections) 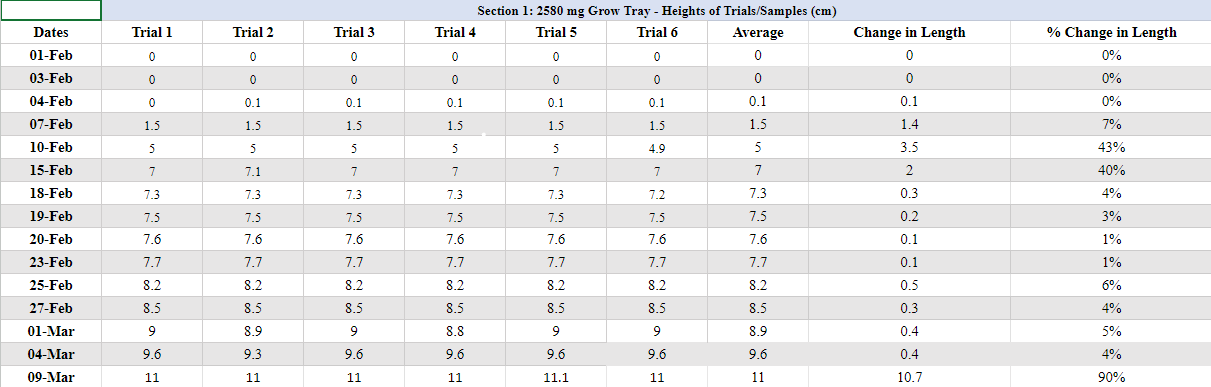
#2.1: Leaf Count of all 24 Trials (4 Sections) During the 30-Day Growth Period (4 Sections) - Height in cm
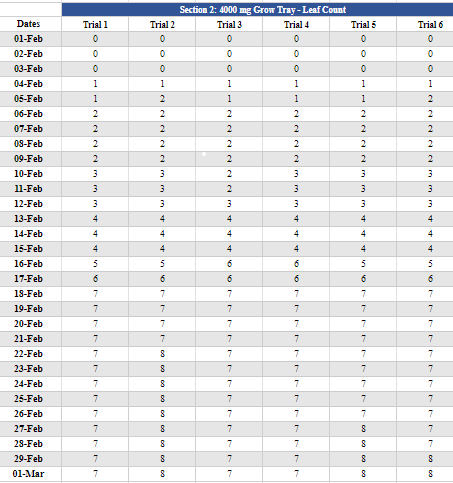
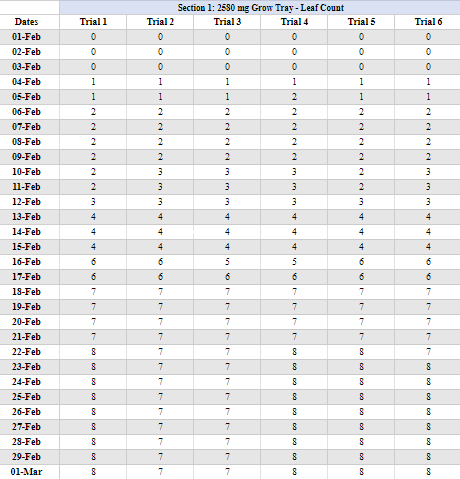
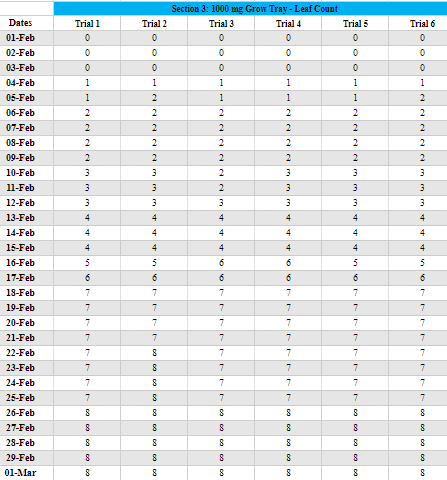

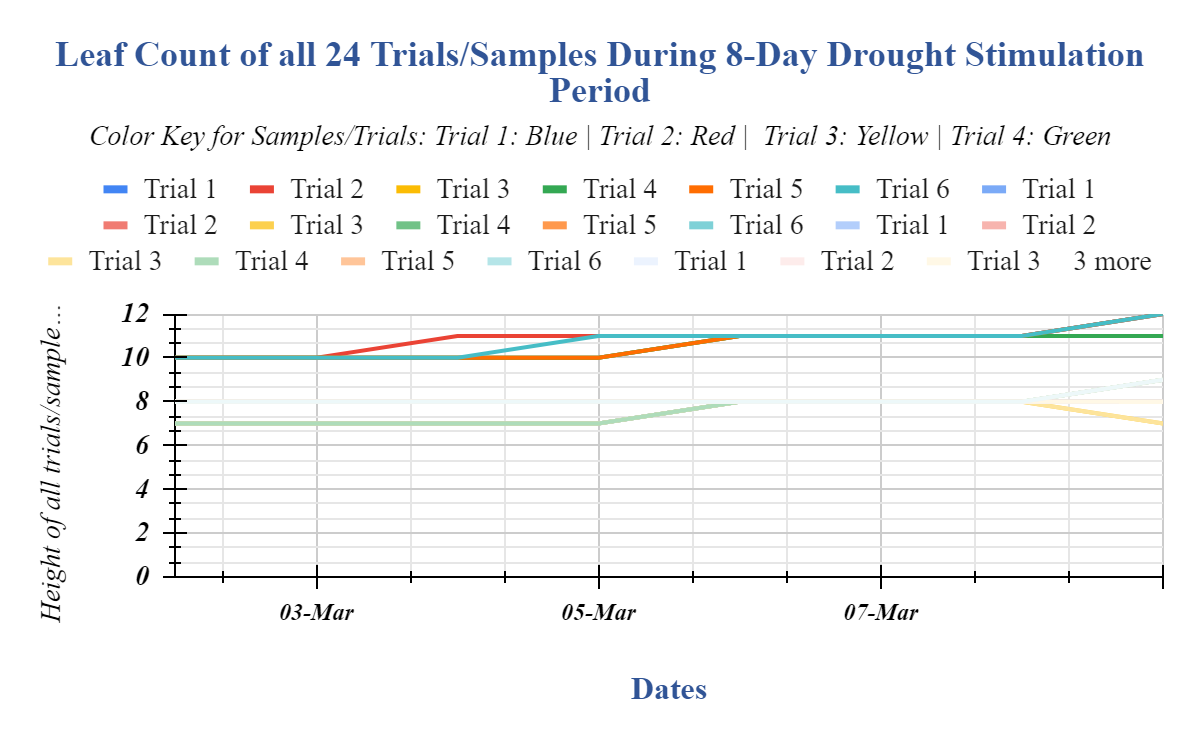
#2.2: Leaf Count of all 24 Trials (4 Sections) During the 8-Day Drought Period (4 Sections) - Height in cm
#2.3: Average Leaf Count of 4 Sections During the 30-Day Growth Period and 8-Day Drought Period - Height in cm
#2.4: E.E.I. (Extended Experimental Investigation) - Statistical Data for Leaf Count During the 30-Day Growth Period and 8-Day Drought ) Stimulation Period (4 Sections
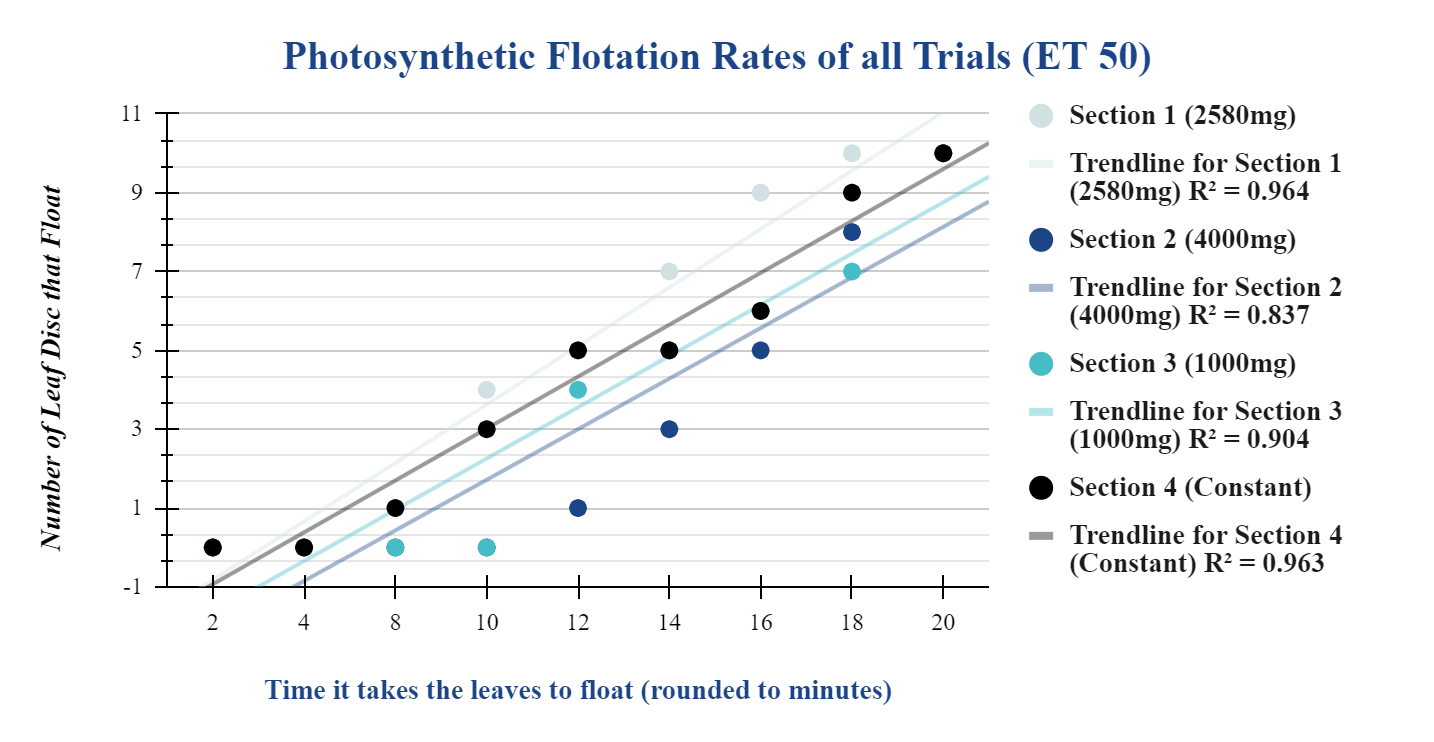
#3. Photosynthetic Flotation Rate for Sections/Grow Trays (ET 50 - Effective Time 50)
|
Time it takes the leaves to float (minutes) |
Section 1 (2580 mg) |
Section 2 (4000 mg) |
Section 3 (1000 mg) |
Section 4 (Constant) |
|
2 |
0 |
0 |
0 |
0 |
|
4 |
0 |
0 |
0 |
0 |
|
8 |
1 |
0 |
0 |
1 |
|
10 |
4 |
0 |
0 |
3 |
|
12 |
5 |
1 |
4 |
5 |
|
14 |
7 |
3 |
5 |
5 |
|
16 |
9 |
5 |
6 |
6 |
|
18 |
10 |
8 |
7 |
9 |
|
20 |
10 |
10 |
10 |
10 |
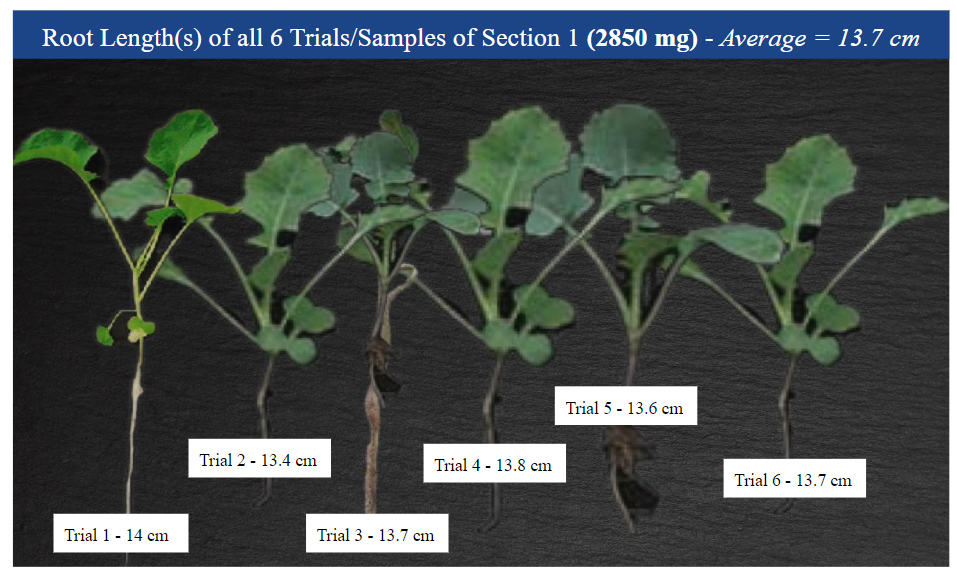
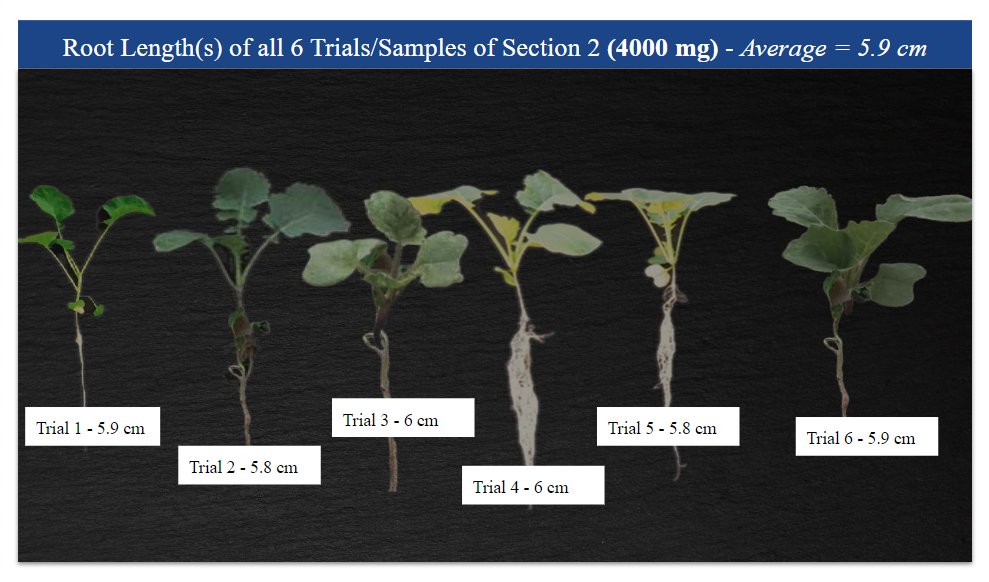
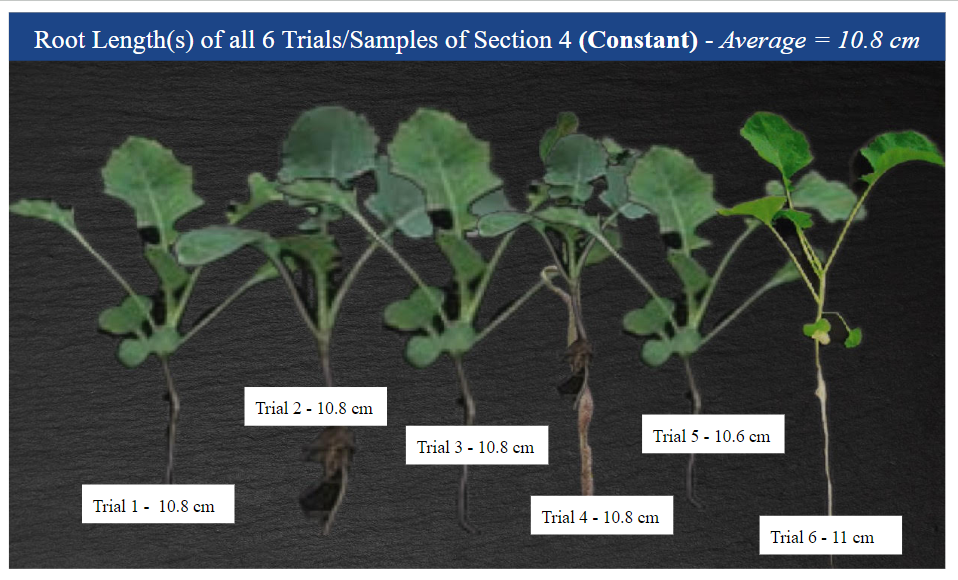
#4.1: Root Length of all 24 Trials (4 Sections) - Extracted After 8-Day Drought Period + 30-Day Growth Period (Height in centimeters) - No Graph Could be Made Due to Error with Google Sheets
|
2580 mg Grow Tray - Heights of Trials/Samples |
4000 mg Grow Tray - Height of Trials/Samples |
1000 mg Grow Tray - Height of Trials/Samples |
Constant Grow Tray - Heights of Trials/Samples |
|||||||||||||||||||||
|
Trial Number |
Trial 1 |
Trial 2 |
Trial 3 |
Trial 4 |
Trial 5 |
Trial 6 |
Trial 1 |
Trial 2 |
Trial 3 |
Trial 4 |
Trial 5 |
Trial 6 |
Trial 1 |
Trial 2 |
Trial 3 |
Trial 4 |
Trial 5 |
Trial 6 |
Trial 1 |
Trial 2 |
Trial 3 |
Trial 4 |
Trial 5 |
Trial 6 |
|
Height of Root Length (in cm) |
14 |
13.4 |
13.7 |
13.8 |
13.6 |
13.7 |
8 |
10 |
12 |
11 |
10 |
9 |
5.9 |
5.8 |
6 |
6 |
5.8 |
5.9 |
10.8 |
10.8 |
10.8 |
10.8 |
10.6 |
11 |
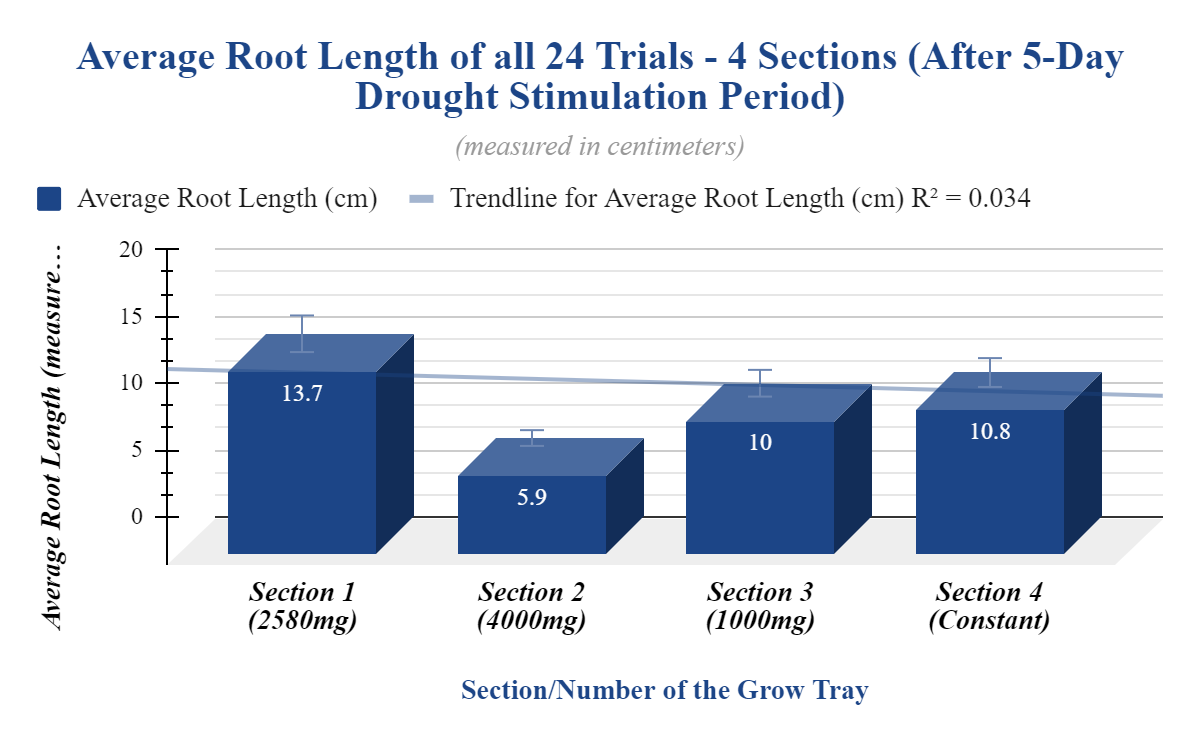
#4.2: Average Root Length of Sections (Measured in centimetres)
|
Section (2580 mg) |
Section 2 (4000 mg) |
Section 3 (1000 mg) |
Section 4 (Constant) |
|
|
Average Root Length |
13.7 |
5.9 |
10 |
10.8 |
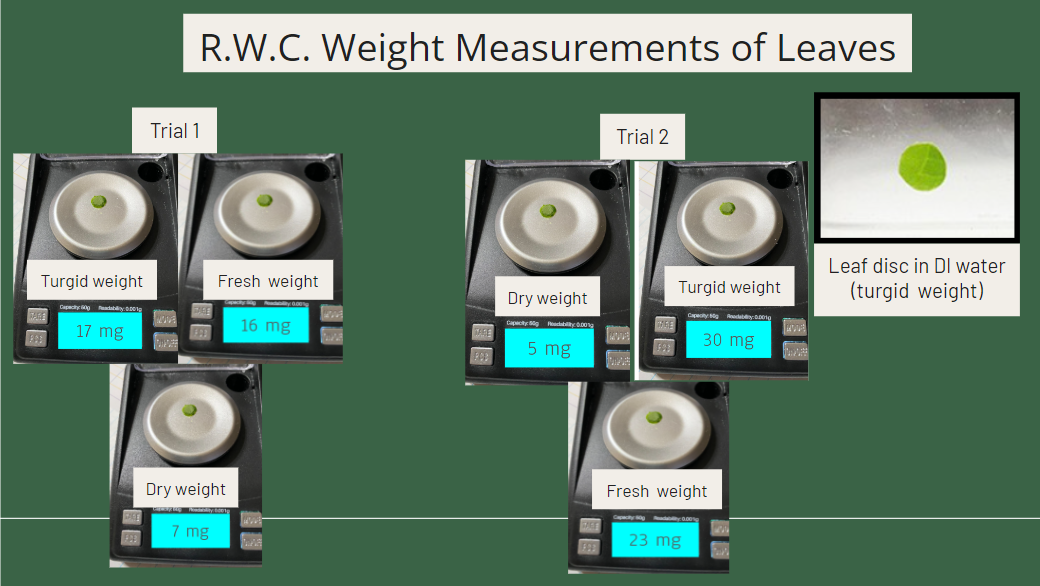
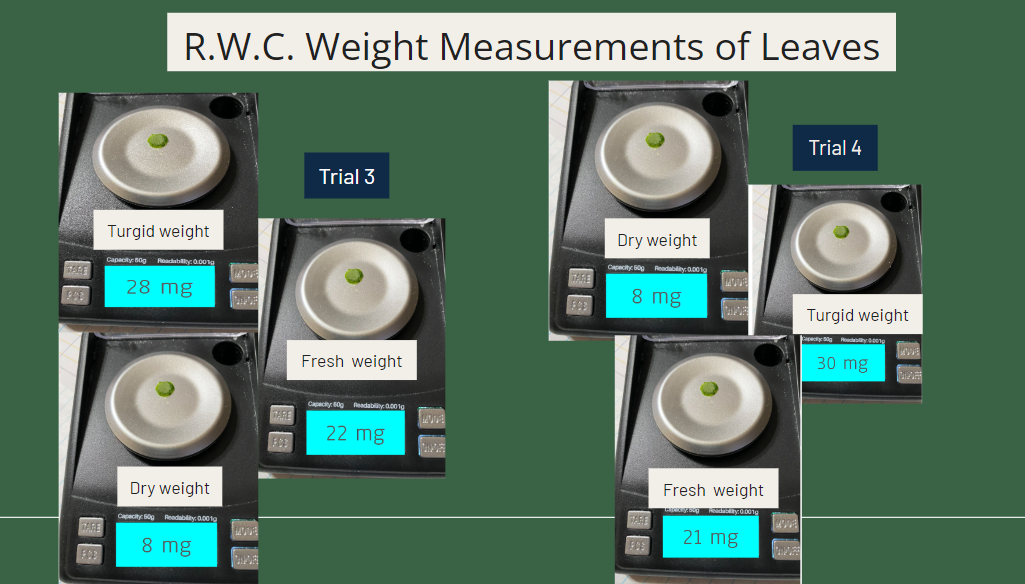
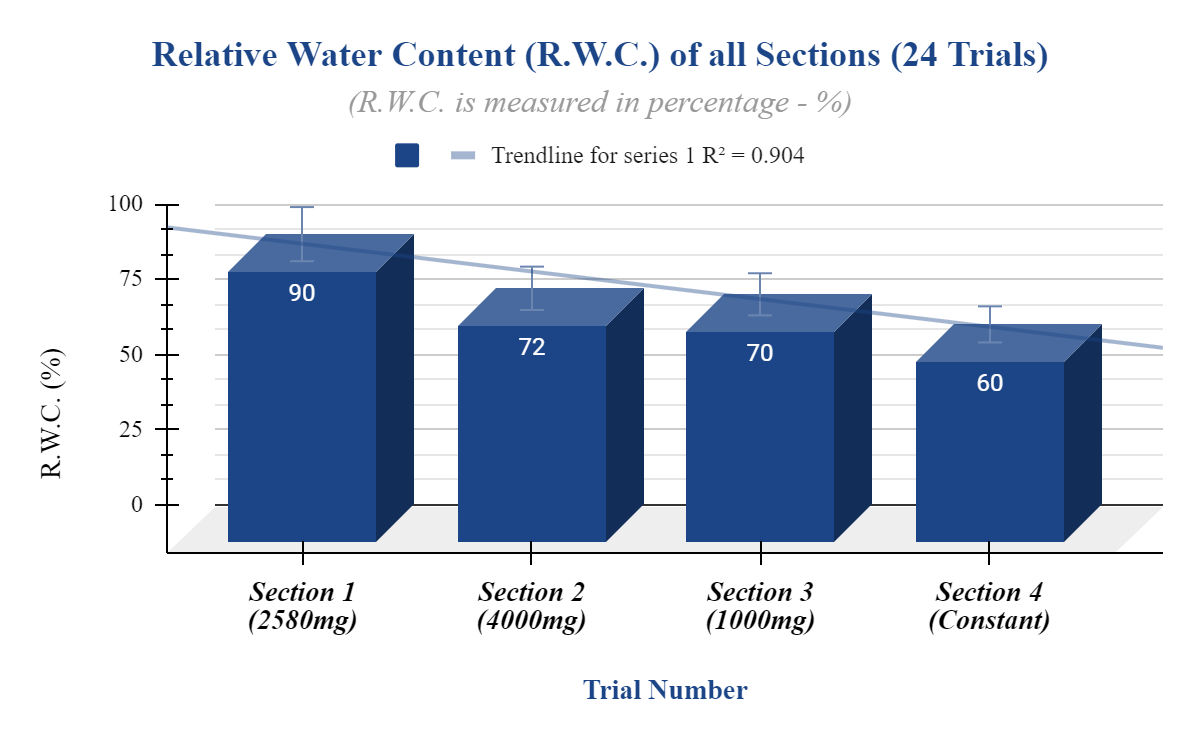
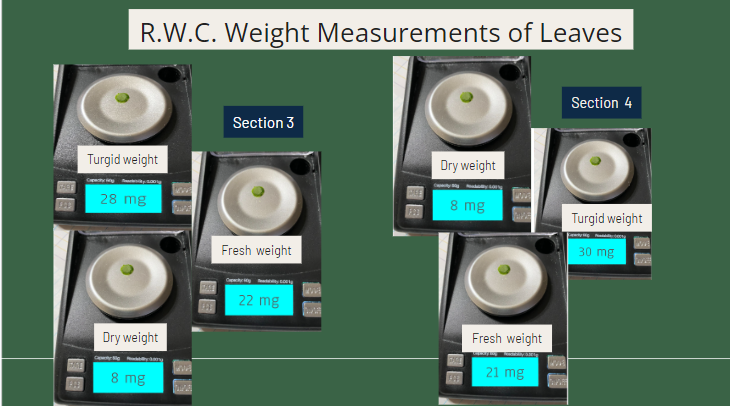
#5: R.W.C. (Relative Leaf Water Content) of 24 Trials - 4 Sections (Measured in %)
|
Section 1 (2580 mg) |
Section 2 (4000 mg) |
Section 3 (1000 mg) |
Section 4 (Constant) |
|
|
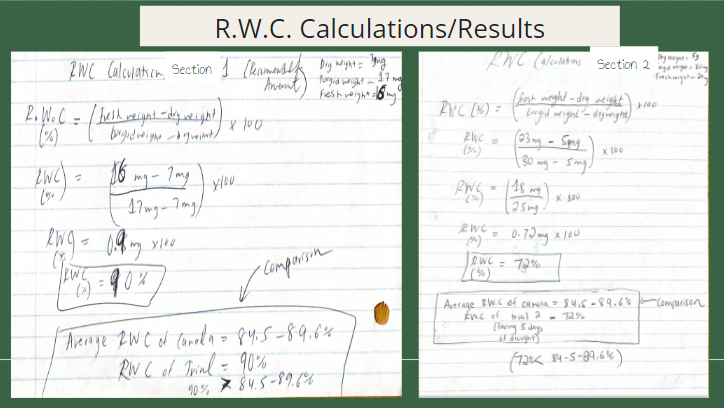
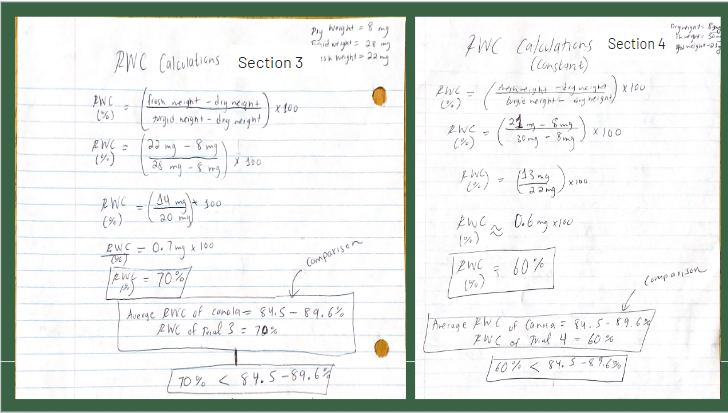
R.W.C. (Relative Leaf Water Content) - Measured in % |
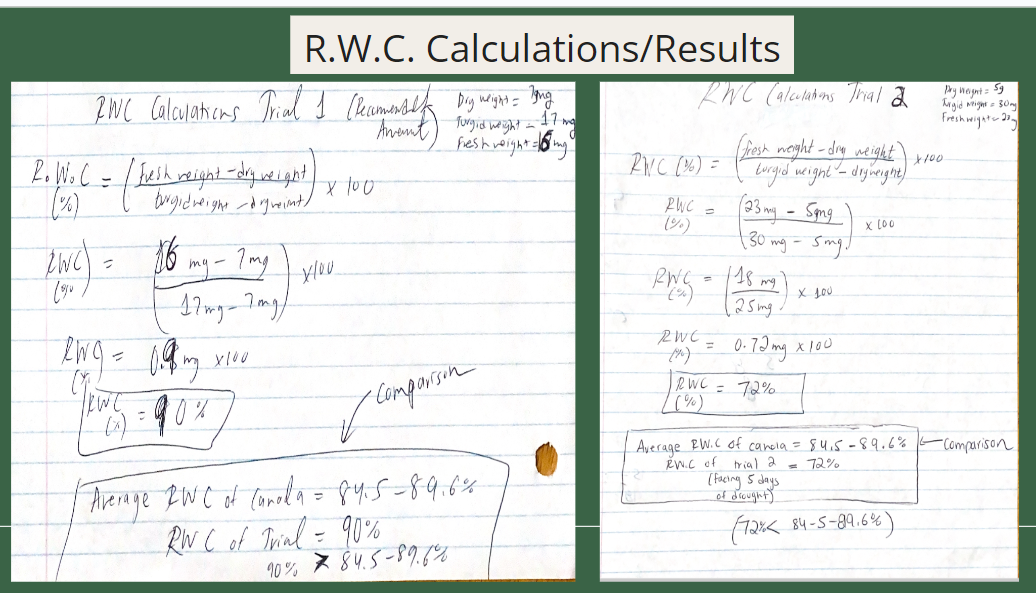
90 |
72 |
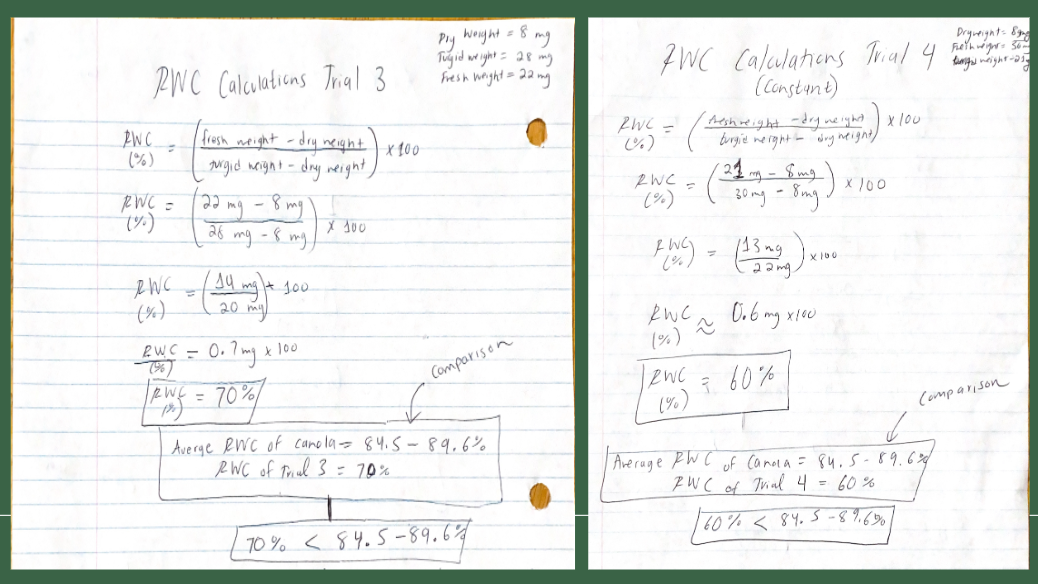
70 |
60 |
Qualitative/Quantitative Data of Metrics with Exception of Average Height/Leaf Count - Shown in Observations
(non-numeric i.e. text, video, photographs, etc)
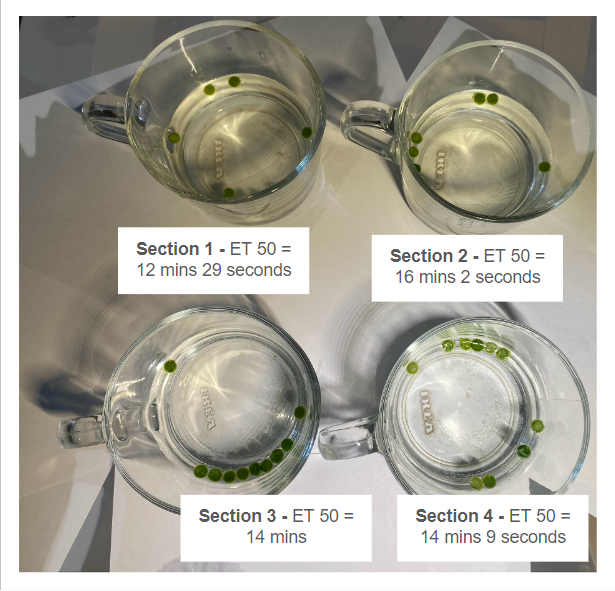
Qualitative Data: Photograph of Photosynthetic Rate of Flotation (ET 50) for all Sections - Videos can be seen in Google Slides Presentation
Qualitative Data: Photographs of Root Lengths of all 4 Sections - Visual may Appear Blurry due to Computer Difficulties in Forming a Clear Image

Qualitative Data: Leaf Relative Water Photographs of Weight Measurement of Leaves with Milligram Scale
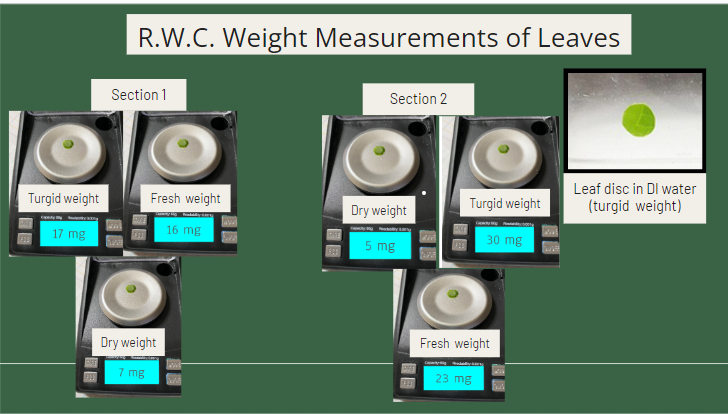
Quantitative Data: R.W.C. Calculations (Numeric)
Conclusion
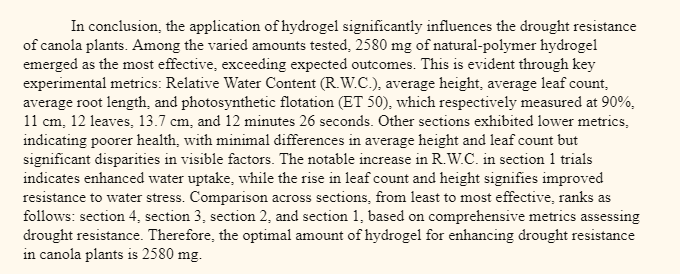
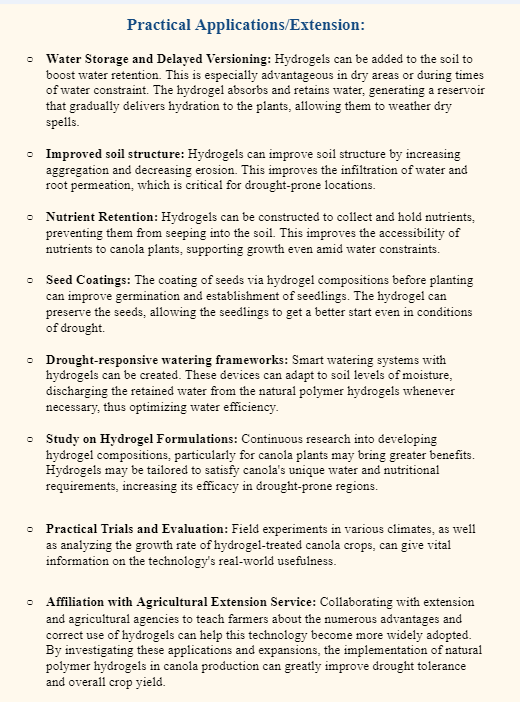
Application
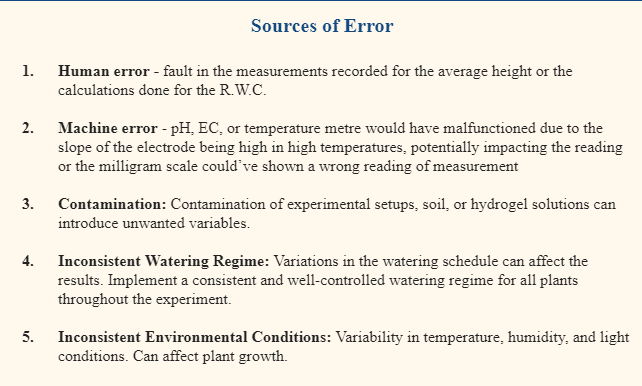
Sources Of Error
Citations
Works Cited (APA 7th Edition)
Yadav, S., & Kumar, R. (2023, August 3). (PDF) Hydrogel and its effect on soil moisture status and plant growth: A review. ResearchGate. Retrieved November 23, 2023, from https://www.researchgate.net/publication/348927854_Hydrogel_and_its_effect_on_soil_moisture_status_and_plant_growth_A_review
Albalasmeh, A. A., Mohawesh, O., Gharaibeh, M. A., Alghamdi, A. G., Alajlouni, M. A., & Alqudah, A. M. (2022). Effect of hydrogel on corn growth, water use efficiency, and soil properties in a semi-arid region. Journal of the Saudi Society of Agricultural Sciences, 21(8), 518-524. https://doi.org/10.1016/j.jssas.2022.03.001
Non-GMO, cold-pressed canola oil brings self-sufficiency and international markets to an Alberta community. (n.d.). The Organic & Non-GMO Report. Retrieved November 30, 2023, from https://non-gmoreport.com/articles/non-gmo-cold-pressed-canola-oil-brings-self-sufficiency-international-markets-to-an-alberta-community/#:~:text=Non%2DGMO%20canola%20seeds%20ar
Adjuik, T. A., Nokes, S. E., Montross, M. D., & Wendroth, O. (2022). The Impacts of Bio-Based and Synthetic Hydrogels on Soil Hydraulic Properties: A Review. Polymers, 14(21), 4721. https://doi.org/10.3390/polym14214721
Canada’s Drought to Cut Wheat and Canola Production. (n.d.). Gro Intelligence. https://www.gro-intelligence.com/insights/canada-s-drought-to-cut-wheat-and-canola-production
Tariq, Z., Iqbal, D. N., Rizwan, M., Ahmad, M., Faheem, M., & Ahmed, M. (n.d.). Significance of biopolymer-based hydrogels and their applications in agriculture: a review in perspective of synthesis and their degree of swelling for water holding. RSC Advances, 13(35), 24731–24754. https://doi.org/10.1039/d3ra03472k
Generation of canola lines with increased heat and drought tolerance by regulating phospholipid: diacylglycerol acyltransferase activity. (n.d.). Canola Council of Canada. Retrieved December 22, 2023, from https://www.canolacouncil.org/research-hub/canola-lines-with-increased-heat-drought-tolerance/#:~:text=Overview
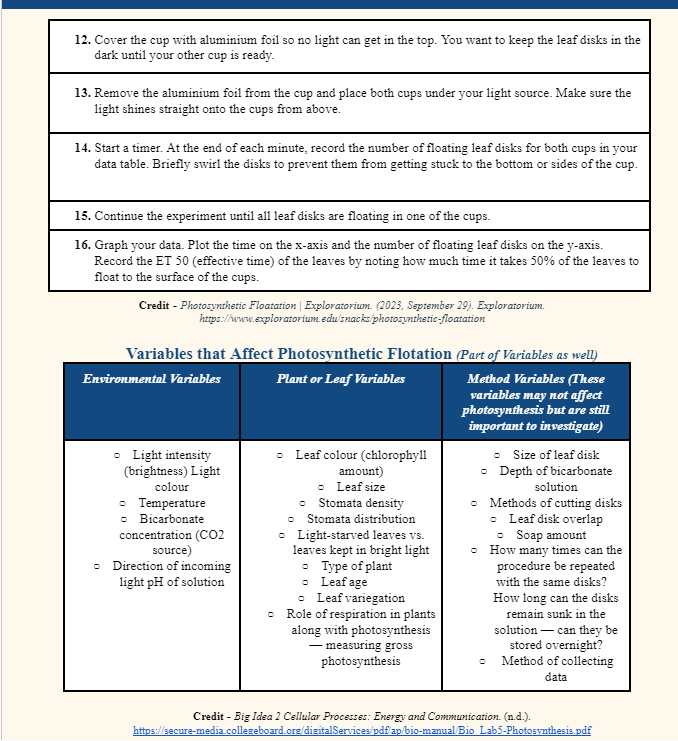
Photosynthetic Floatation. (2019, January 22). Exploratorium. https://www.exploratorium.edu/snacks/photosynthetic-floatation
Antunović Dunić, J., Mlinarić, S., Pavlović, I., Lepeduš, H., & Salopek-Sondi, B. (2023). Comparative Analysis of Primary Photosynthetic Reactions Assessed by OJIP Kinetics in Three Brassica Crops after Drought and Recovery. Applied Sciences, 13(5), 3078. https://doi.org/10.3390/app13053078
Crop Water Use and Requirements. (2011). https://open.alberta.ca/dataset/9a017865-5692-464d-92ac-93b5d50558db/resource/c0d20e0c-9f14-4f6d-8144-b8a6bc3452ba/download/5485851-2011-agri-facts-crop-water-use-requirements-revised-100-561-1-2011-11.pdf
Rakotoarivony, V. (2022, May 12). World 'at a crossroads' as droughts increase nearly a third in a generation. UN News. Retrieved September 26, 2022, from https://news.un.org/en/story/2022/05/1118142
World Health Organization. (n.d.). Drought. World Health Organization (WHO). Retrieved September 26, 2022, from
https://www.who.int/health-topics/drought#tab=tab_1
Info, T. A. (2017, October 2). Measurement of Drought Resistance in Plant Breeding. Agriinfo. in. https://agriinfo.in/measurement-of-drought-resistance-in-plant-breeding-2128/
Mazloom, N., Khorassani, R., Zohury, G. H., Emami, H., & Whalen, J. (2020). Lignin-based hydrogel alleviates drought stress in maize. Environmental and Experimental Botany, 175, 104055. https://doi.org/10.1016/j.envexpbot.2020.104055
Government of Alberta. (2019). Agriculture and Forestry. Gov.ab.ca. https://www1.agric.gov.ab.ca/
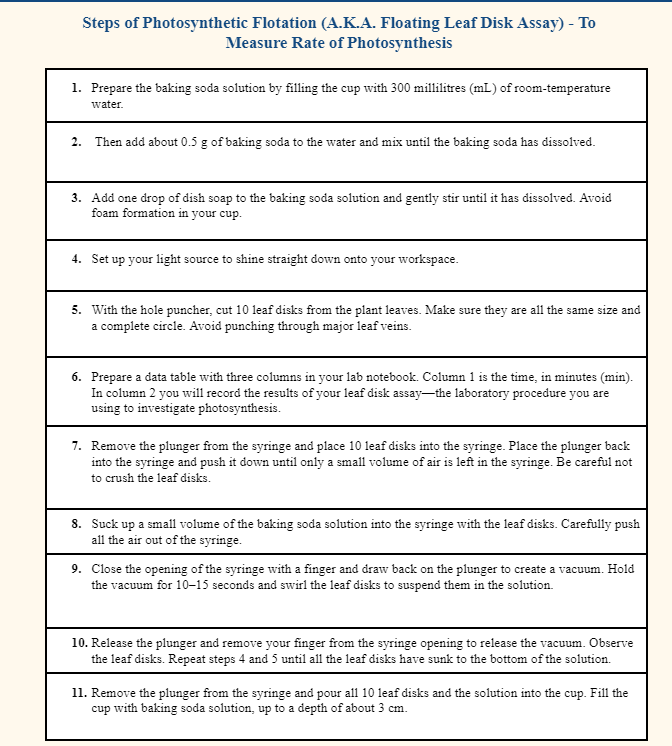
Wasaya, A., Zhang, X., Fang, Q., & Yan, Z. (2018). Root Phenotyping for Drought Tolerance: A Review. Agronomy, 8(11), 241. https://doi.org/10.3390/agronomy8110241
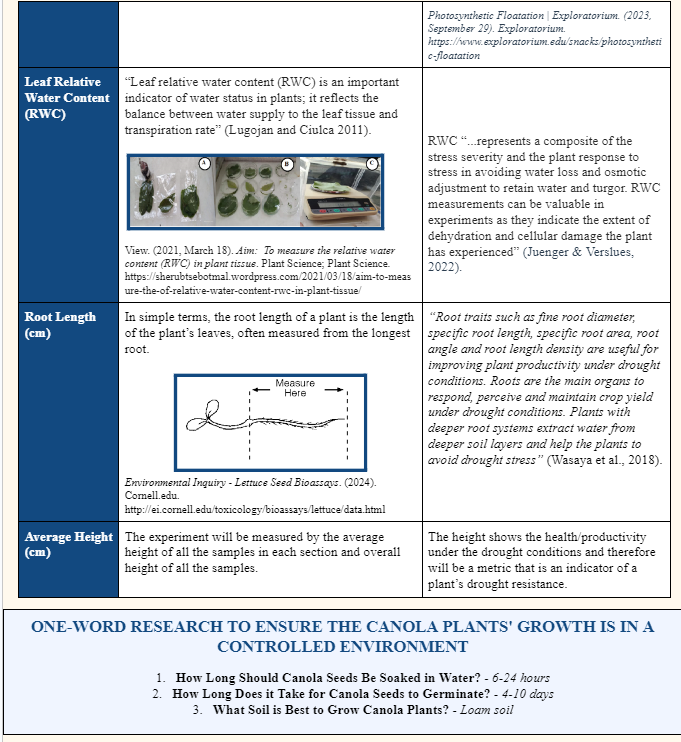
Lugojan, C. and Ciulca, S. (2011) Evaluation of relative water content in winter wheat. J. Hortic. Fores. Biotechnol. 15: 173–177.
Agriculture | Province of Manitoba. (2016). Province of Manitoba - Agriculture. https://www.gov.mb.ca/agriculture/environment/soil-management/soil-management-guide/soil-salinity.html
Effects of Soil Characteristics | Canola Encyclopedia. (n.d.). The Canola Council of Canada. https://www.canolacouncil.org/canola-encyclopedia/field-characteristics/effects-of-soil-characteristicks/
Juenger, T. E., & Verslues, P. E. (2022). Time for a drought experiment: Do you know your plants’ water status? The Plant Cell, 35(1), 10–23. https://doi.org/10.1093/plcell/koac324
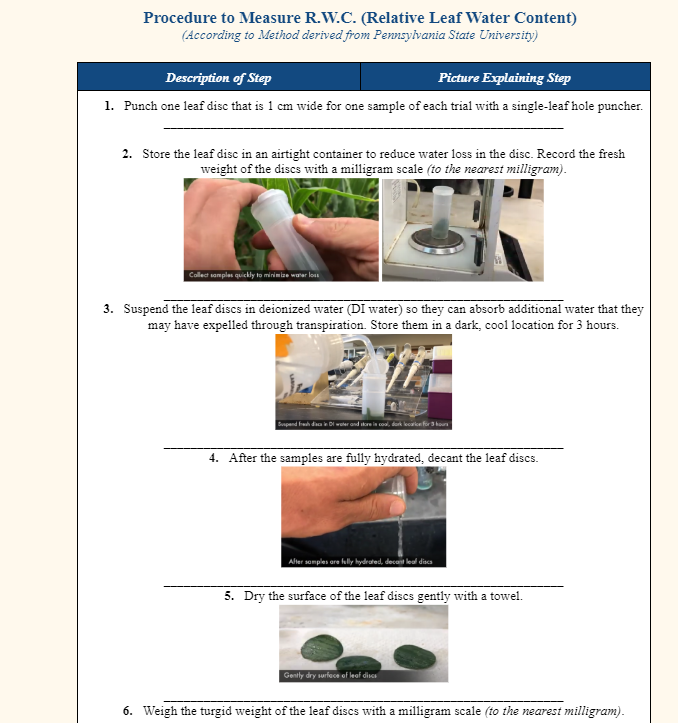
Aim: To measure plant tissue's relative water content (RWC). (2021, March 18). Plant Science. https://sherubtsebotmal.wordpress.com/2021/03/18/aim-to-measure-the-of-relative-water-content-rwc-in-plant-tissue/
Environmental Inquiry - Lettuce Seed Bioassays. (n.d.). Ei.cornell.edu. http://ei.cornell.edu/toxicology/bioassays/lettuce/data.html
Measure Photosynthesis with Floating Leaves | STEM Activity. (n.d.). Science Buddies. https://www.sciencebuddies.org/stem-activities/photosynthesis-floating-leaves
Arndt, S.K., Irawan, A., Sanders G.J. (2015) Apoplastic water fraction and rehydration techniques introduce significant errors in measurements of relative water content and osmotic potential in plant leaves. Physiologia Plantarum 155: 355-368
Measuring Leaf Relative Water Content. (n.d.). Www.youtube.com. https://www.youtube.com/watch?v=uyUYFKnaAnk
Jackson, G. (1999). Canola Nutrient Management. Number, 22. https://agresearch.montana.edu/wtarc/producerinfo/agronomy-nutrient-management/Canola/WTARCCanolaNutMgt.pdf
Azeem, Muhammad, et al. “Eco‐Friendly Three‐Dimensional Hydrogels for Sustainable Agricultural Applications: Current and Future Scenarios.” Polymers for Advanced Technologies, 19 June 2023, https://doi.org/10.1002/pat.6122. Accessed 25 Sept. 2023.
Walker, Kris. “The Environmental Applications of Hydrogels.” AZoCleantech, 8 Feb. 2013, www.azocleantech.com/article.aspx?ArticleID=373#:~:text=They%20help%20the%20environment%20through. Accessed 22 Jan. 2024.
Azeem, M., Islam, A., Rafi Ullah Khan, Rasool, A., Muhammad, Rizwan, M., Sher, F., & Rasheed, T. (2023). Eco‐friendly three‐dimensional hydrogels for sustainable agricultural applications: Current and future scenarios. Polymers for Advanced Technologies. https://doi.org/10.1002/pat.6122
El-Aziz, G. H. A., Ibrahim, A. S., & Fahmy, A. H. (2022). Using Environmentally Friendly Hydrogels to Alleviate the Negative Impact of Drought on Plants. Open Journal of Applied Sciences, 12(01), 111–133. https://doi.org/10.4236/ojapps.2022.121009
Grabowska-Polanowska, B., Garbowski, T., Dominika Bar-Michalczyk, & Kowalczyk, A. (2021, December 13). The benefits of synthetic or natural hydrogels application in agriculture: An overview article. ResearchGate; Polish Academy of Sciences Chancellery. https://www.researchgate.net/publication/357776287_The_benefits_of_synthetic_or_natural_hydrogels_application_in_agriculture_An_overview_article
Zhao, L., Zhou, Y., Zhang, J., Liang, H., Chen, X., & Tan, H. (2023). Natural Polymer-Based Hydrogels: From Polymer to Biomedical Applications. Pharmaceutics, 15(10), 2514–2514. https://doi.org/10.3390/pharmaceutics15102514
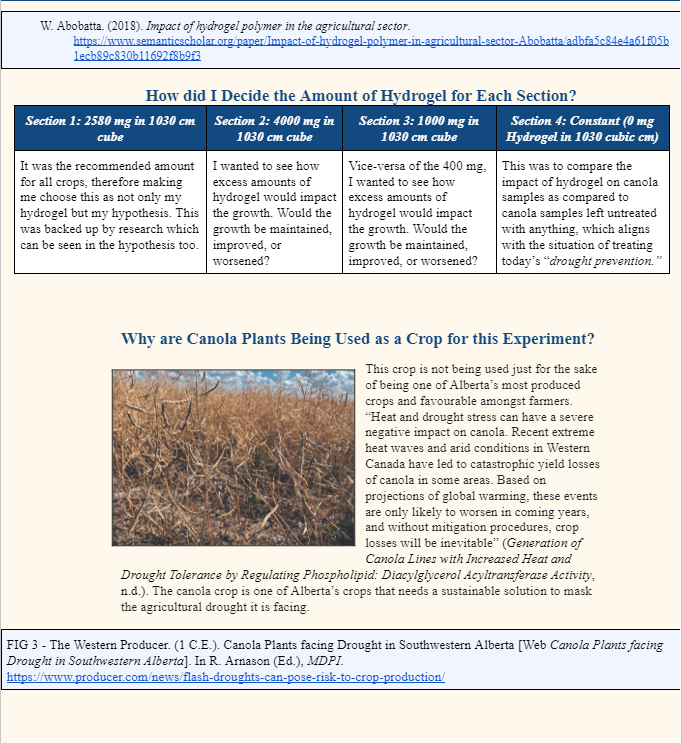
W. Abobatta. (2018). Impact of hydrogel polymer in the agricultural sector. https://www.semanticscholar.org/paper/Impact-of-hydrogel-polymer-in-agricultural-sector-Abobatta/adbfa5c84e4a61f05b1ecb89c830b11692f8b9f3
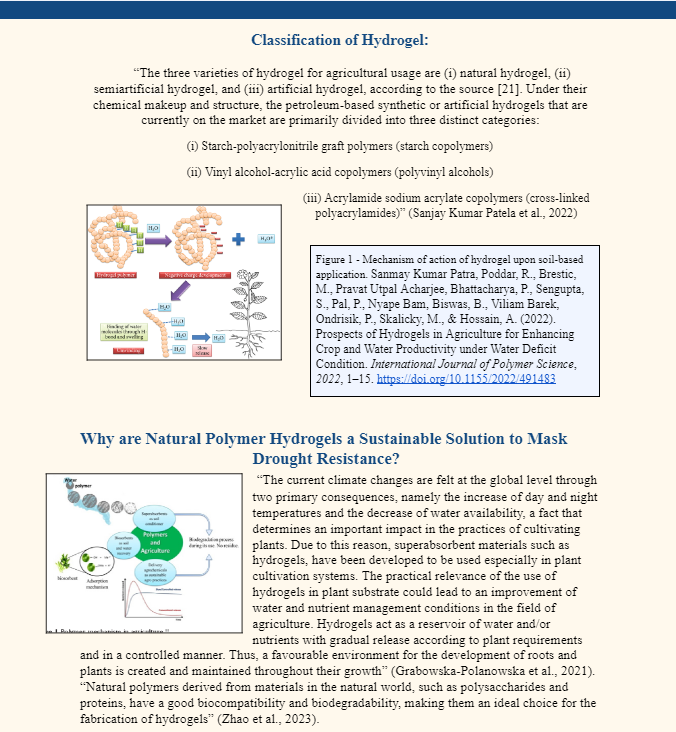
Sanmay Kumar Patra, Poddar, R., Brestic, M., Pravat Utpal Acharjee, Bhattacharya, P., Sengupta, S., Pal, P., Nyape Bam, Biswas, B., Viliam Barek, Ondrisik, P., Skalicky, M., & Hossain, A. (2022). Prospects of Hydrogels in Agriculture for Enhancing Crop and Water Productivity under Water Deficit Condition. International Journal of Polymer Science, 2022, 1–15. https://doi.org/10.1155/2022/4914836
Acknowledgement