Creating an efficient ecologically friendly filter to remove microplastics from seawater.
Grade 9
Presentation
Problem
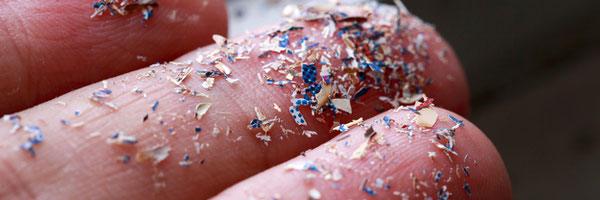
What are microplastics and why are they harmful?
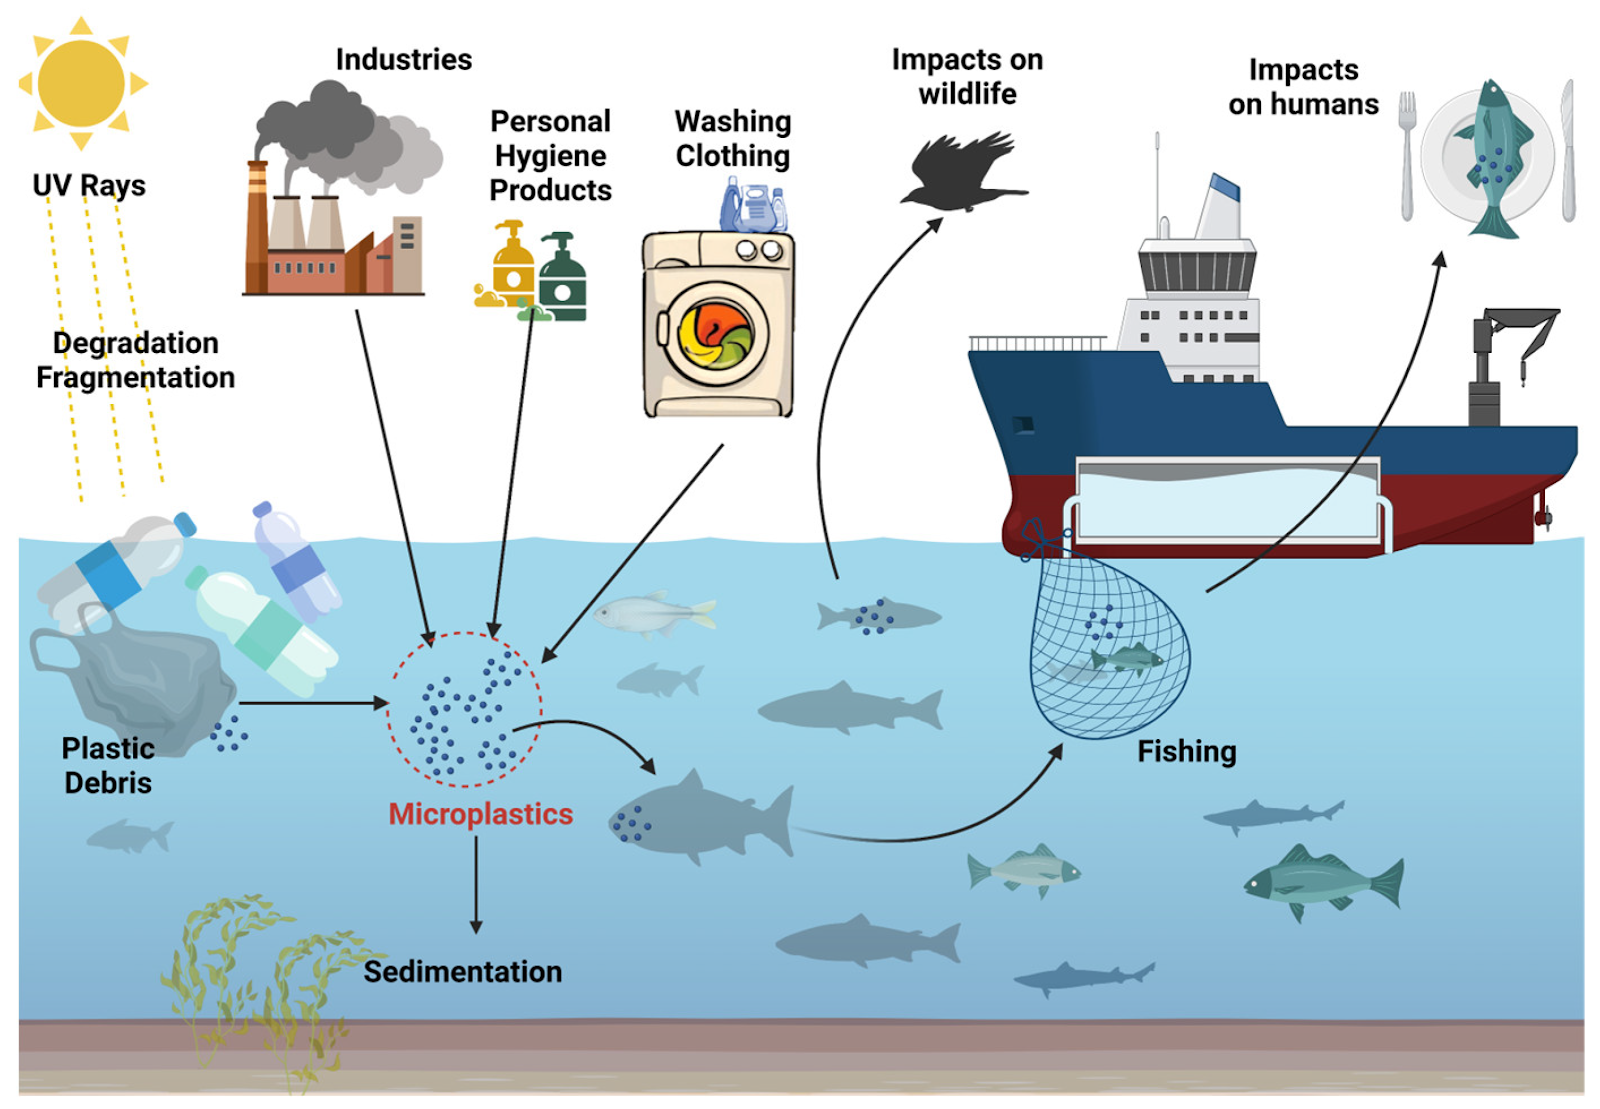
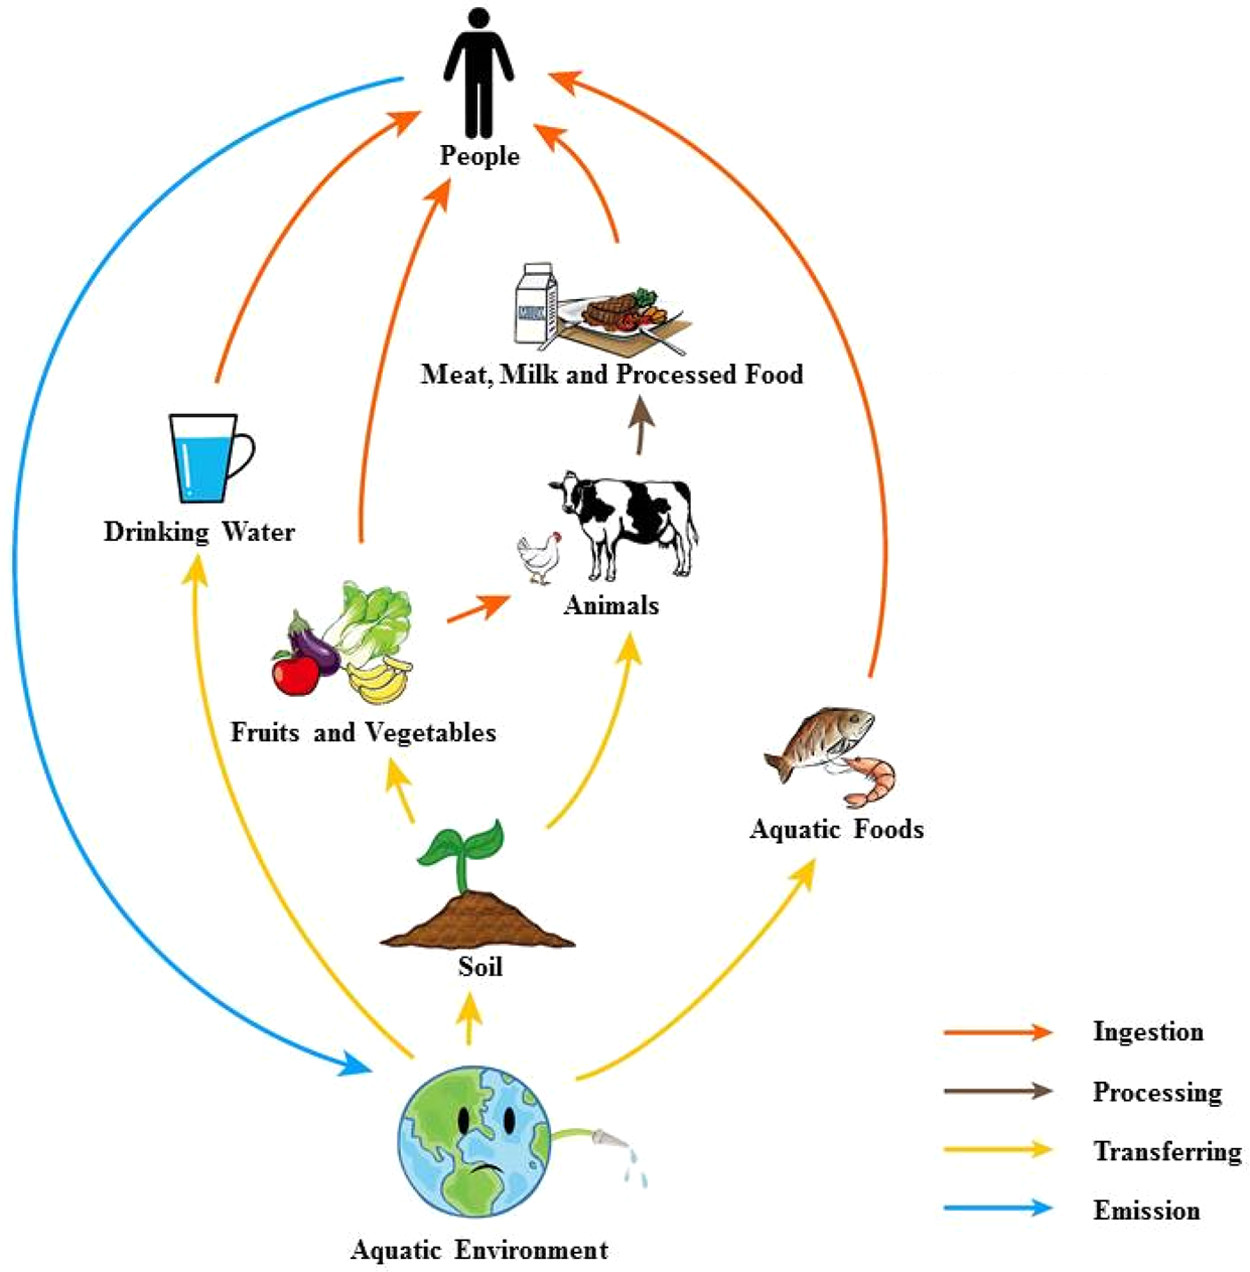
As the name suggests, microplastics are small plastic particles. Officially, they are defined as masses of plastic less than five millimeters (0.2 inches) in diameter, smaller in diameter than a common pearl used in jewelry. There are two categories of microplastics: primary and secondary. Primary microplastics are small particles intended for commercial use, such as cosmetics. Further another example is microfibers separated from clothing and other textiles, such as fishing nets. Secondary microplastics are particles produced by the breakdown of larger plastic particles such as water bottles. This degradation is caused by exposure to environmental factors, mainly solar radiation and ocean waves. The problem with microplastics is that like plastic items of all sizes, they do not easily break down into harmless molecules. Plastics can take hundreds or thousands of years to break down and destroy the environment in the meantime. On beaches, microplastics appear as small multicolored pieces of plastic in the sand. In the oceans, marine animals often ingest microplastic pollution. Some of this environmental pollution is caused by litter, but much of it is caused by storms, water currents and wind that carry plastic, both whole objects and microplastics into our oceans. Single-use plastics are items designed to be used only once and then thrown away, such as straws. As a result, this causes a major source of secondary plastics in the environment. Microplastics have been found in marine organisms from plankton to whales, commercial seafood and even drinking water. Alarmingly, standard water treatment plants cannot remove all traces of microplastics. To further complicate matters, ocean microplastics can bind to other harmful chemicals before being consumed by marine life. After they are consumed by smaller animals the chain only grows as it moves on into the cycle of life. In a recent review published in 2023, titled "Potential Health Impact of Microplastics: A Review of Environmental Distribution, Human Exposure, and Toxic Effects," the authors concluded that the toxicity research on microplastics show that the exposure will cause intestinal injury, liver infection, flora imbalance, lipid accumulation, and then lead to metabolic disorder. In addition, the microplastic exposure increases the expression of inflammatory factors, inhibits the activity of acetylcholinesterase, reduces the quality of germ cells, and affects embryo development. As a result, many countries are taking steps to reduce microplastics in the environment. A 2017 UN resolution addressed microplastics and the need for regulations to reduce this threat to our oceans, their wildlife and human health.
What happens when humans ingest microplastics?
They can absorb unwanted chemicals from the environment, such as heavy metals, polychlorinated biphenyls (PCBs), and pesticides.When humans ingest microplastics, their exposure to these chemicals increases and can have potentially toxic effects. In a 2022 research study titled, "Discovery and quantification of plastic particle pollution in human blood," the researchers found that microplastics are being found in human blood. They can latch on to the outer membranes of red blood cells and may limit their ability to transport oxygen. This can cause multiple failures in the human body.
Problem
As stated in the paragraph above, microplastics are a concern and need to be removed from our oceans. Not only do they harm animals and ecosystems, but they negatively affect human health and our way of life. If nothing is done then industries like fishing could be greatly impacted and result in their disappearance and approximately 40 million people will lose their jobs. This issue should be alarming to all of us but surprisingly no organizations or government officials are investing to try and find solutions to this issue. I decided to take on this issue myself to better the world and our ecosystems. Since there is no solution to this problem that is being actively pursued in the world, my science projects aim to investigate this problem and offer a solution to support humanity.
Method
How will the prototype be made to represent real life usage?
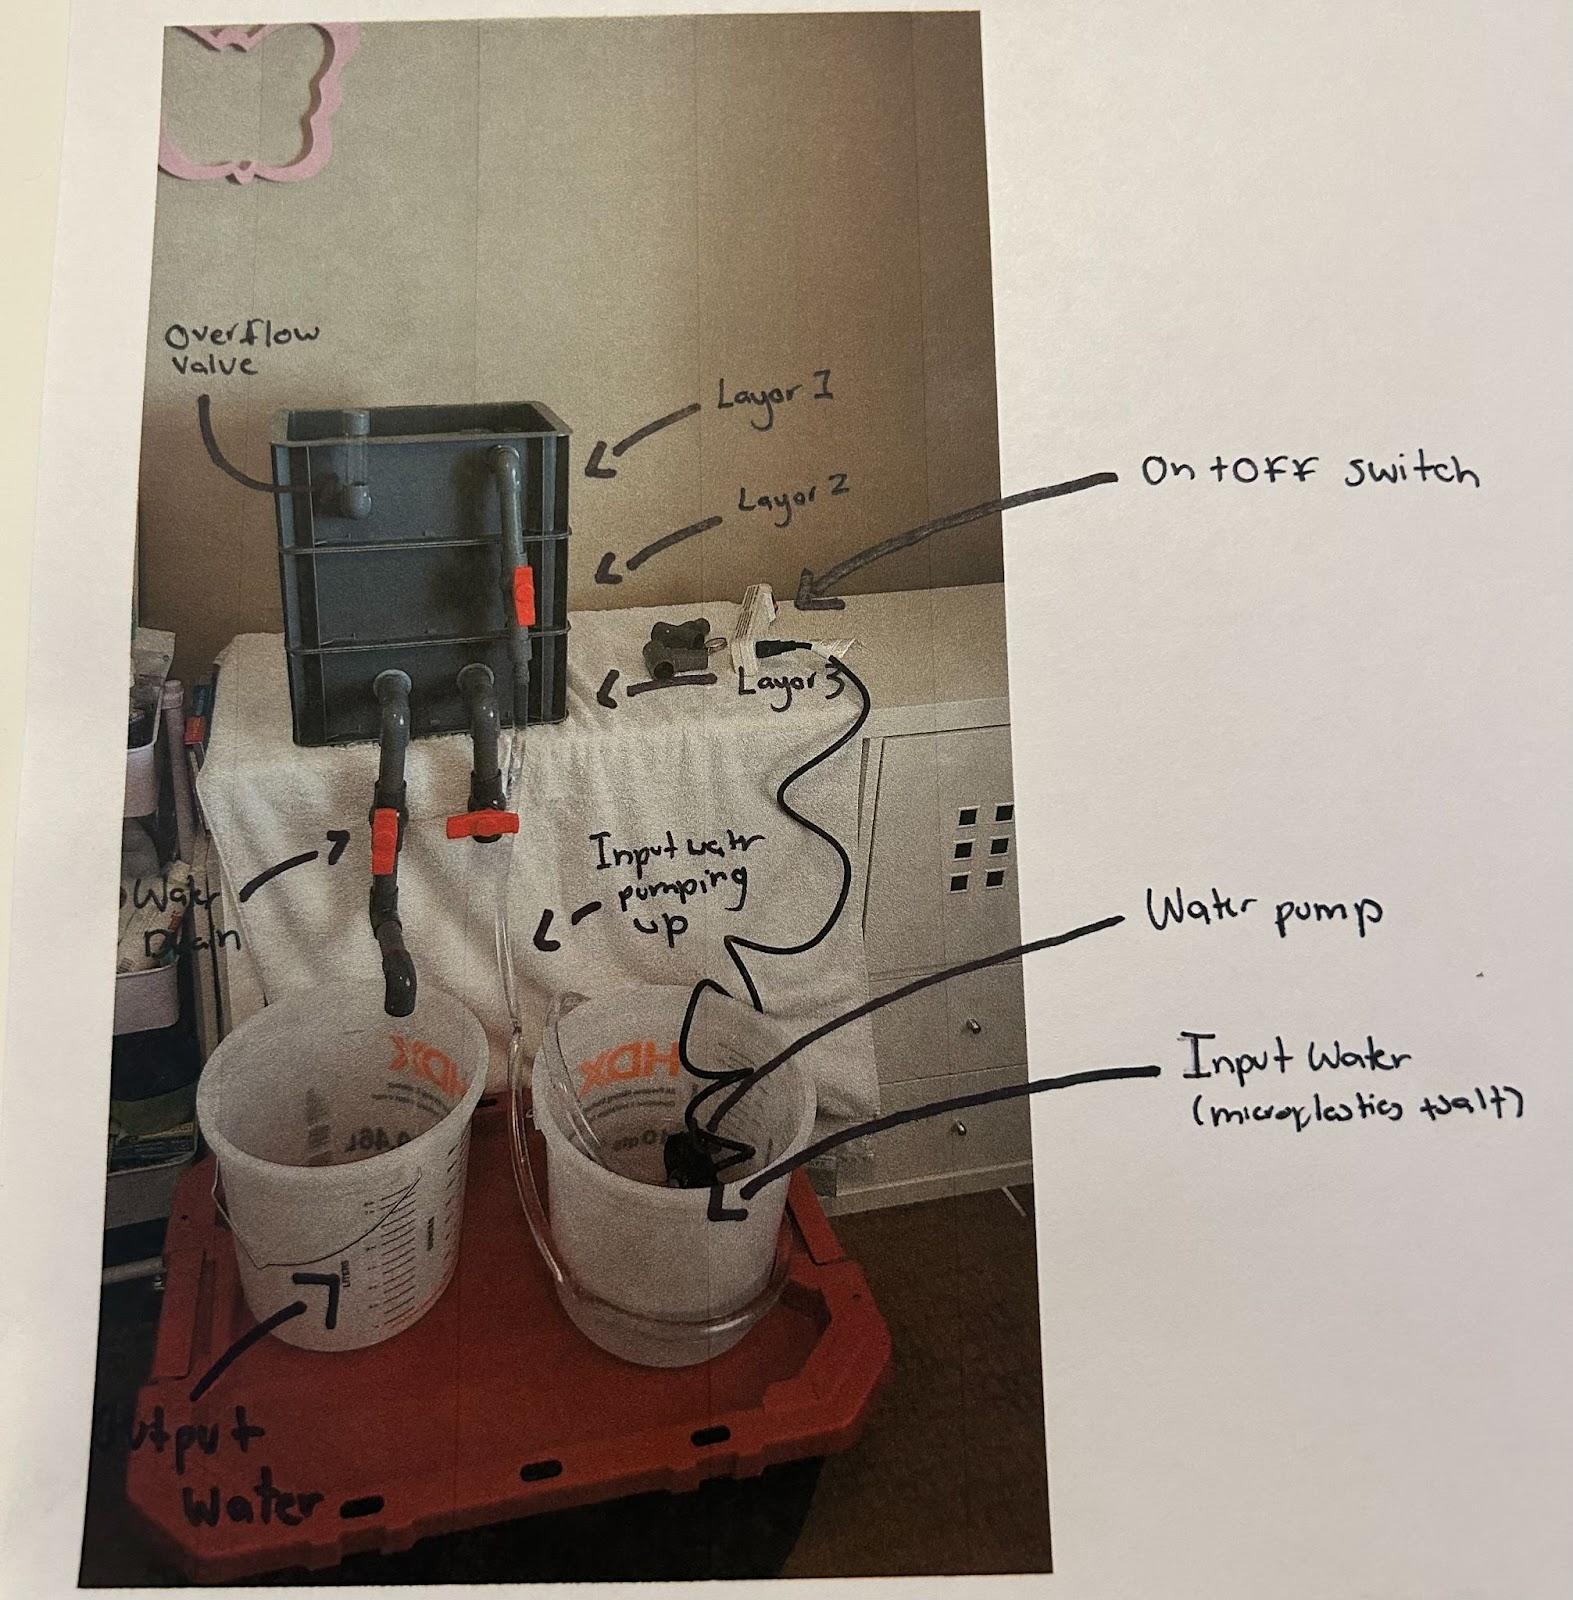
In the real world the filter would be attached to boats roaming the ocean. The water would travel up a tube into the filter then out the other end back into the ocean. Right now there are methods put in place to remove microplastics from controlled lab water such as reverse osmosis, lab created metallic powders and bacteria that slowly eats away at the microplastics. Unfortunately all of these strategies have major flaws if they were to be used in our oceans. Reverse osmosis needs heavy machinery usually found in controlled labs in order for the process to work. Metallic powders are great for removing microplastics by attracting them and can not be put into a filter that would be used in the ocean as it would interrupt delicate balances. Bacteria that would eat away at microplastics take way too long. The rate at which they would remove the plastics would be too slow compared to the rate at which the plastics are being produced
My filter design aims to do the following:
(1) remove the plastics at a faster rate than they are being produced,
(2) perform the task effectively.
Where does eco friendliness come in?
In this specific situation, eco friendliness means not removing matter that is crucial to ocean water like salt, yet still filtering out microplastics as well as using materials that do not dissolve into water or leave products in water.
Filter creation process/design
1) Create model
2) Find/Research for materials suitable for filtering out microplastics and efficiency
3) Test for saltwatwe loss to test for ecologically friendliness
4) Put chosen materials into filter (creation process)
5) Test and revise the filter (tweaks for design)
6) Analyze results
7) Create a conclusion
Seawater simulation process:
To simulate my seawater, I am including the saline portion but unfortunately a limitation for my project is that I cannot include any microbes (algae, bacteria) in my simulated seawater.
Salts such as table salt, kosher salt, sea salt, and rock salt can all be used to create the illusion of the ocean. The least murky salt water will be made using kosher salt, although any kind of salt solution will become less foggy after sitting for a few hours or, ideally, overnight.
For this project 8 liters of water will be used. Since the instructed amount of water to be used does not match up with the amount I need, calculations will be performed.
Instructions:
Seawater ranges in salinity from 33 to 38 ppt (SF Fig. 2.3). The average salinity of ocean water is 35 ppt.
- Weigh 35 g of salt.
- Add the salt to a beaker and add fresh water until the total mass is 1,000 g.
- Stir with a stirring rod until all the salt is dissolved.
My calculations
35 g/L
8l per trial
8Lx 35 g/L = 280g
Total amount of salt needed = 280g
After a trial was done to measure salt levels before and after and the salinity was tested through a hydrometer it was off the charts so I decided to decrease the salt levels to 250g.
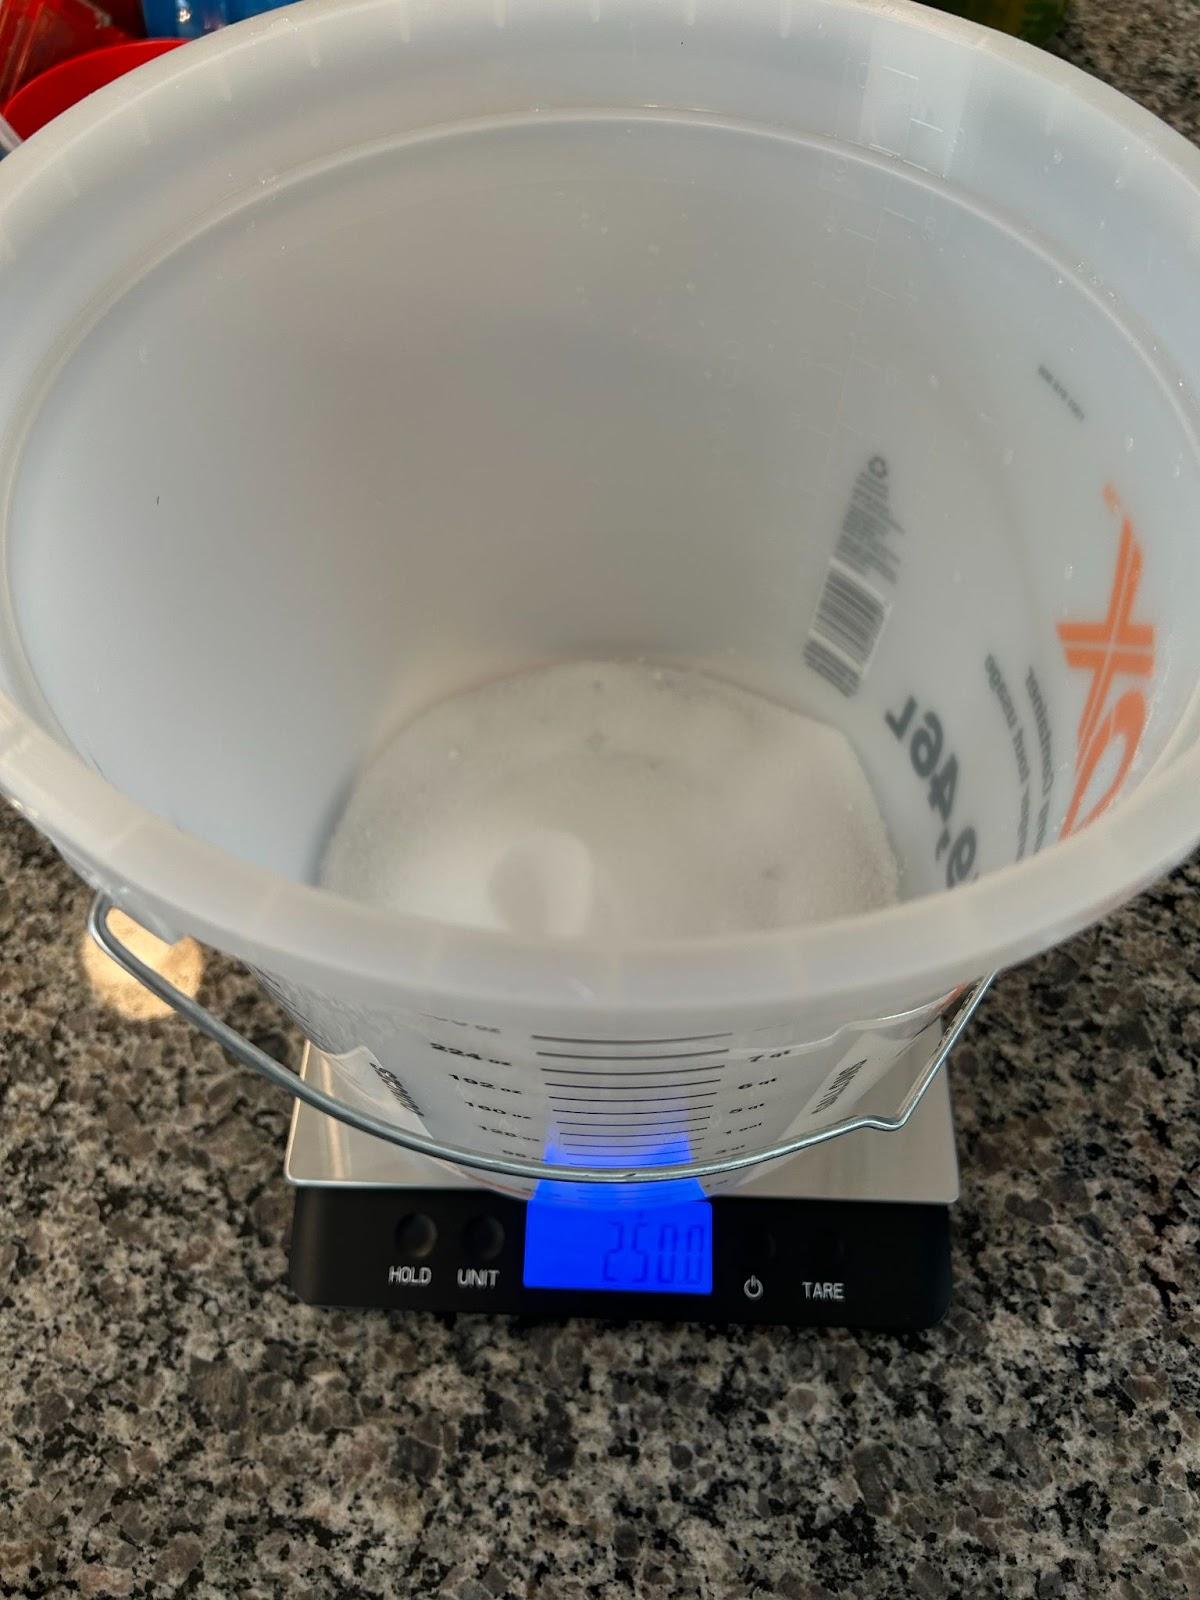
Image of salt measurements without water
Measuring the water before and after it goes through the filter created a way for me to check whether vital nutrients in the water (like salt) are being pulled away in the filter. To measure this amount, I will measure a cup of the solution before and after it goes through the filter. I will then check both solutions with a hydrometer to check for salinization loss.
Microplastics
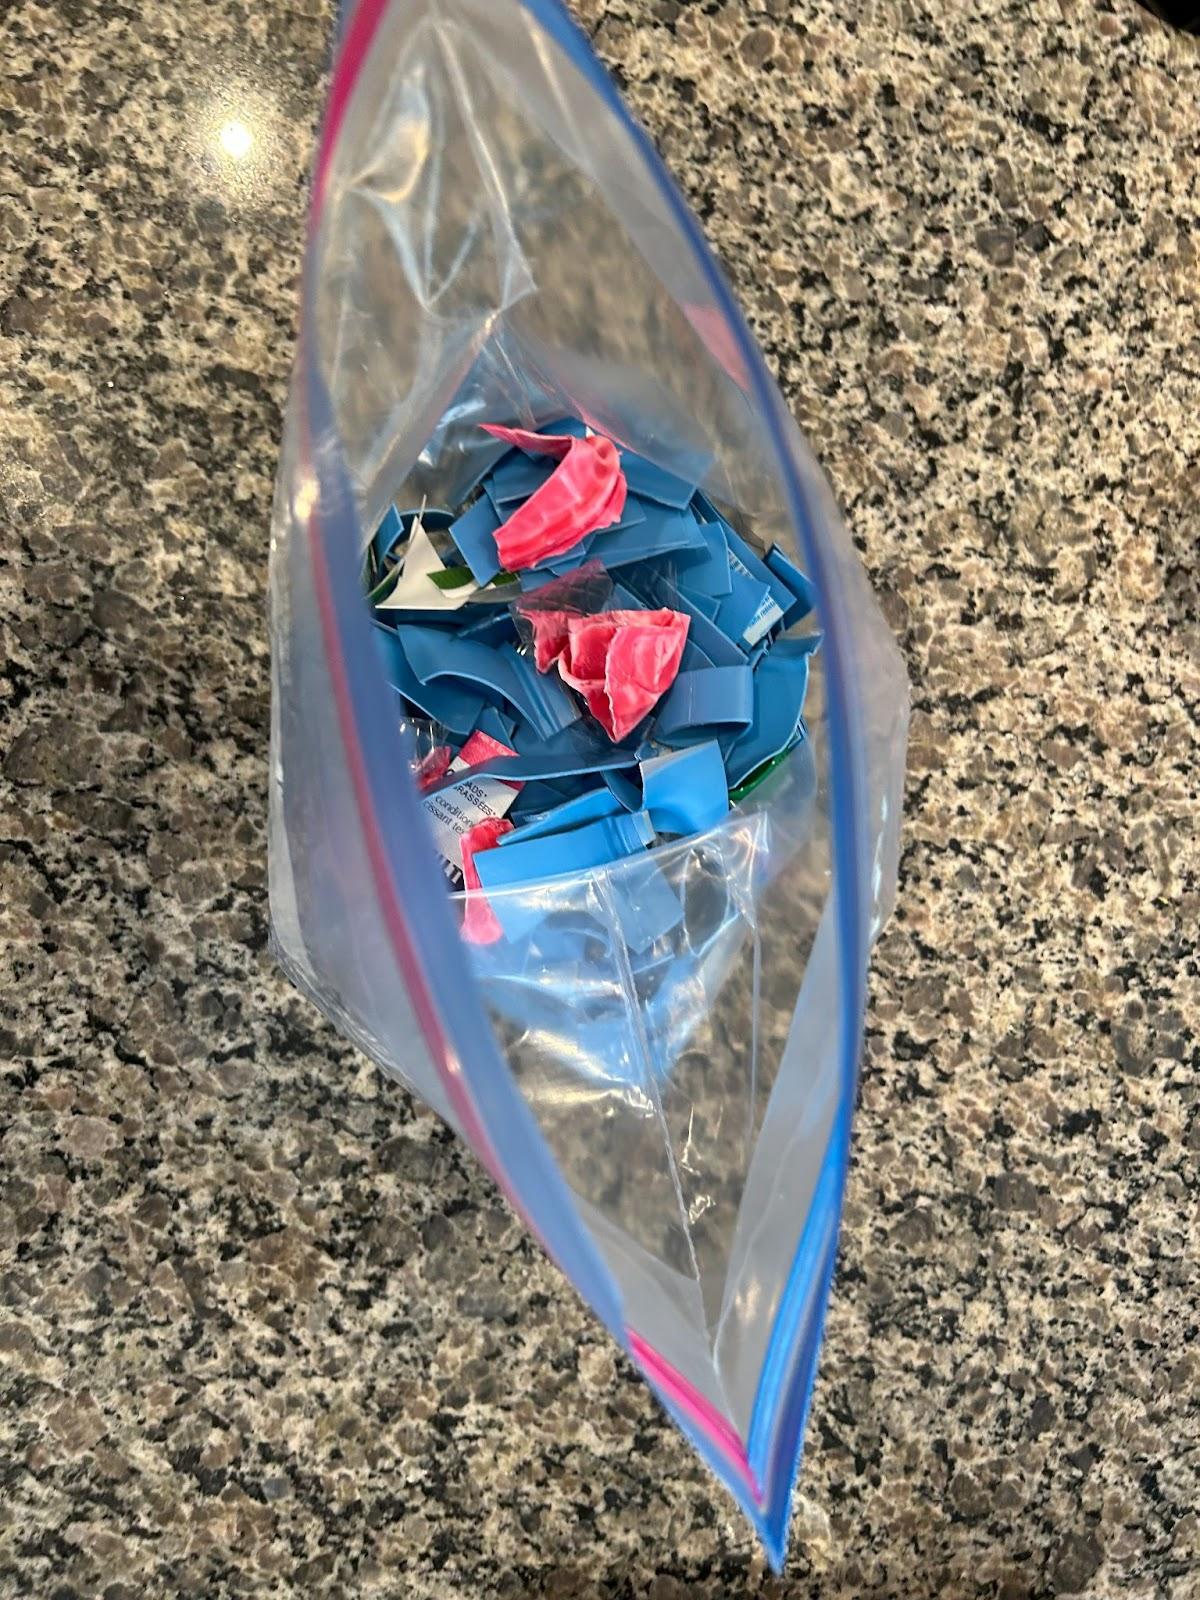
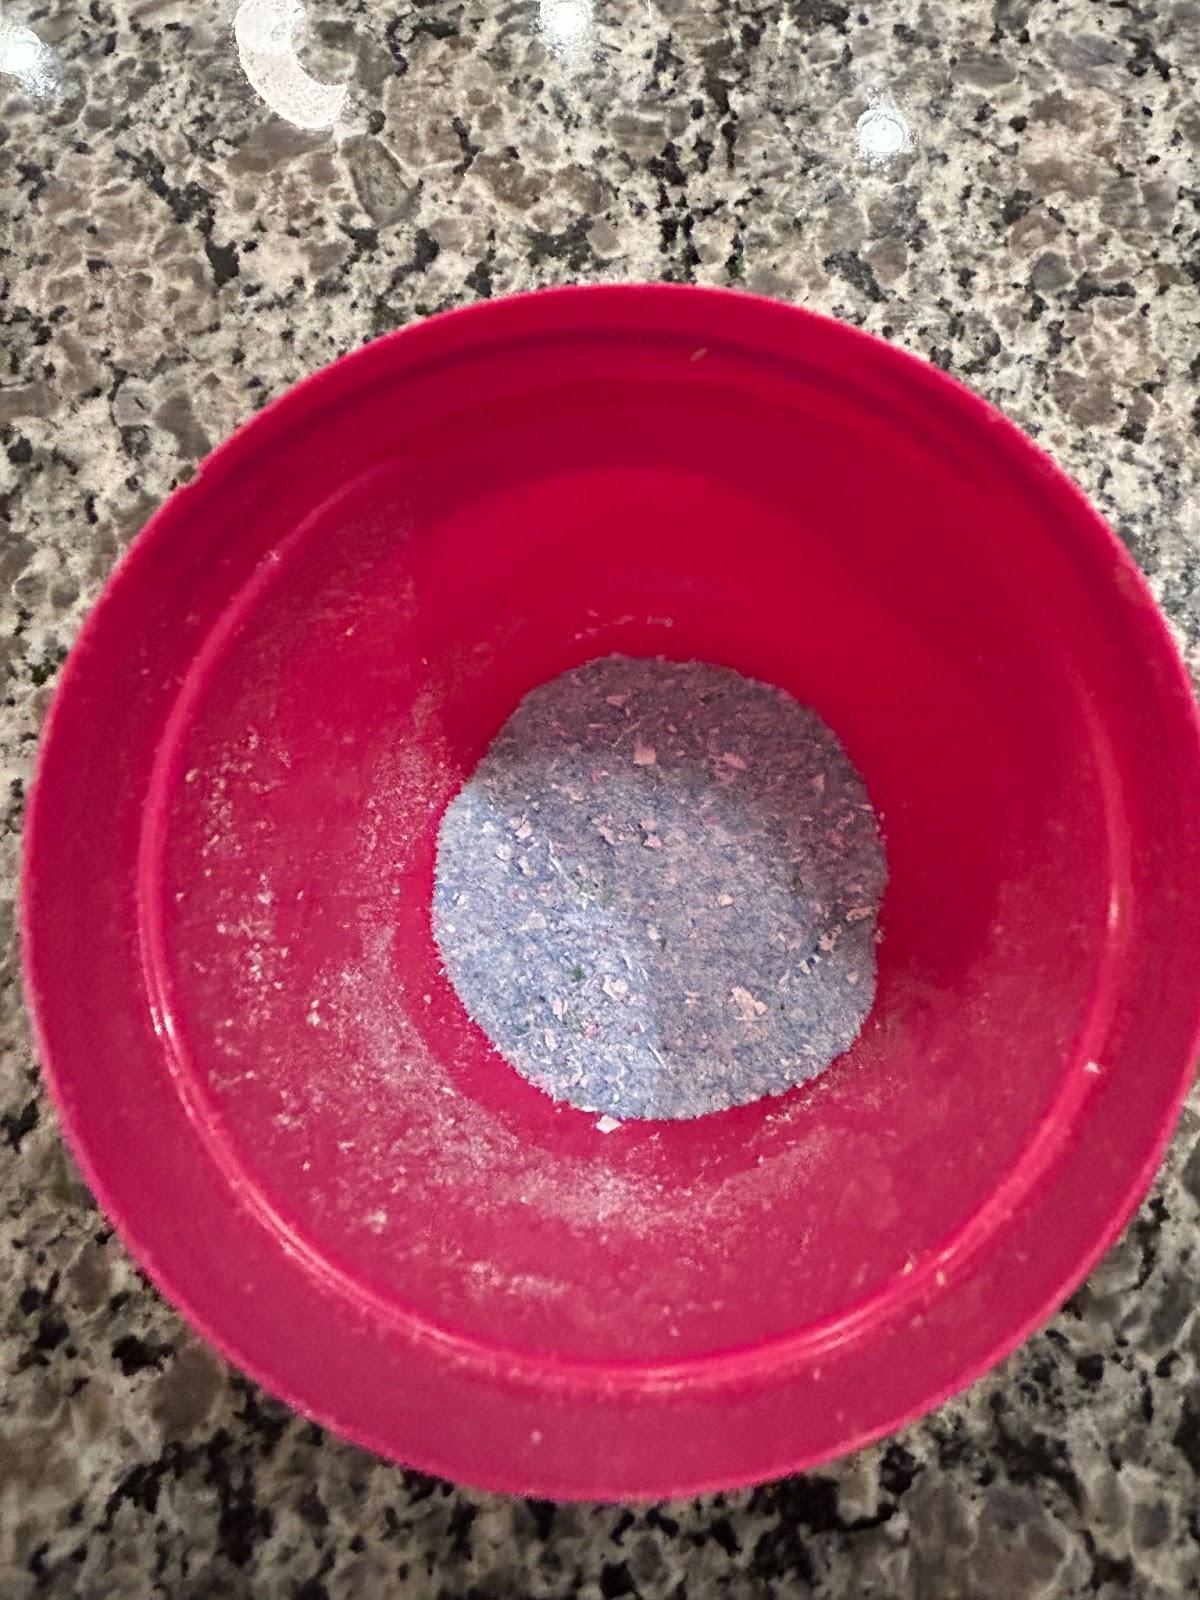
To create microplastics that will be used in the project, common plastic objects are chopped into coarse pieces using scissors and then ground into 0.5 − 2 mm grains using a stainless steel electric coffee grinder. They are then sifted through a strainer to ensure they are the smallest they can be.
Before grinding and sifting
Video compared to hand - https://drive.google.com/file/d/1FKnRgkEA6OLvs4BNJCgiIcUnkXAokKxx/view?usp=sharing
After grinding and sifting:
Video compared to hand - https://drive.google.com/file/d/1WZpXM8D29oerBwKXZd48oJZGAc6pWSV3/view?usp=sharing
For every gallon of water in the sea there are about 4-6 microplastics. I am using 8 liters of water for my experiment. I will use 1/4 tsp of microplastics for each test. Please note that the amount of microplastics have to be exaggerated so they can be better analyzed. This would also happen in the ocean as there is not exactly 4-6m microplastics per each gallon yet instead some areas might be more contaminated like places near human inhabited lands.
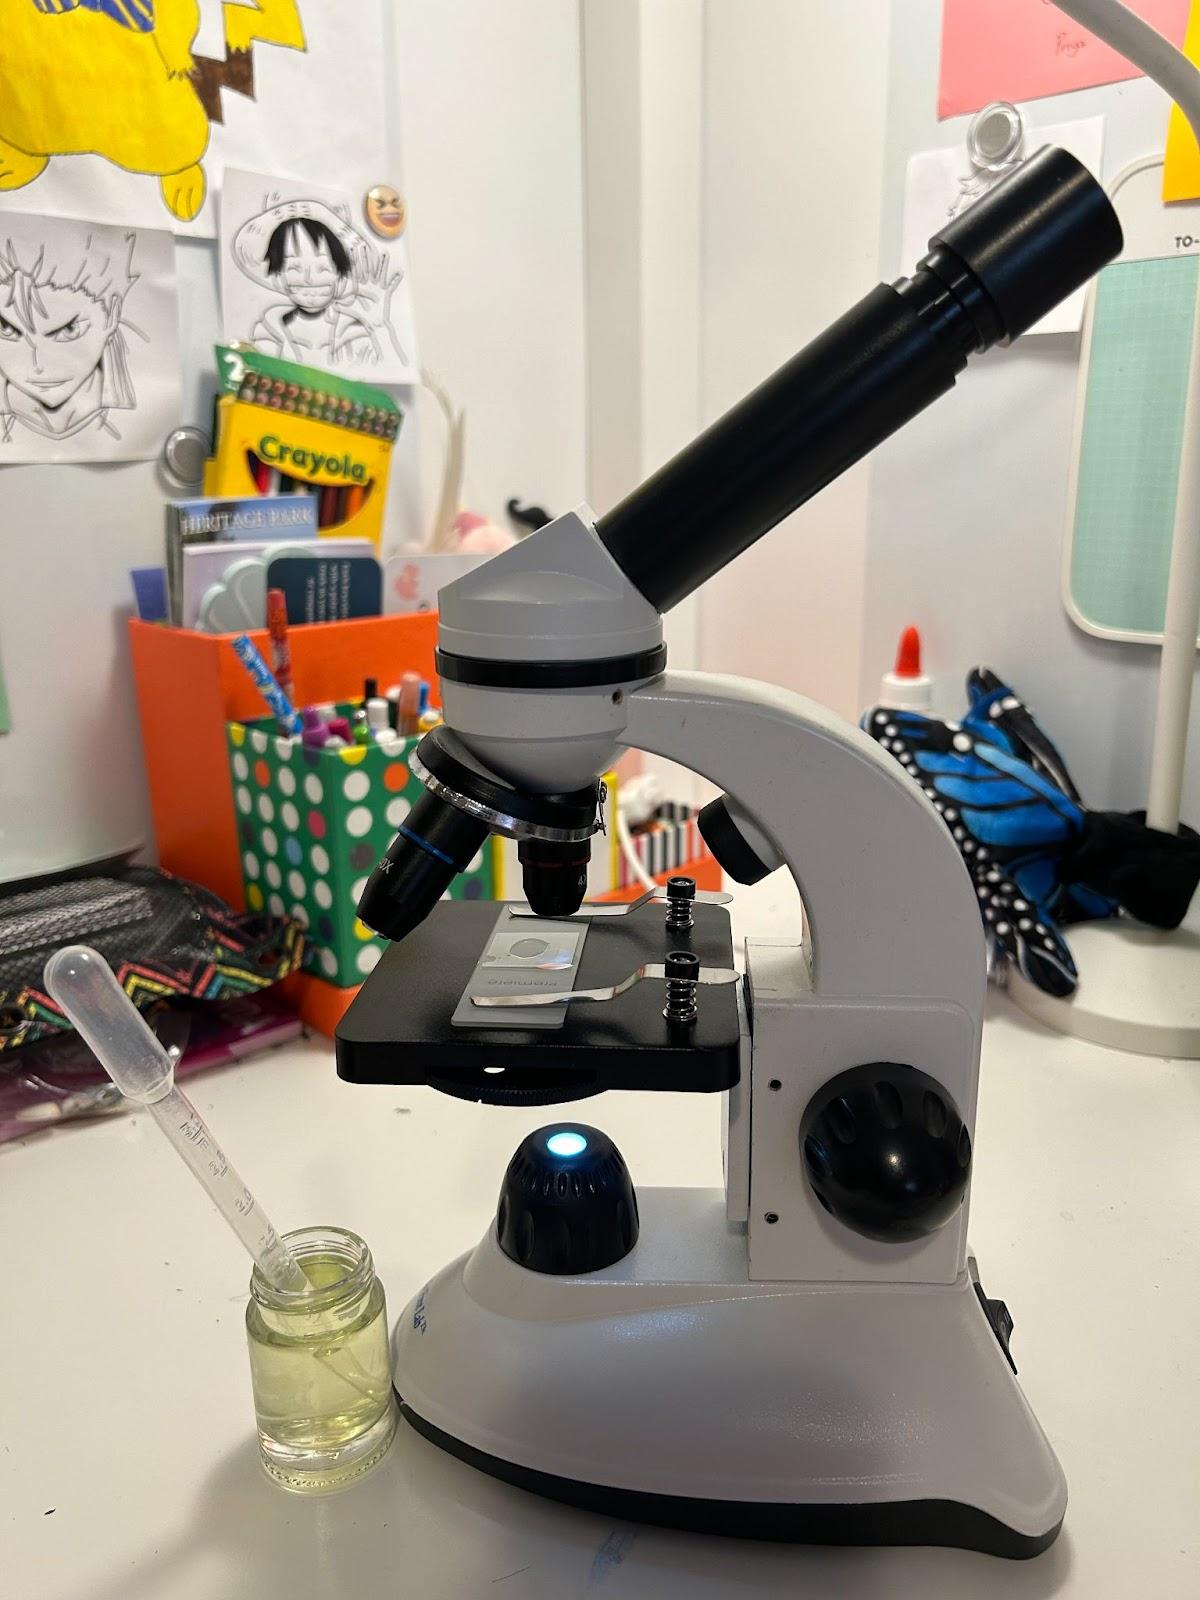
Measurements
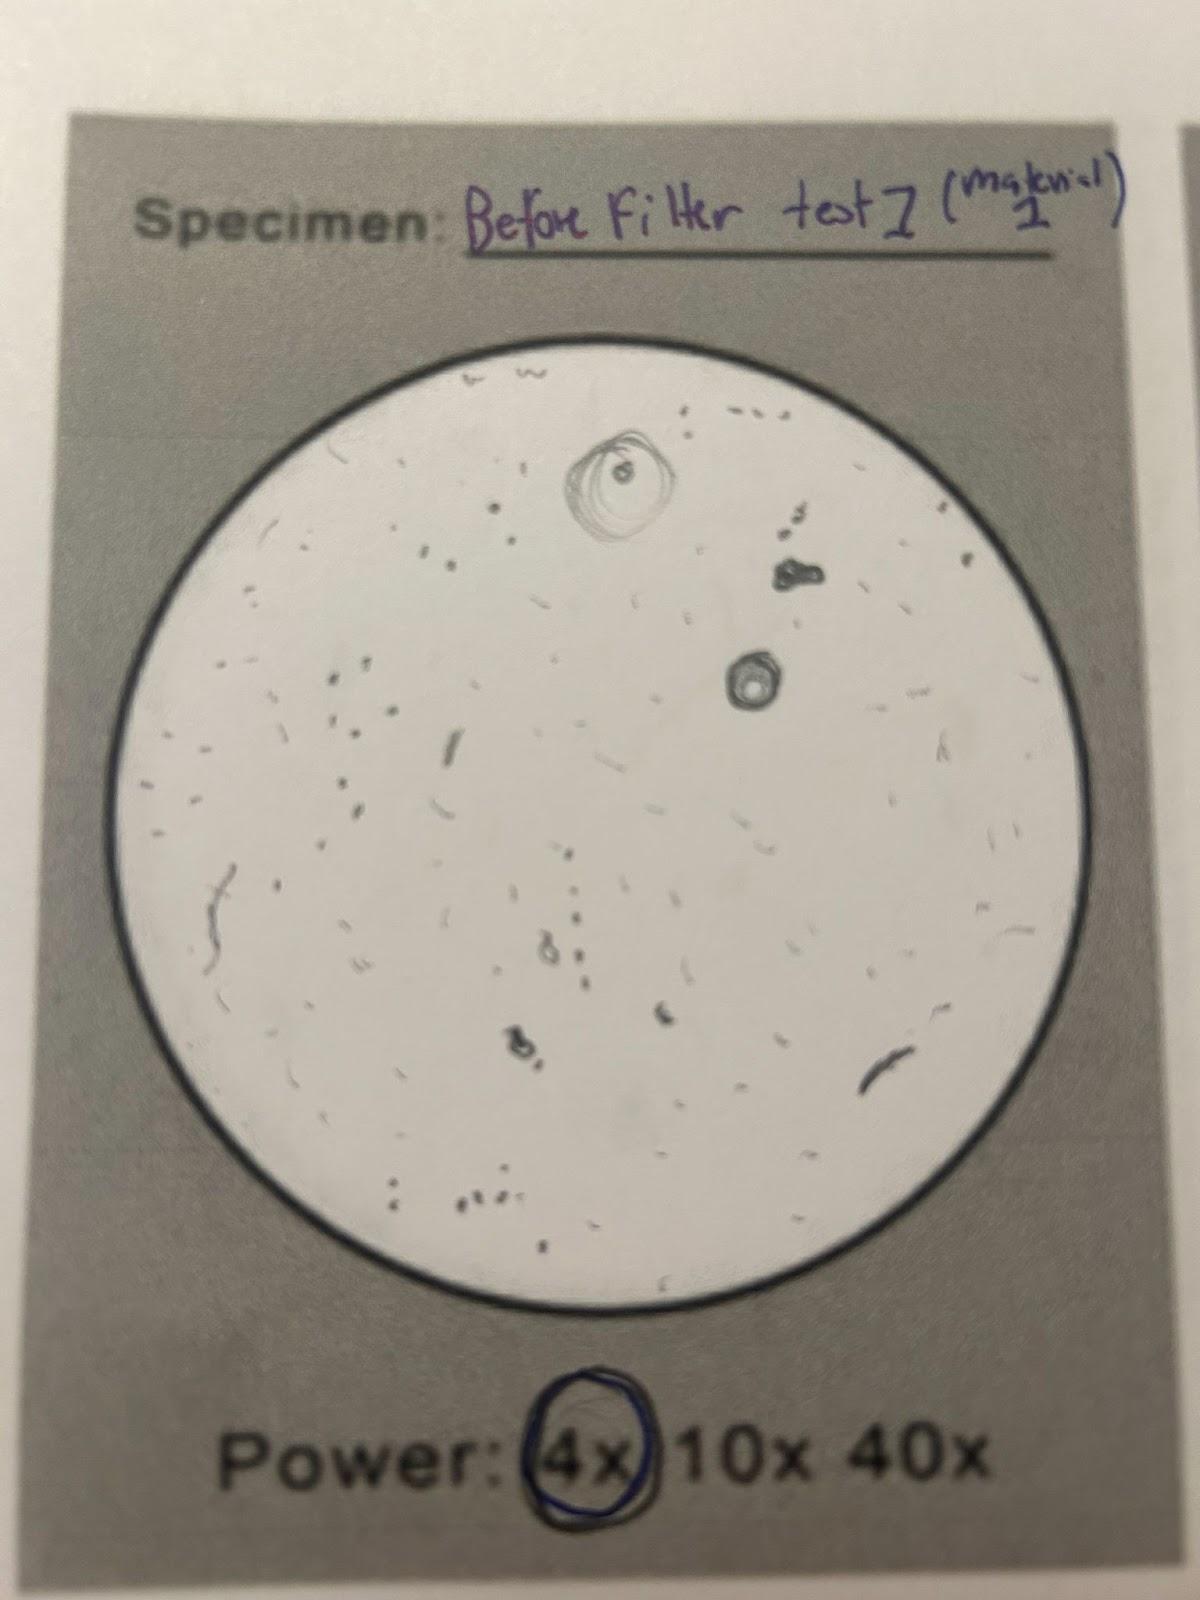
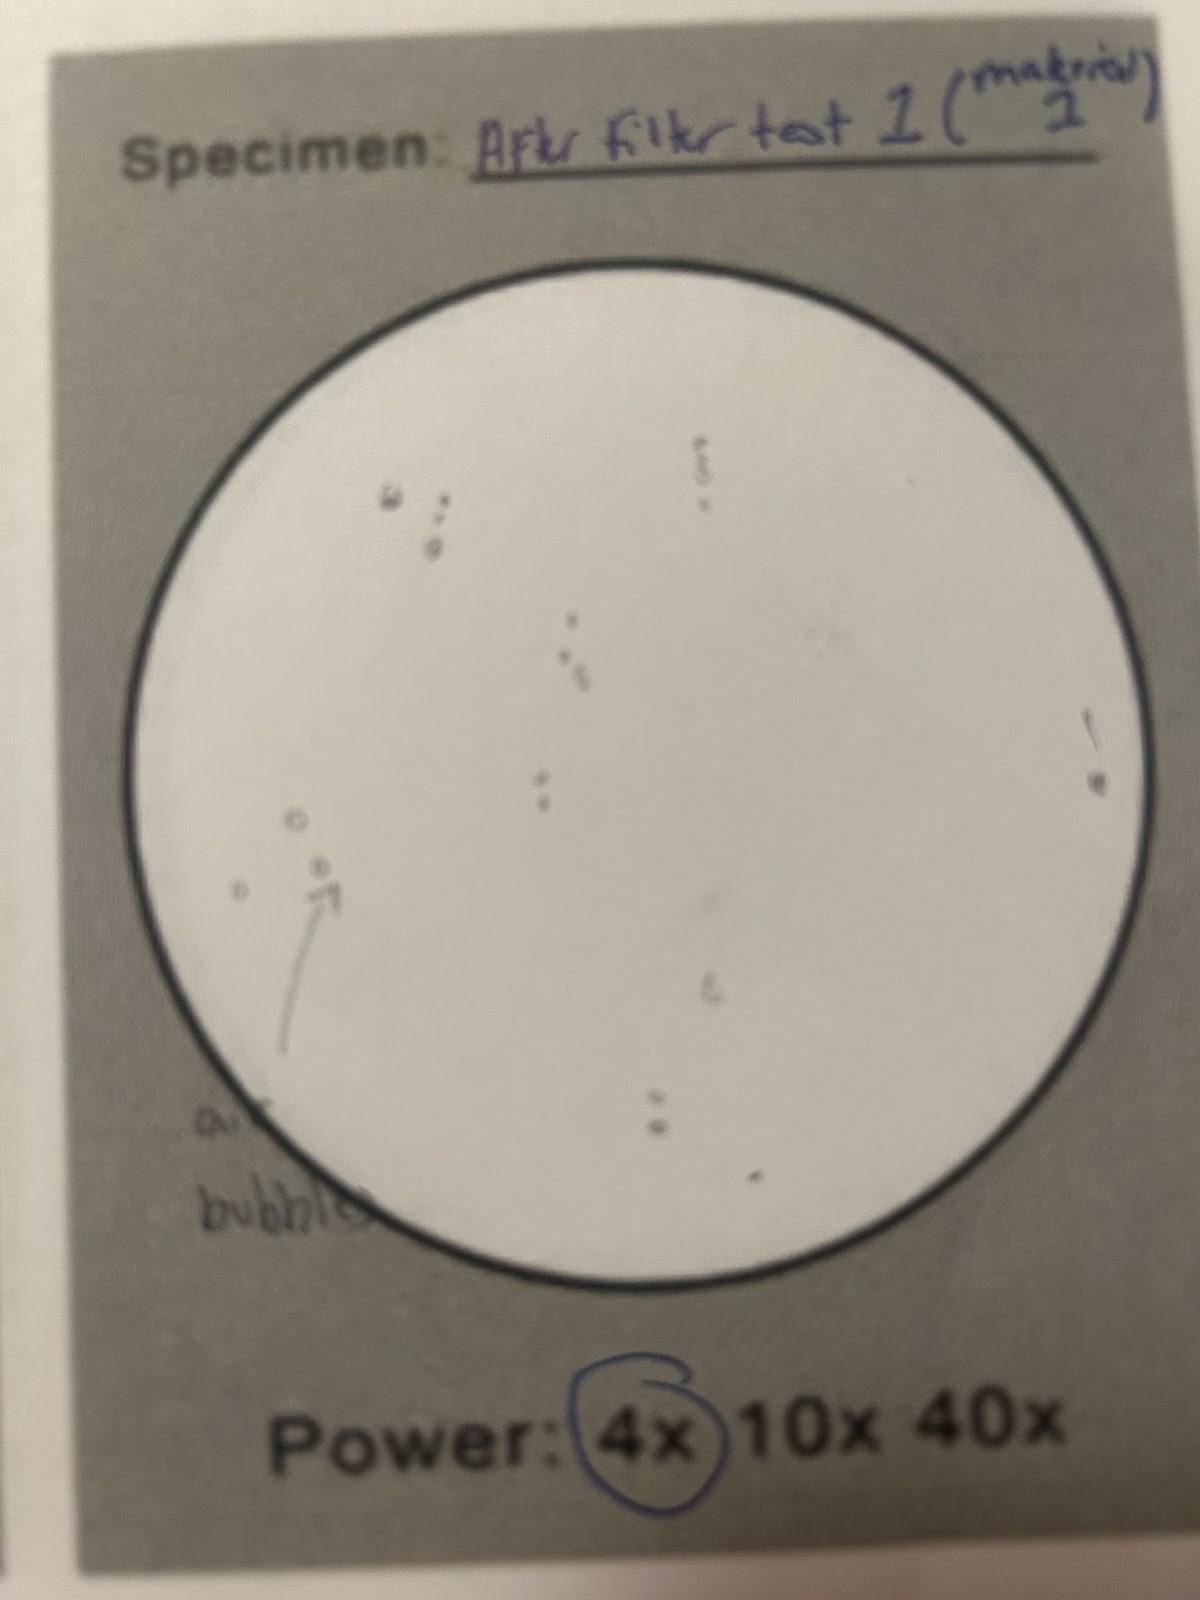
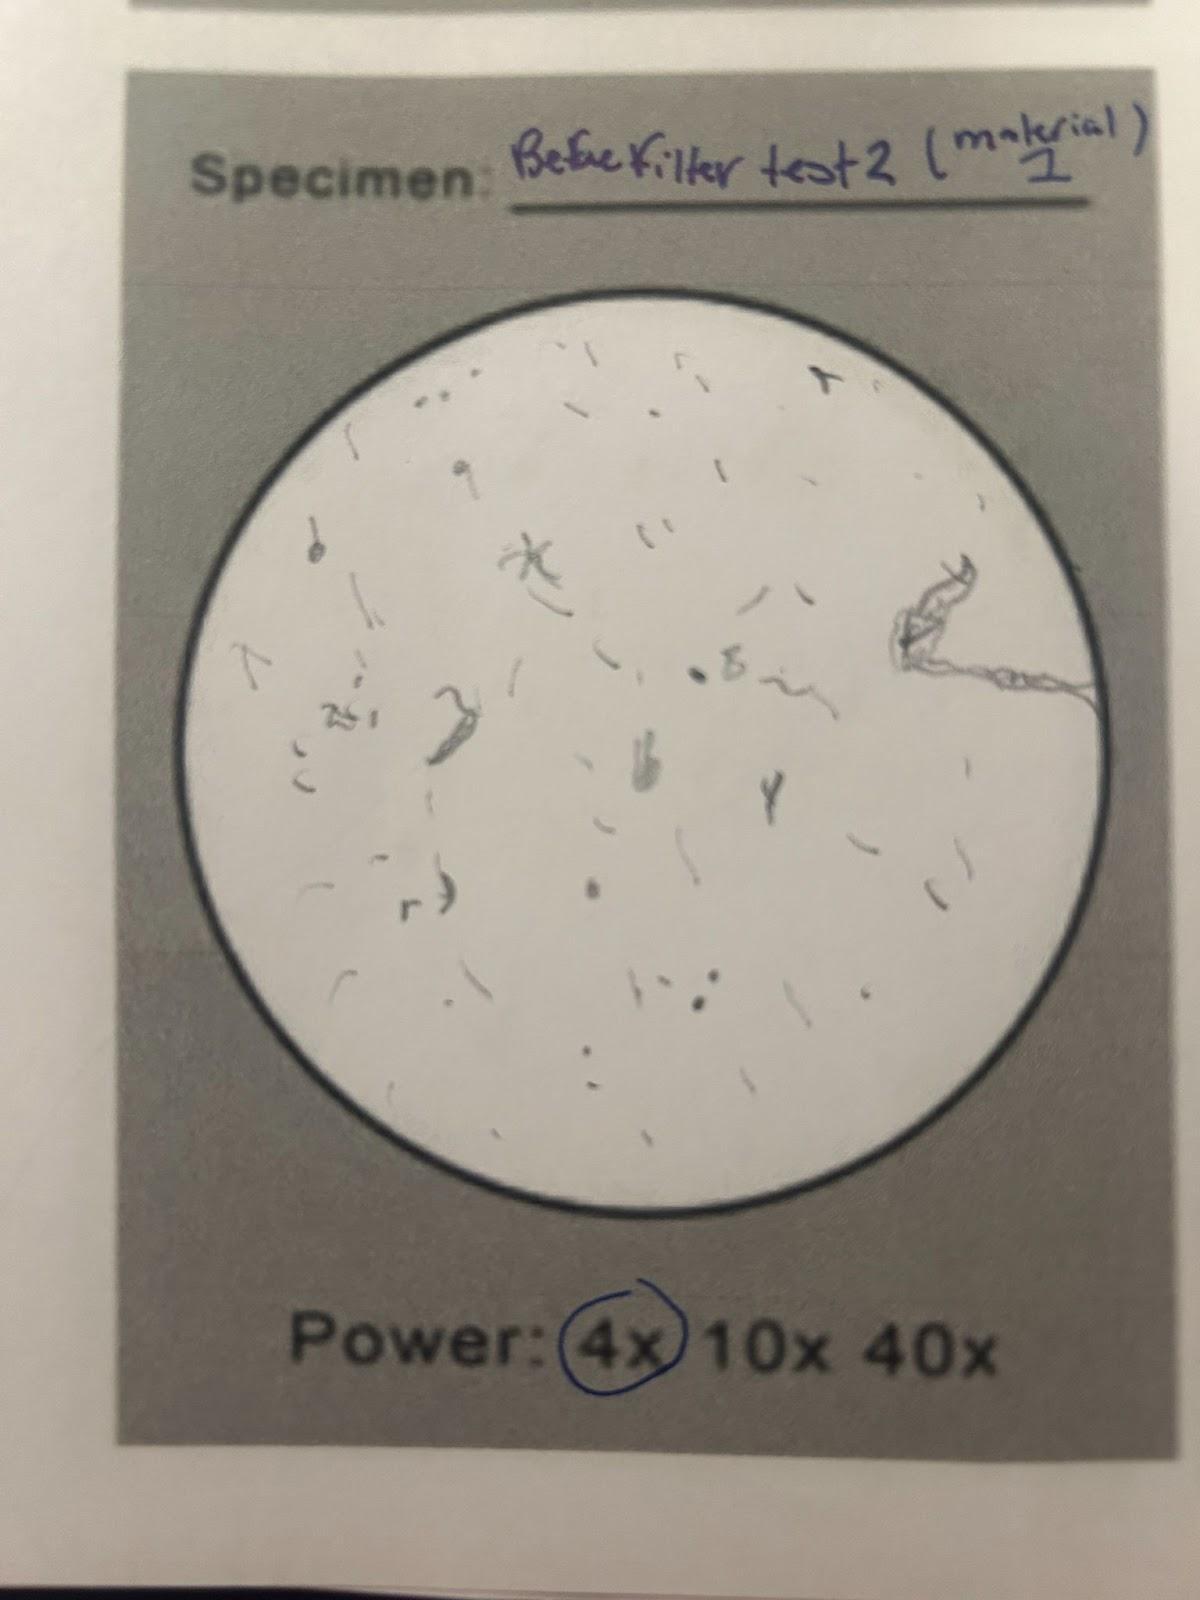
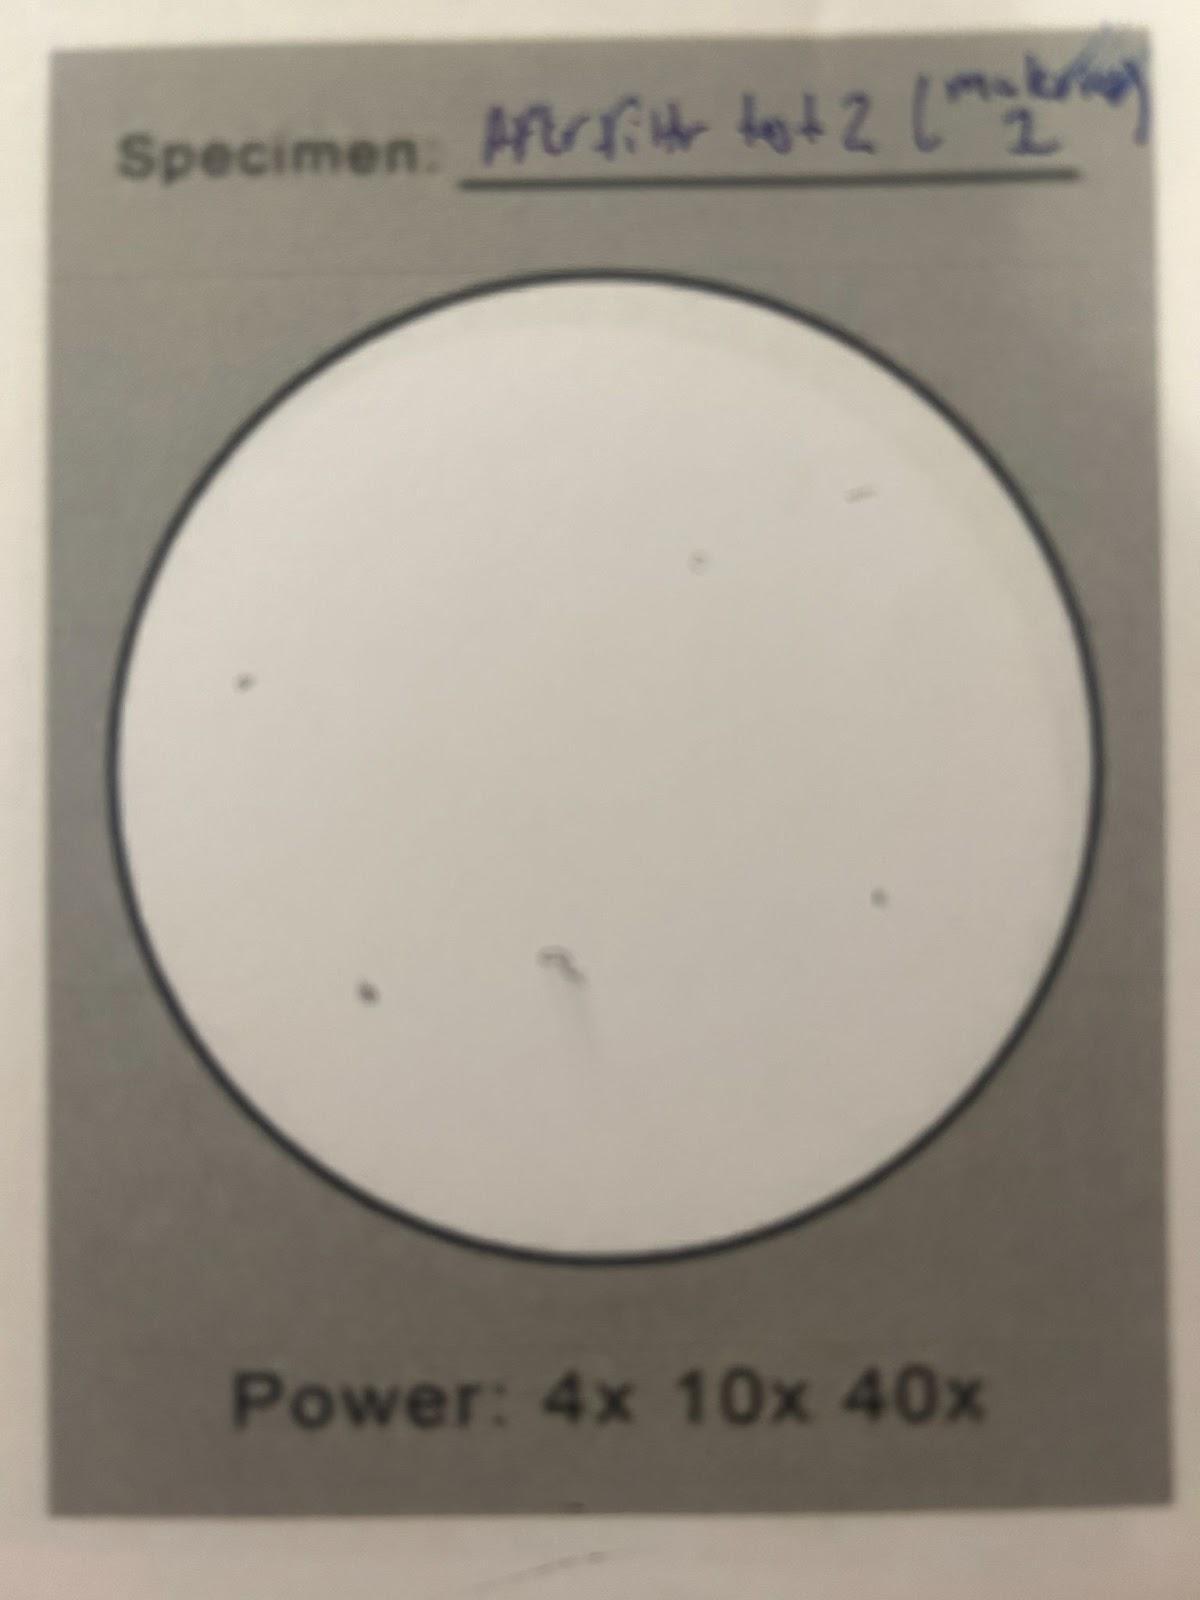
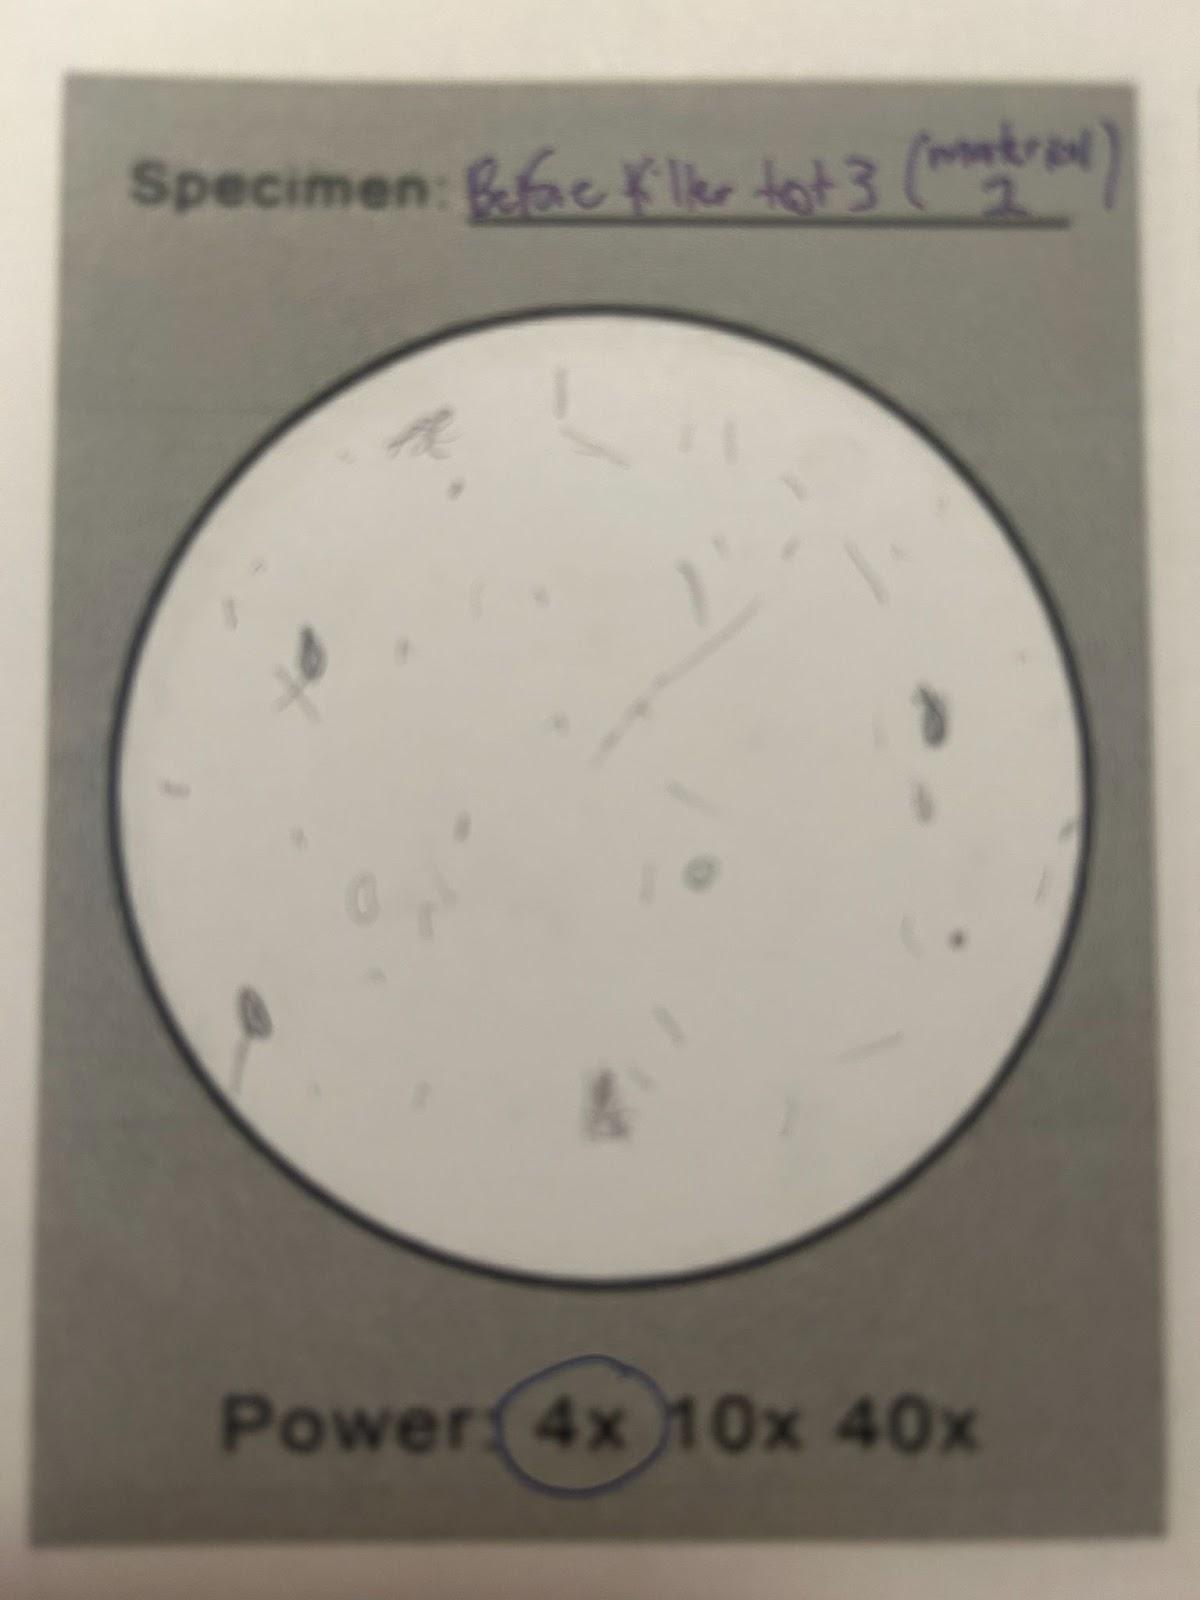
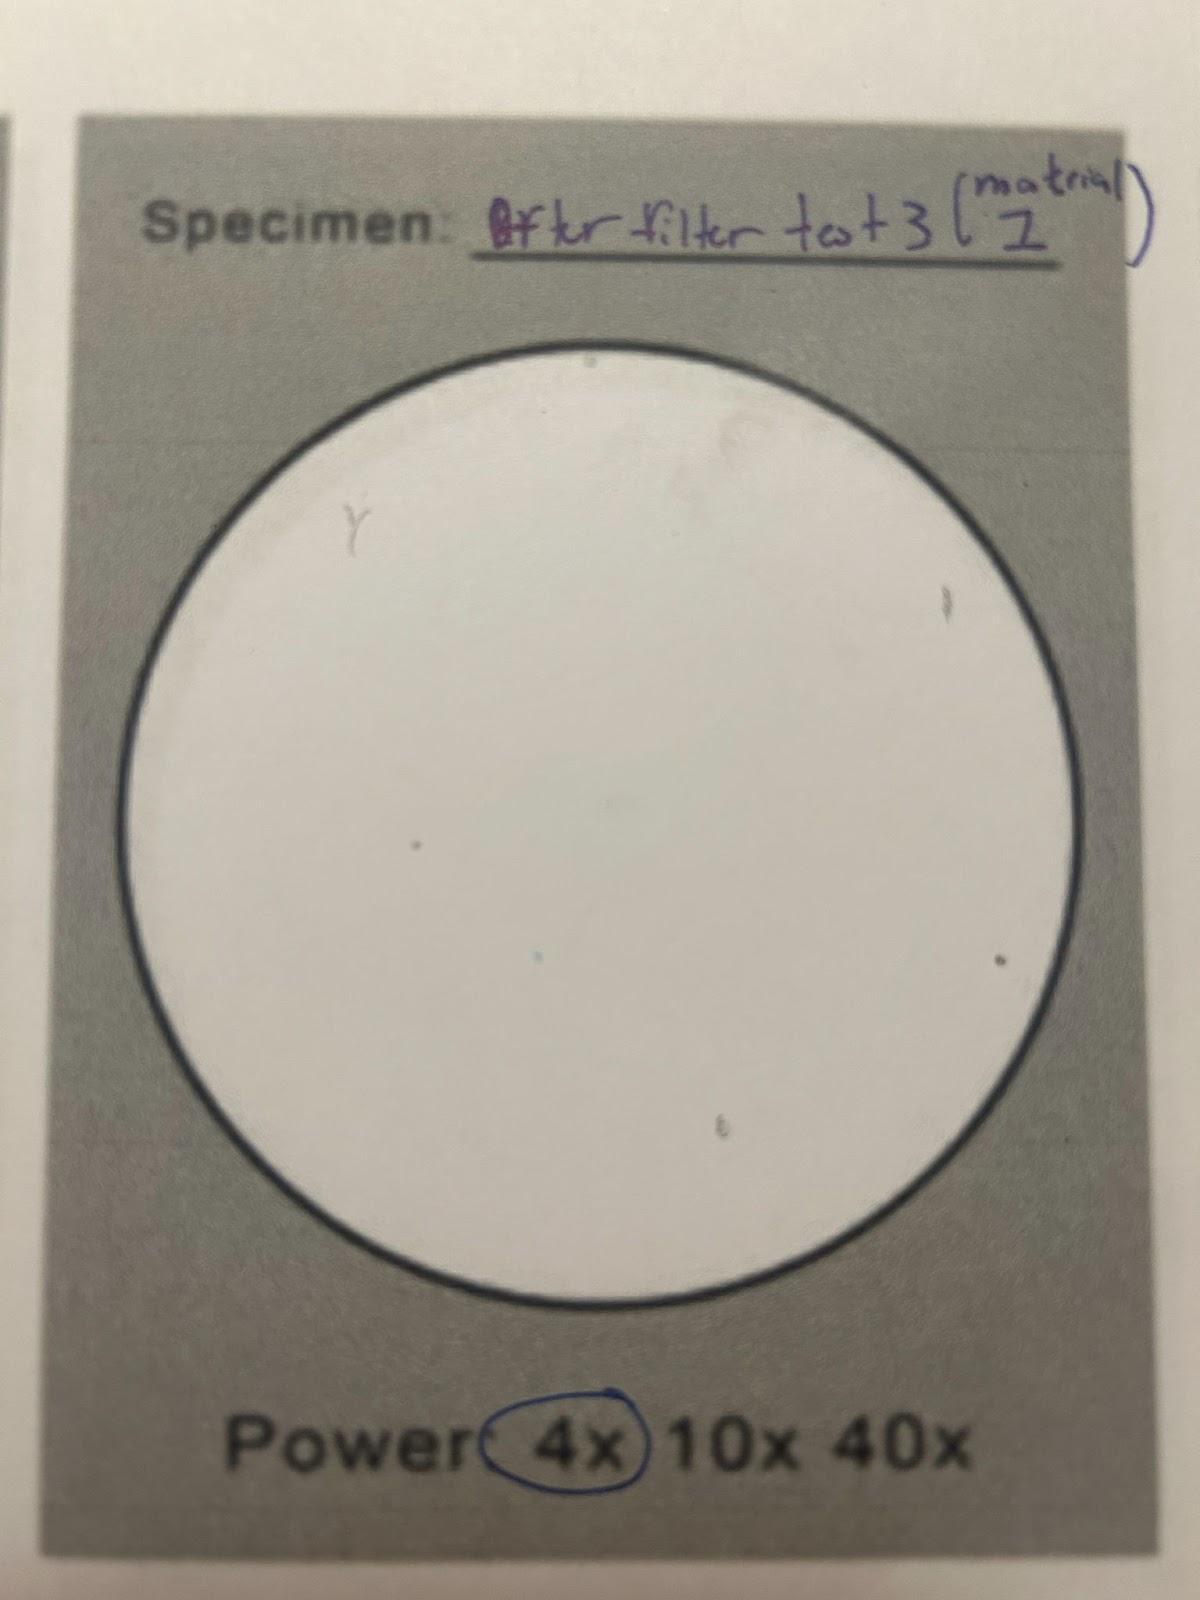
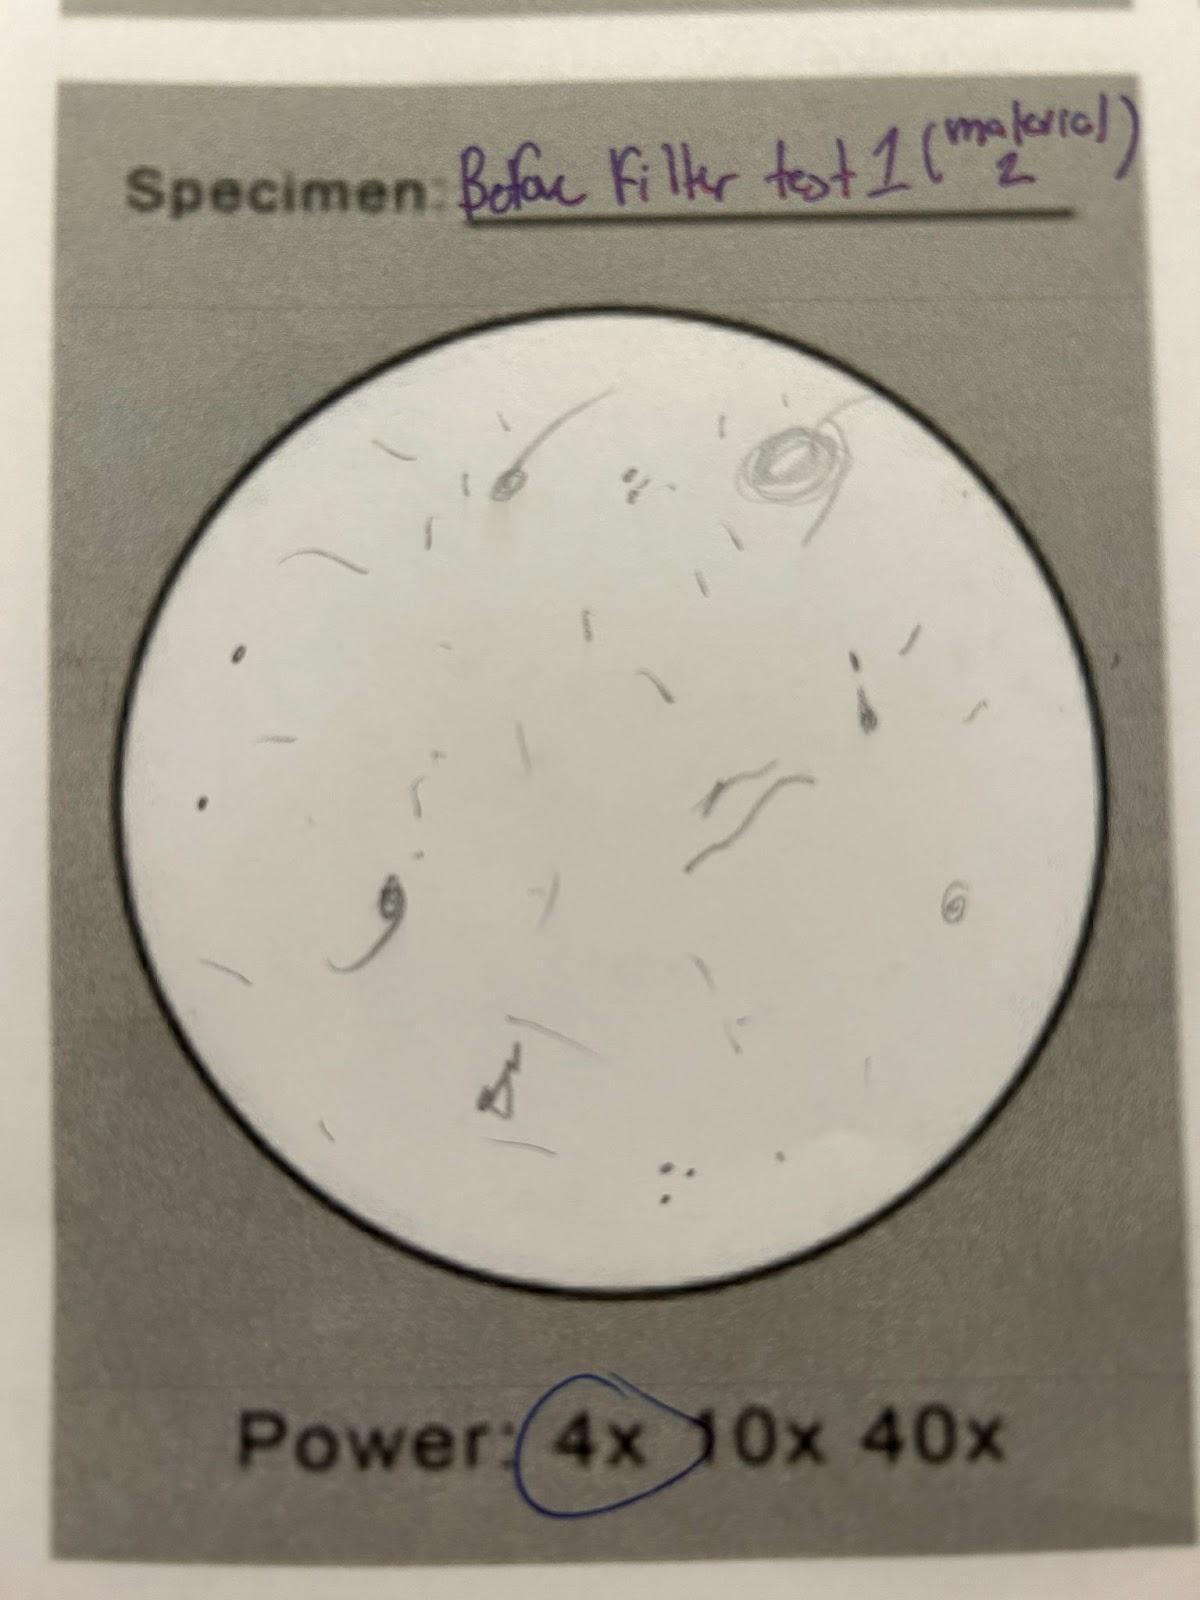
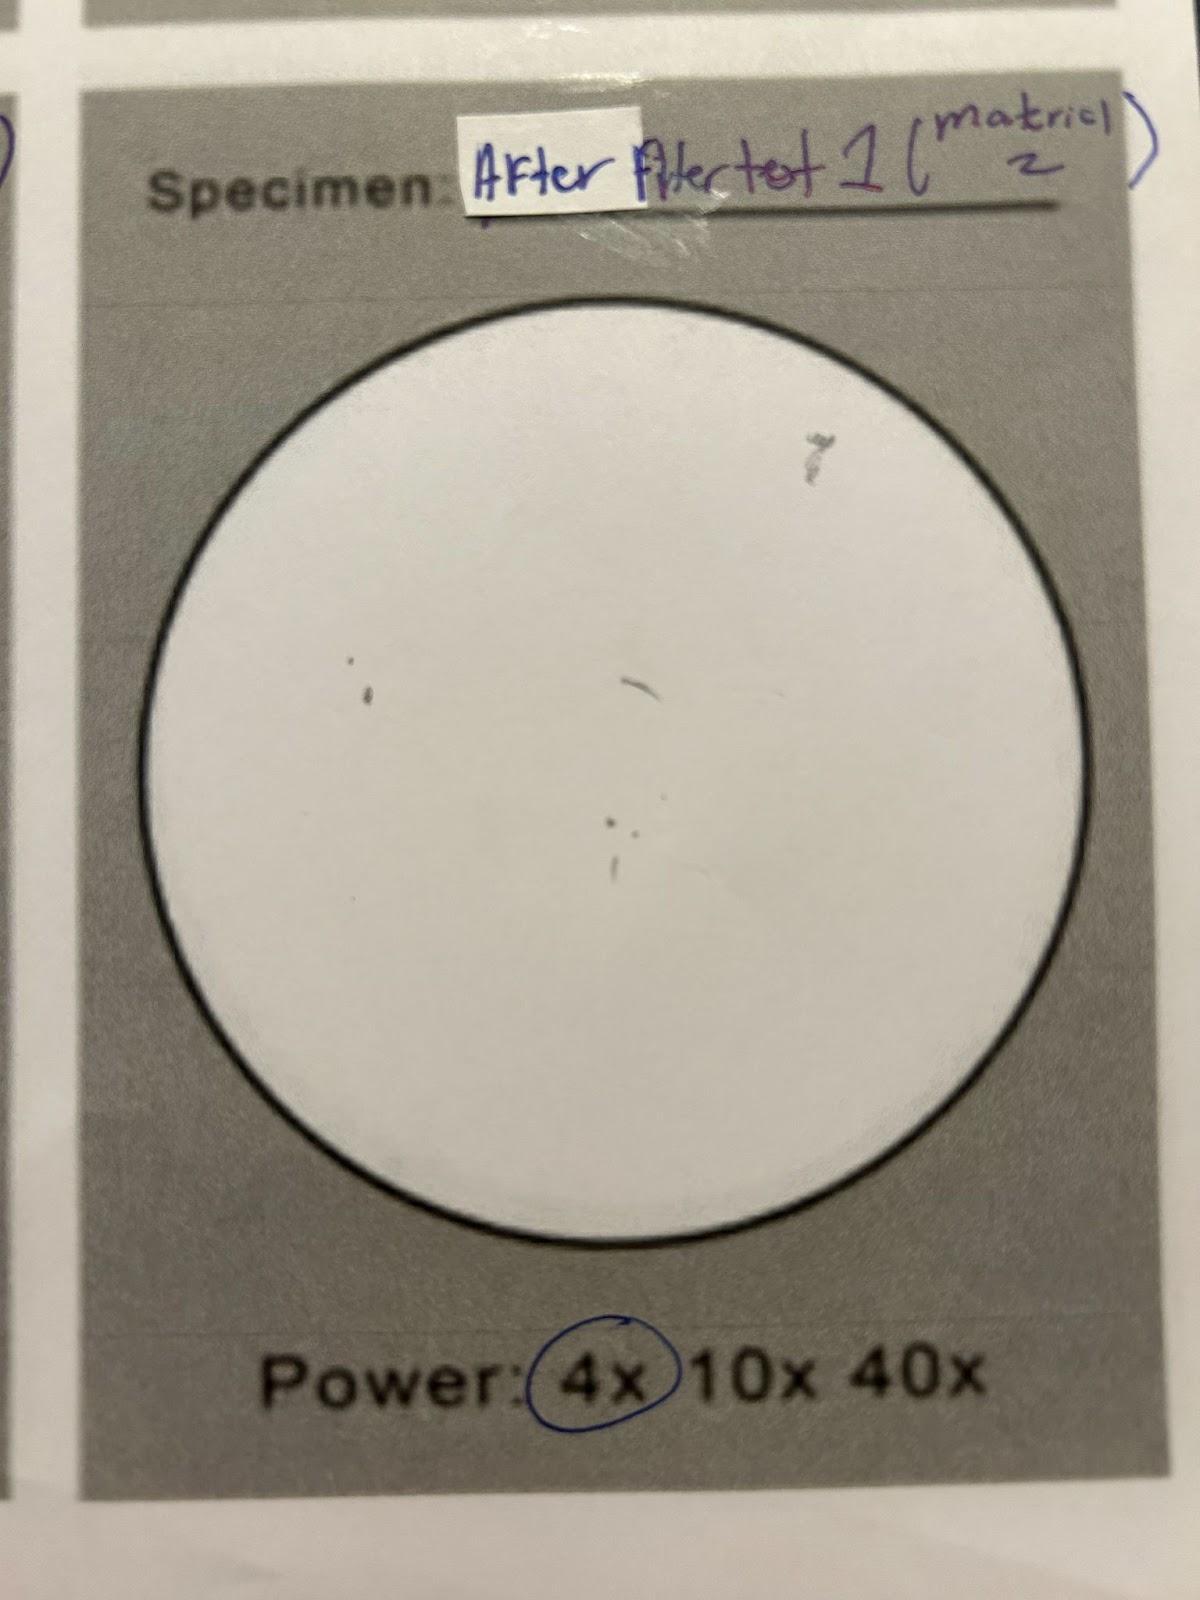
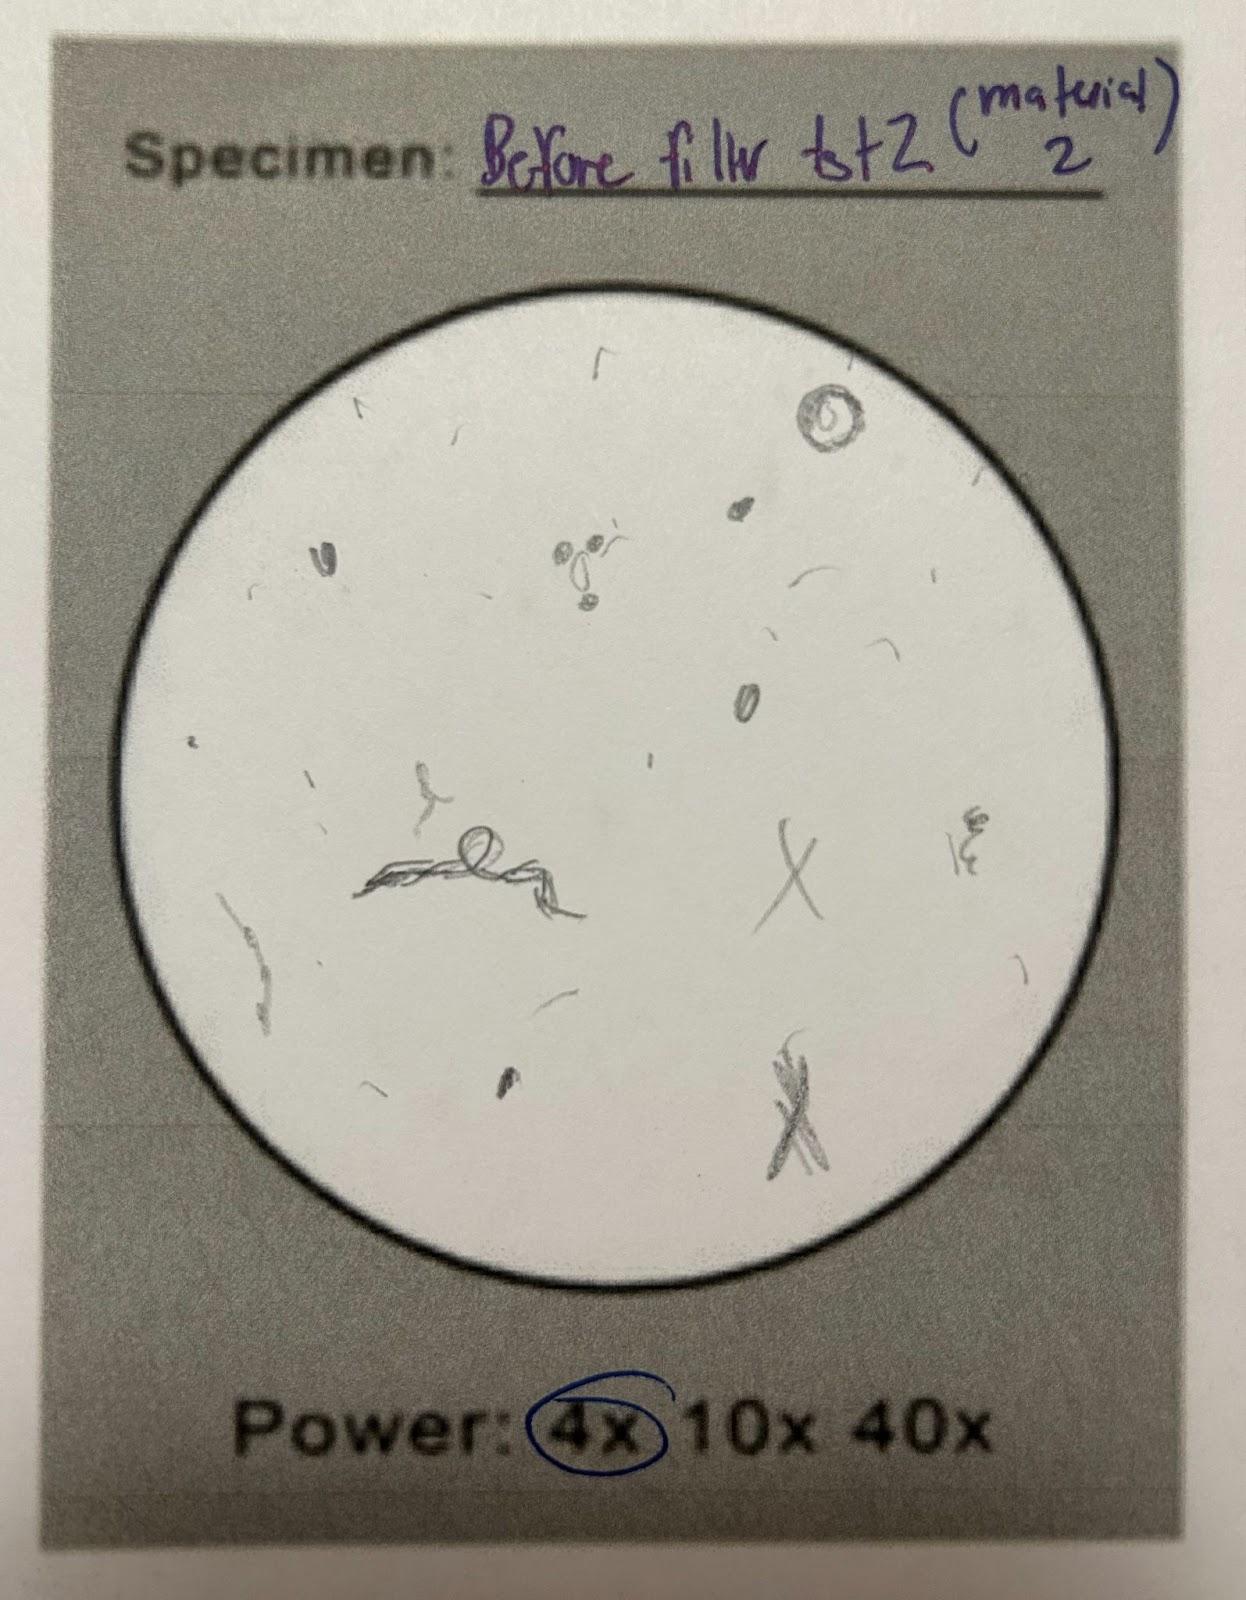
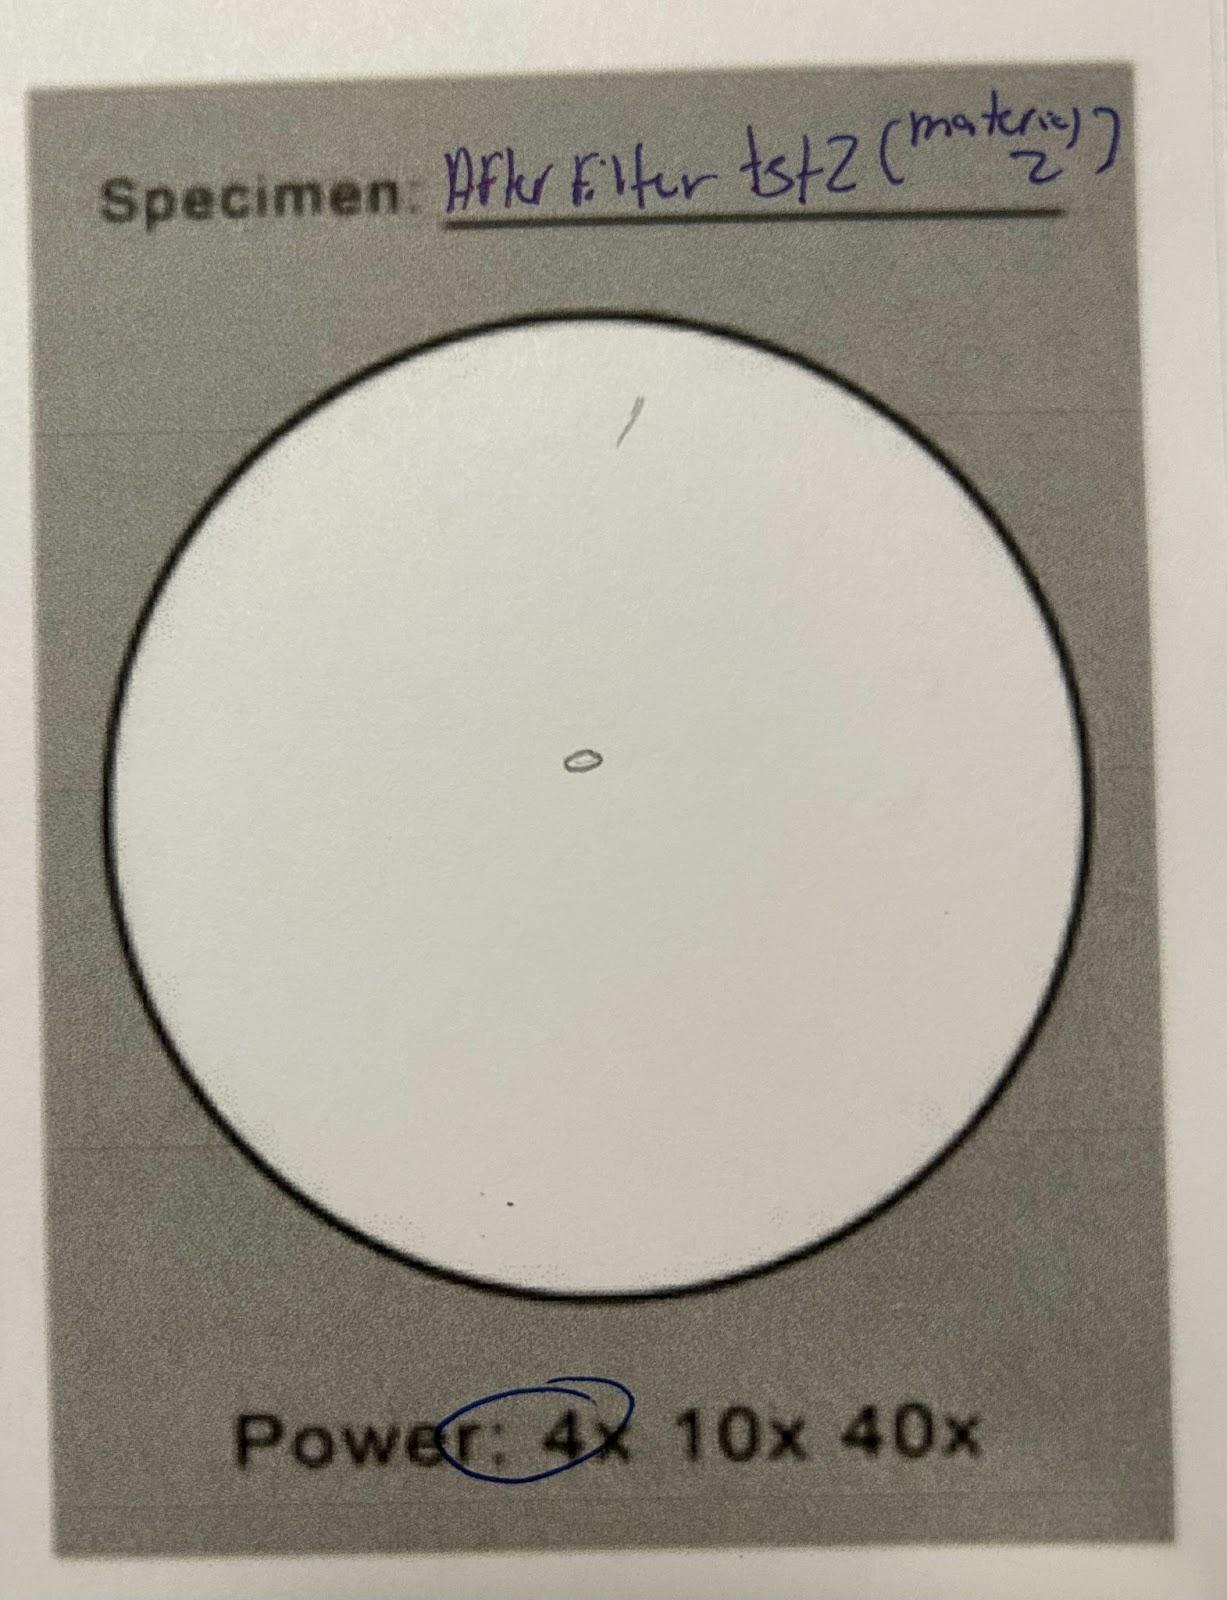
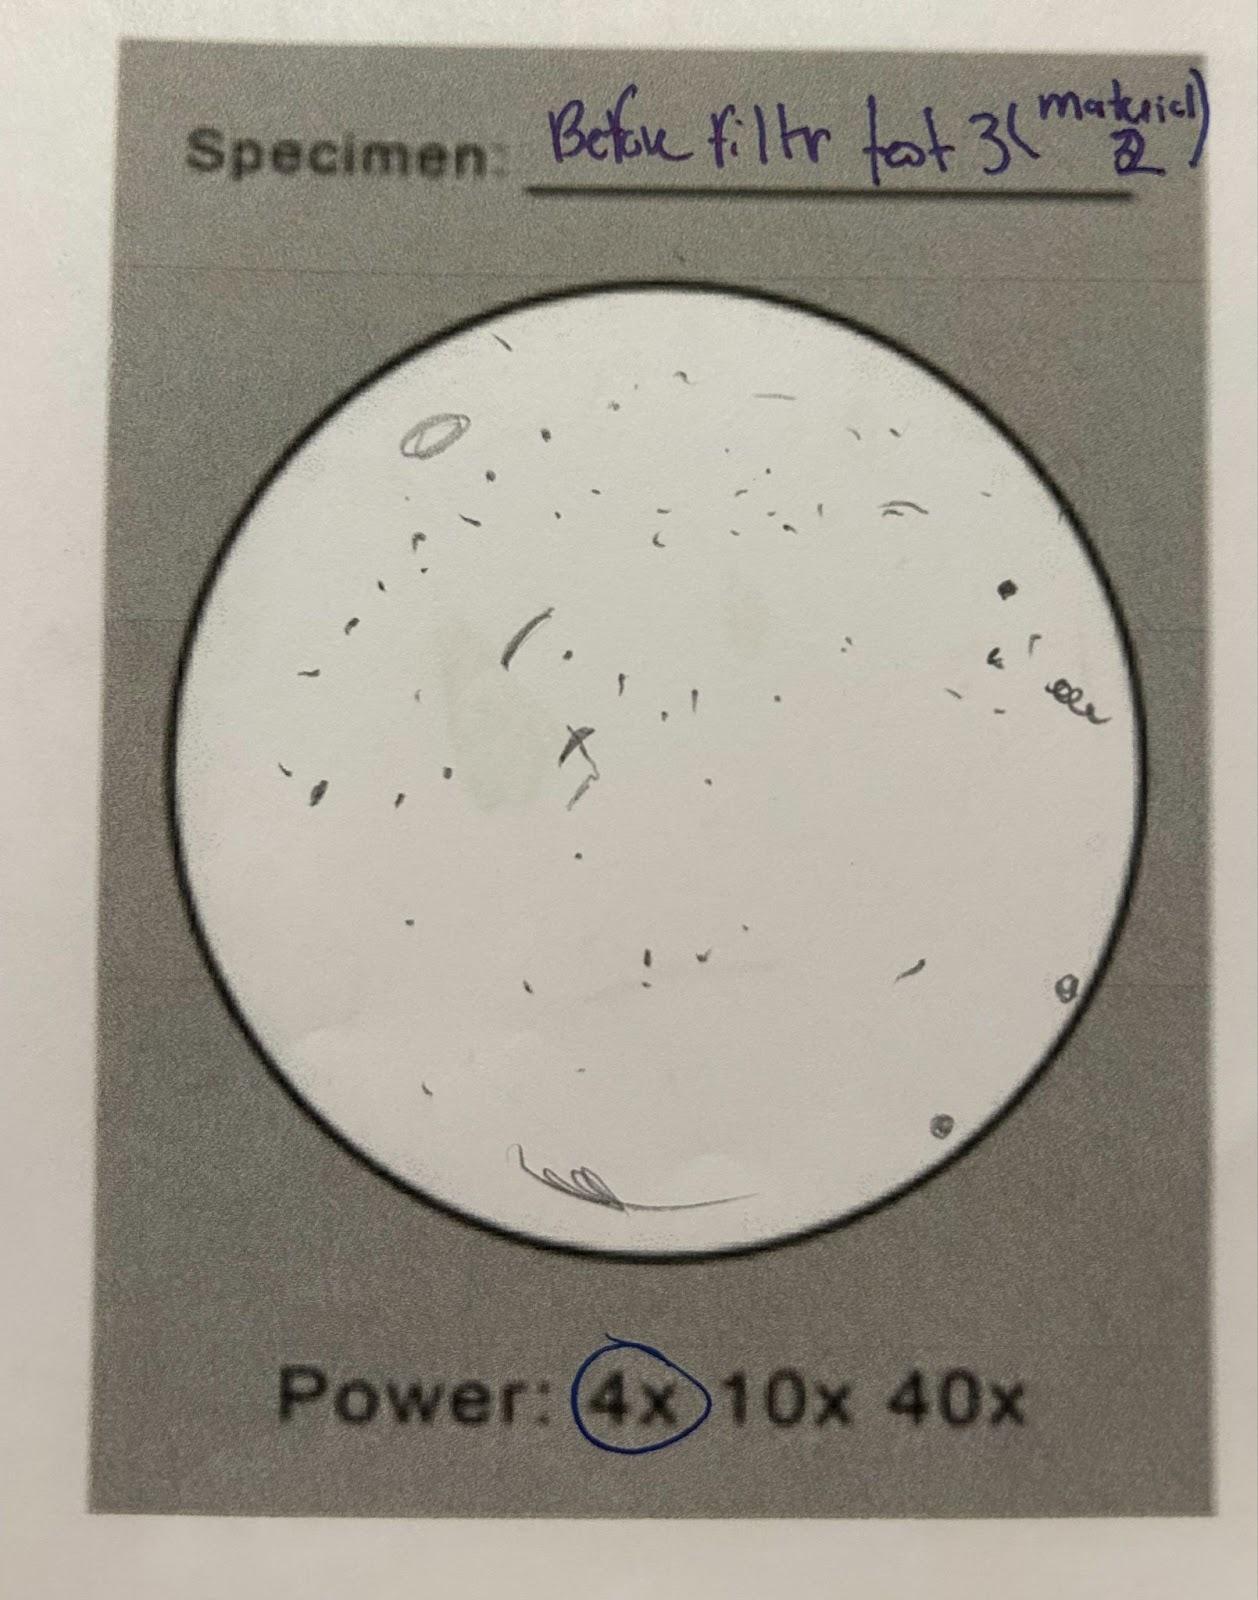
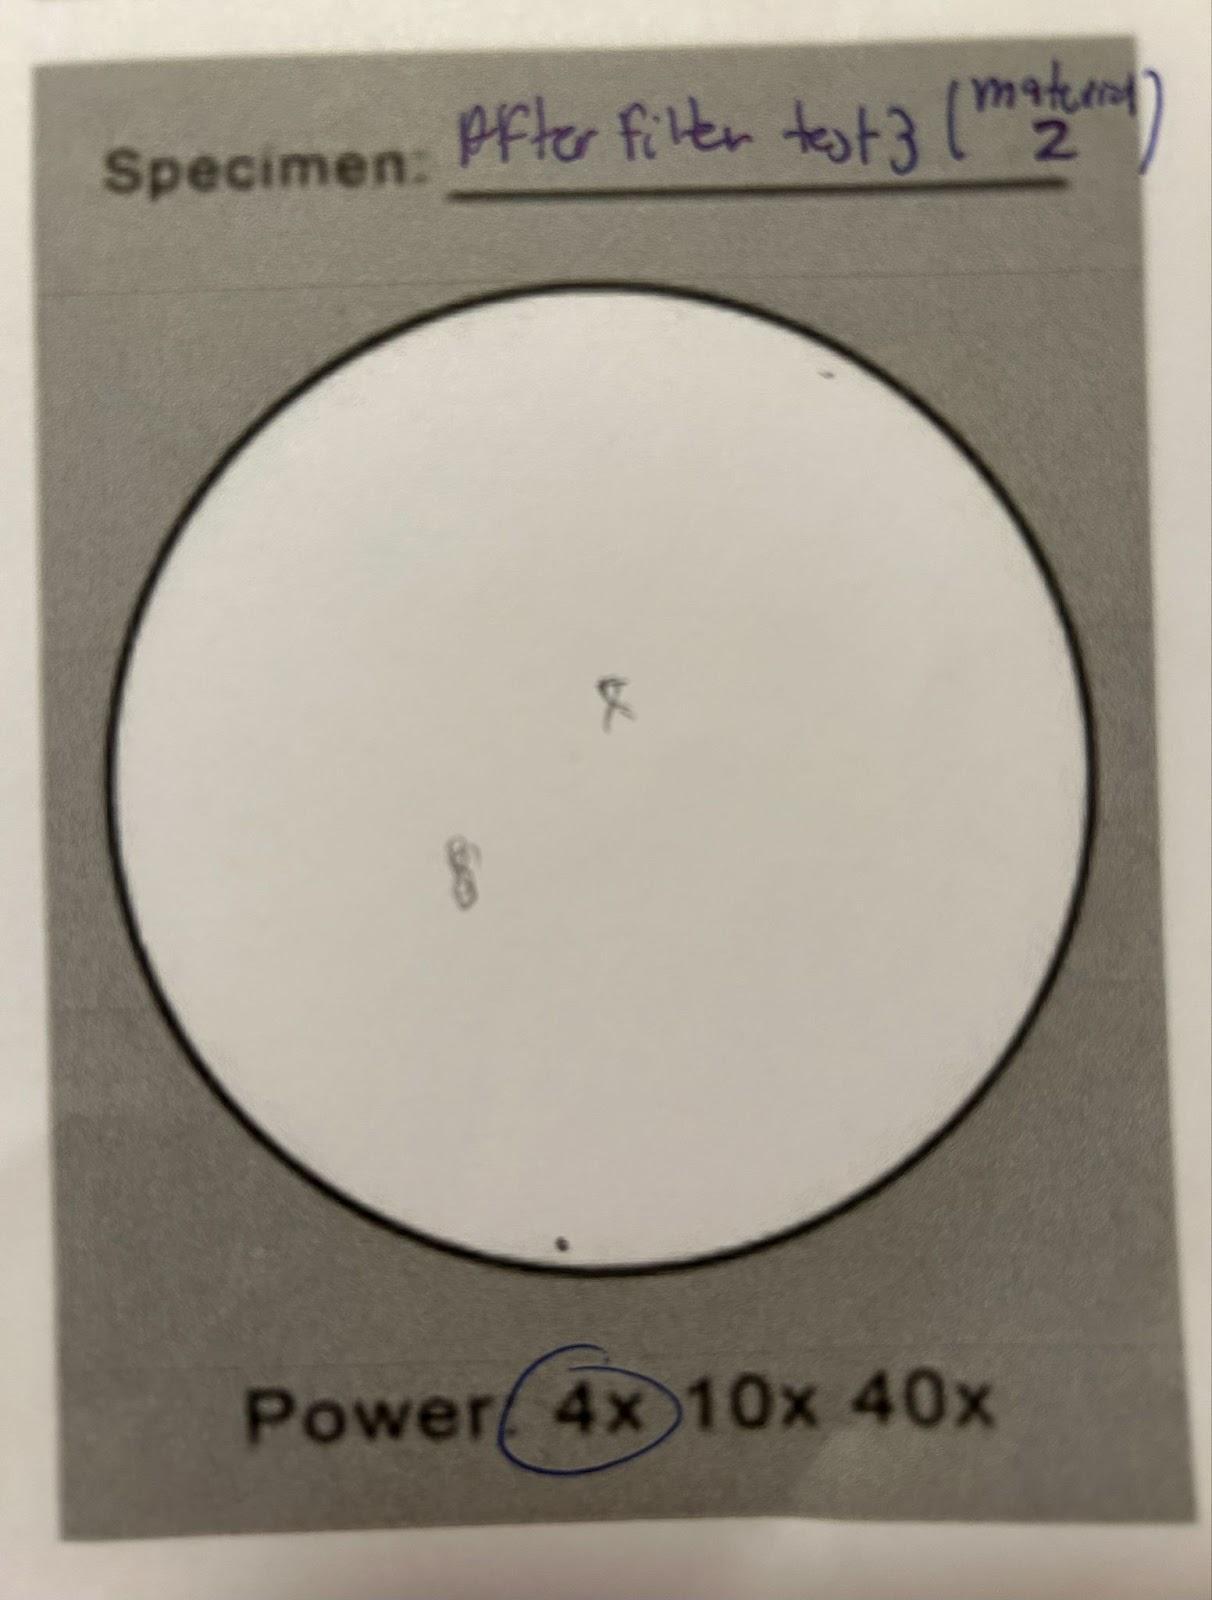
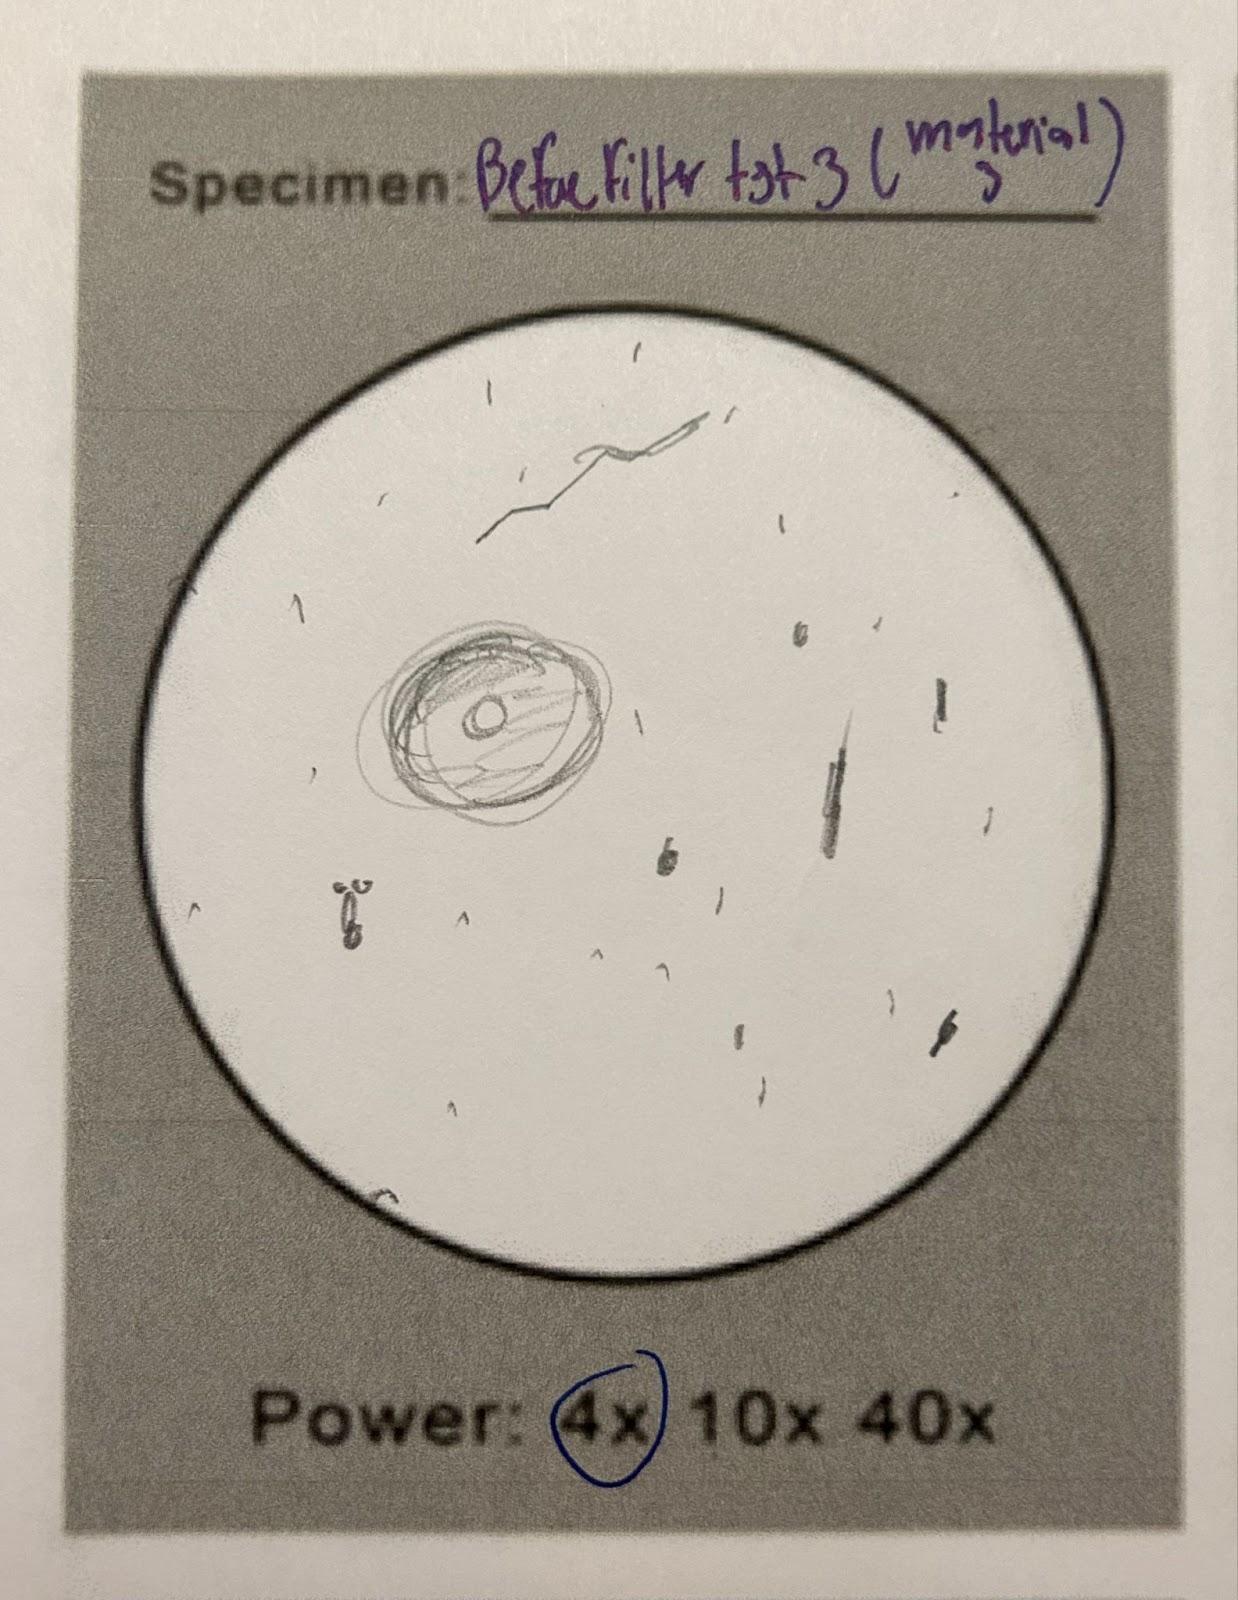
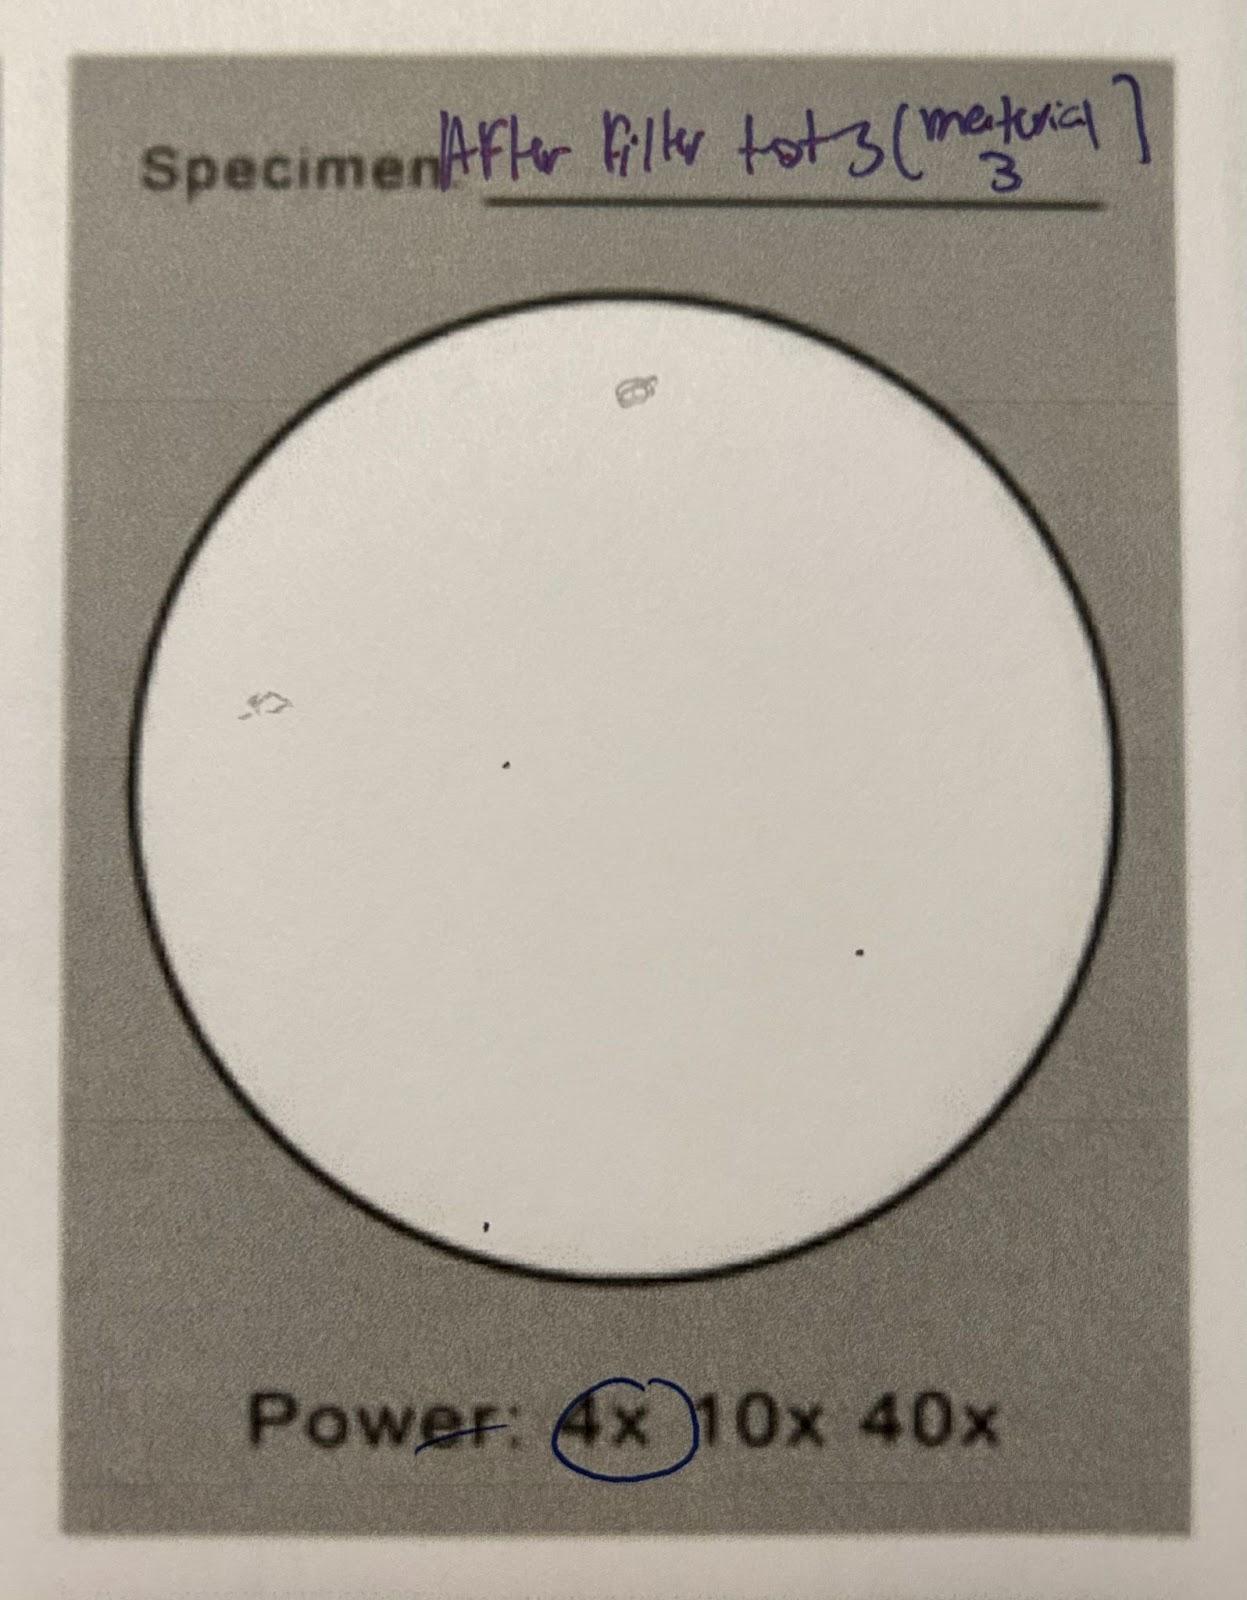
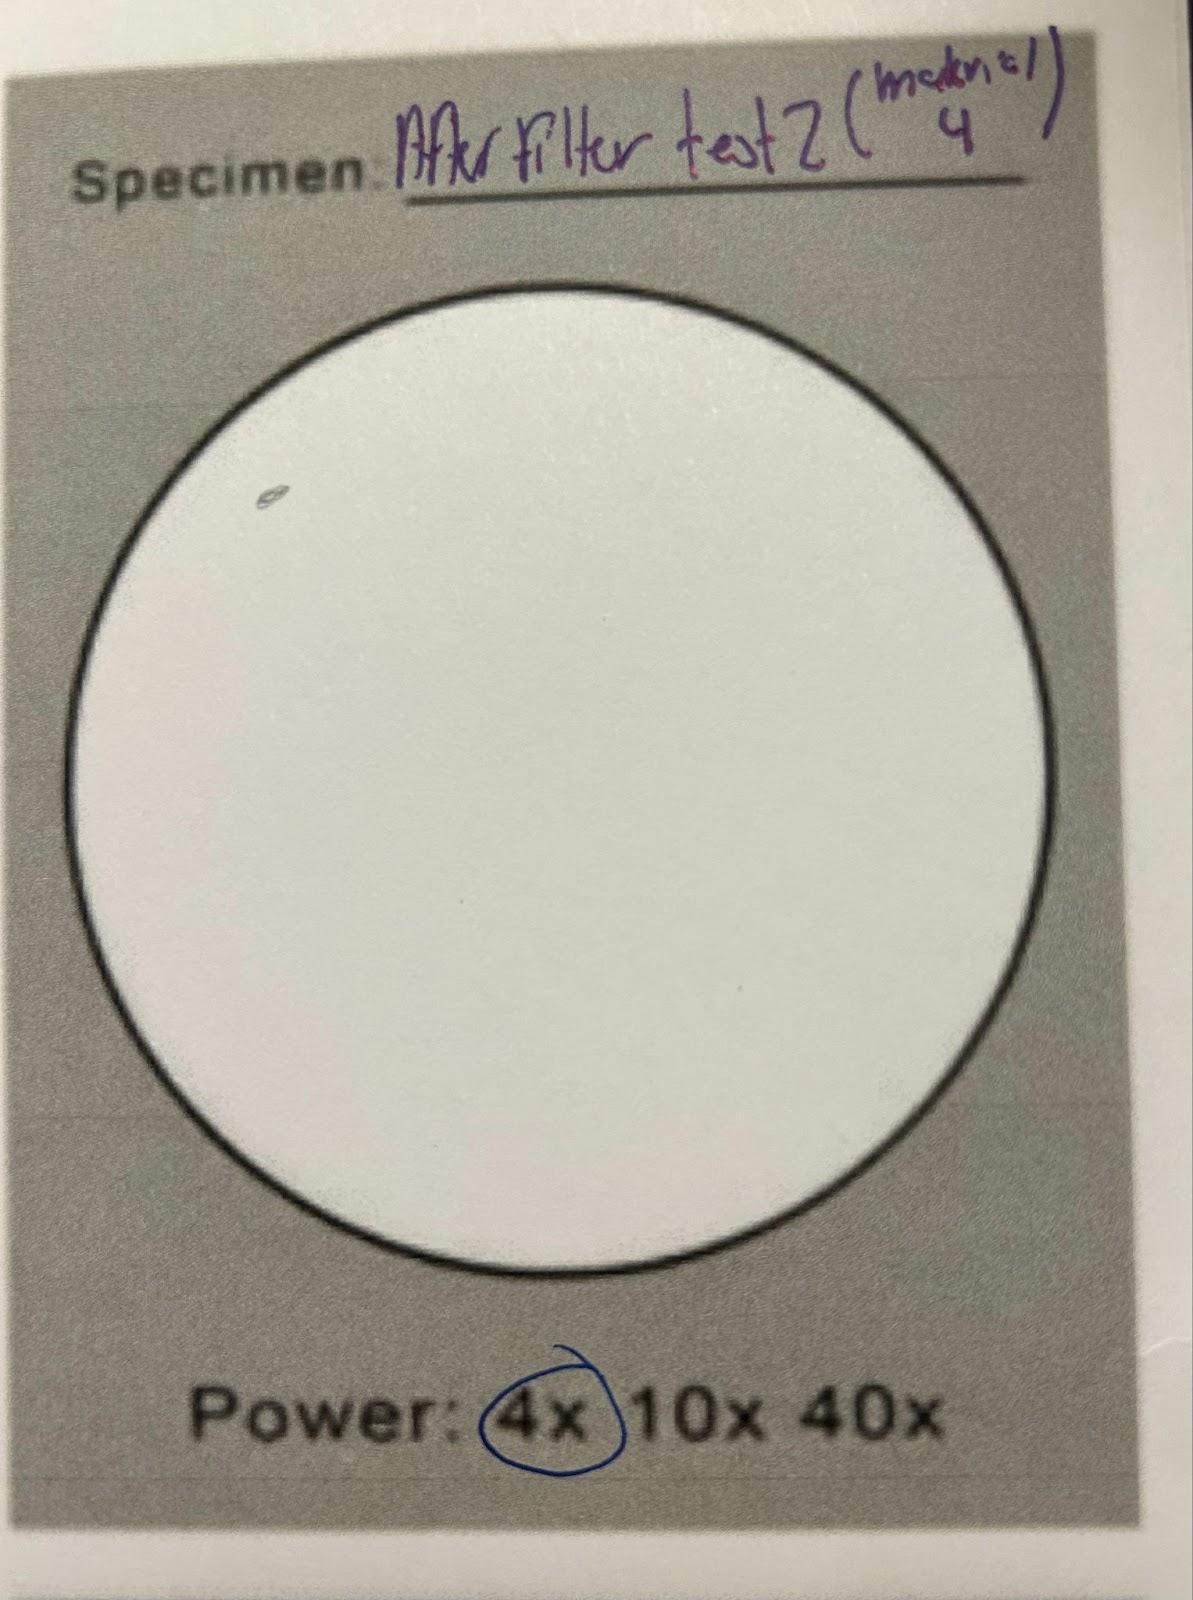
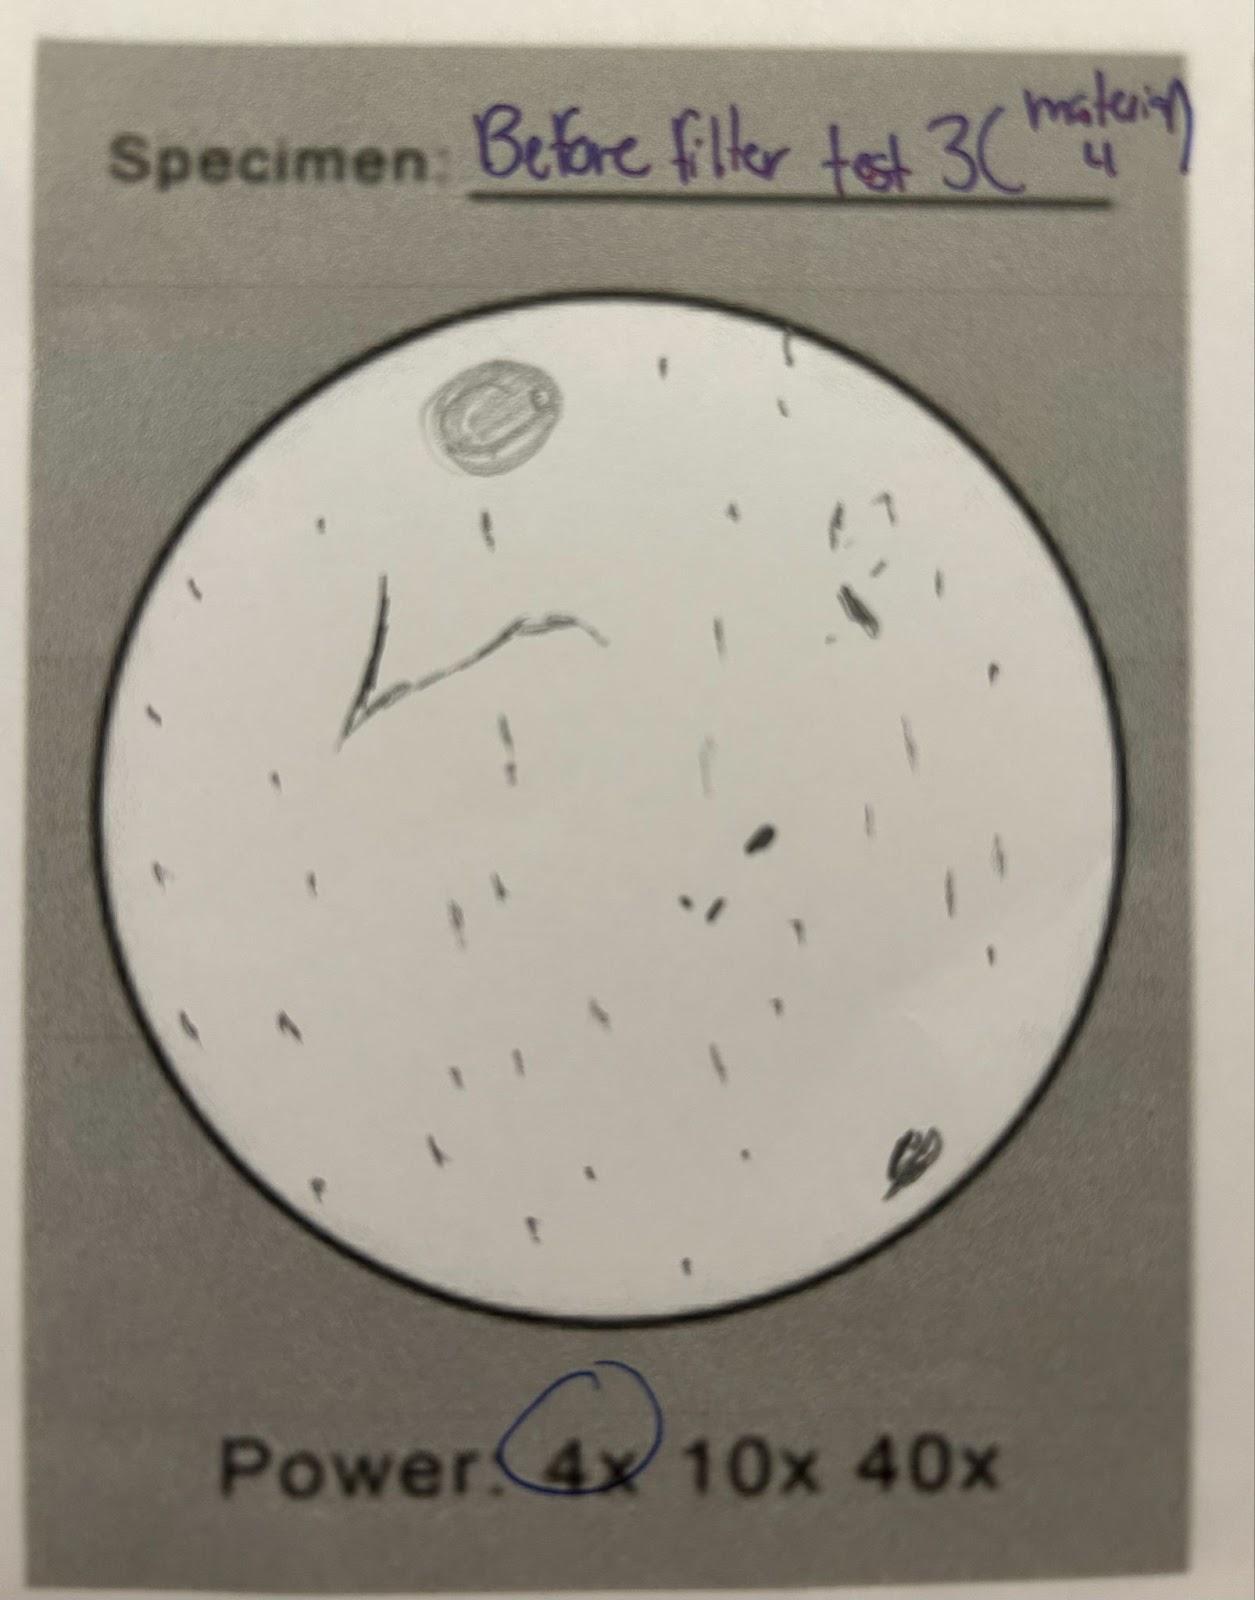
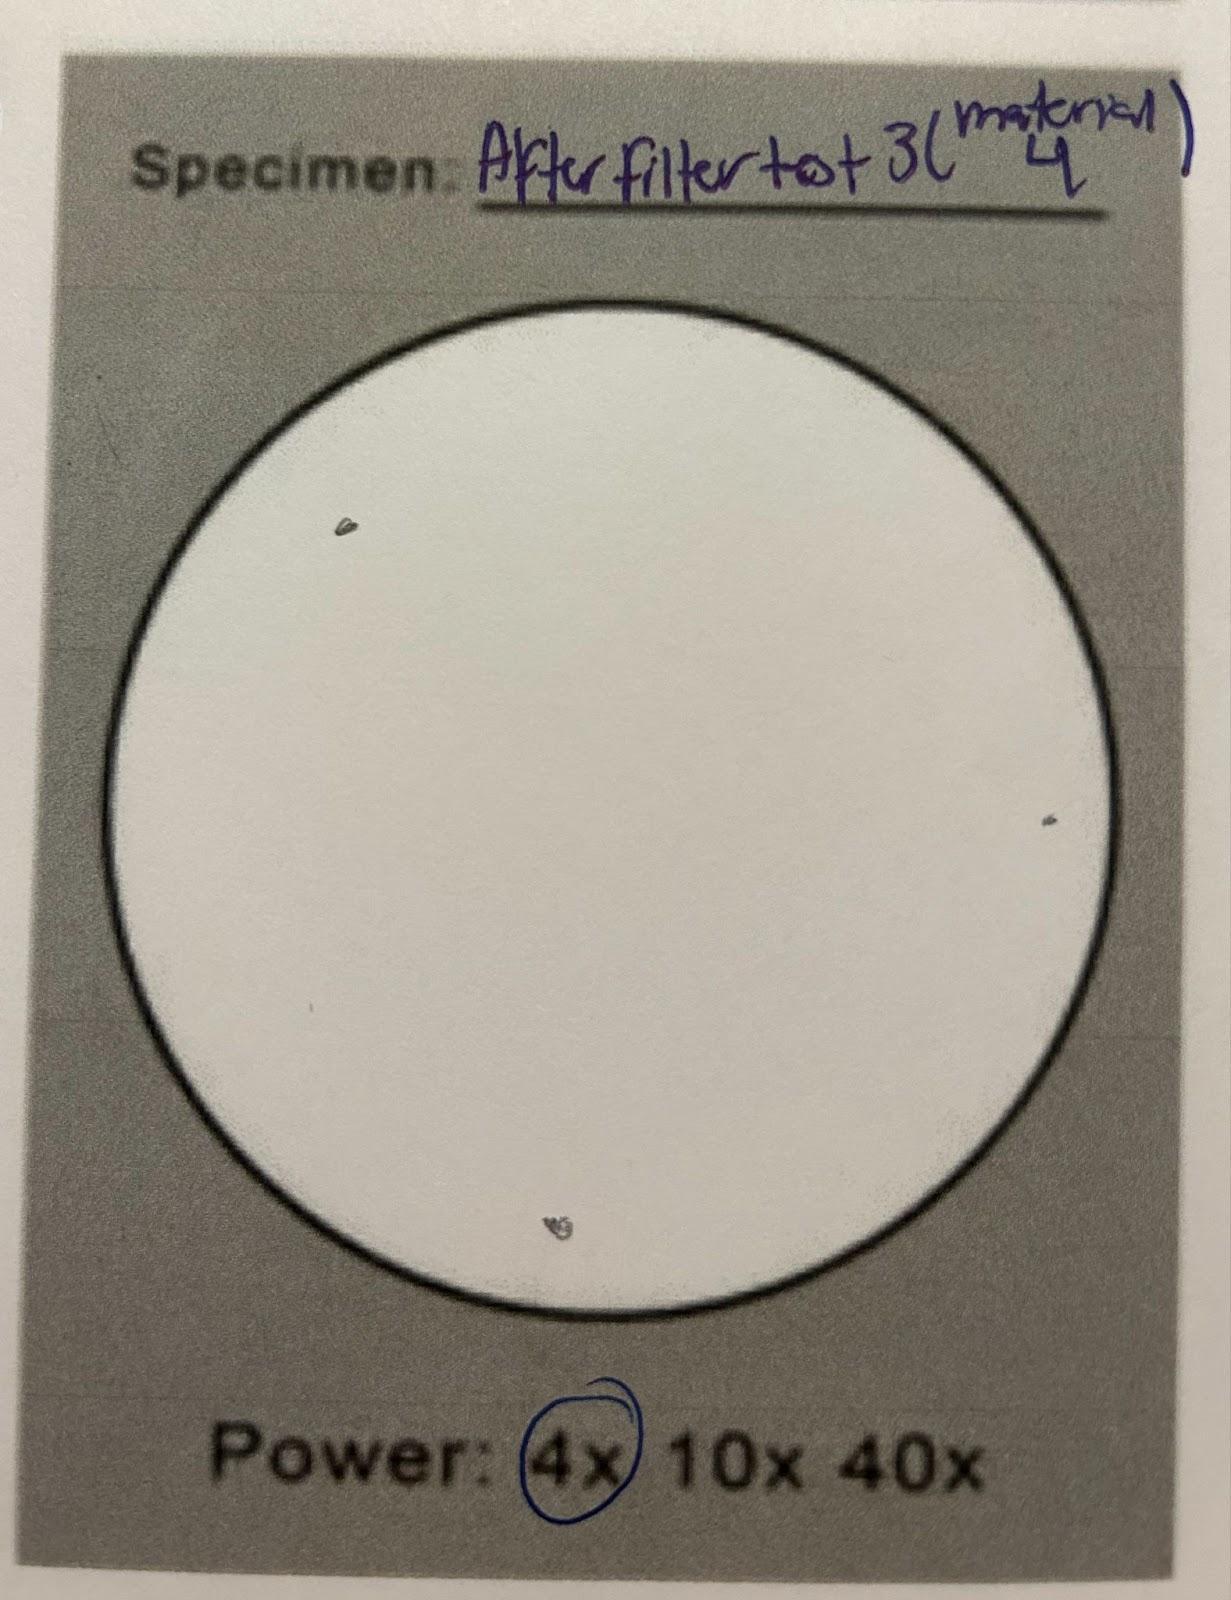
I will take samples of the water before filtration and after each trial. With those samples I will look at them under a microscope,draw them and then analyze them to see changes. I will also take pictures of the output water to see if we can see any changes,
Types of plastics that I will grind up
Activia Yogurt Drink container ( HDPE ) - High Density Polyethylene
Activia Yogurt container ( PP ) - Polypropylen
Dasani Bottle and Cap ( PET ) - Polyethylene Terephthalate
Crest Mouthwash Cap ( PP ) - Polypropylen
Downy Detergent ( HDPE ) - High Density Polyethylene
Efficiency
Obviously to remove microplastics from water you could just use a lot of very thick materials in a large and bulky filter. The outcome of this may be effective, but is not reasonable for real use. The materials that I chose should promise effective filtration while being efficient. This can be measured by the overflow valve on the filter. If the flow is too slow the water in the valve will be high. That way I can monitor how efficient the filter is.
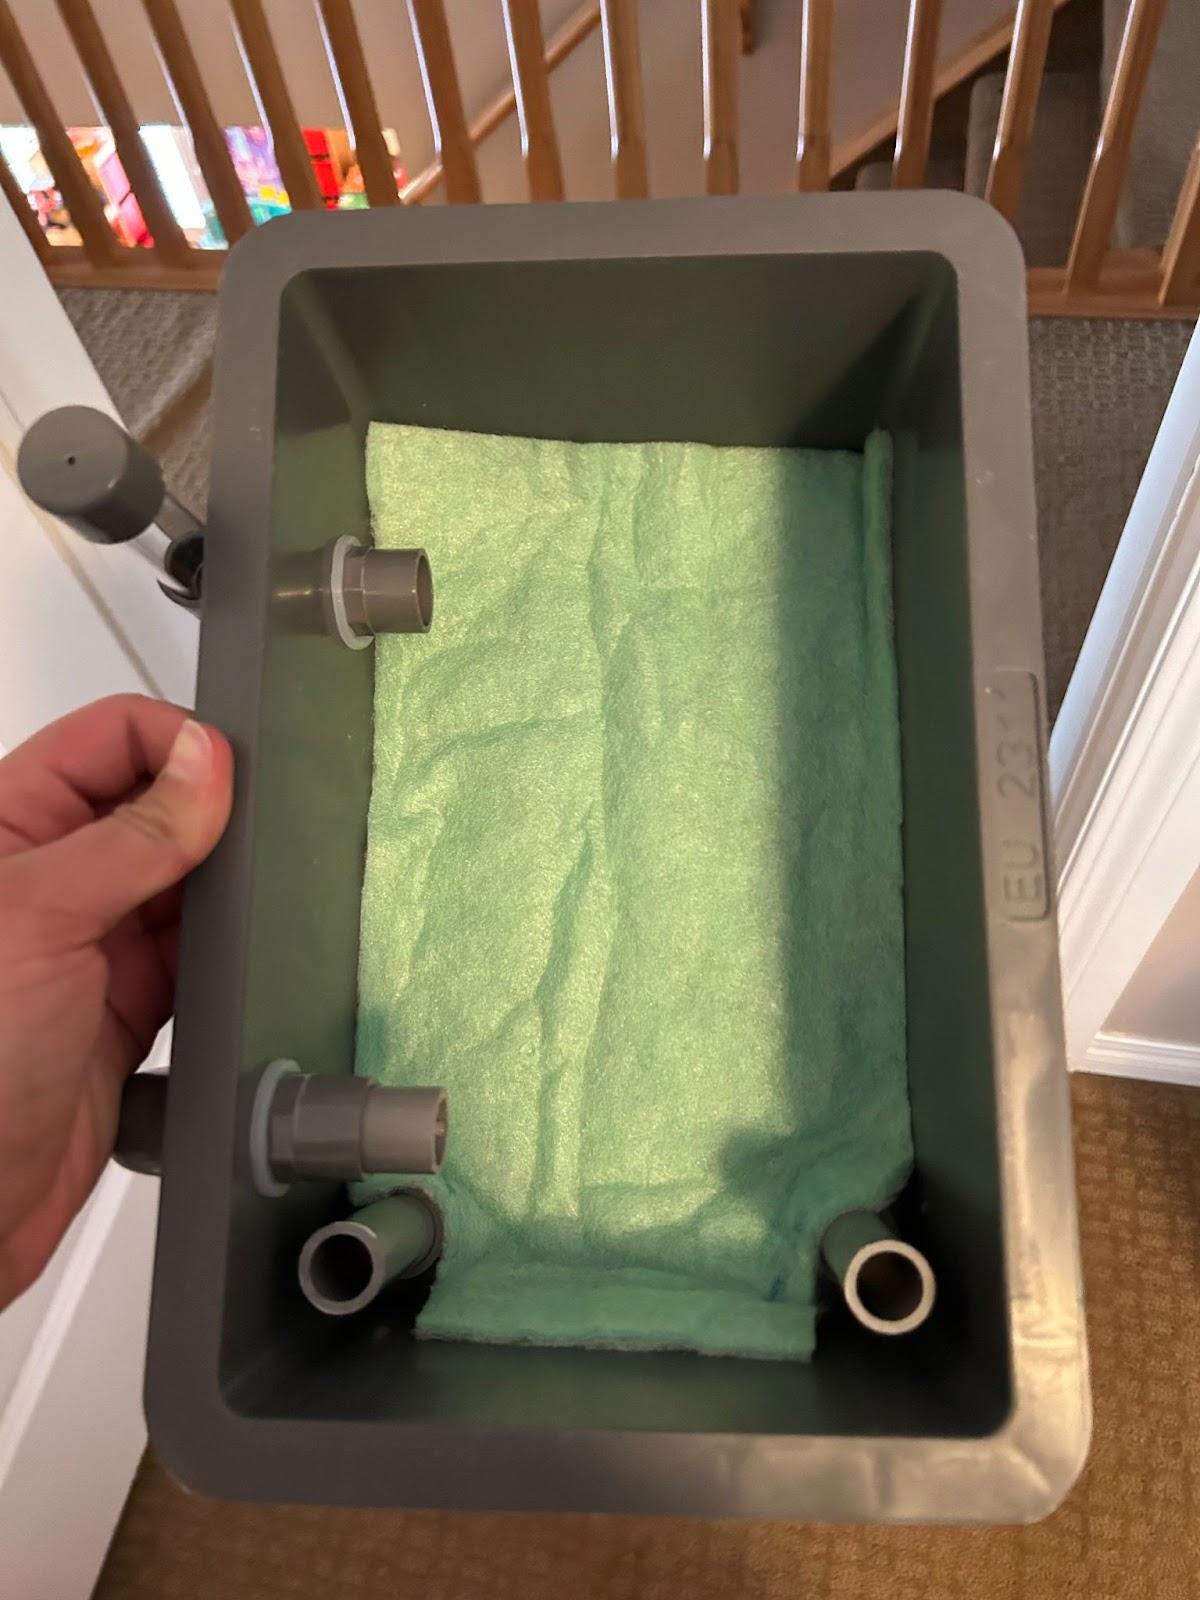
Filter Creation Method
A filter should include a sedimentation, biological, surface capture, absorption, straining and flocculation filtering methods. I cannot include chemical filtration as any chemicals added would seep into the ocean water and disturb its natural balance.
The filter should be concise and items added in should be kept to a minimum.
Materials
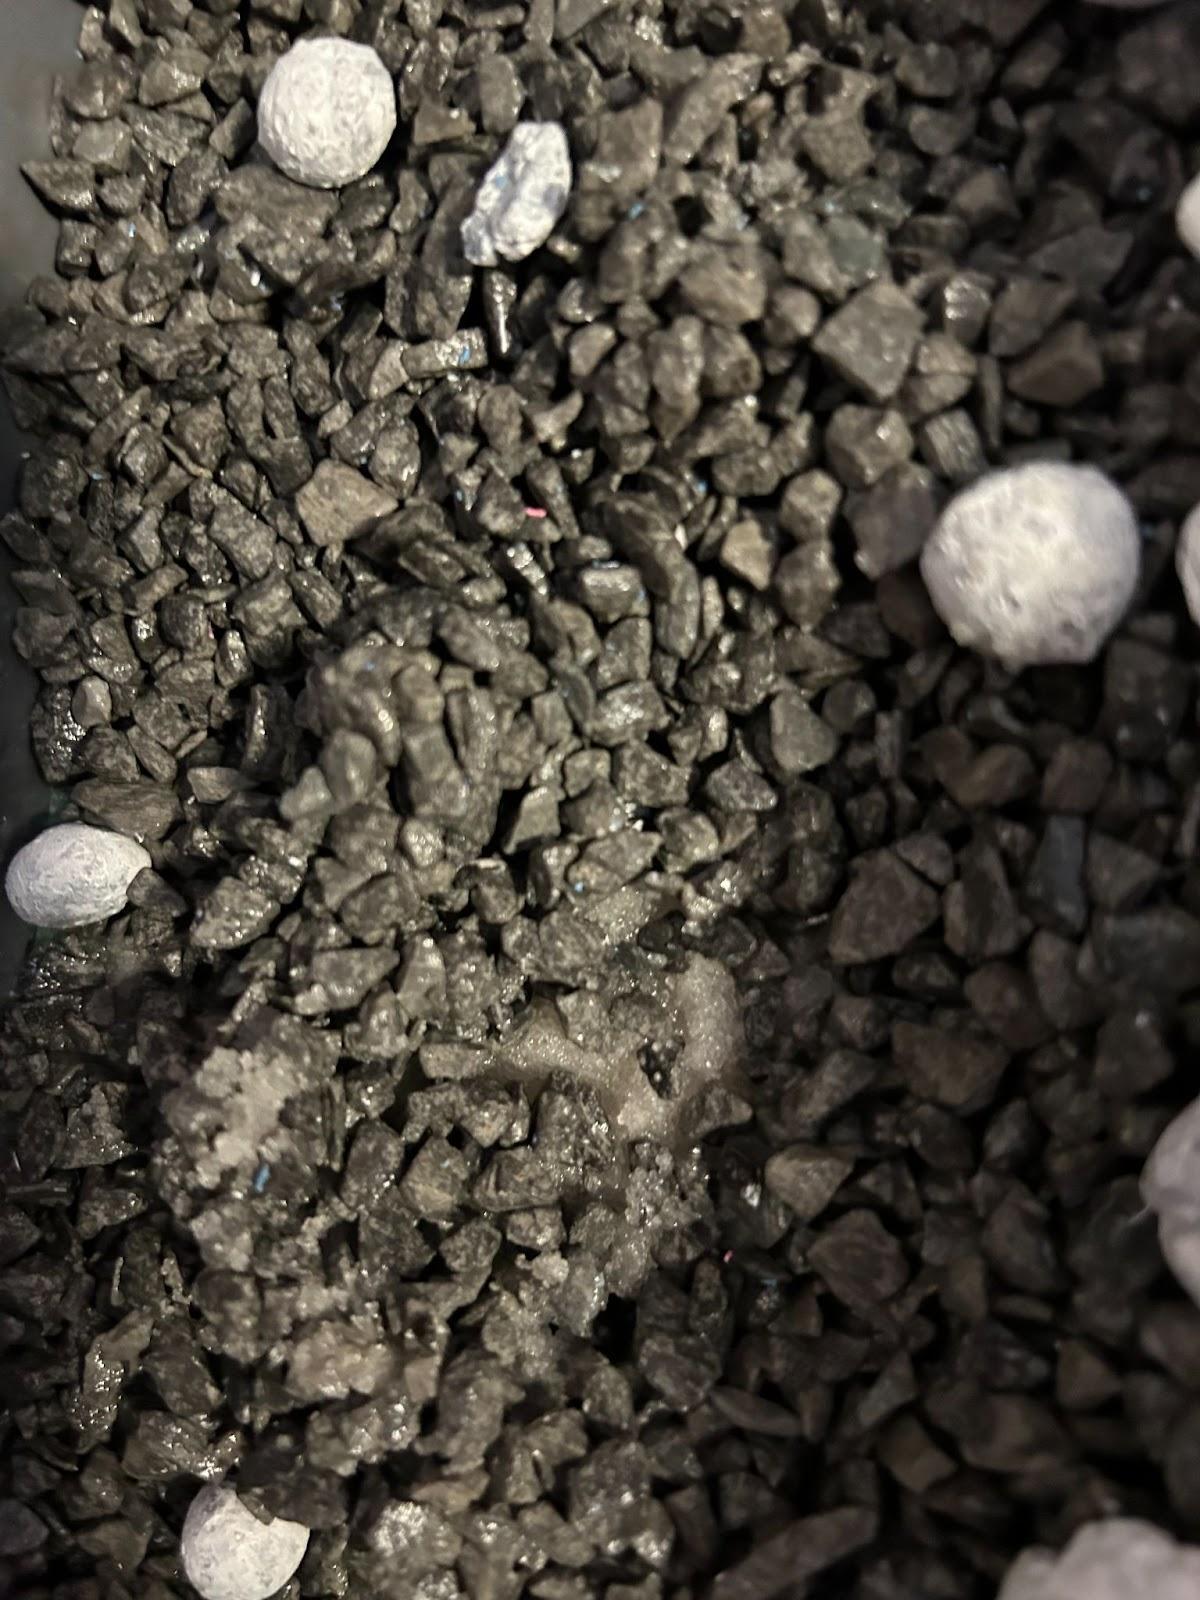
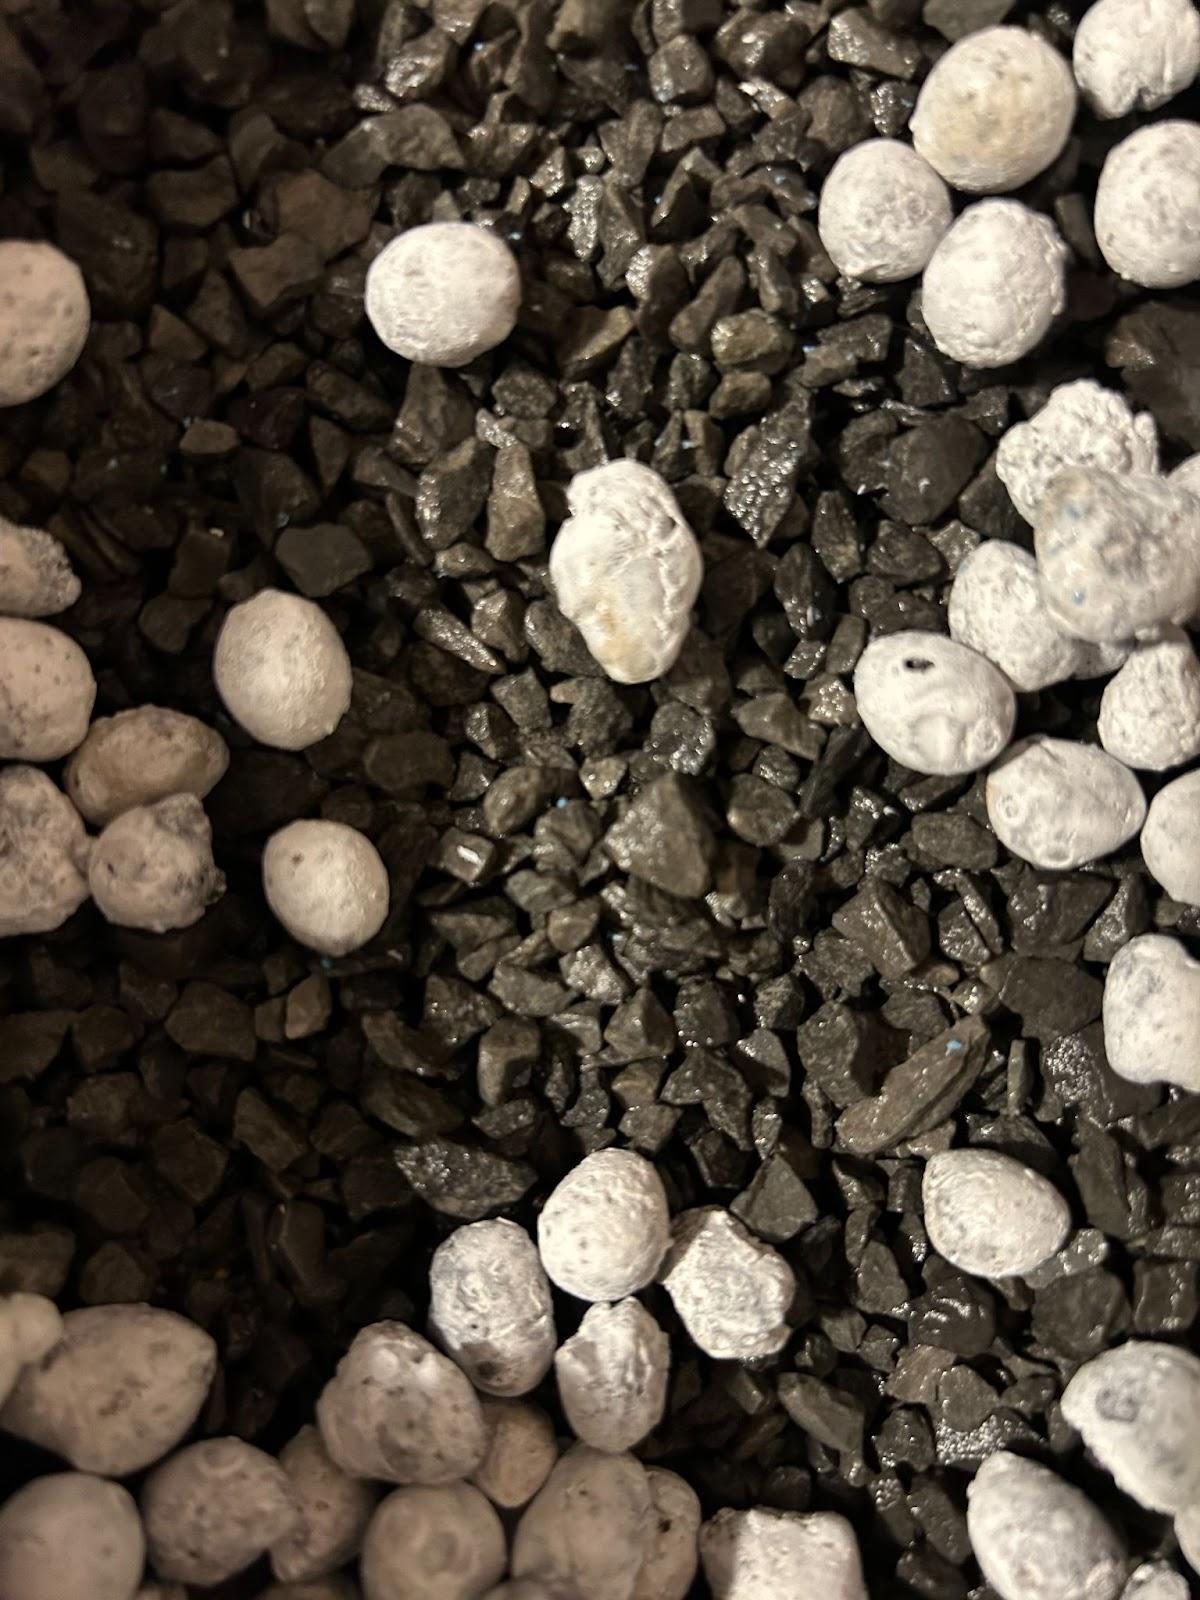
Level 1 - Sedimentation- Mesh (Surface Capture/ Absorption)
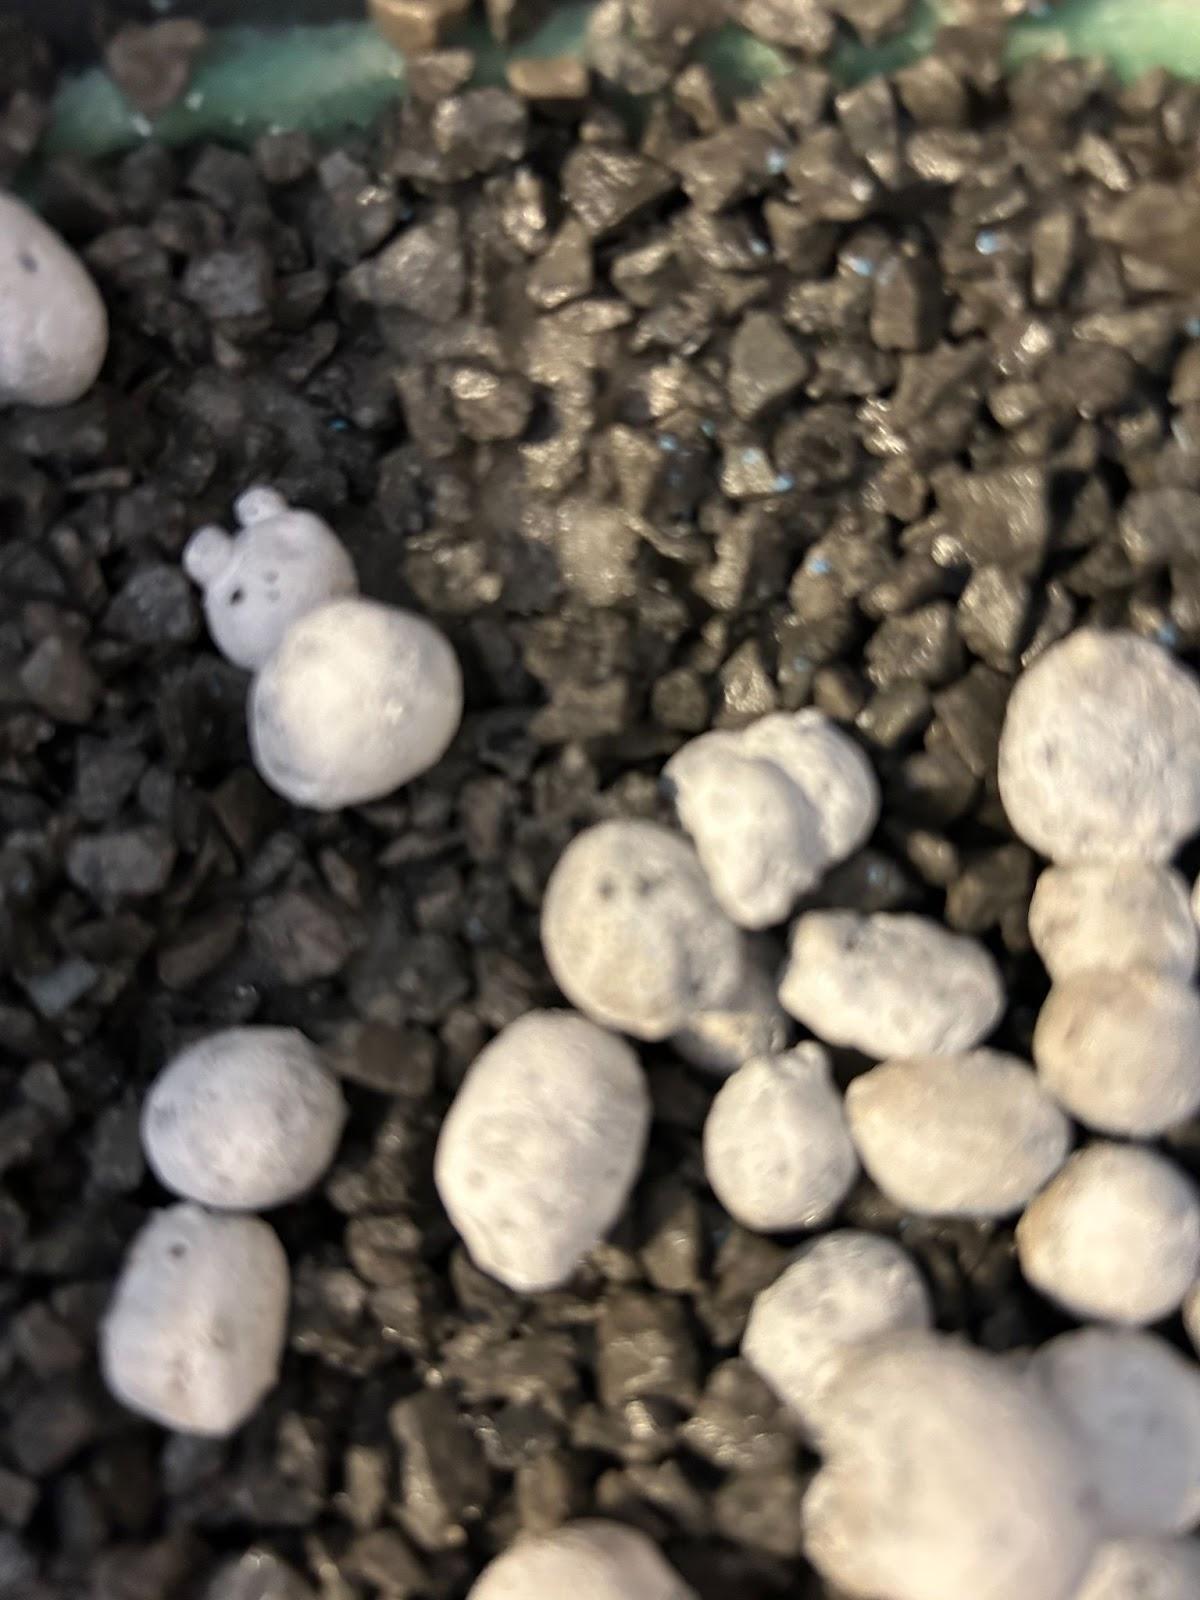
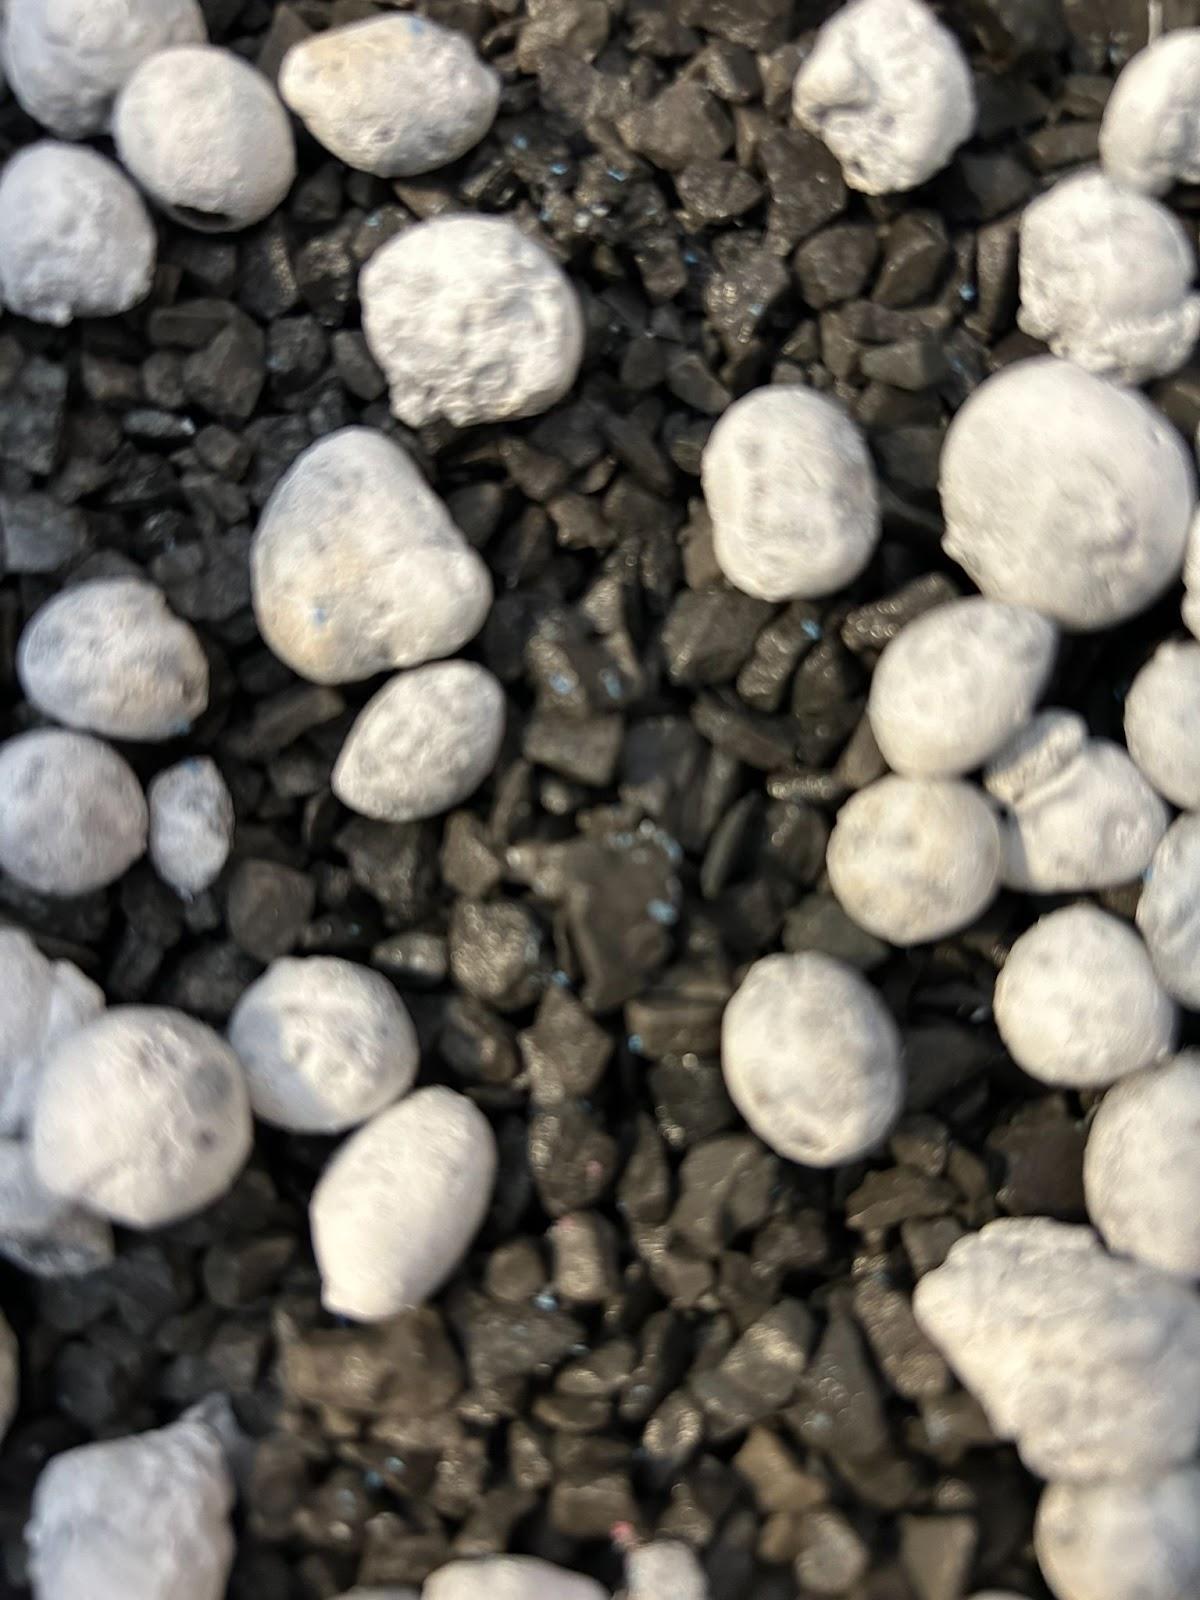
1) Clay Absorption Pellets - Known to absorb impurities in water because it is porous and made out of clay.
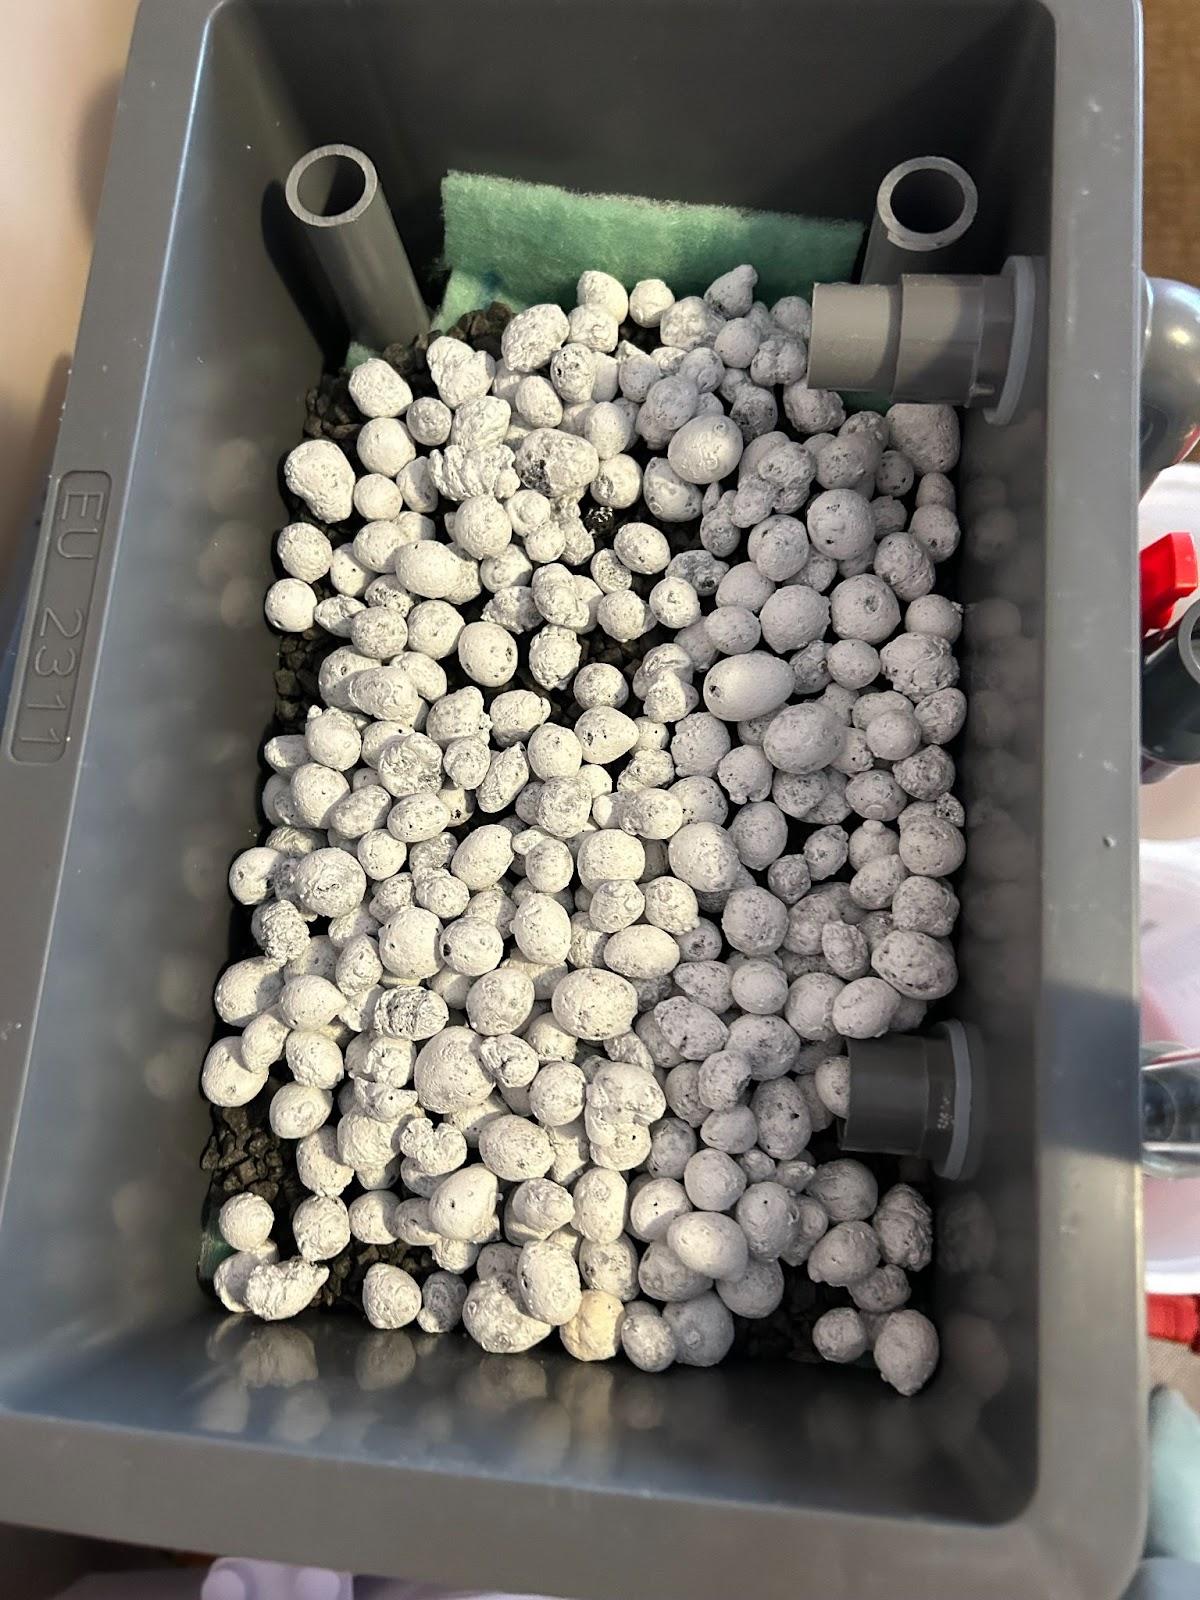
2) Rocks - Captures larger plastics
3) Sand - Captures larger plastics
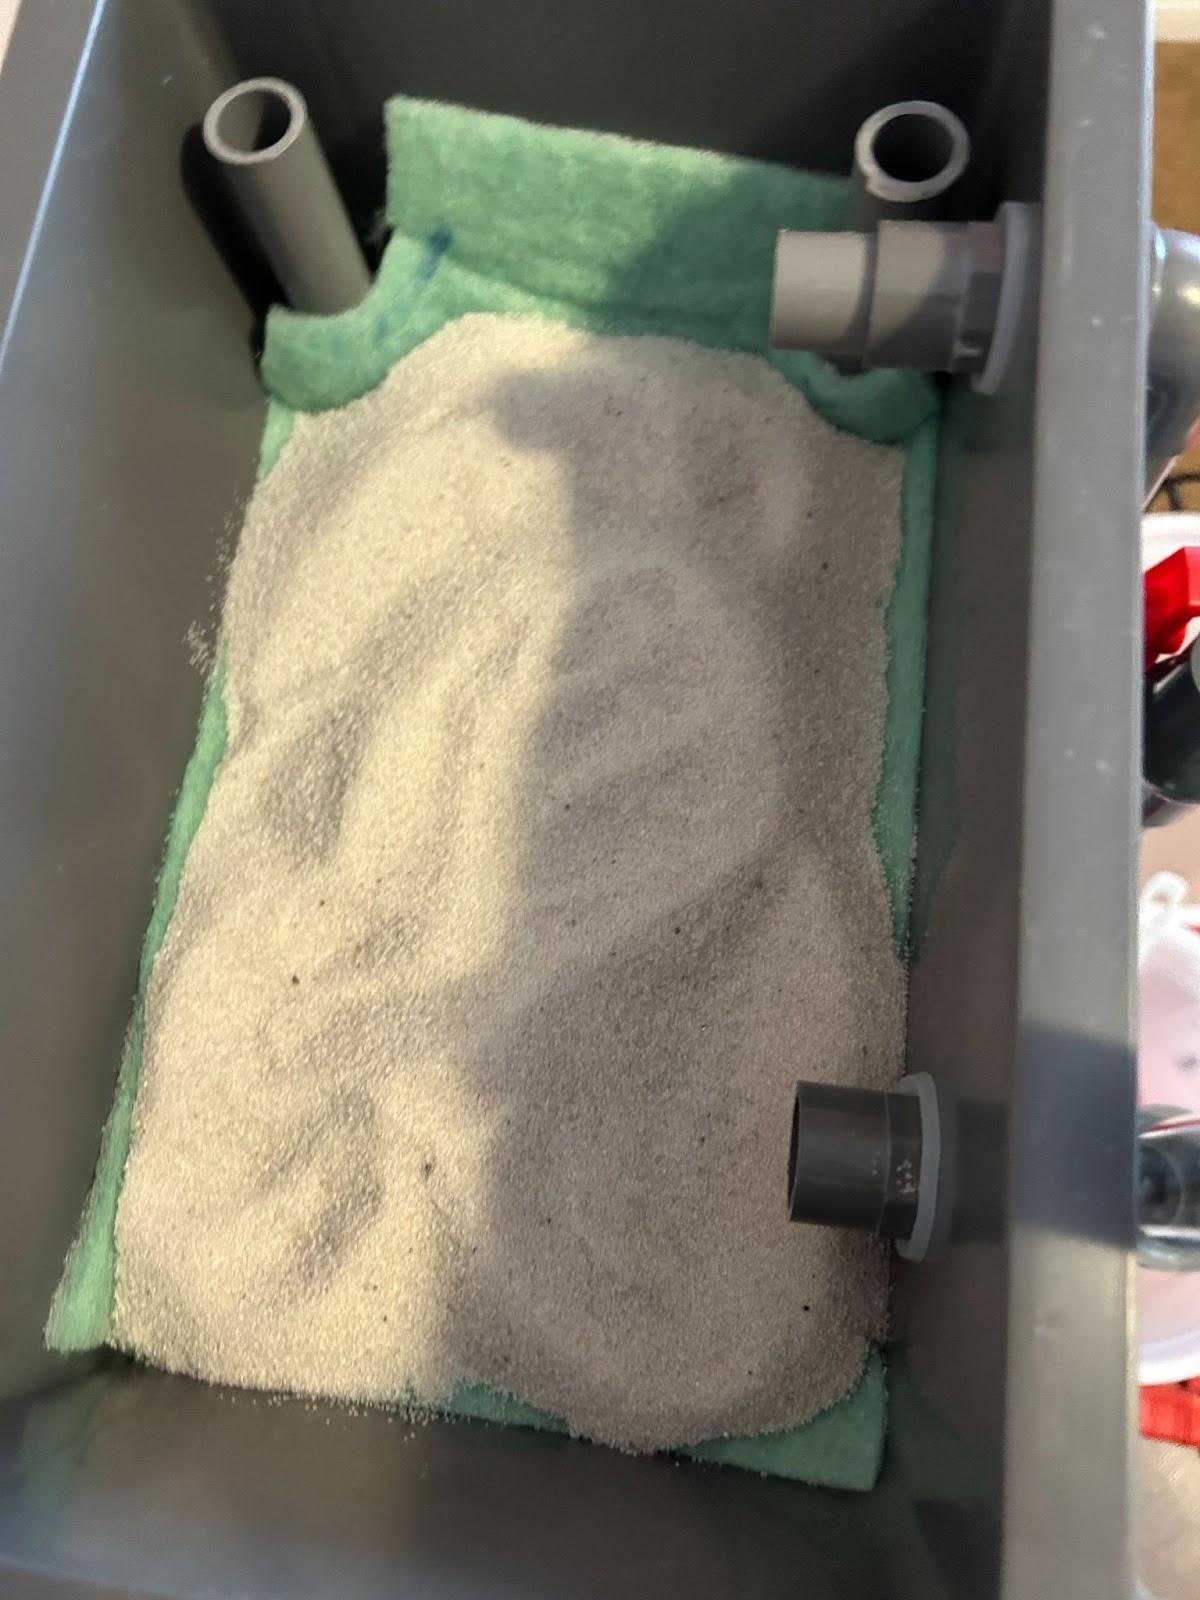
4) Mesh - Holds sediment and captures fine plastics
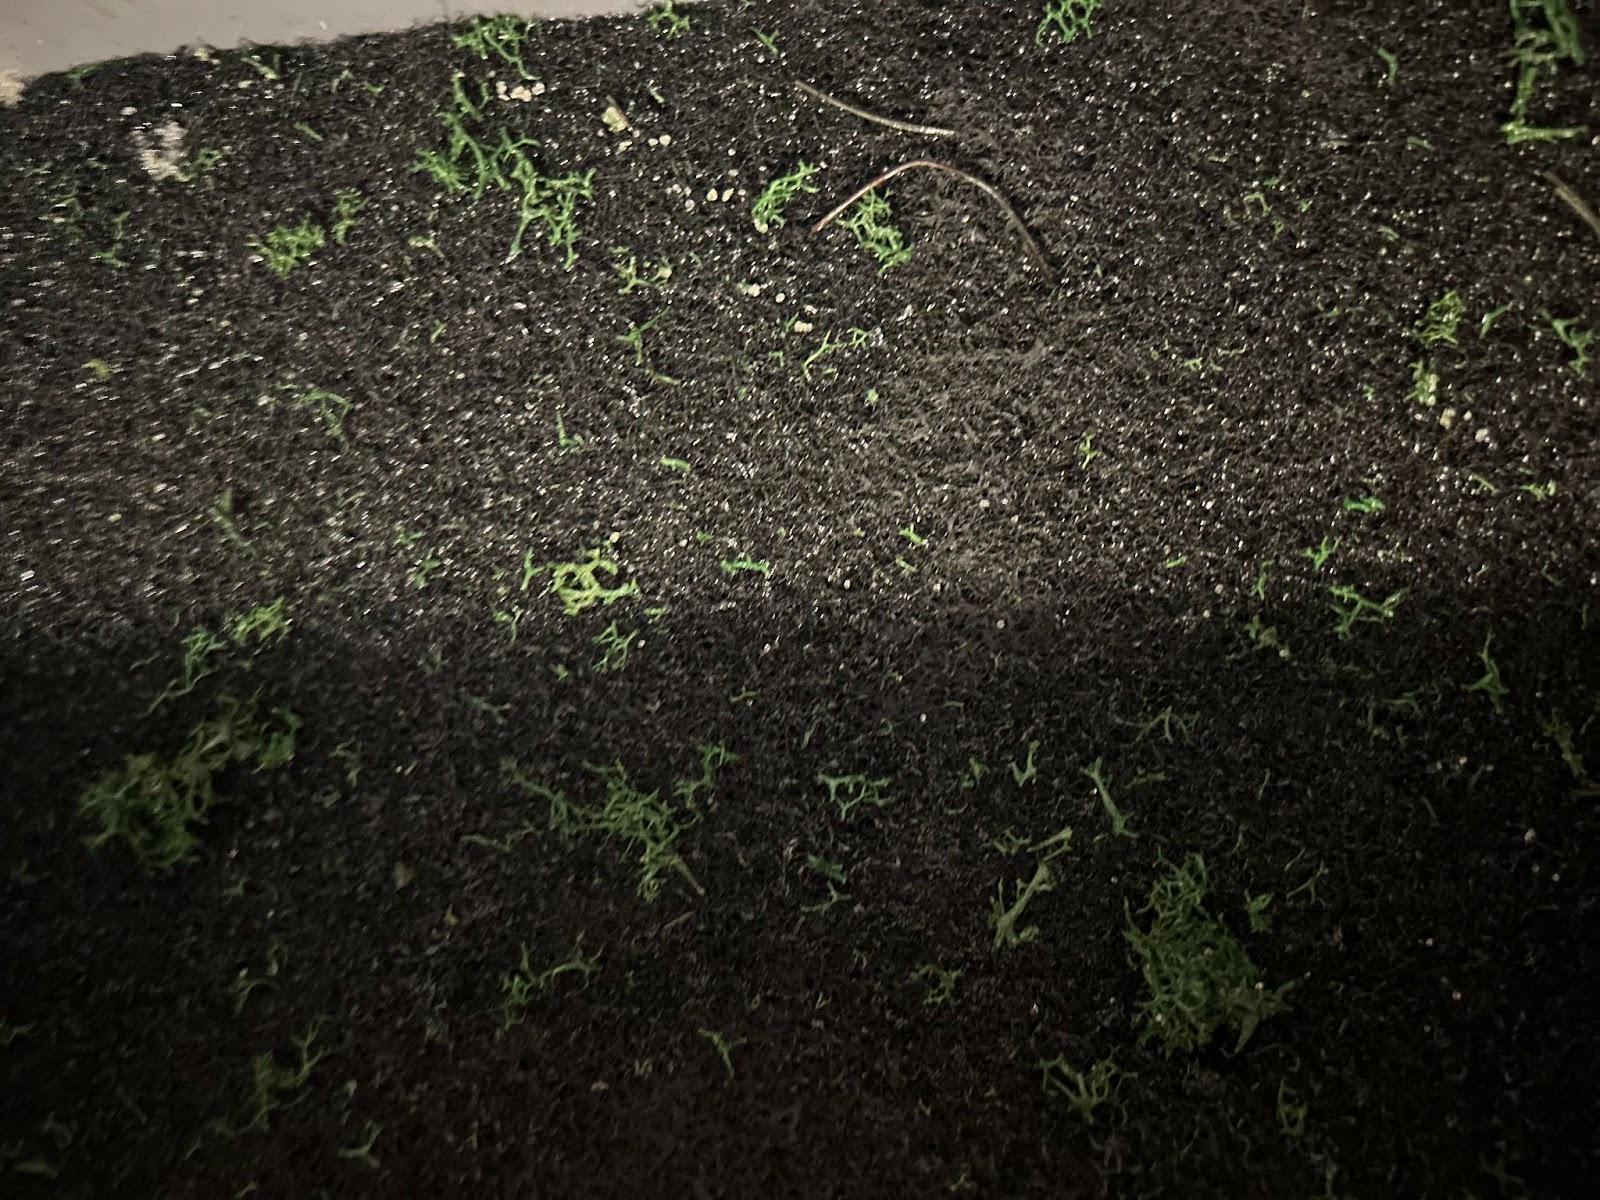
Sand, silt, loose scale, clay, and organic materials are examples of suspended materials that sediment filters remove from water. In this case, I am hoping that the microplastics will be trapped in place of the sand, silt, loose scale, clay, or organic materials.
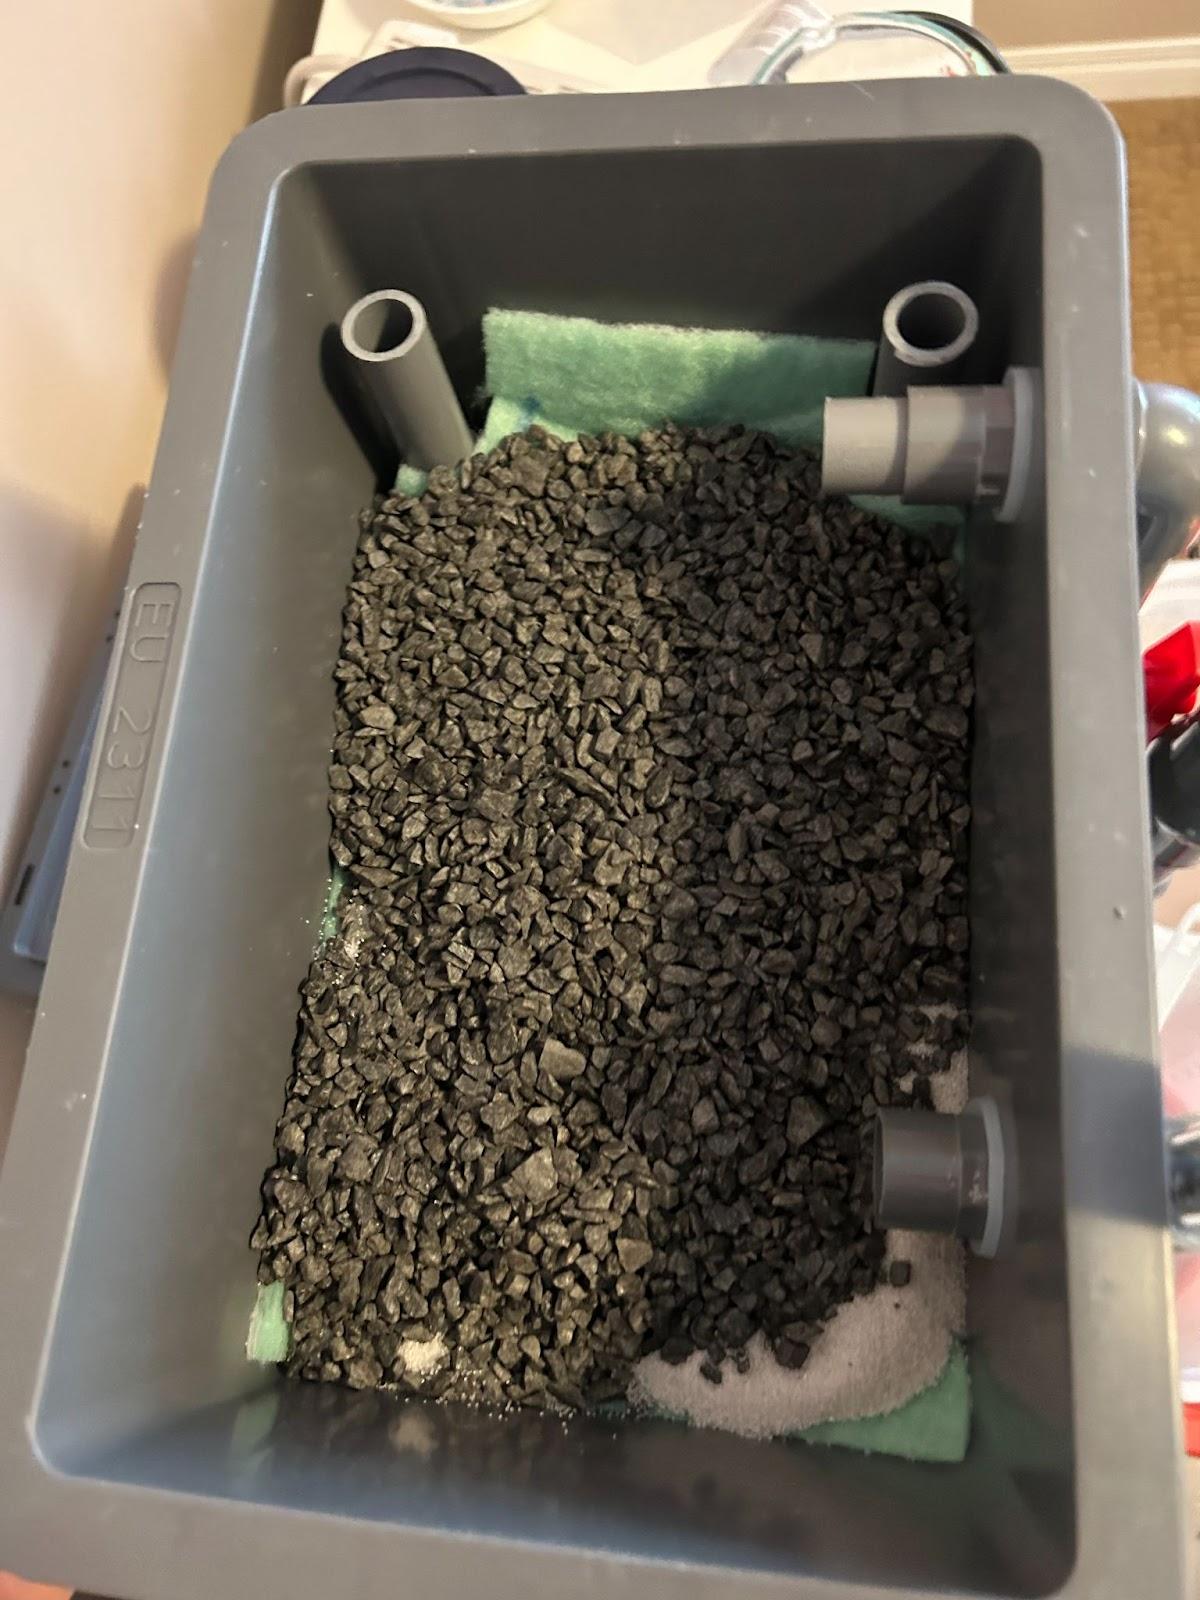
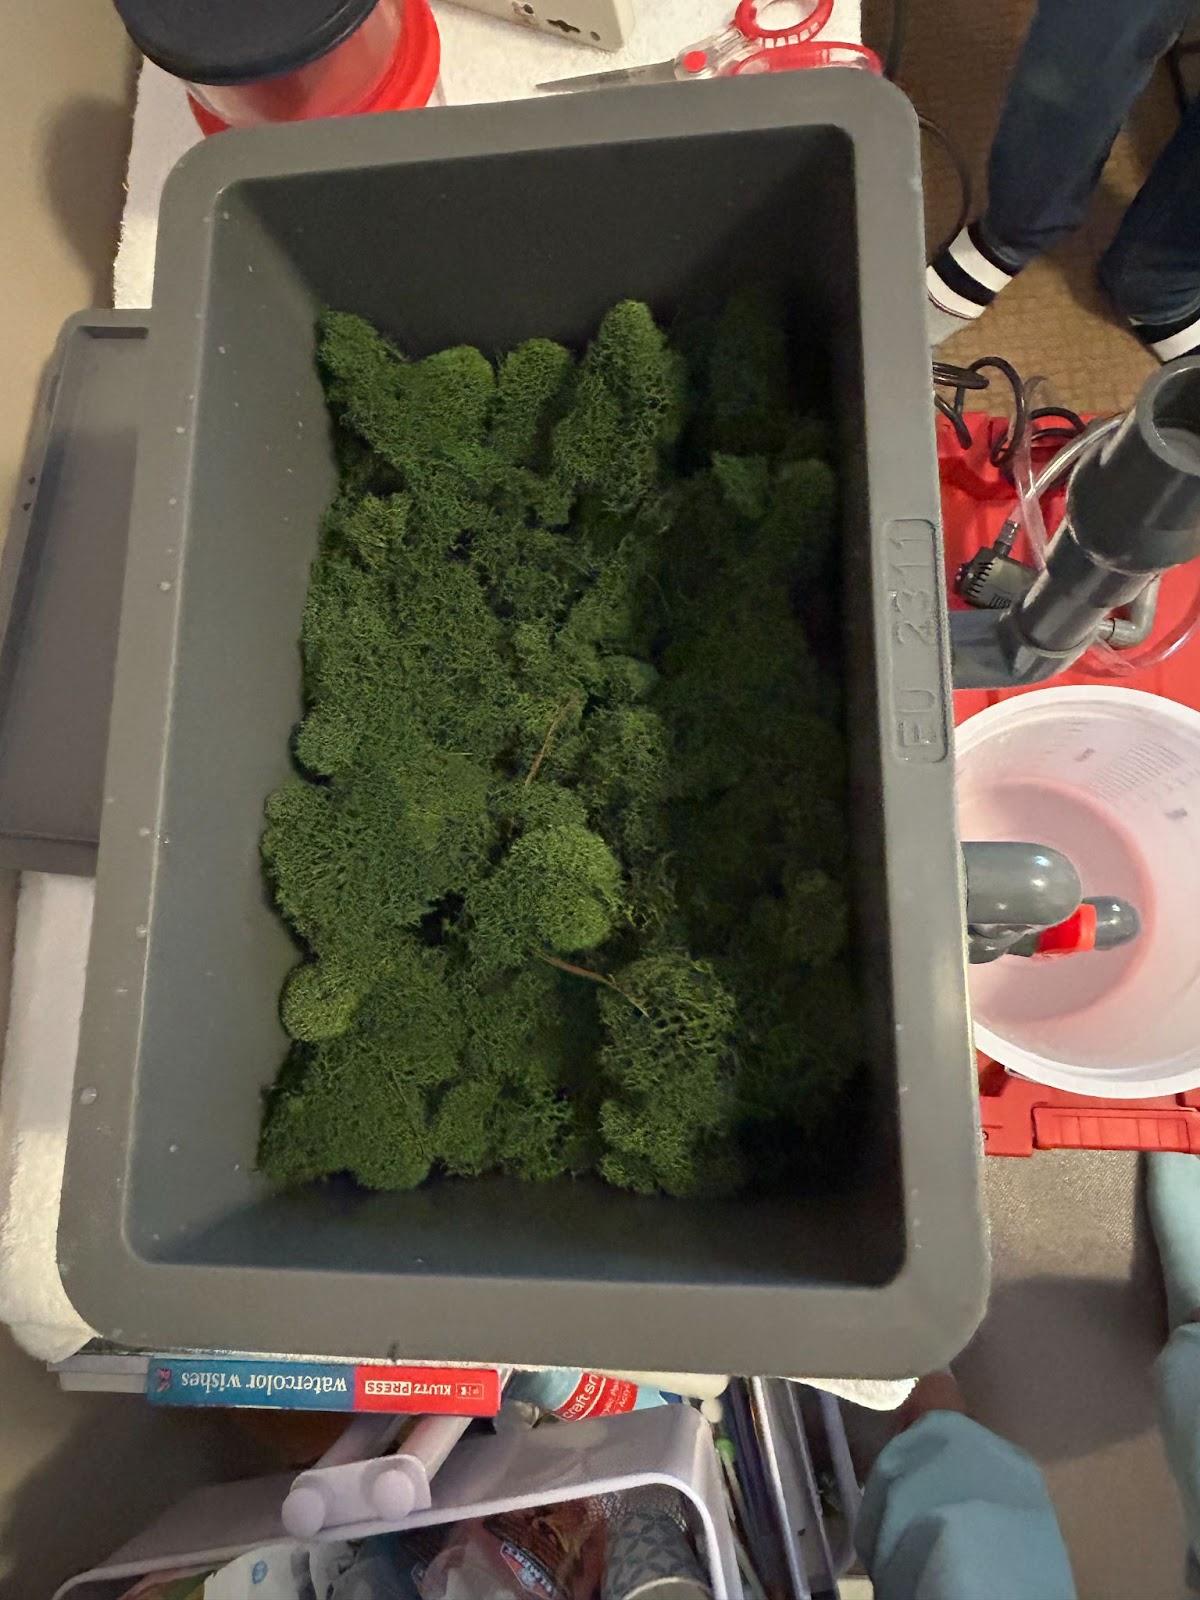
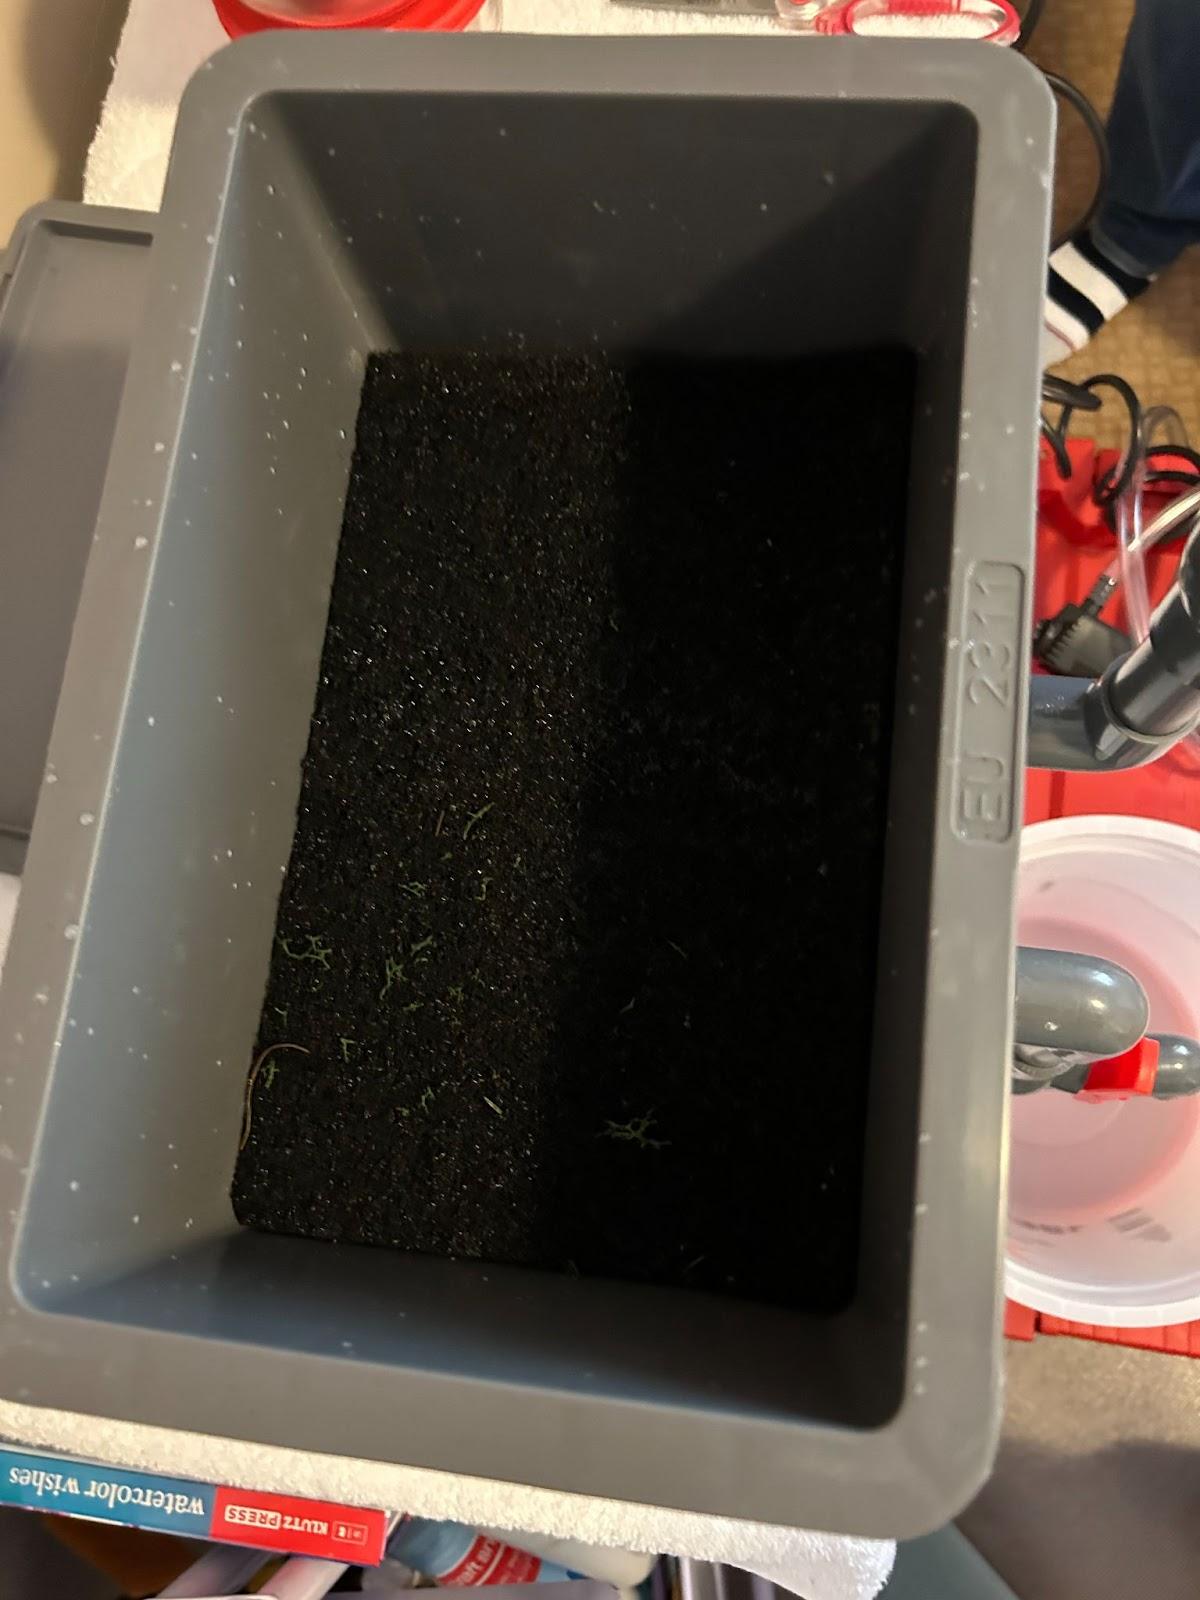
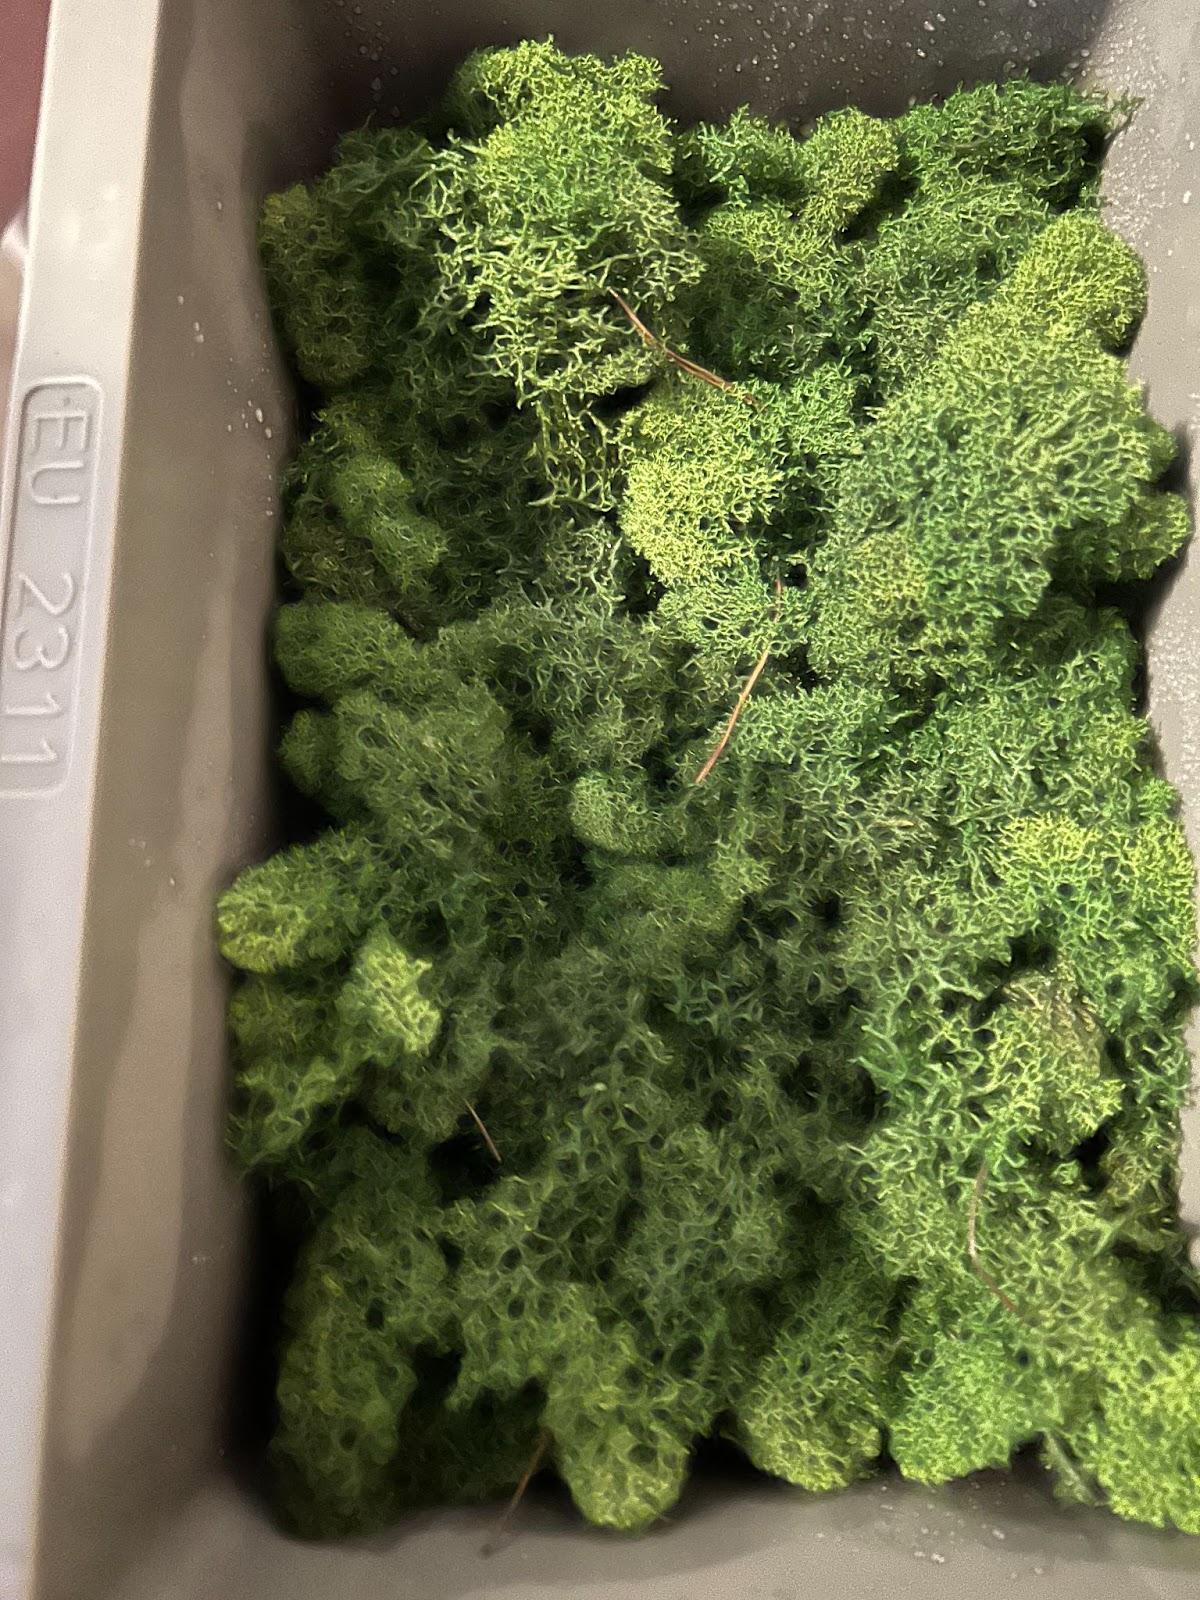
Level 2 - Moss-Carbon Filter (Straining / Flocculation)
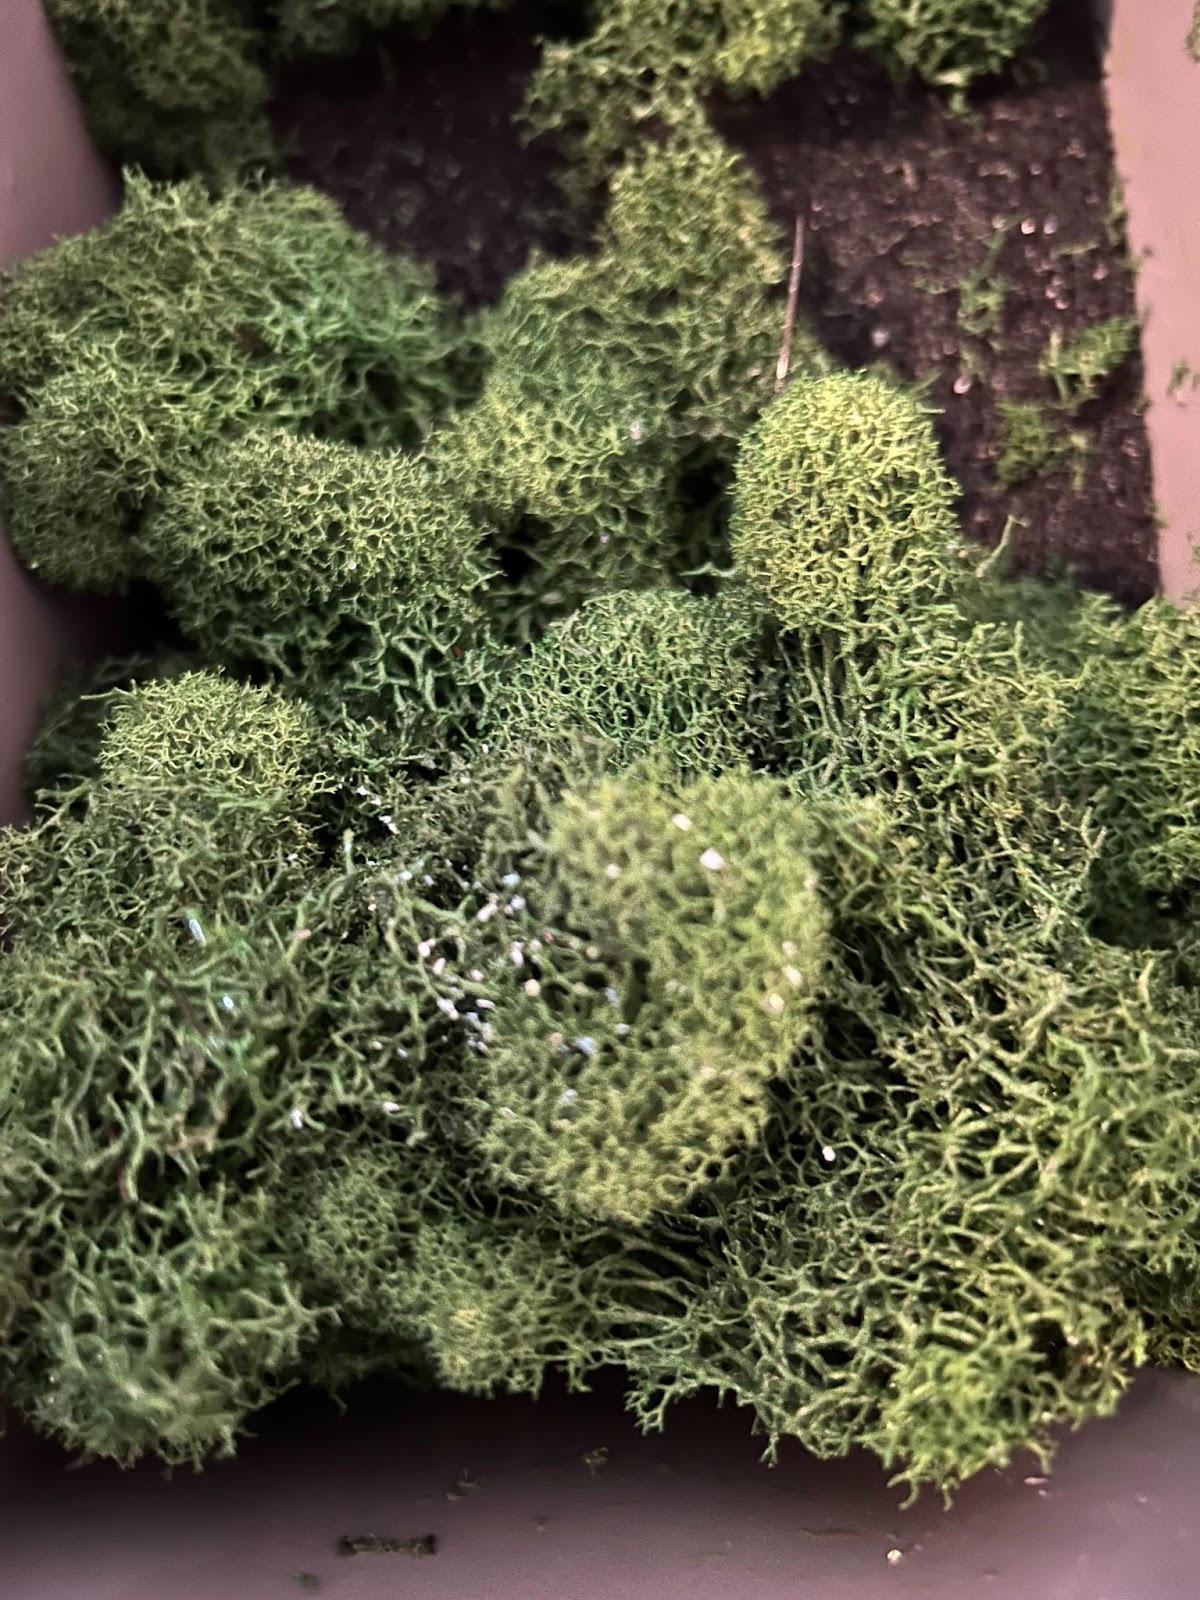
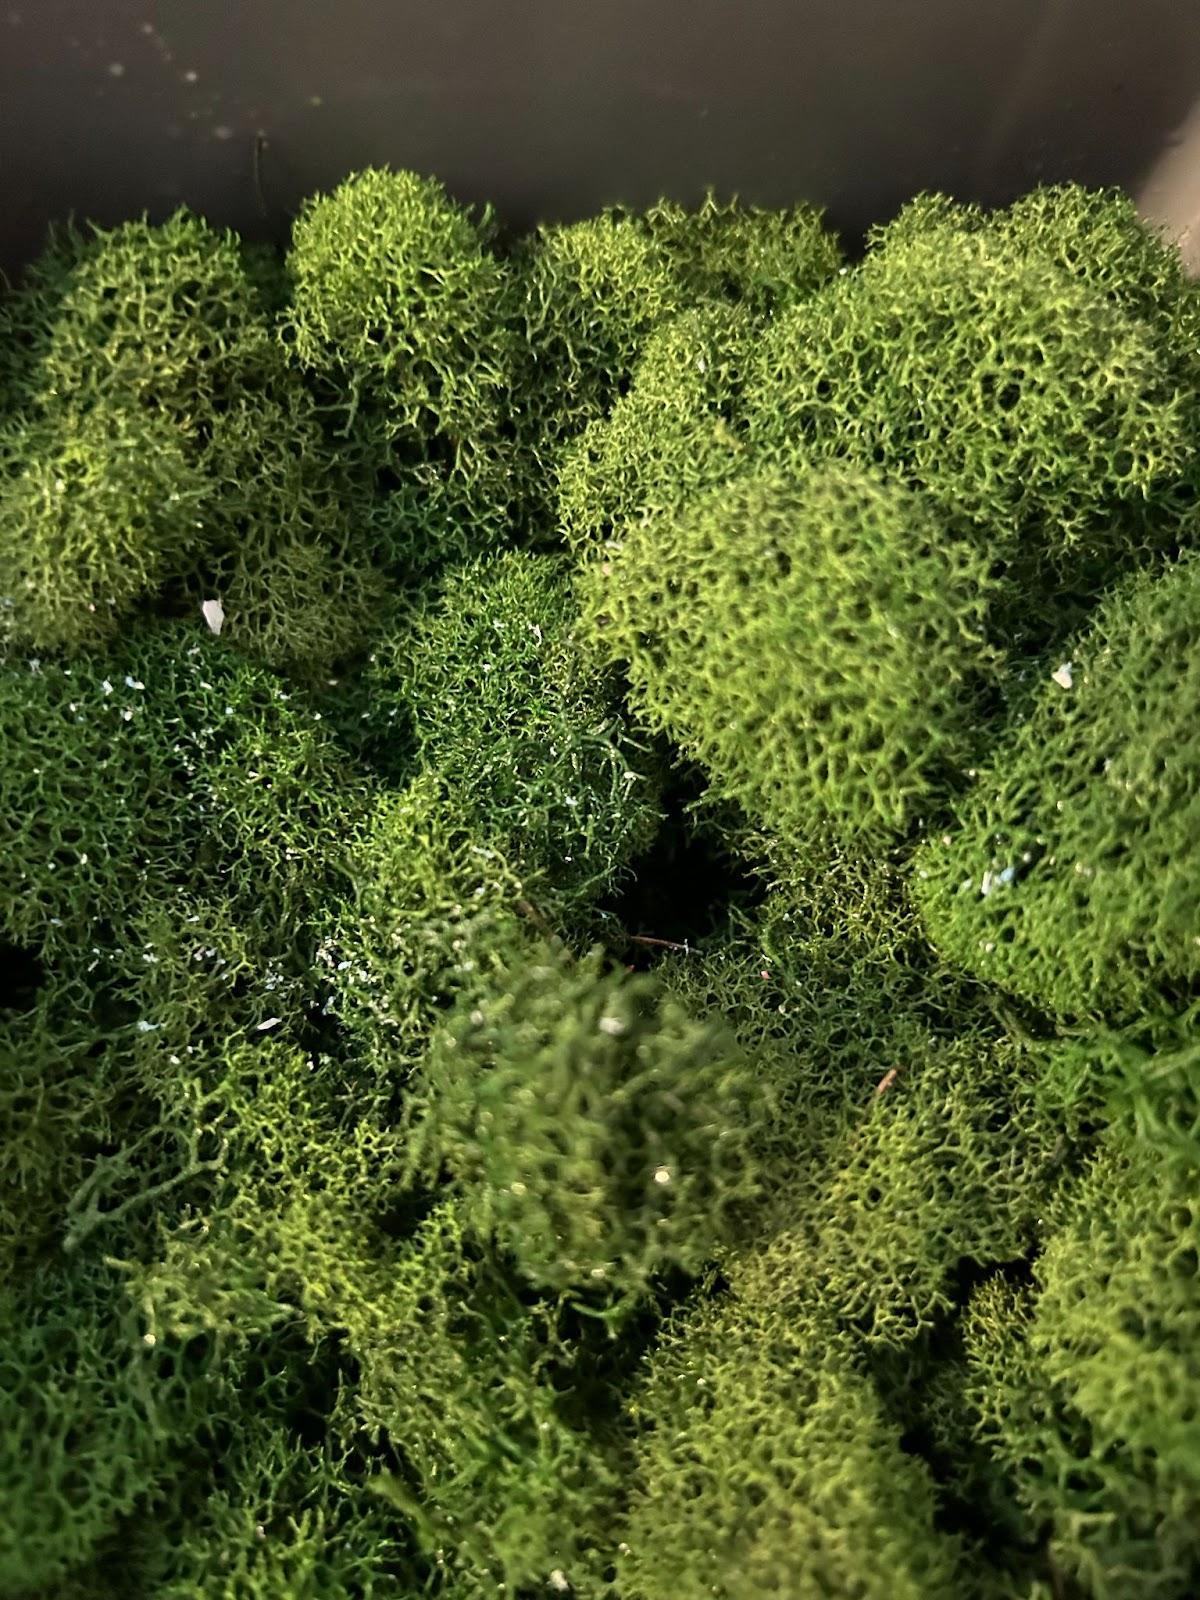
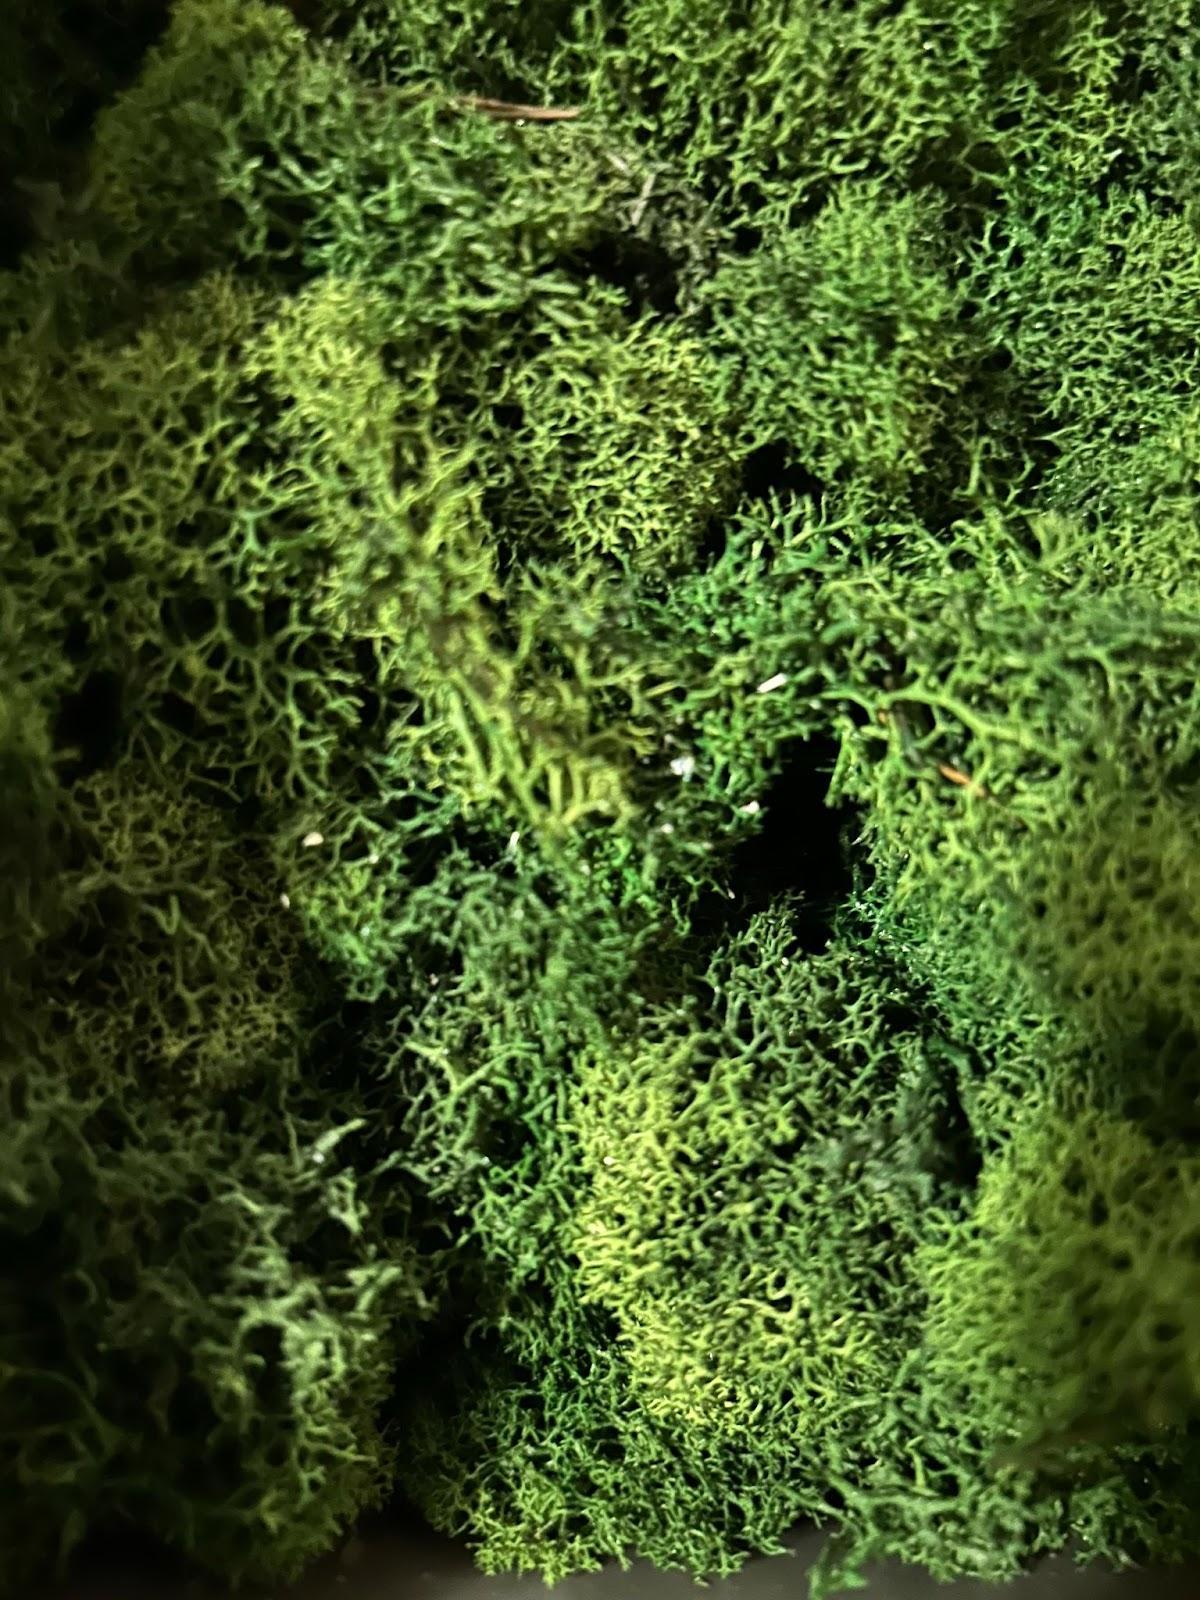
1) Dried Moss - Fine particles may be naturally absorbed by moss, which then breaks it down into safe, organic biomass. It stores the particles as sediment that it cannot utilize. Since moss is very dense and compact the plastics should also get stuck in it.
2) Carbon Filters -Through absorption, pollutants are eliminated by carbon filters. Absorption is the process by which impurities are drawn to the activated carbon's surface and retained there, much to how a magnet draws and retains iron filings. Additionally, carbon filters function as a catalyst to alter the chemistry of some pollutants.
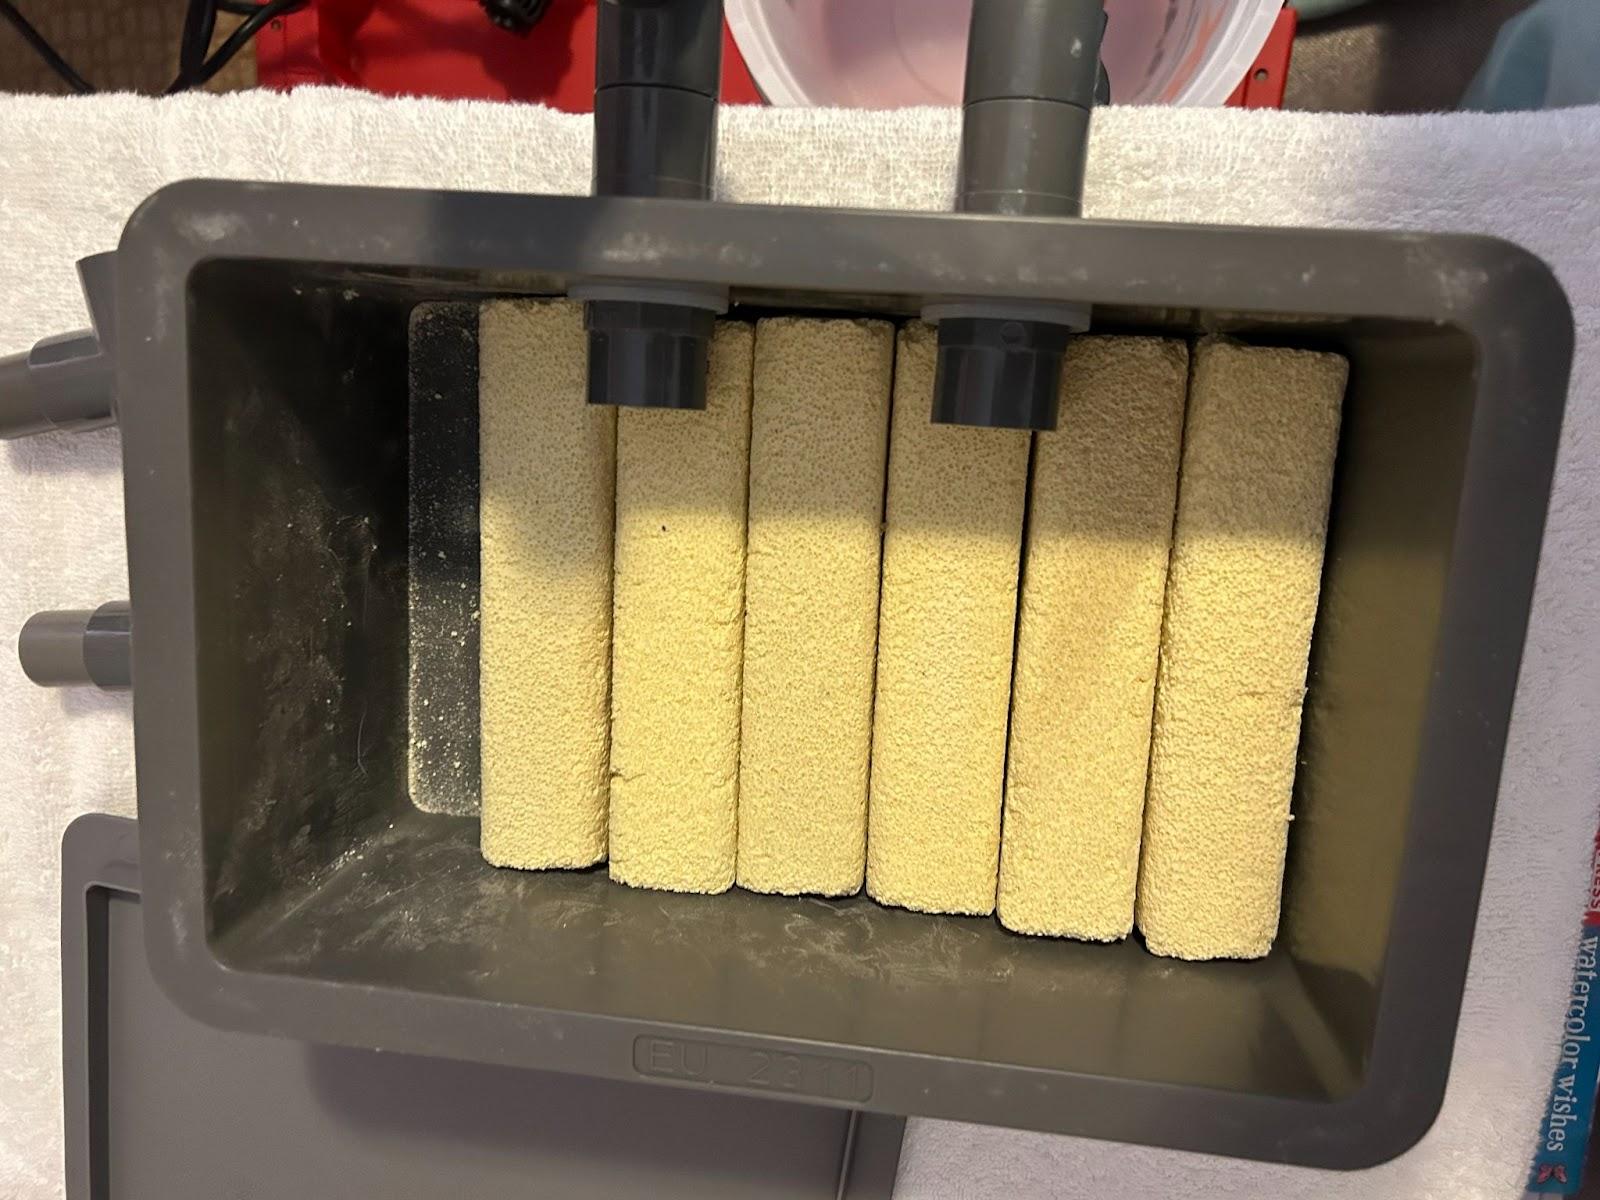
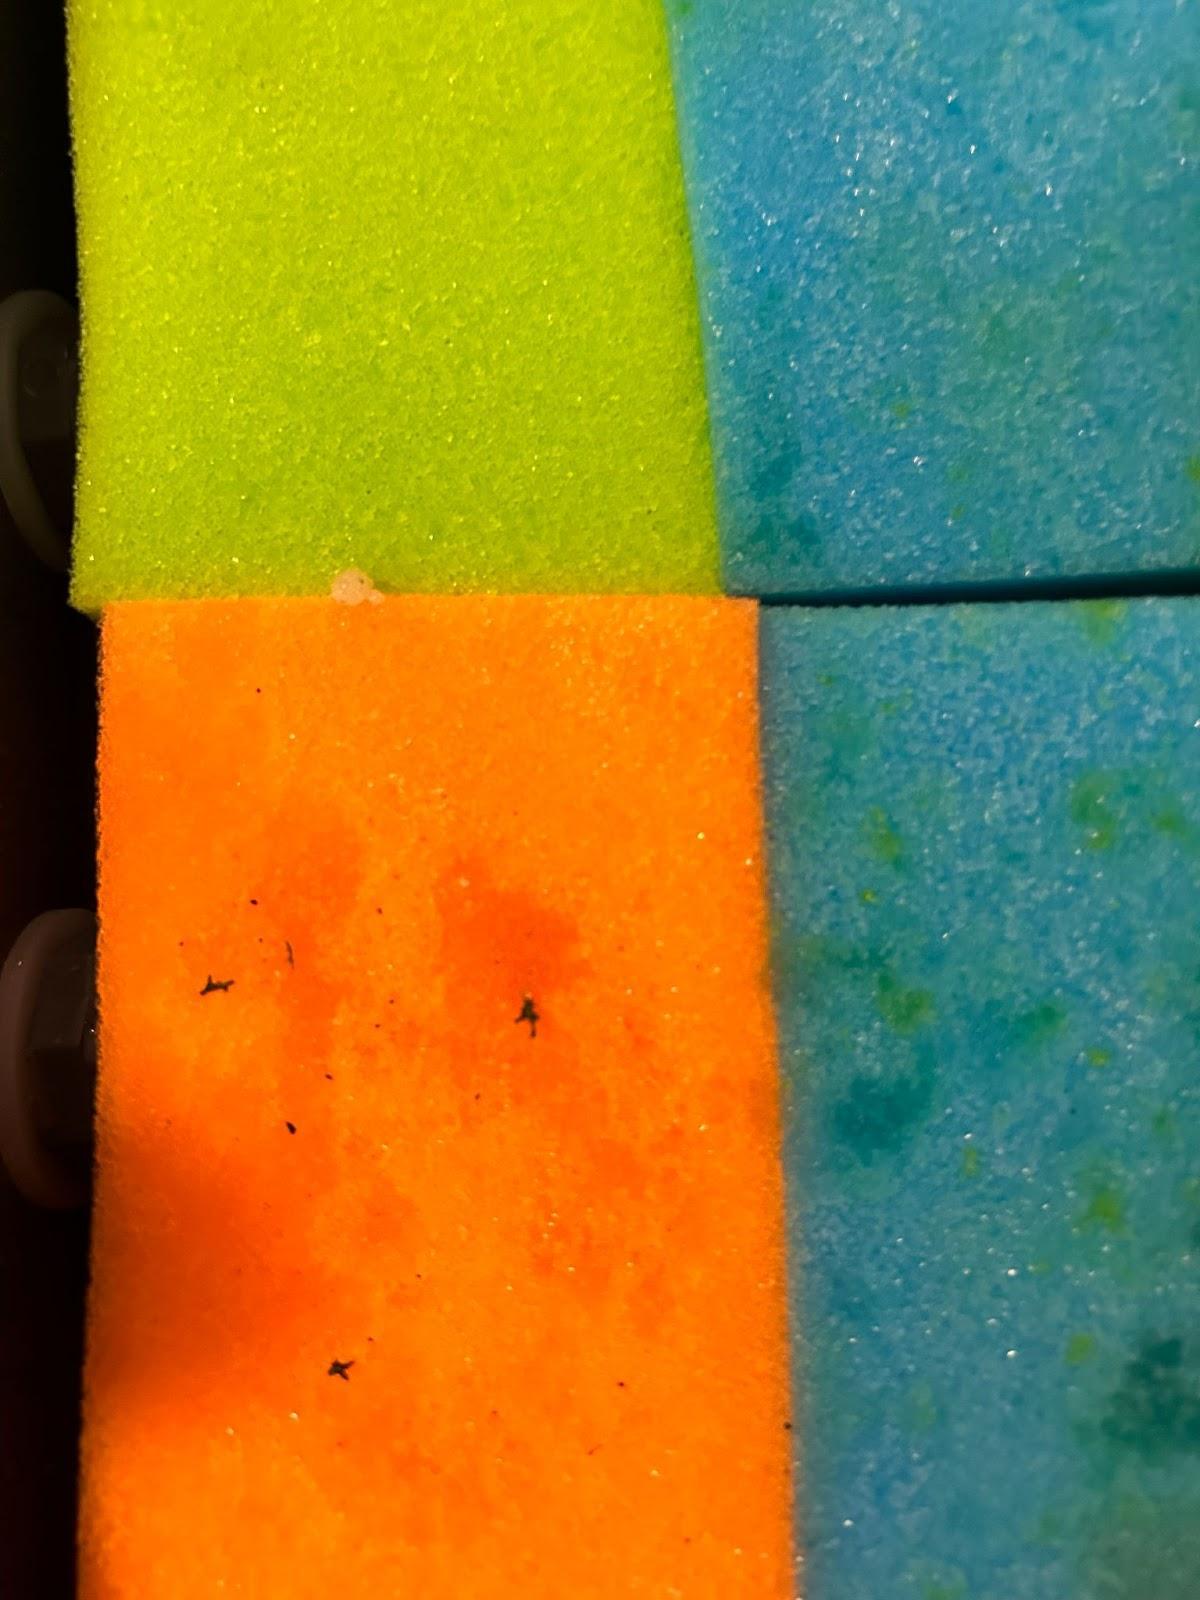
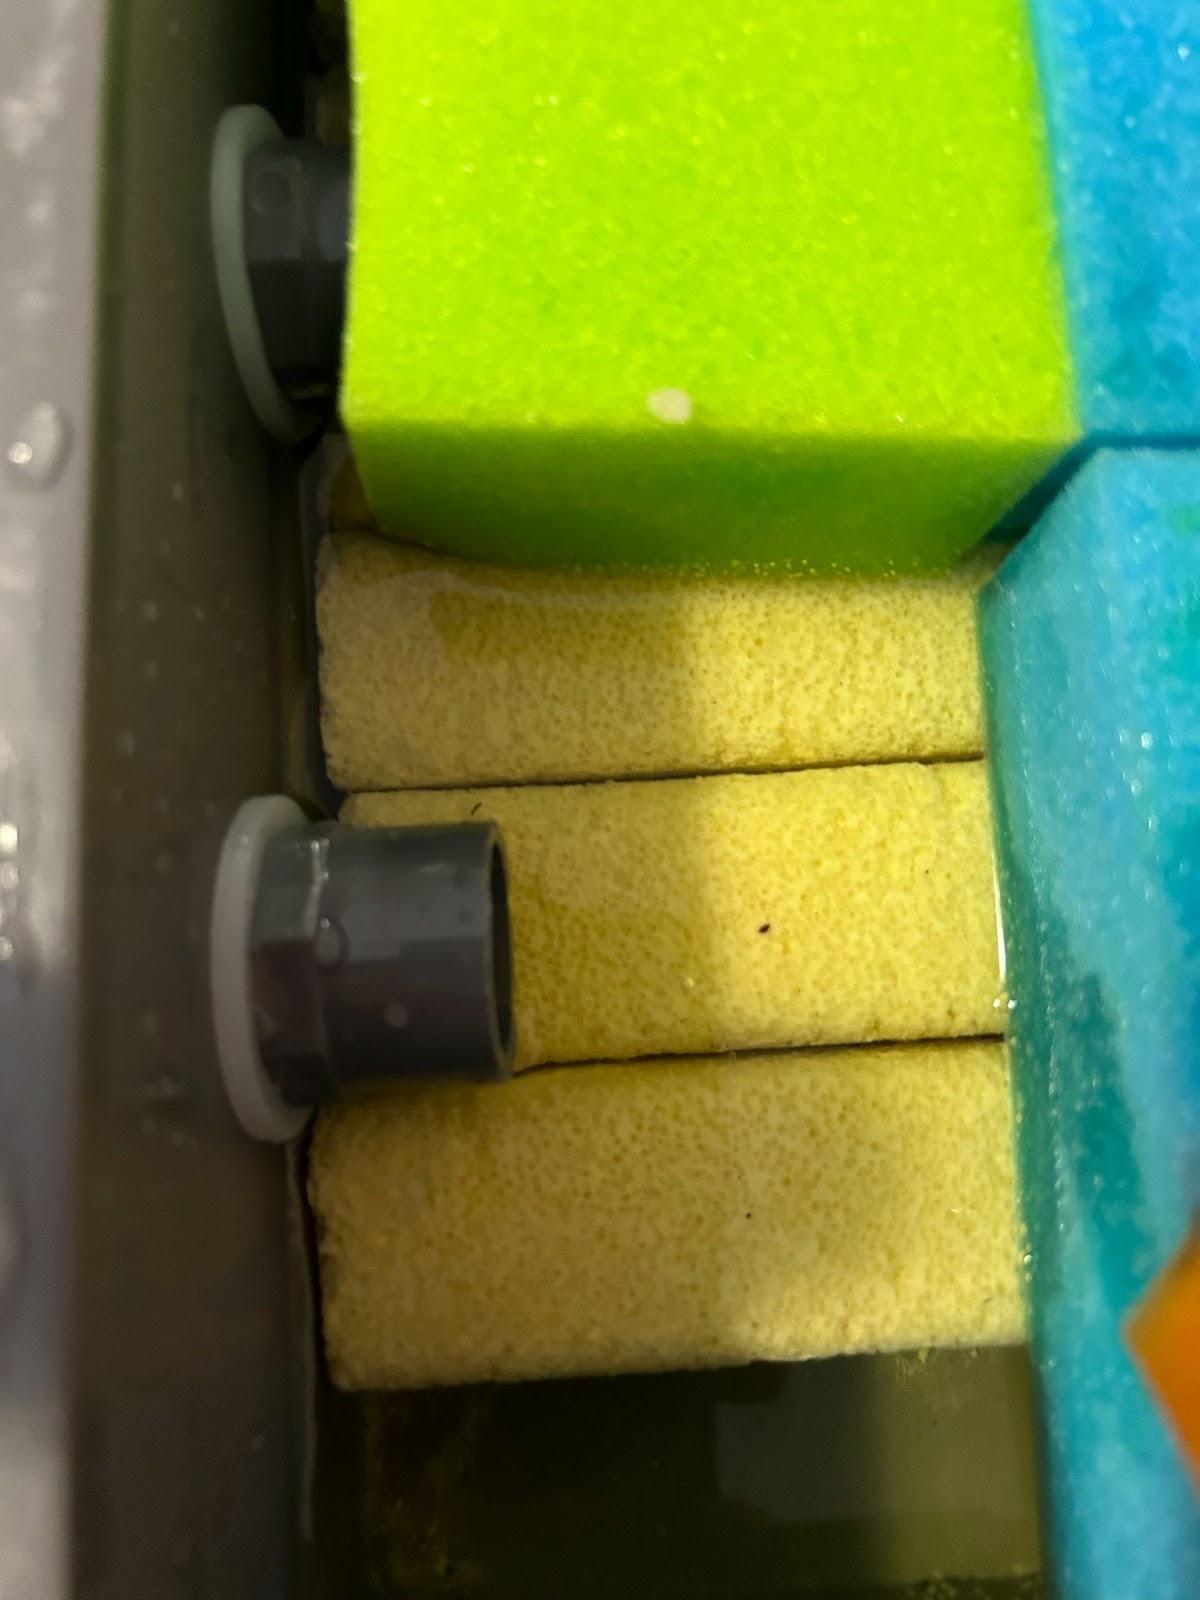
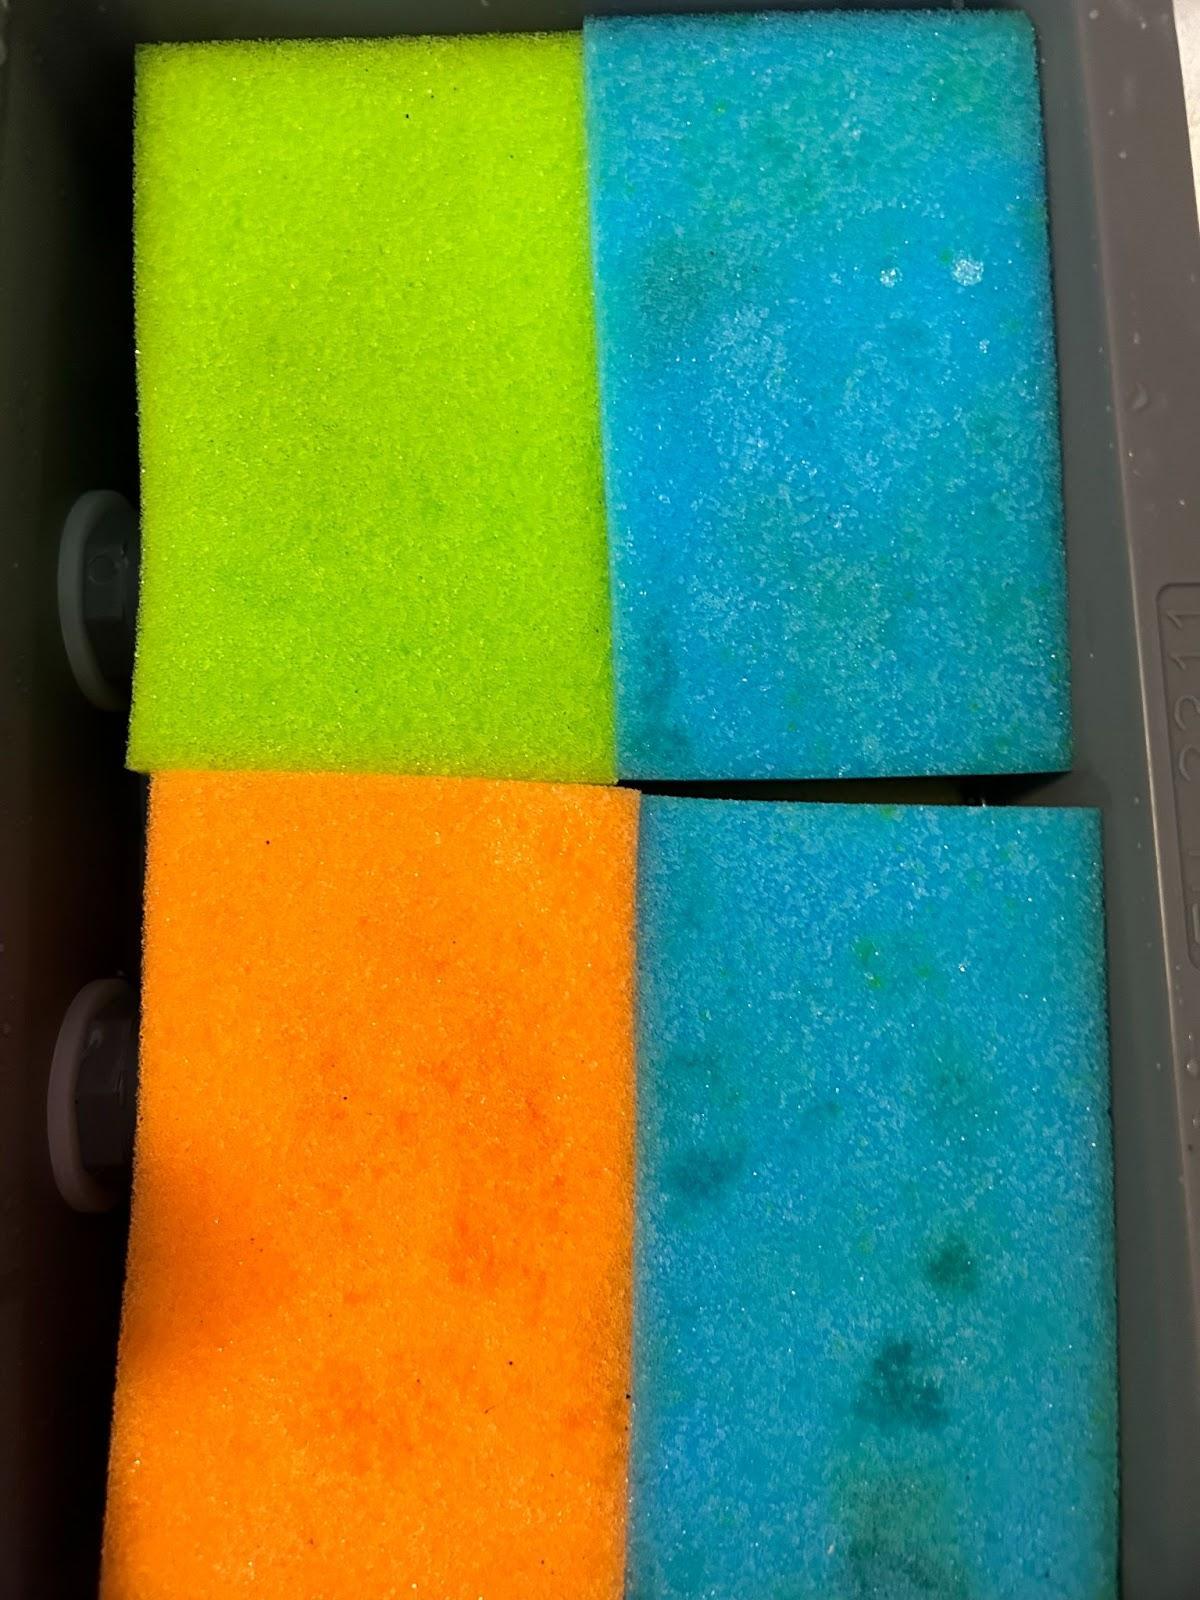
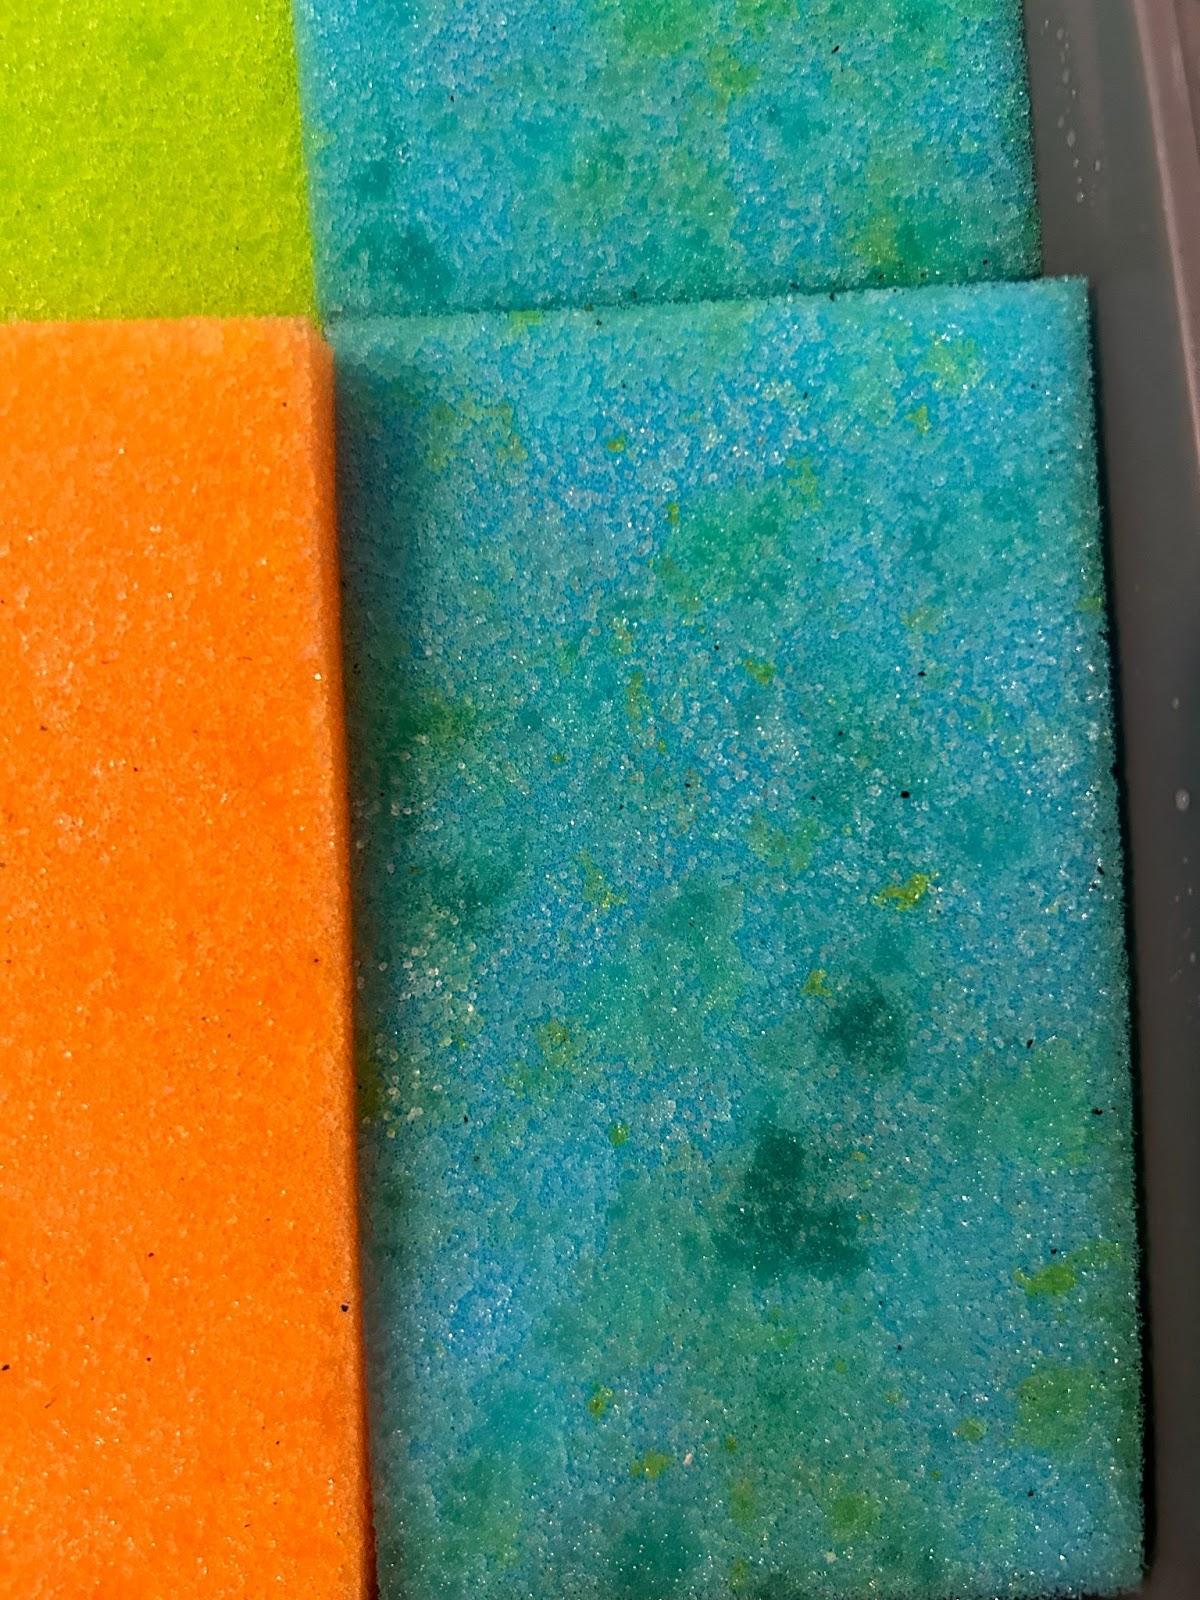
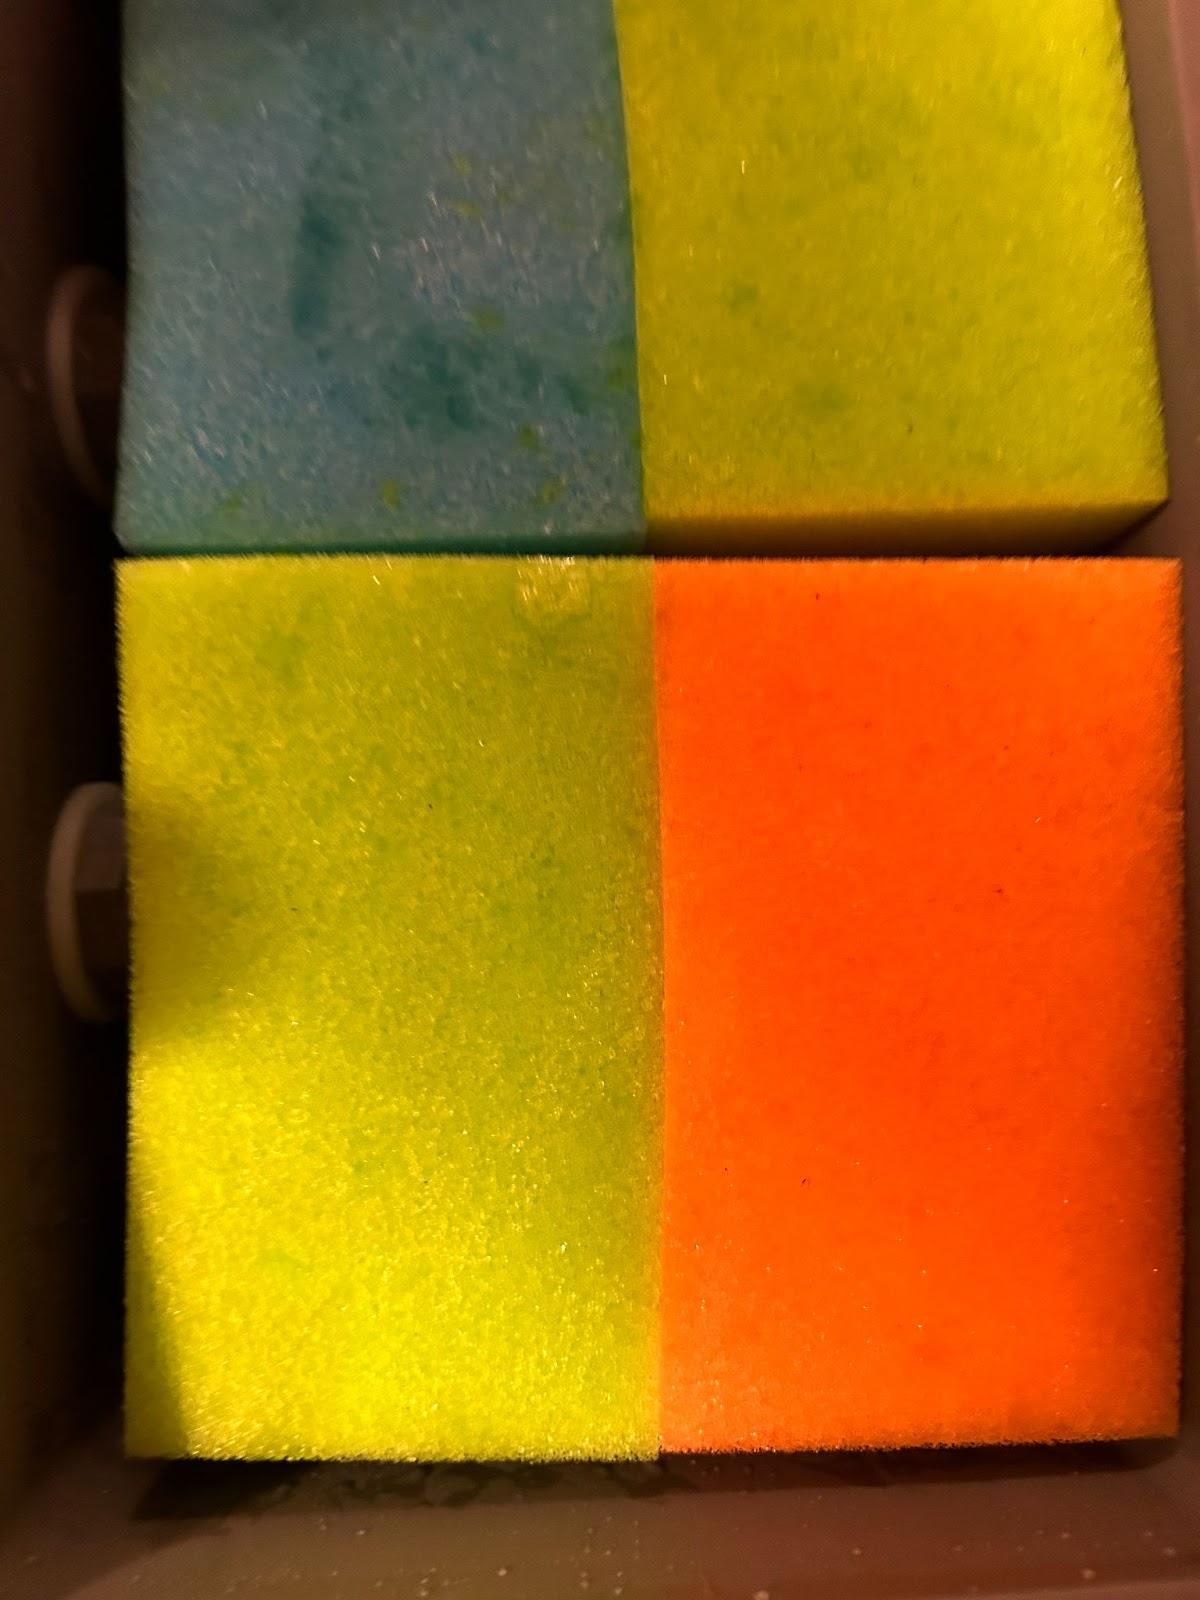
Level 3 - Sponges - Absorption Pillars (Biological Component / Absorption)
1) Sponge - Sponges are useful because their pores are big enough to absorb large pollutants, such as microplastics (micrometer scale), without clogging. The core concept is that they fill with polluted water, then the pollutant sticks to the sponge surface.
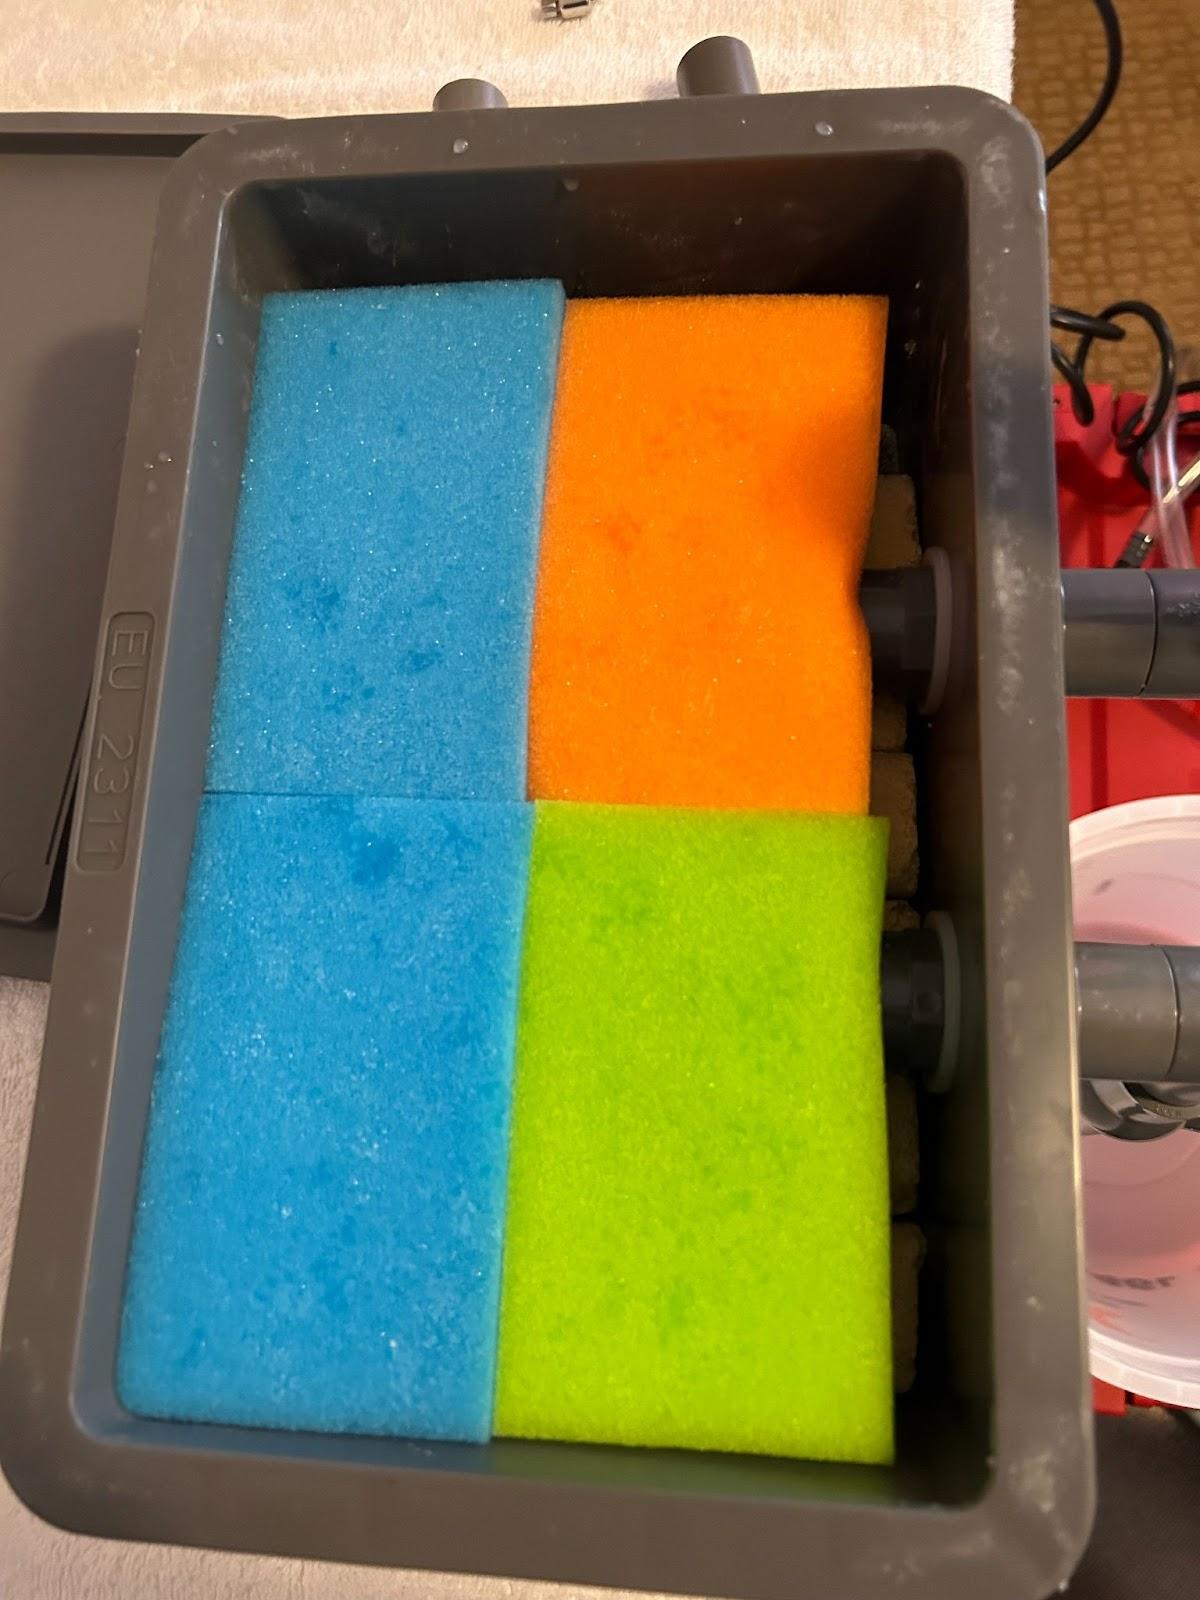
2) Absorption Aquarium Pillars - Used to absorb small particles in the water. (In this case the small microplastics.)
Procedure for Operating the Filter
1) Create the salt water solution
2) Add 1/4 tsp microplastics to solution
3) Place the bucket down and add in the water pump
4) Connect the pump to the filter
5) Put a bucked near the water drain to collect the output water
6) Switch on the power
7) Stir water + microplastics to ensure they are spread evenly throughout the water
8) Stop when input water level is at 2l
9) Collect samples and analyze
Analysis
Water salinity loss = After being measured by the hydrometre the input water (salt solution before running through filter) was at 42 ppt, while the output was at roughly 41.7ppt. This means that not alot of salt was lost and the filter can be considered ecologically friendly.
Video of how the filter runs. - https://drive.google.com/file/d/1IcgkRgmpQLQ86Oly6Z_qLLKeSlfKmA9n/view?usp=sharing
There will be 4 material changes in total. There will be 20 test runs in which samples will be taken in between tests.
This way of analyzing the water ensures :
1)The effectiveness of how well the materials hold up to see if after a long time the filter won't be as effective because the materials are old.
2) Effectiveness of the removal of microplastics
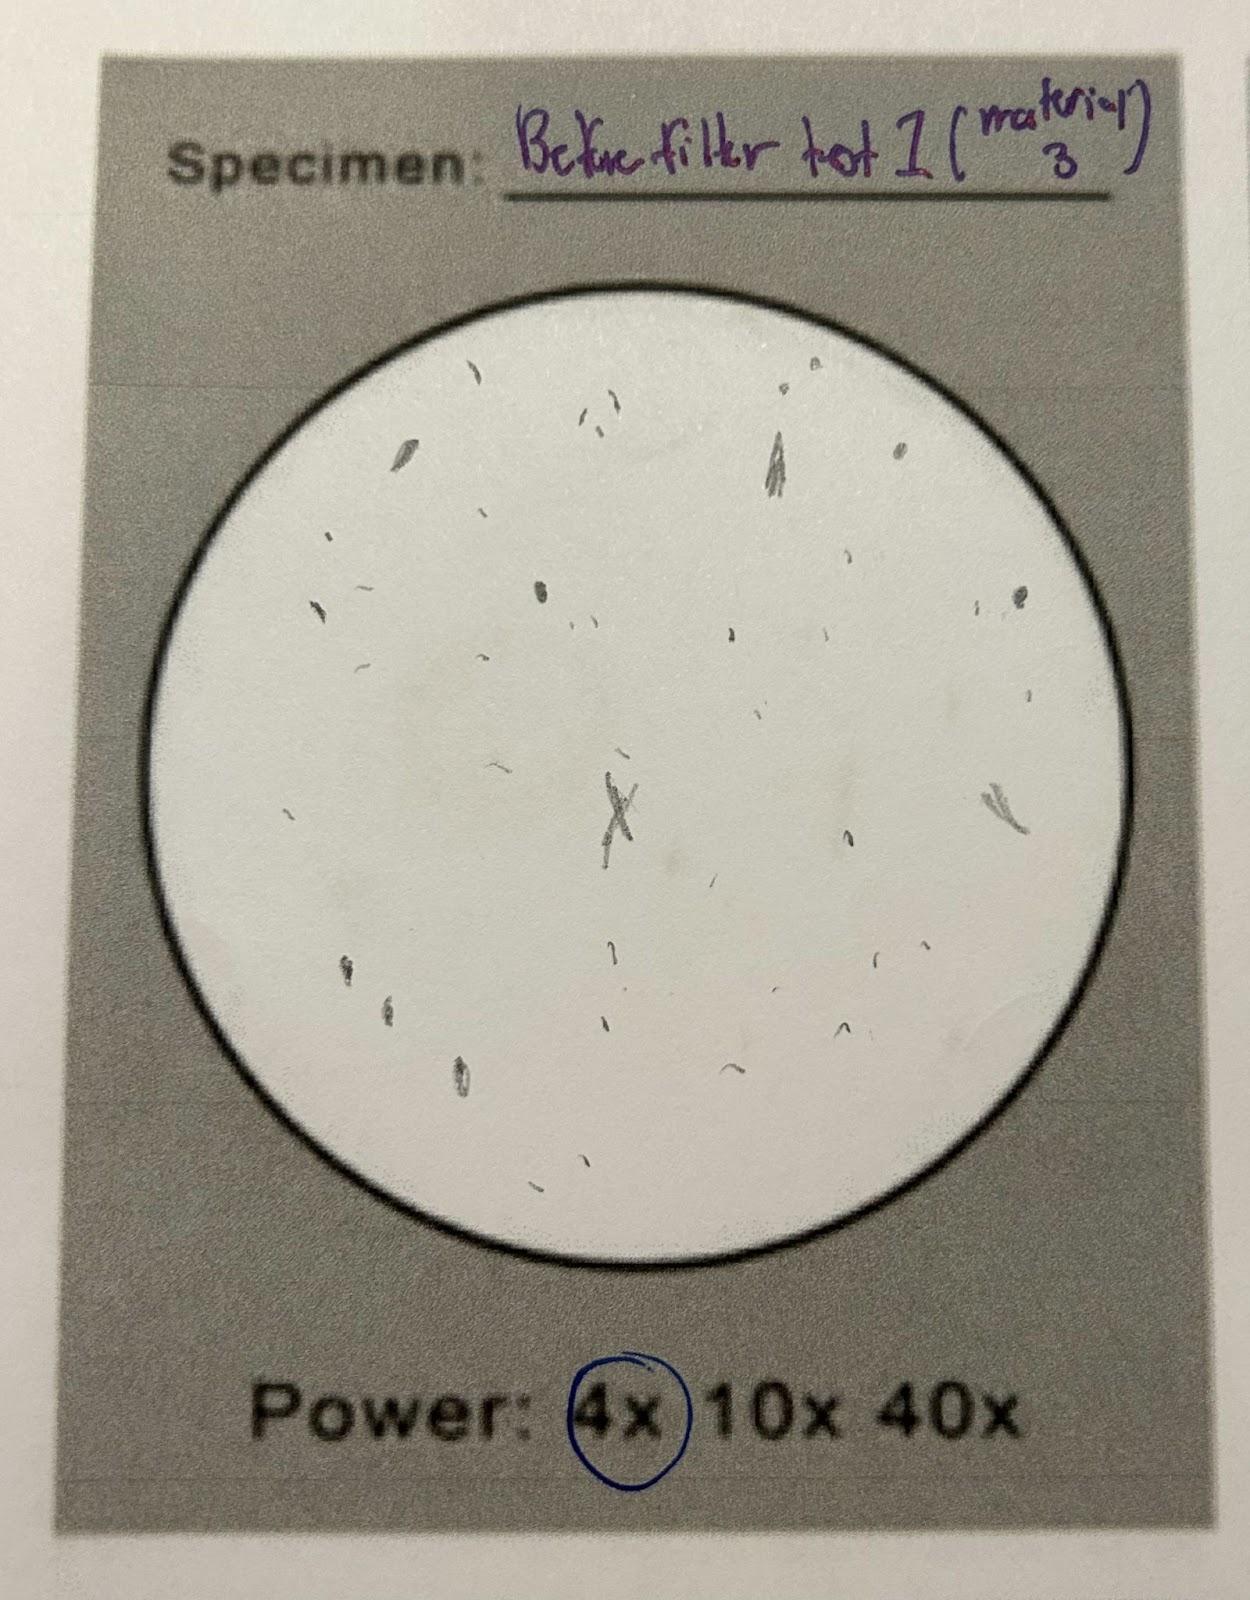
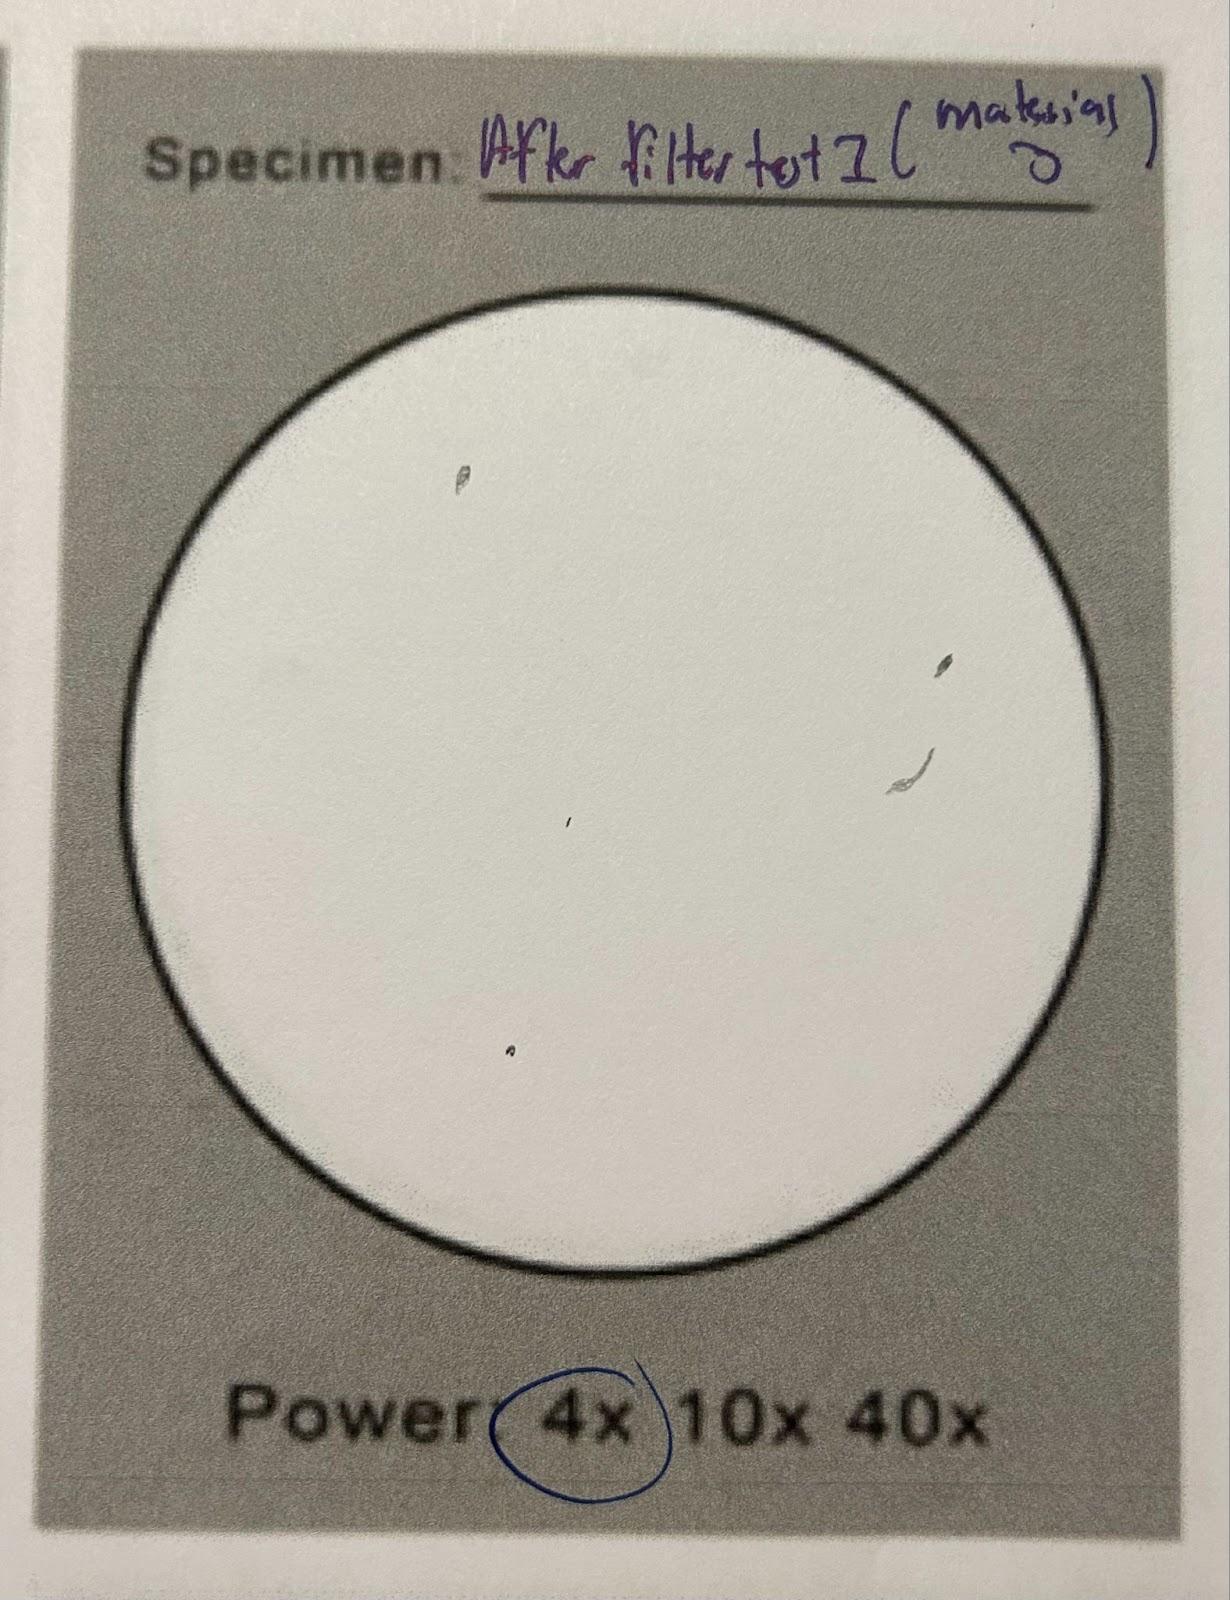
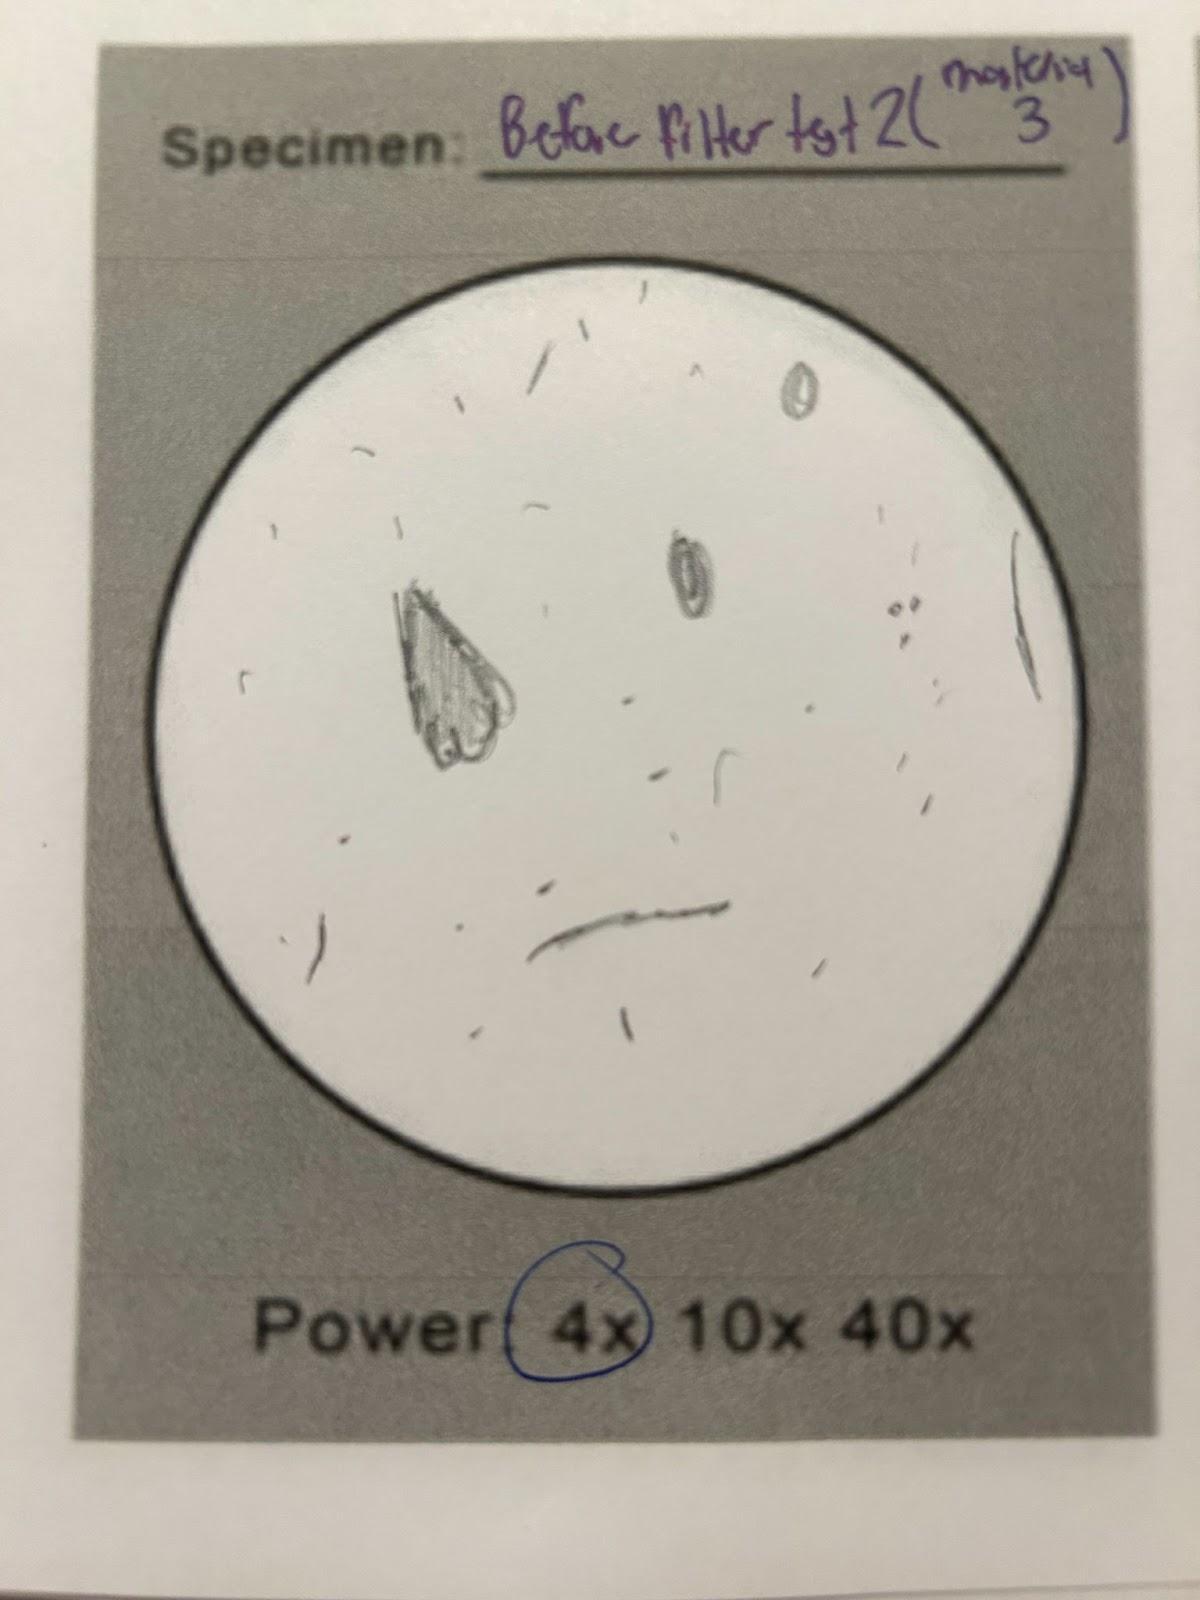
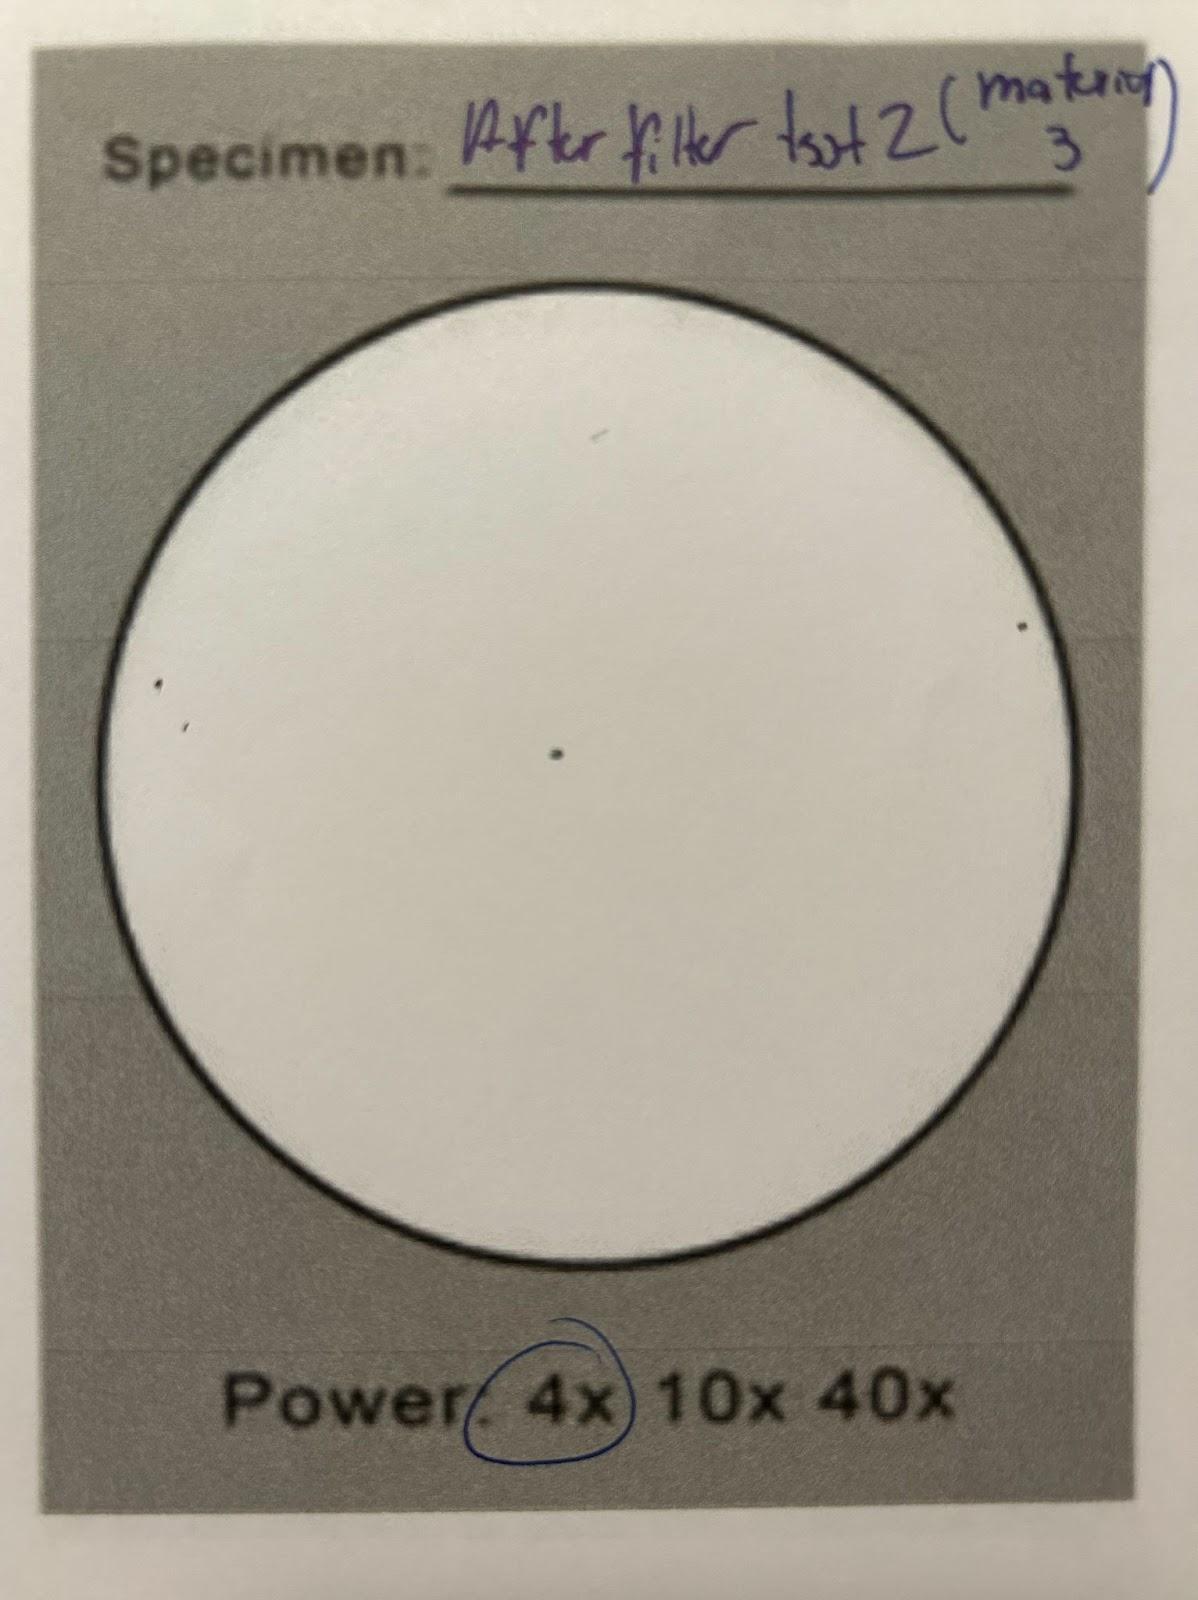
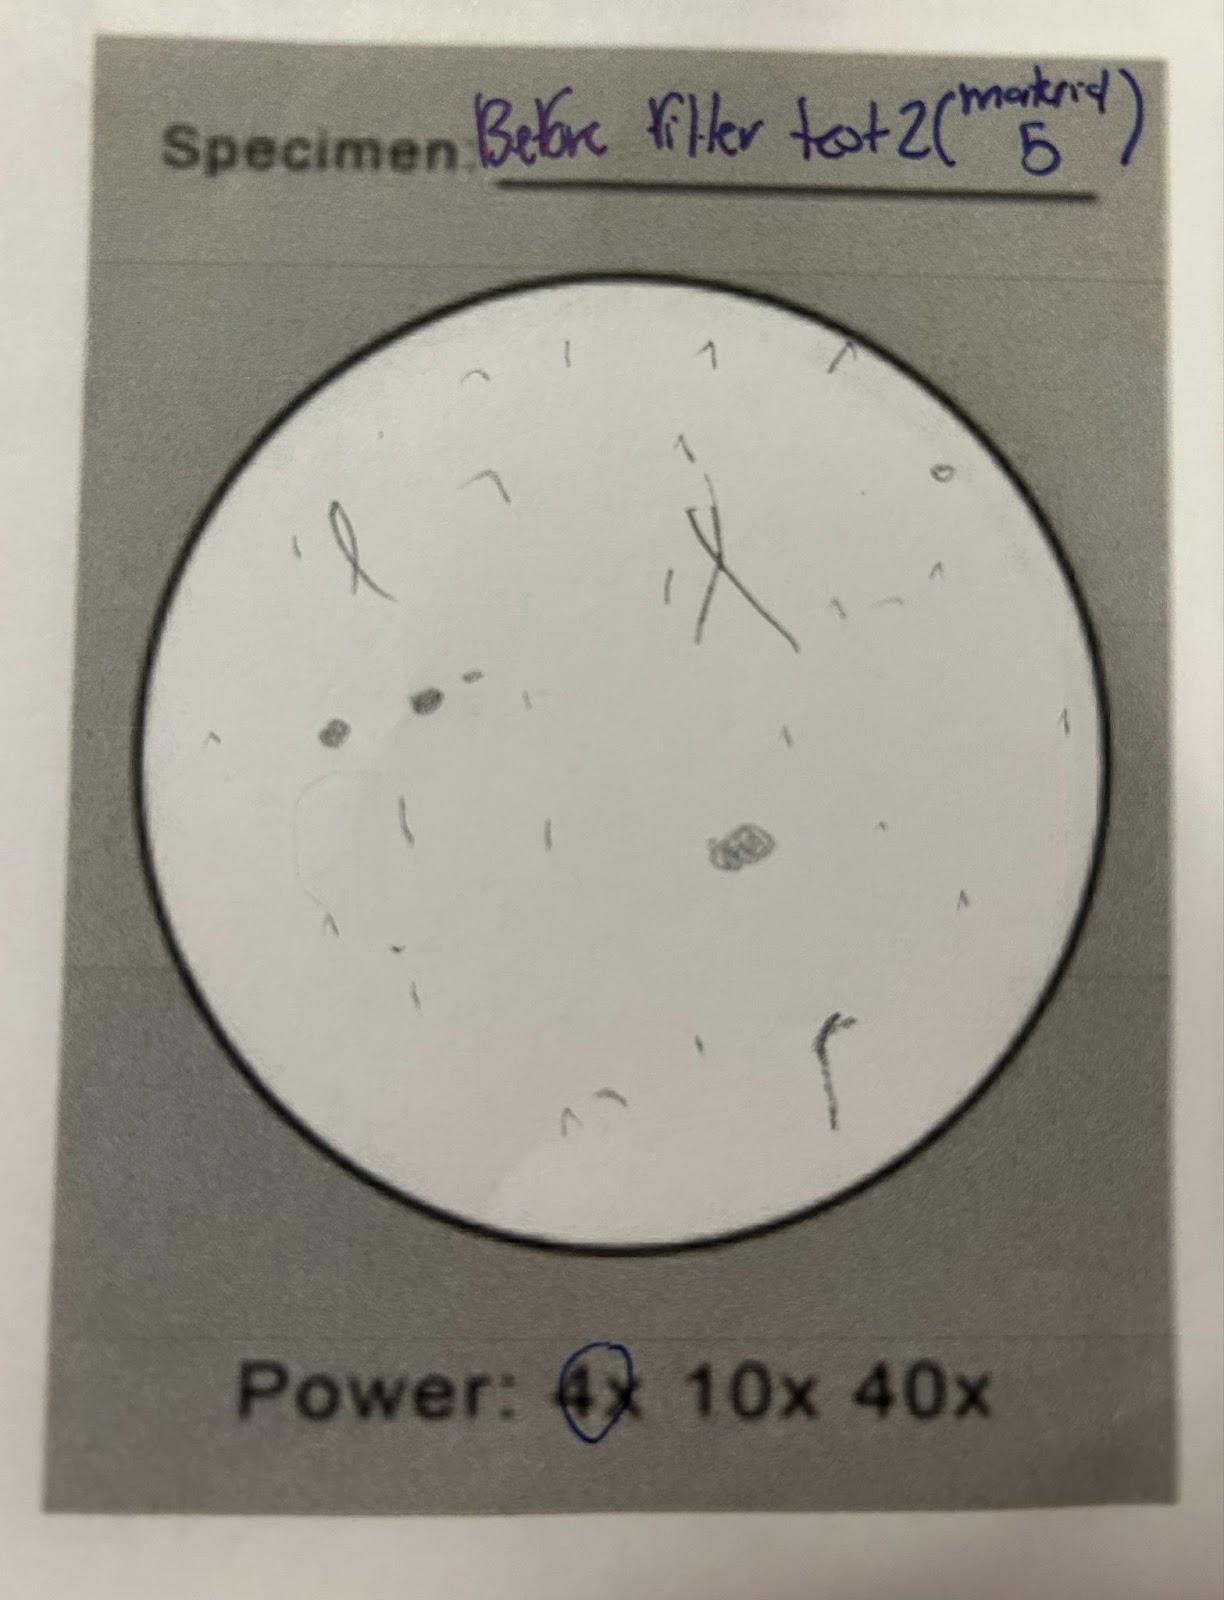
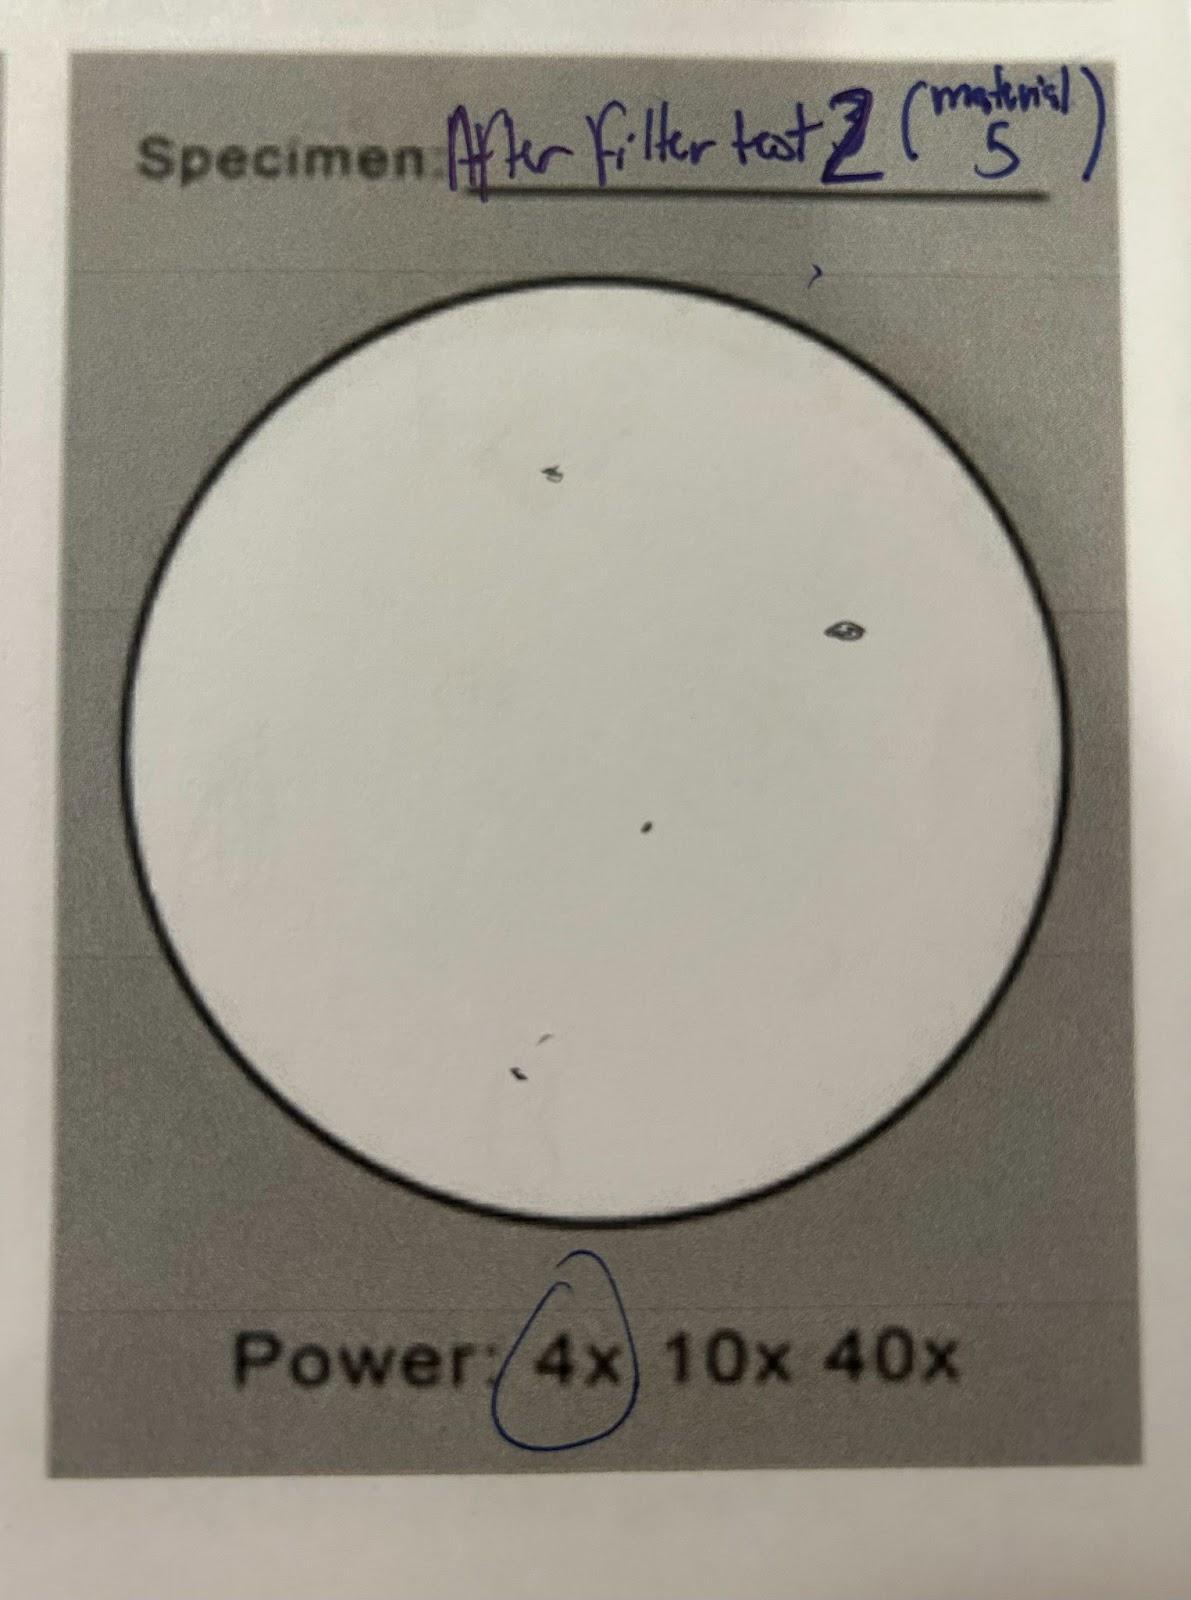
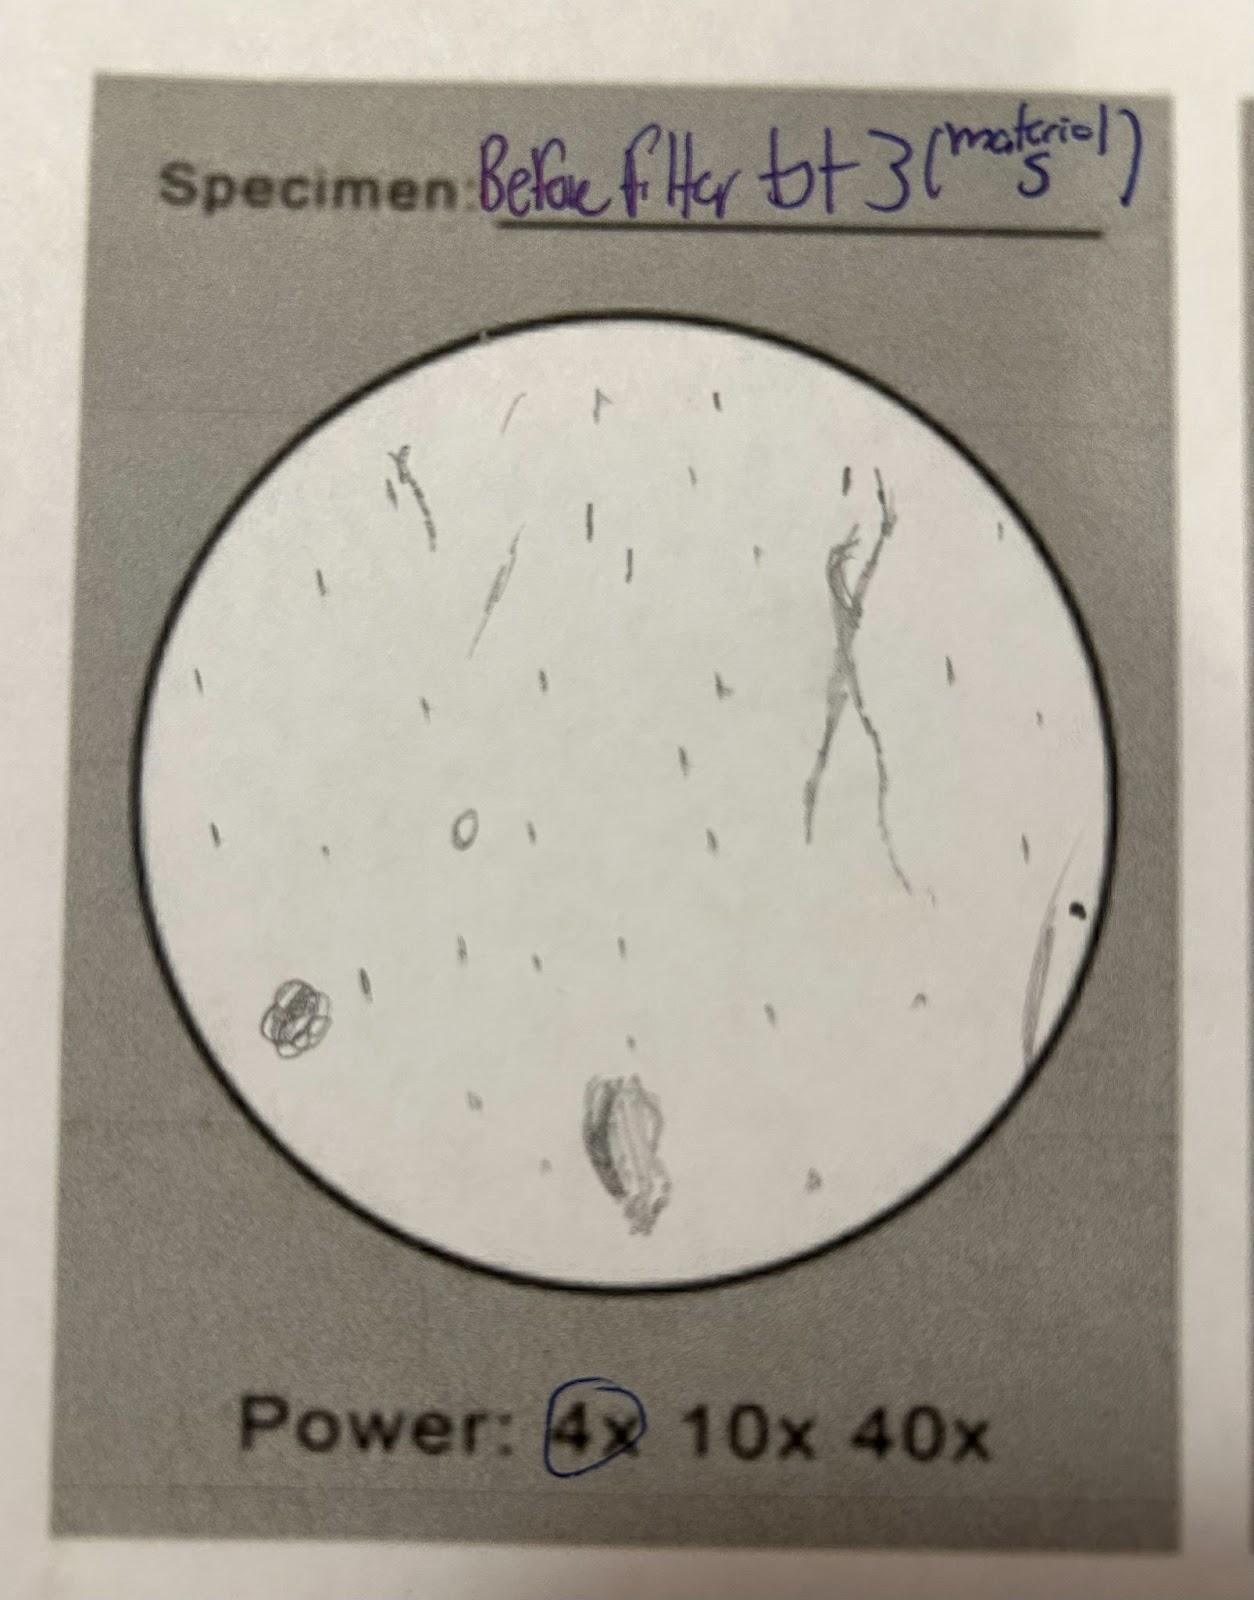
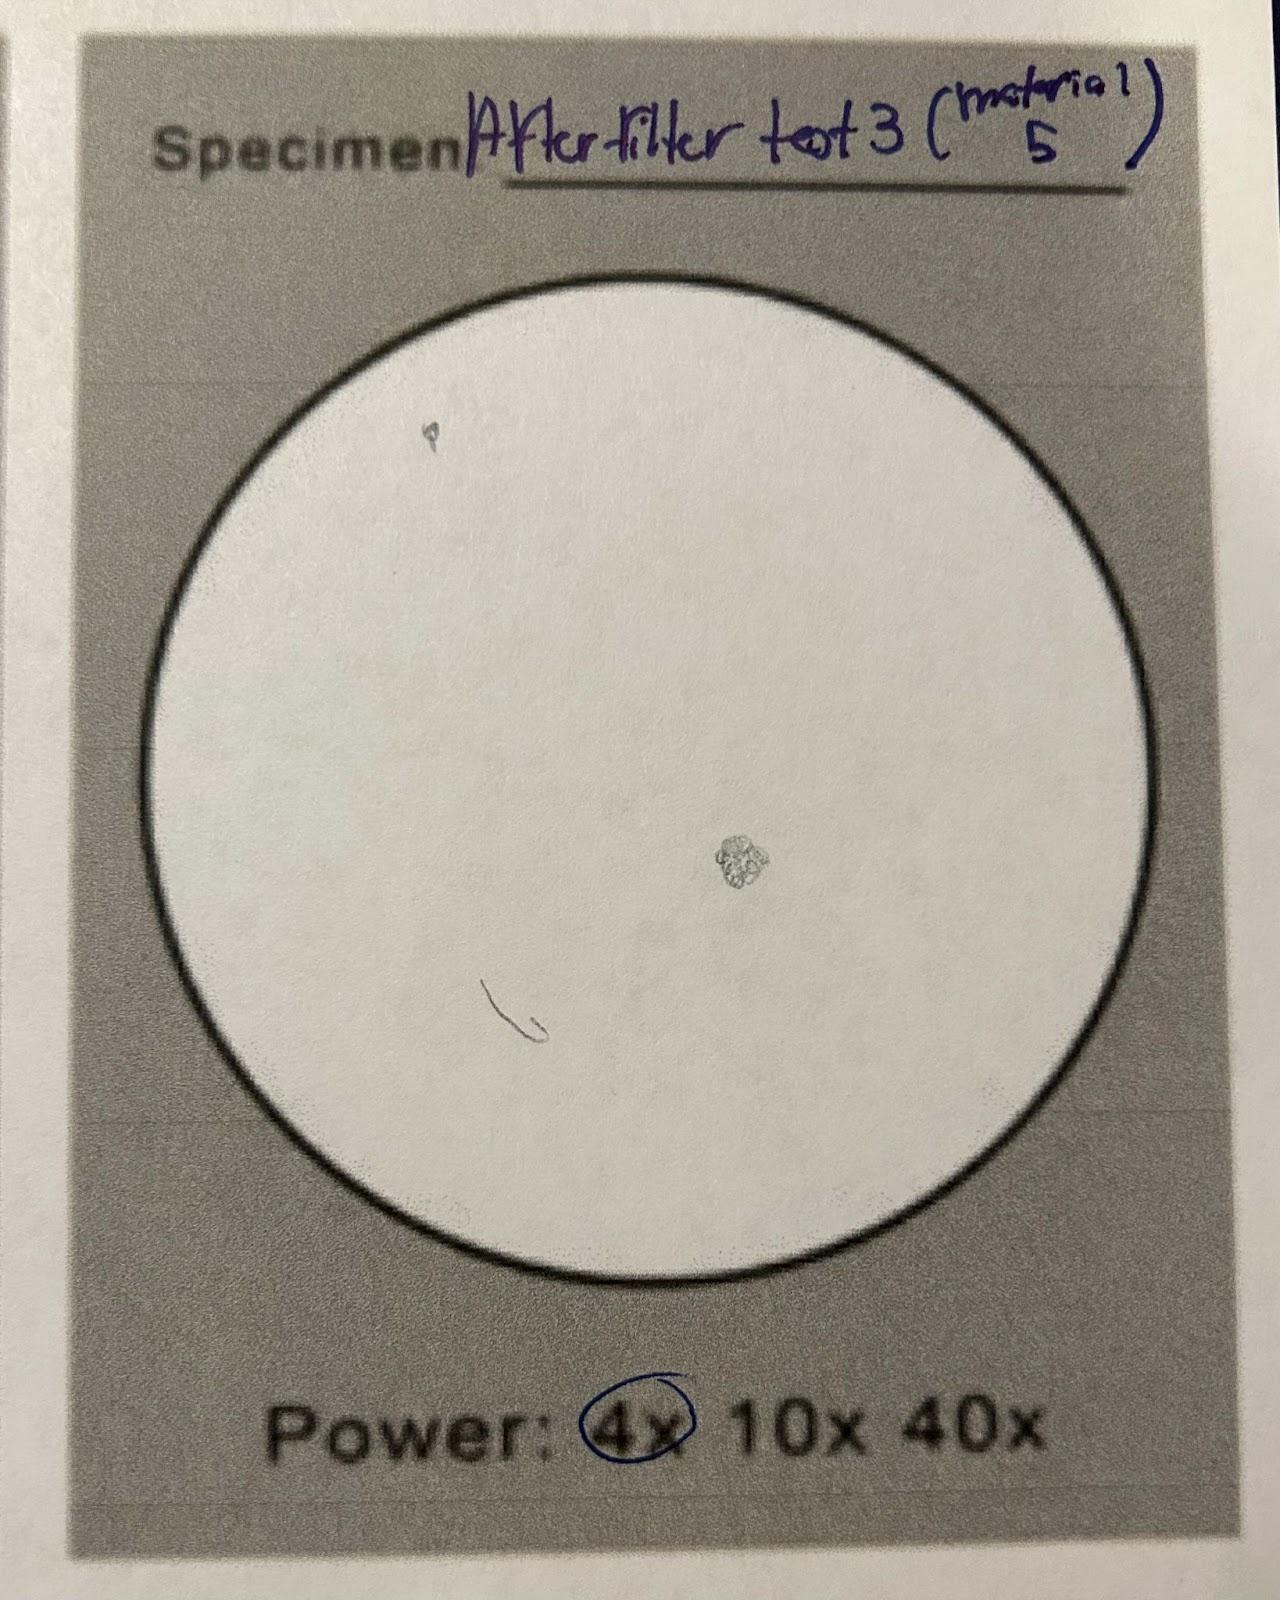
How will the results be analyzed for effectiveness? = There should be no particles in the samples except the plastics so that gives us an accurate way to determine the amount lost by counting all the particles drawn and seen in the microscopic samples (The salt is dissolved and you can't see any of the minerals that would be in water under the 4x zoom paired with our microscope eyepiece). To make sure that the filter is not leaching any particles a run of just water will occur and be samples/analyzed.
Qualitative and Quantitative results are being taken as the particle count is quantitative and the drawing of the observation sample is qualitative.
1st set of materials
1
|
Trial Number / Material Set number
|
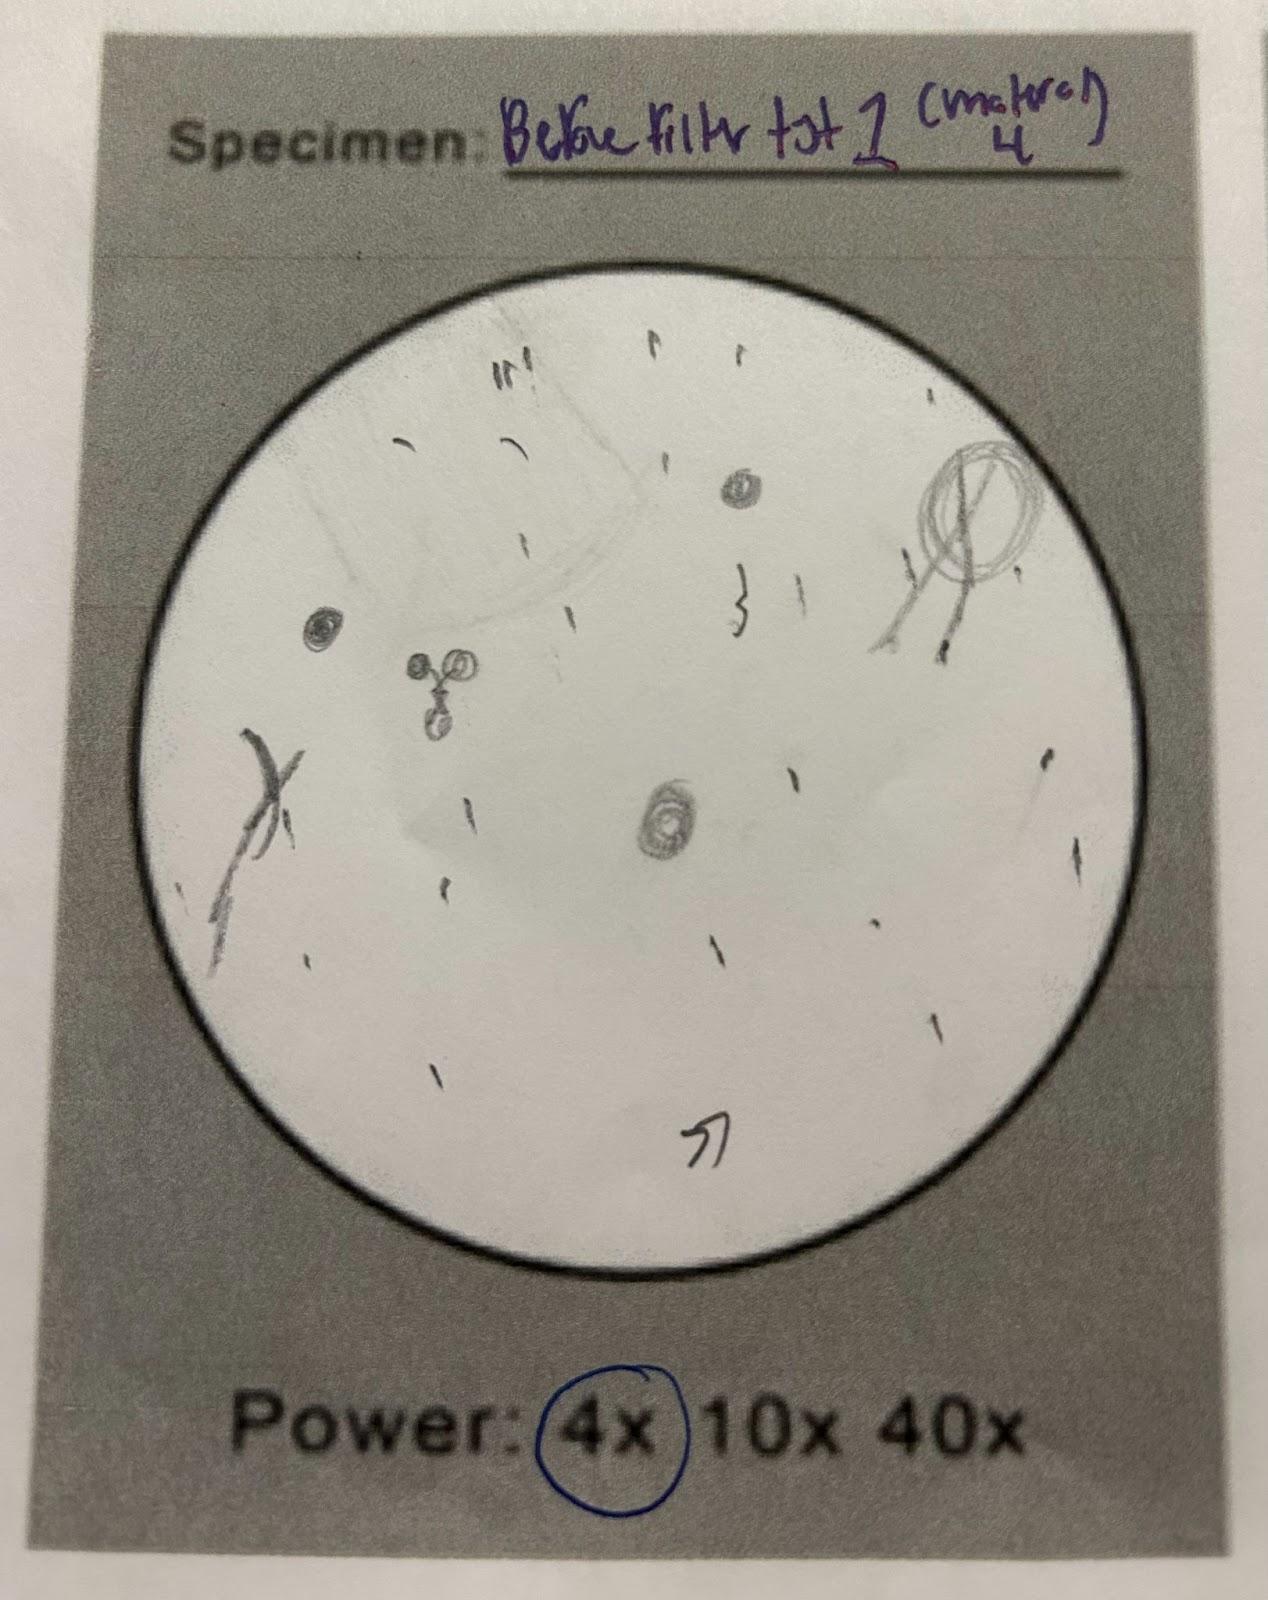
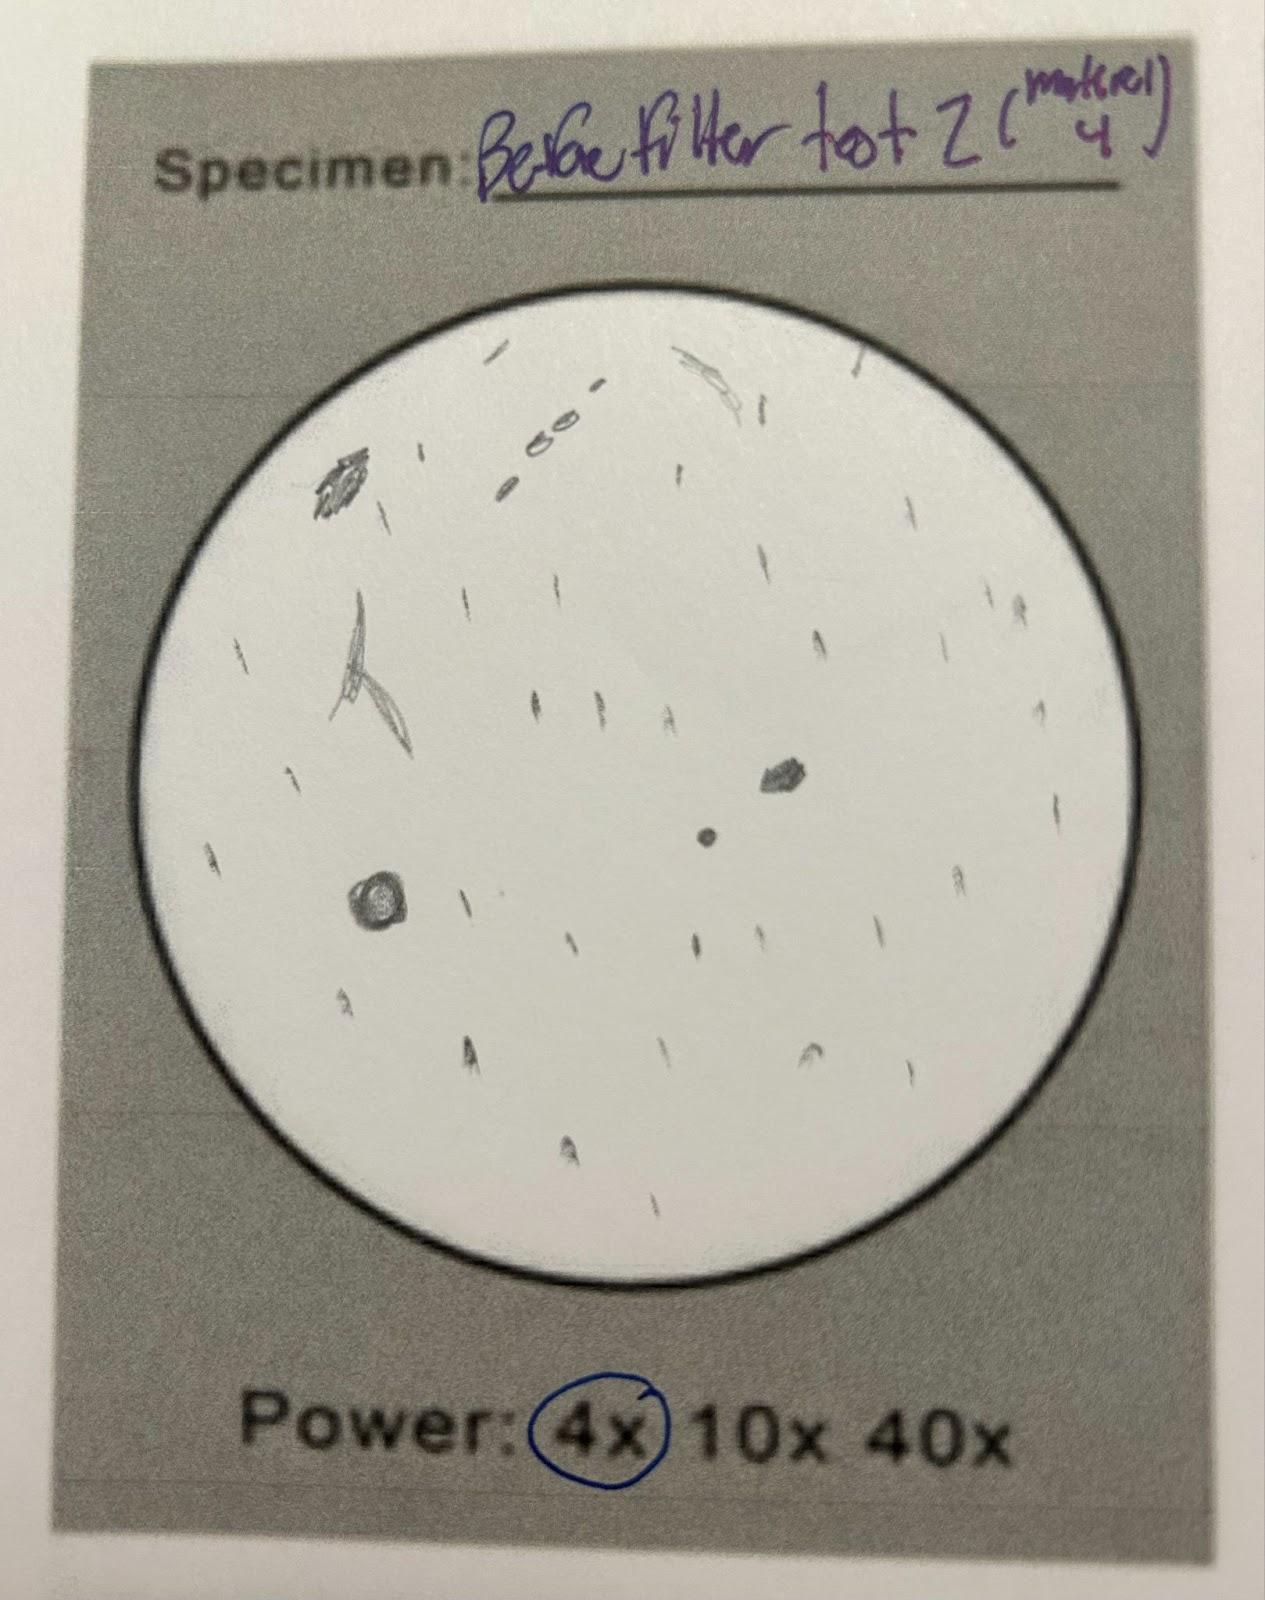
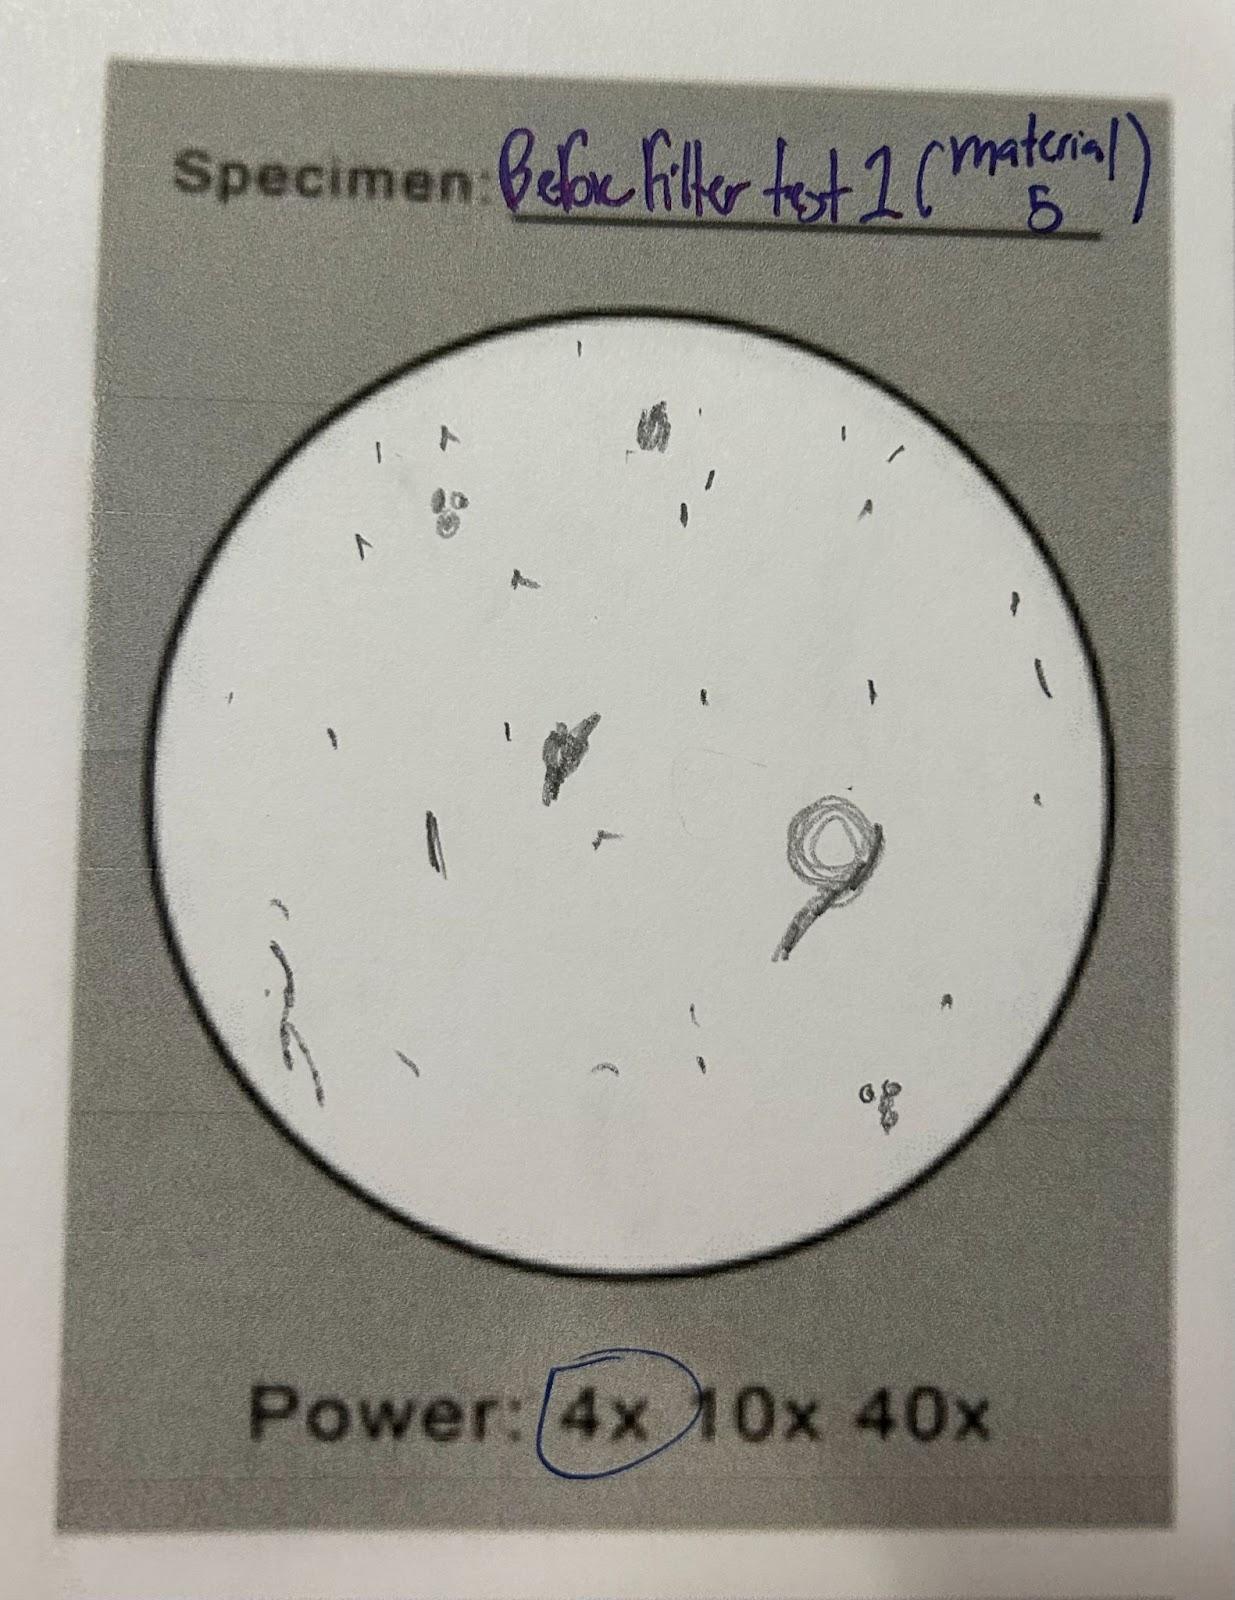
Before Drawing of Particles Under Microscope
|
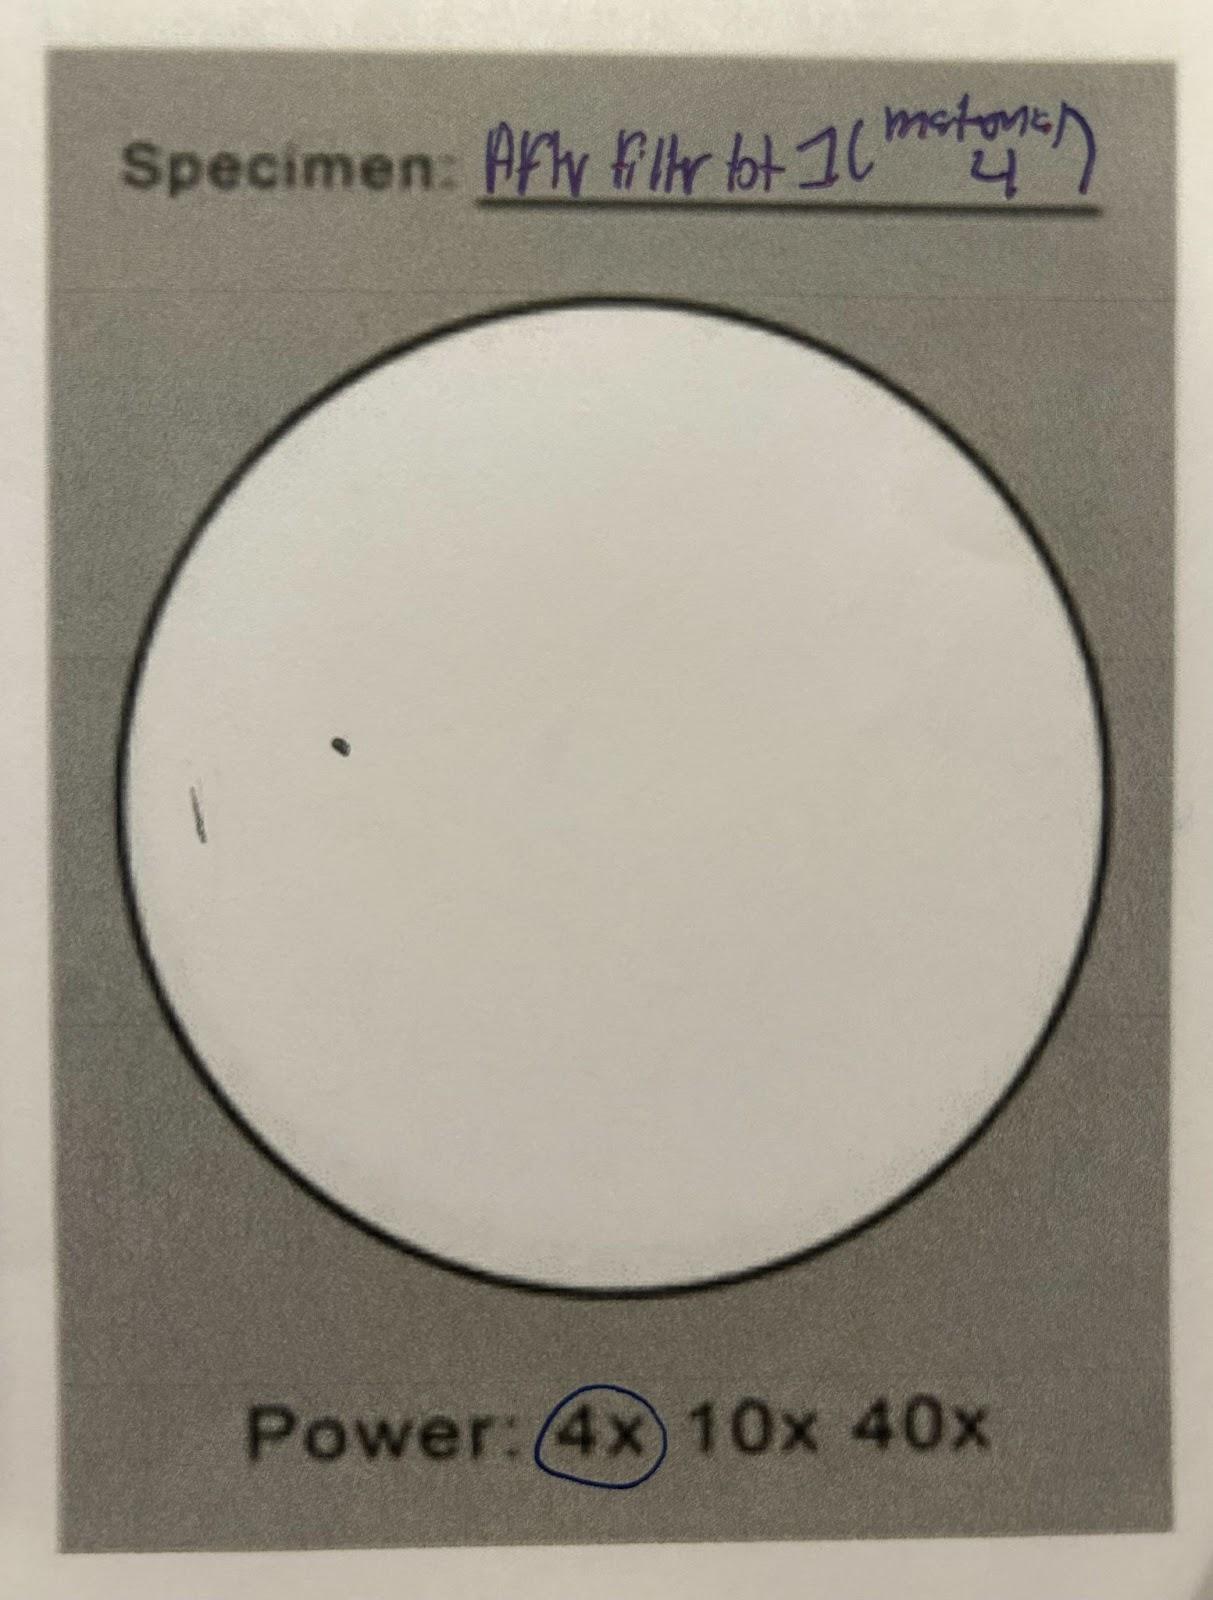
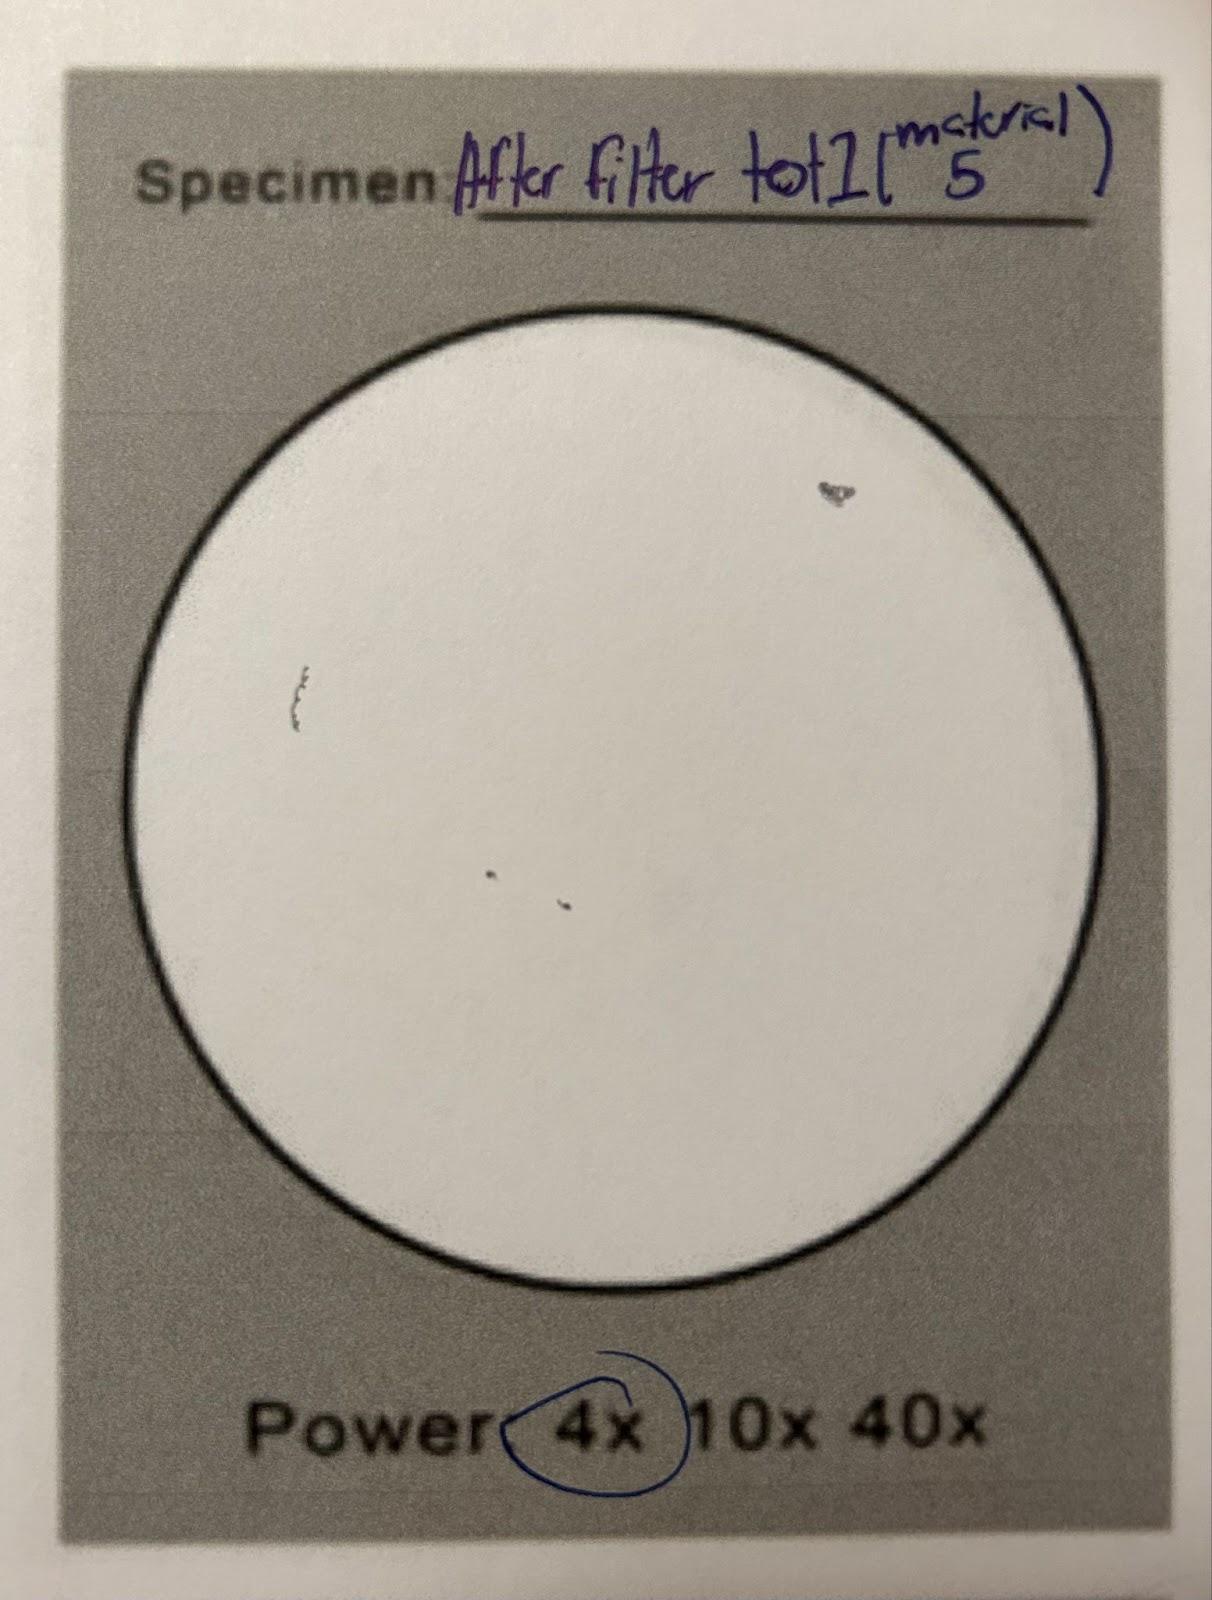
After Drawing Drawing of Particles Under Microscope
|
Approximate Count of Particles Under Microscope (Before)
|
Approximate Count of Particles Under Microscope (After)
|
Overall
|
|
Trial 1 - Material set 1
|
|
|
118
|
16
|
86.44% effectiveness
|
Water Sample (Jar ) Observations:
Before - Lots of plastics on top of sample,different colors,plastic stuck to sides of sample jar, significant amount can be seen.
After - Water slightly tinted yellow (because of moss), no particles are seen.
2
|
Trial Number / Material Set number
|
Before Drawing of Particles Under Microscope
|
After Drawing Drawing of Particles Under Microscope
|
Approximate Count of Particles Under Microscope (Before)
|
Approximate Count of Particles Under Microscope (After)
|
Overall
|
|
Trial 2 - Material set 1
|
|
|
76
|
6
|
92.11% effectiveness
|
Notes:
Water Sample (Jar ) Observations:
Before - Lots of plastics on top of sample,different colors of plastics, plastic size varies, plastic sticks to sides of sample jar, significant amount can be seen.
After - Water slightly tinted yellow (because of moss), no particles are seen.
3
|
Trial Number / Material Set number
|
Before Drawing of Particles Under Microscope
|
After Drawing Drawing of Particles Under Microscope
|
Approximate Count of Particles Under Microscope (Before)
|
Approximate Count of Particles Under Microscope (After)
|
Overall
|
|
Trial 3 - Material set 1
|
|
|
58
|
8
|
86.207% effectiveness
|
Notes:
Water Sample (Jar ) Observations:
Before - Lots of plastics on top of sample, different colors, plastic stuck to sides of sample jar, significant amount can be seen.
After - Water slightly tinted yellow ( because of moss), no particles are seen.
Material after use observations: -
1st layer (sediment)
2nd layer (carbon and moss)
3rd layer (sponges and filtration pillars)
2nd set of materials - replaced
1
|
Trial Number / Material Set number
|
Before Drawing of Particles Under Microscope
|
After Drawing Drawing of Particles Under Microscope
|
Approximate Count of Particles Under Microscope (Before)
|
Approximate Count of Particles Under Microscope (After)
|
Overall
|
|
Trial 1 - Material set 1
|
|
|
49
|
7
|
85.71% effectiveness
|
Notes:
Water Sample (Jar) Observations:
Before - Lots of plastics on top of sample, different colors, plastic stuck to sides of sample jar, significant amount can be seen.
After - Water slightly tinted yellow (because of moss), no particles are seen.
2
|
Trial Number / Material Set number
|
Before Drawing of Particles Under Microscope
|
After Drawing Drawing of Particles Under Microscope
|
Approximate Count of Particles Under Microscope (Before)
|
Approximate Count of Particles Under Microscope (After)
|
Overall
|
|
Trial 2 - Material set 2
|
|
|
43
|
3
|
93.023% effectiveness
|
Notes:
Water Sample (Jar ) Observations:
Before - Lots of plastics on top of sample,different colors,plastic stuck to sides of sample jar,significant amount can be seen.
After - Water slightly tinted yellow (because of moss), no particles are seen.
3
|
Trial Number / Material Set number
|
Before Drawing of Particles Under Microscope
|
After Drawing Drawing of Particles Under Microscope
|
Approximate Count of Particles Under Microscope (Before)
|
Approximate Count of Particles Under Microscope (After)
|
Overall
|
|
Trial 3 - Material set 2
|
|
|
71
|
4
|
94.37% effectiveness
|
Notes:
Water Sample (Jar ) Observations:
Before - Lots of plastics on top of sample,different colors,plastic stuck to sides of sample jar,significant amount can be seen.
After - Water slightly tinted yellow (because of moss), no particles are seen.
Material after use observations: -
1st layer ( sediment )
2nd layer (carbon and moss)
3rd layer (sponges and filtration pillars)
3rd set of materials - replaced
1
|
Trial Number / Material Set number
|
Before Drawing of Particles Under Microscope
|
After Drawing Drawing of Particles Under Microscope
|
Approximate Count of Particles Under Microscope (Before)
|
Approximate Count of Particles Under Microscope (After)
|
Overall
|
|
Trial number 1 Material set 3
|
|
|
45
|
5
|
88.889% effectiveness
|
Notes:
Water Sample (Jar) Observations:
Before - Lots of plastics on top of sample,different colors,plastic stuck to sides of sample jar,significant amount can be seen.
After - Water slightly tinted yellow (because of moss), no particles are seen.
2
|
Trial Number / Material Set number
|
Before Drawing of Particles Under Microscope
|
After Drawing Drawing of Particles Under Microscope
|
Approximate Count of Particles Under Microscope (Before)
|
Approximate Count of Particles Under Microscope (After)
|
Overall
|
|
Trial number 2 Material set 3
|
|
|
48
|
5
|
89.583% effectiveness
|
Notes:
Water Sample (Jar ) Observations:
Before - Lots of plastics on top of sample, different colors, plastic stuck to sides of sample jar, significant amount can be seen.
After - Water slightly tinted yellow (because of moss), no particles are seen.
3
|
Trial Number / Material Set number
|
Before Drawing of Particles Under Microscope
|
After Drawing Drawing of Particles Under Microscope
|
Approximate Count of Particles Under Microscope (Before)
|
Approximate Count of Particles Under Microscope (After)
|
Overall
|
|
Trial number 3 - Material set 3
|
|
|
36
|
5
|
86.111% effectiveness
|
Notes:
Material after use observations: -
1st layer (sediment)
2nd layer (carbon and moss)
3rd layer (sponges and filtration pillars)
4th set of materials - replaced
1
|
Trial Number / Material Set number
|
Before Drawing of Particles Under Microscope
|
After Drawing Drawing of Particles Under Microscope
|
Approximate Count of Particles Under Microscope (Before)
|
Approximate Count of Particles Under Microscope (After)
|
Overall
|
|
Trial 1
Material set 4
|
|
|
45
|
2
|
95.556% effectiveness
|
Notes:
Water Sample (Jar ) Observations:
Before - Lots of plastics on top of sample, different colors, plastic stuck to sides of sample jar,significant amount can be seen.
After - Water slightly tinted yellow (because of moss), no particles are seen.
2
|
Trial Number / Material Set number
|
Before Drawing of Particles Under Microscope
|
After Drawing Drawing of Particles Under Microscope
|
Approximate Count of Particles Under Microscope (Before)
|
Approximate Count of Particles Under Microscope (After)
|
Overall
|
|
Trial 2
Material set 4
|
|
|
52
|
1
|
98.077% effectiveness
|
Notes:
Water Sample (Jar ) Observations:
Before - Lots of plastics on top of sample,different colors,plastic stuck to sides of sample jar,significant amount can be seen.
After - Water slightly tinted yellow (because of moss), no particles are seen.
3
|
Trial Number / Material Set number
|
Before Drawing of Particles Under Microscope
|
After Drawing Drawing of Particles Under Microscope
|
Approximate Count of Particles Under Microscope (Before)
|
Approximate Count of Particles Under Microscope (After)
|
Overall
|
|
Trial 3
Material set 4
|
|
|
66
|
3
|
95.45% effectiveness
|
Notes:
Water Sample (Jar ) Observations:
Before - Lots of plastics on top of sample,different colors,plastic stuck to sides of sample jar,significant amount can be seen.
After - Water slightly tinted yellow (because of moss), no particles are seen.
Material after use observations: -
1st layer ( sediment )
2nd layer (carbon and moss)
3rd layer (sponges and filtration pillars)
5th set of materials
1
|
Trial Number / Material Set number
|
Before Drawing of Particles Under Microscope
|
After Drawing Drawing of Particles Under Microscope
|
Approximate Count of Particles Under Microscope (Before)
|
Approximate Count of Particles Under Microscope (After)
|
Overall
|
|
Trial 1
Material set 5
|
|
|
49
|
4
|
91.84% effectiveness
|
Notes:
Water Sample (Jar) Observations:
Before - Lots of plastics on top of sample, different colors, plastic stuck to sides of sample jar,significant amount can be seen.
After - Water slightly tinted yellow (because of moss), no particles are seen.
2
|
Trial Number / Material Set number
|
Before Drawing of Particles Under Microscope
|
After Drawing Drawing of Particles Under Microscope
|
Approximate Count of Particles Under Microscope (Before)
|
Approximate Count of Particles Under Microscope (After)
|
Overall
|
|
Trial 2
Material set 5
|
|
|
39
|
5
|
87.179% effectiveness
|
Notes:
Water Sample (Jar) Observations:
Before - Lots of plastics on top of sample,different colors,plastic stuck to sides of sample jar,significant amount can be seen.
After - Water slightly tinted yellow (because of moss), no particles are seen.
3
|
Trial Number / Material Set number
|
Before Drawing of Particles Under Microscope
|
After Drawing Drawing of Particles Under Microscope
|
Approximate Count of Particles Under Microscope (Before)
|
Approximate Count of Particles Under Microscope (After)
|
Overall
|
|
Trial 2
Material set 5
|
|
|
44
|
3
|
93.182% efficiency
|
Notes:
Water Sample (Jar ) Observations:
Before - Lots of plastics on top of sample,different colors,plastic stuck to sides of sample jar,significant amount can be seen.
After - Water slightly tinted yellow (because of moss), no particles are seen.
No pictures were taken after as they will be shown in the in person science fair at the olympic oval to the judges to observe.
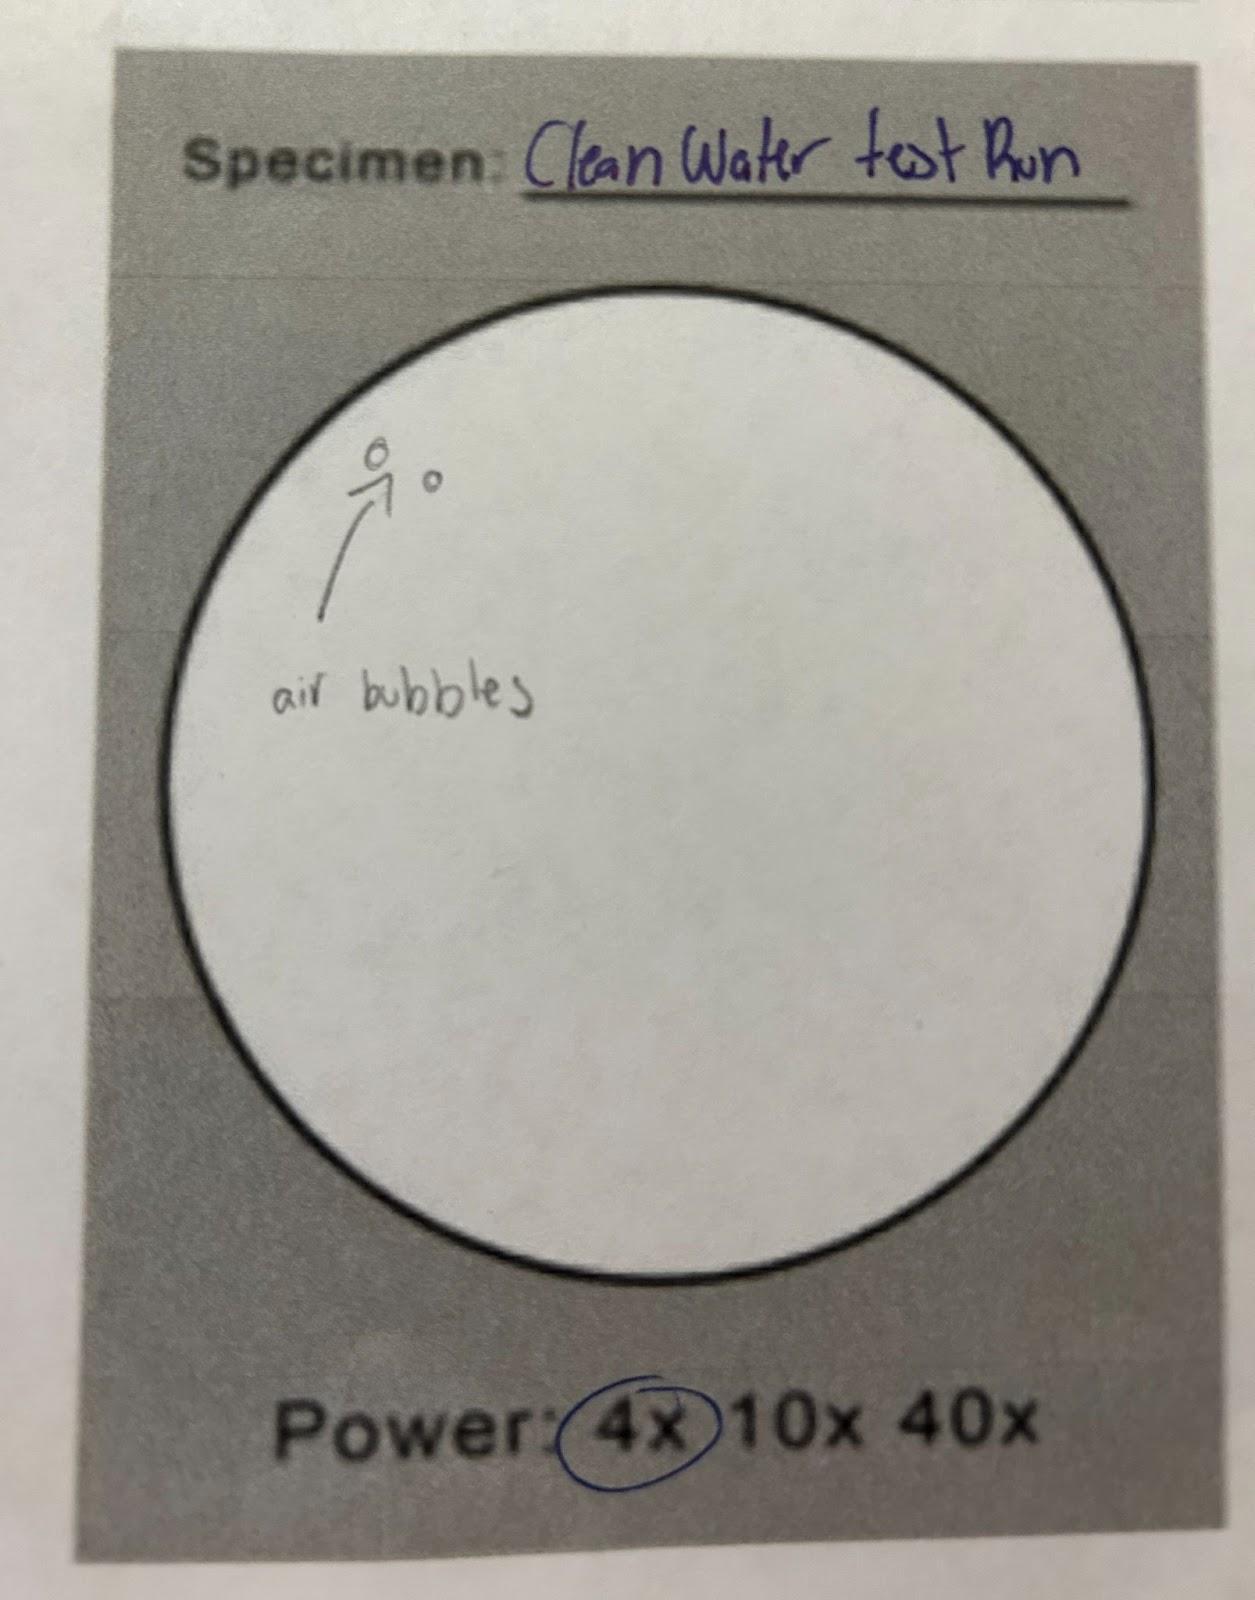
Clear Water Trial
|
Clear Water Trial
|
After Drawing Drawing of Particles Under Microscope
|
Overall
|
|
Clear Water Trial
|
|
No particles were added which means all counts of the samples beforehand were accurate.
(To make sure I took a couple samples and since none showed particles I drew one).
|
Notes
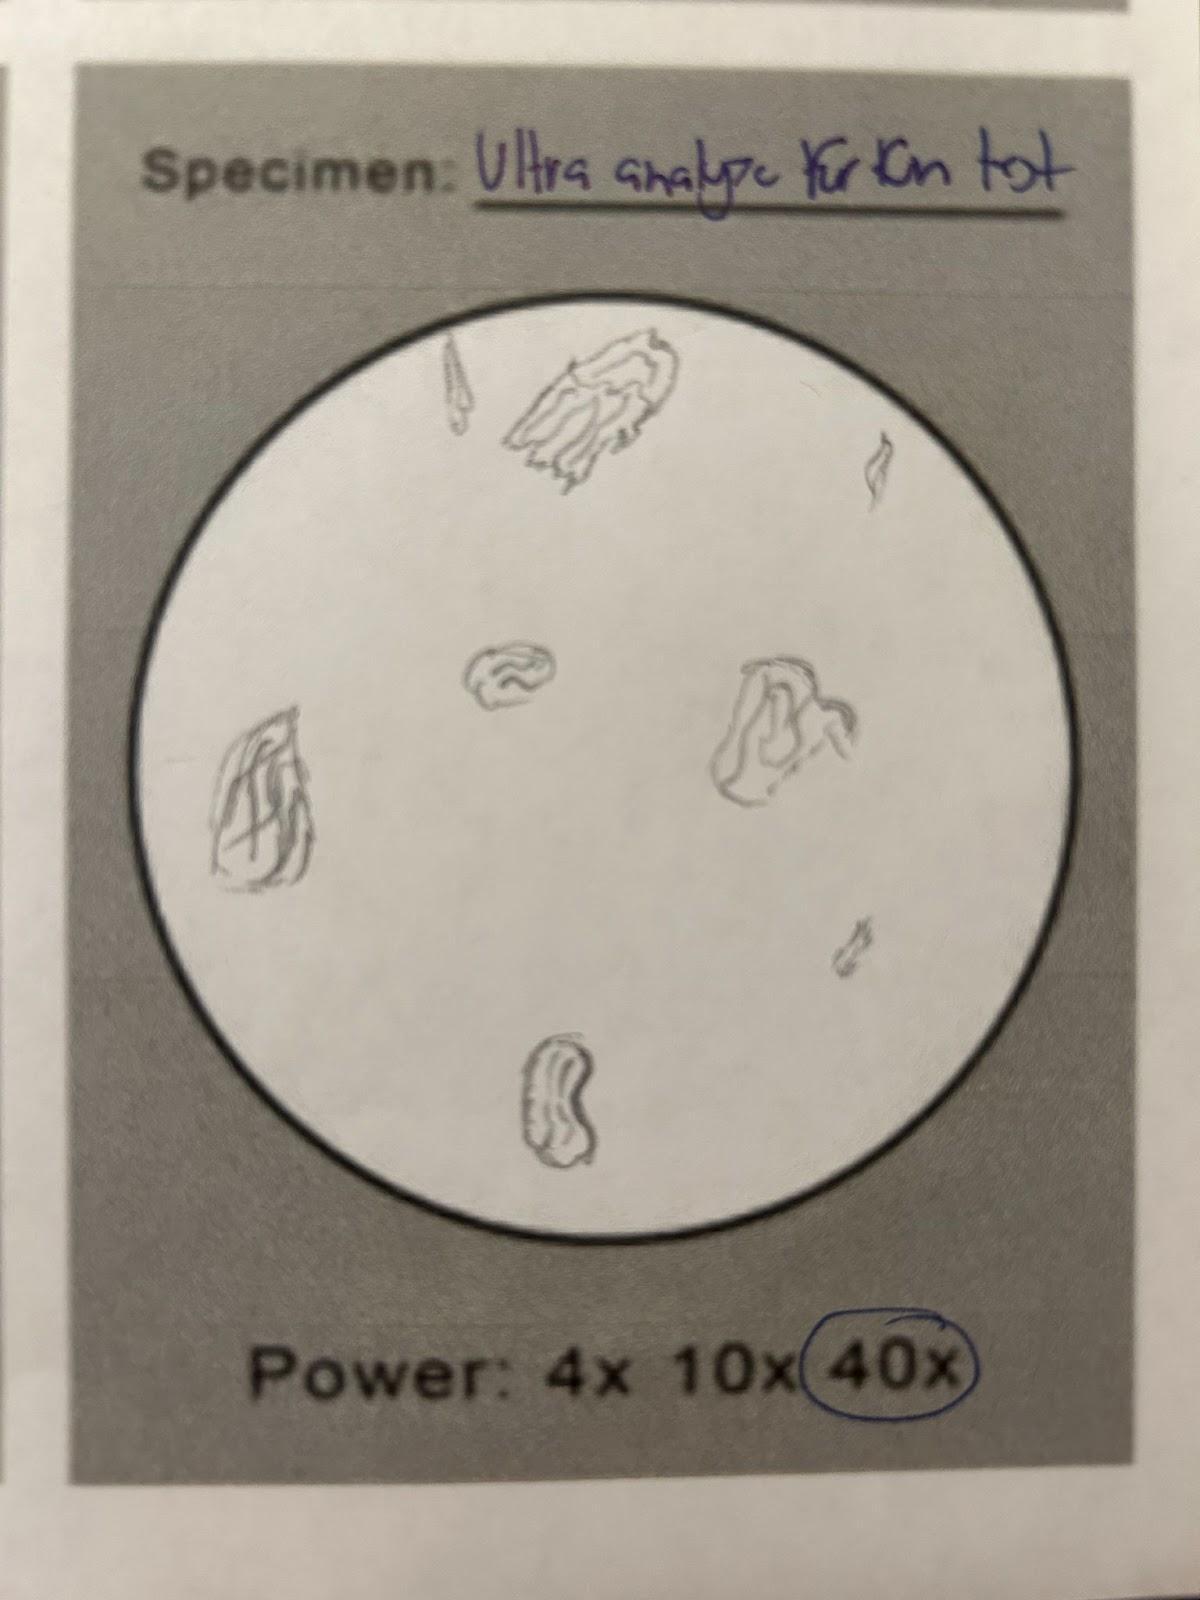
400X Zoom trial for fun
|
400X Zoom trial for fun
|
Drawing Drawing of Particles Under Microscope
|
Thoughts
|
|
400X Zoom trial for fun
|
|
Plastics that might not have been seen in the 4x zoom may be visible. More details on the plastics.
|
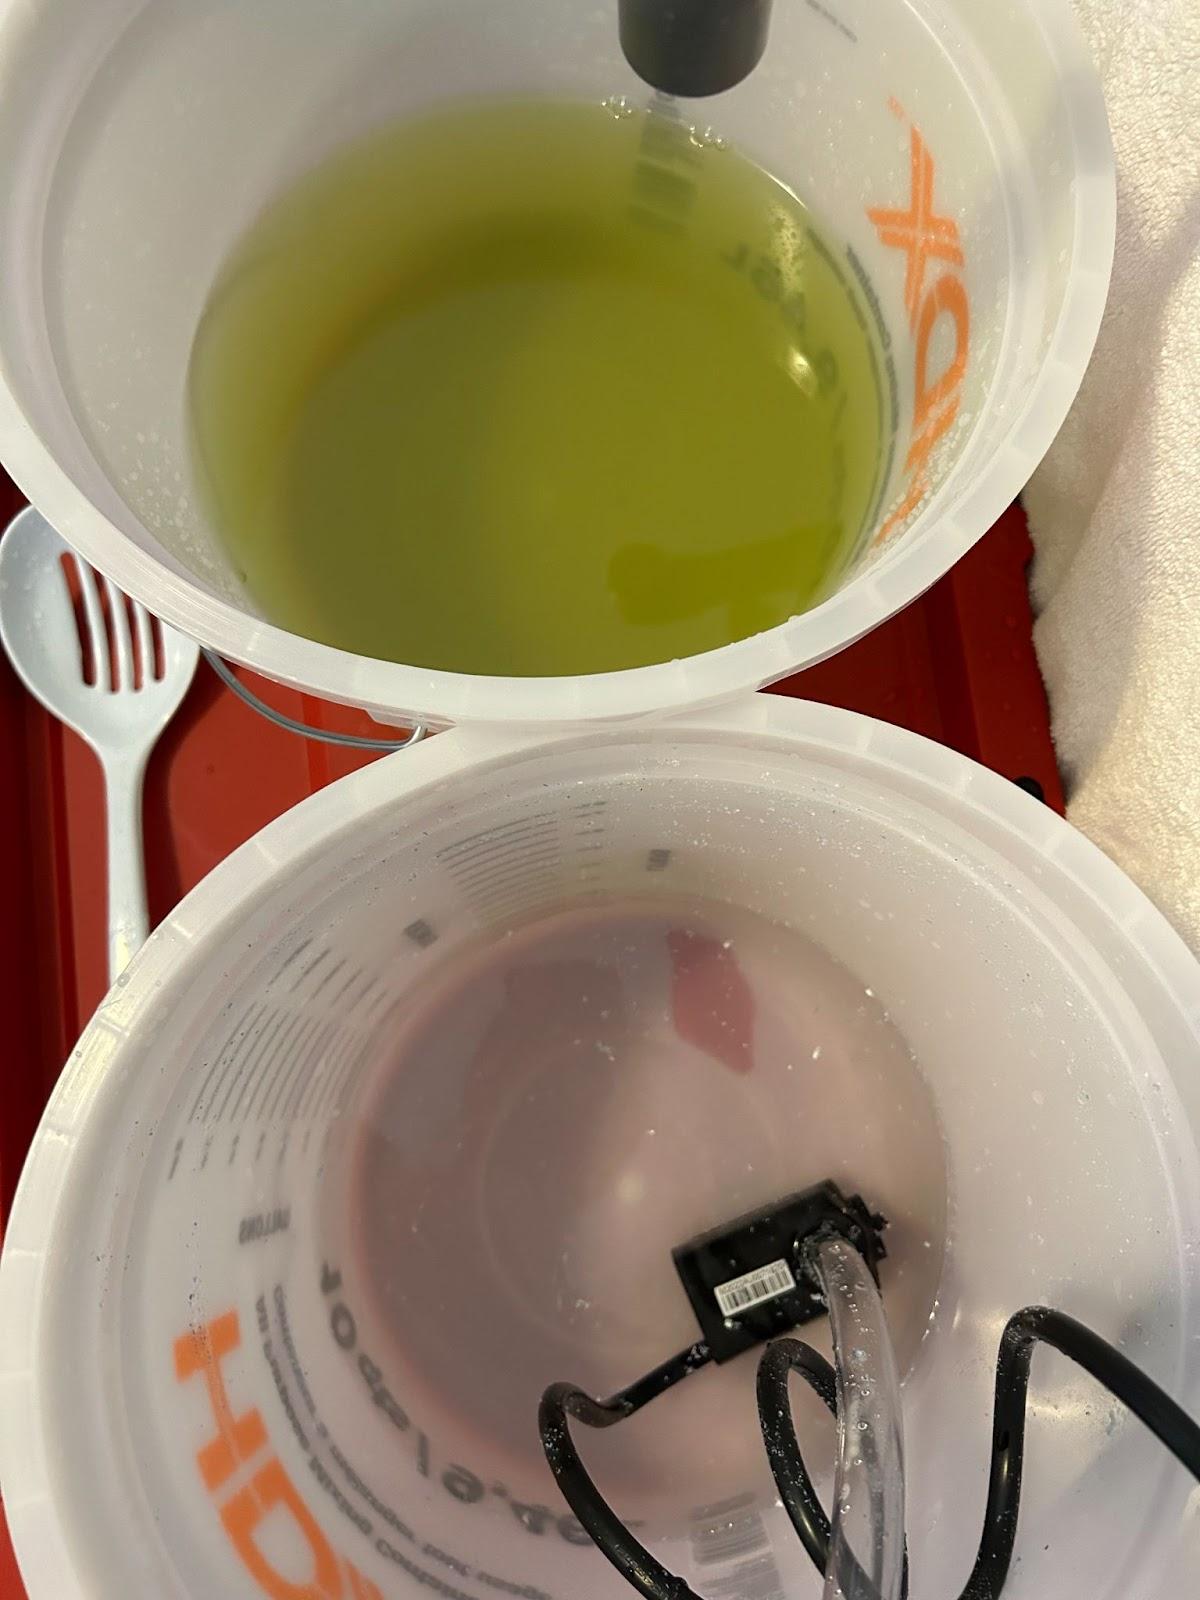
Before and after filtration input and output water buckets
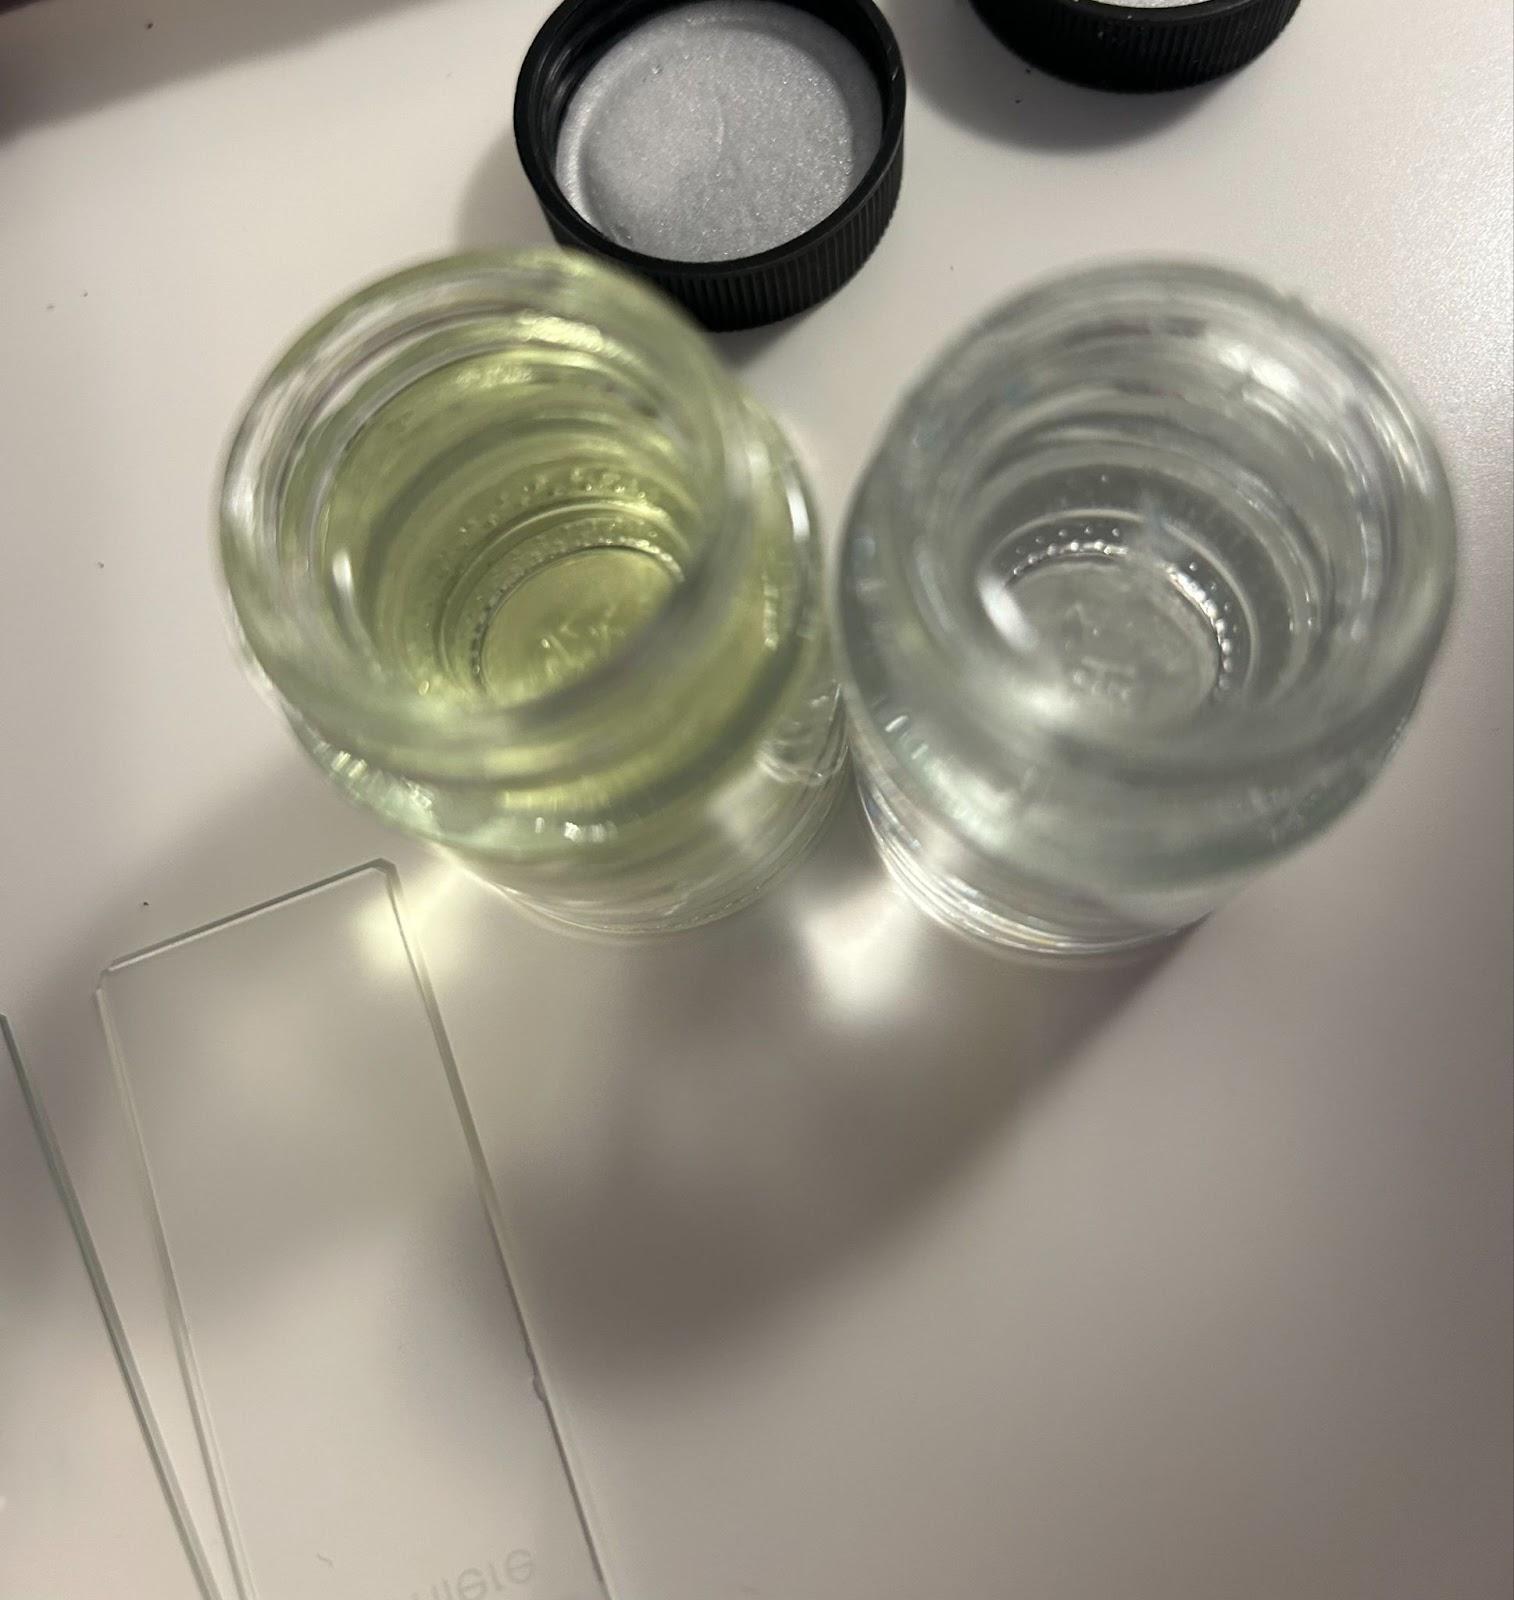
Before and after sample jars
( the yellow one of after )
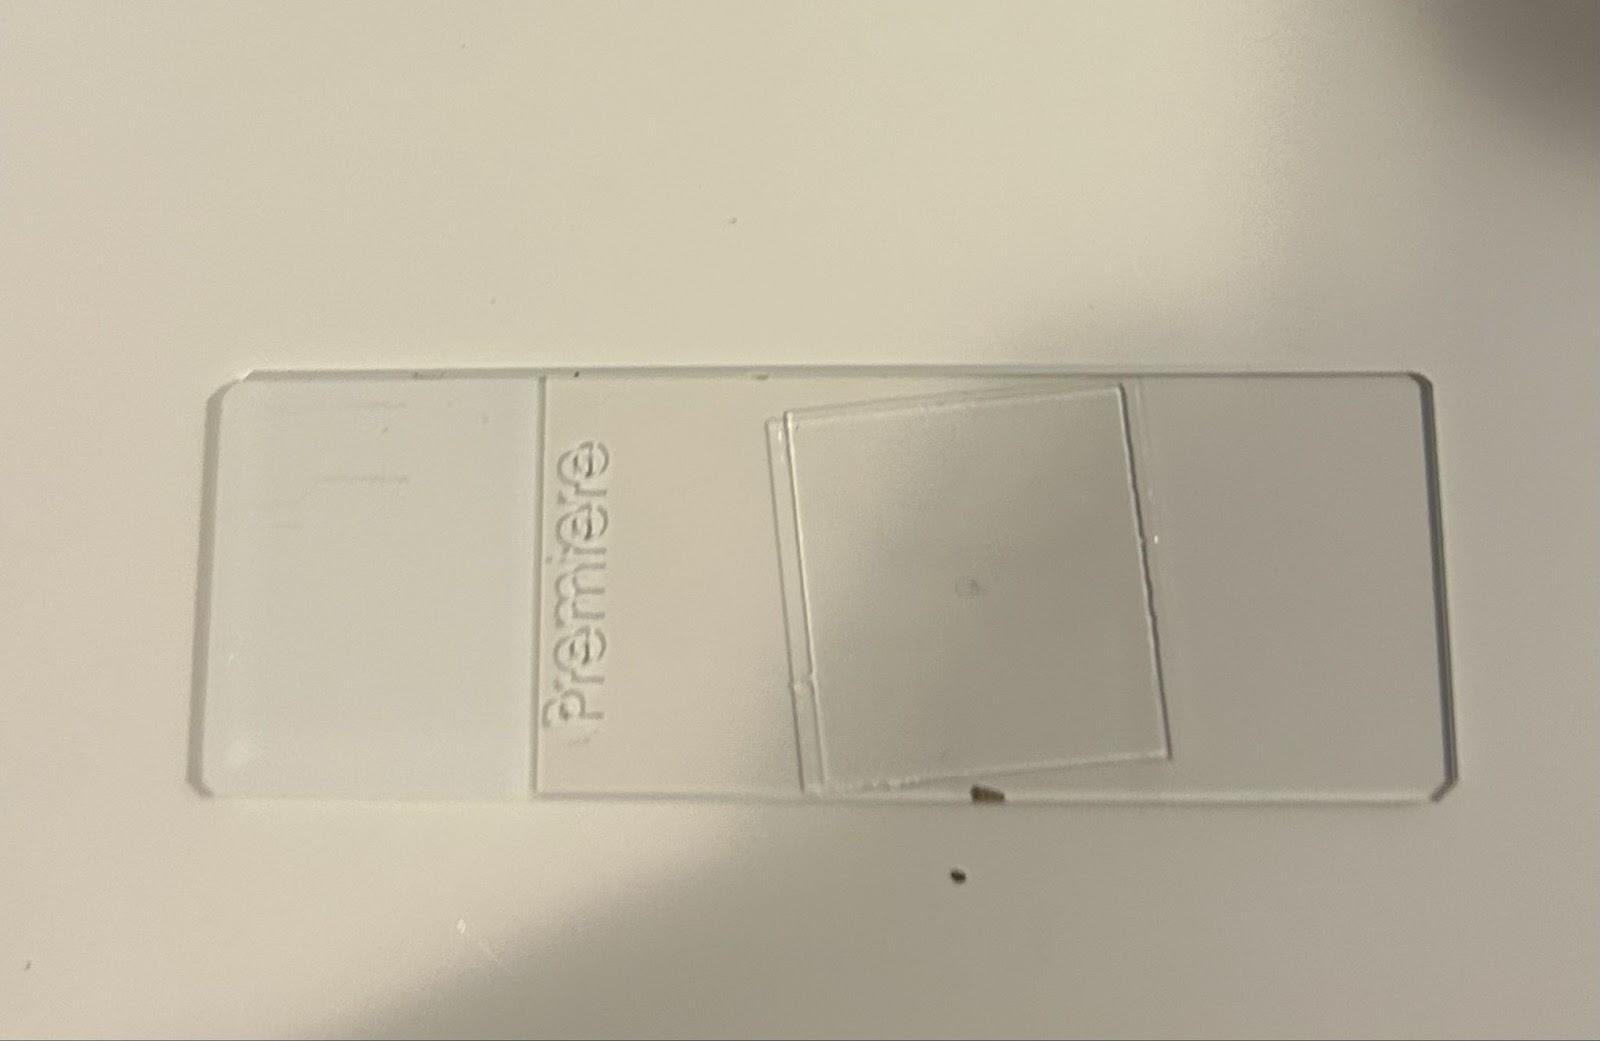
Before filter slide
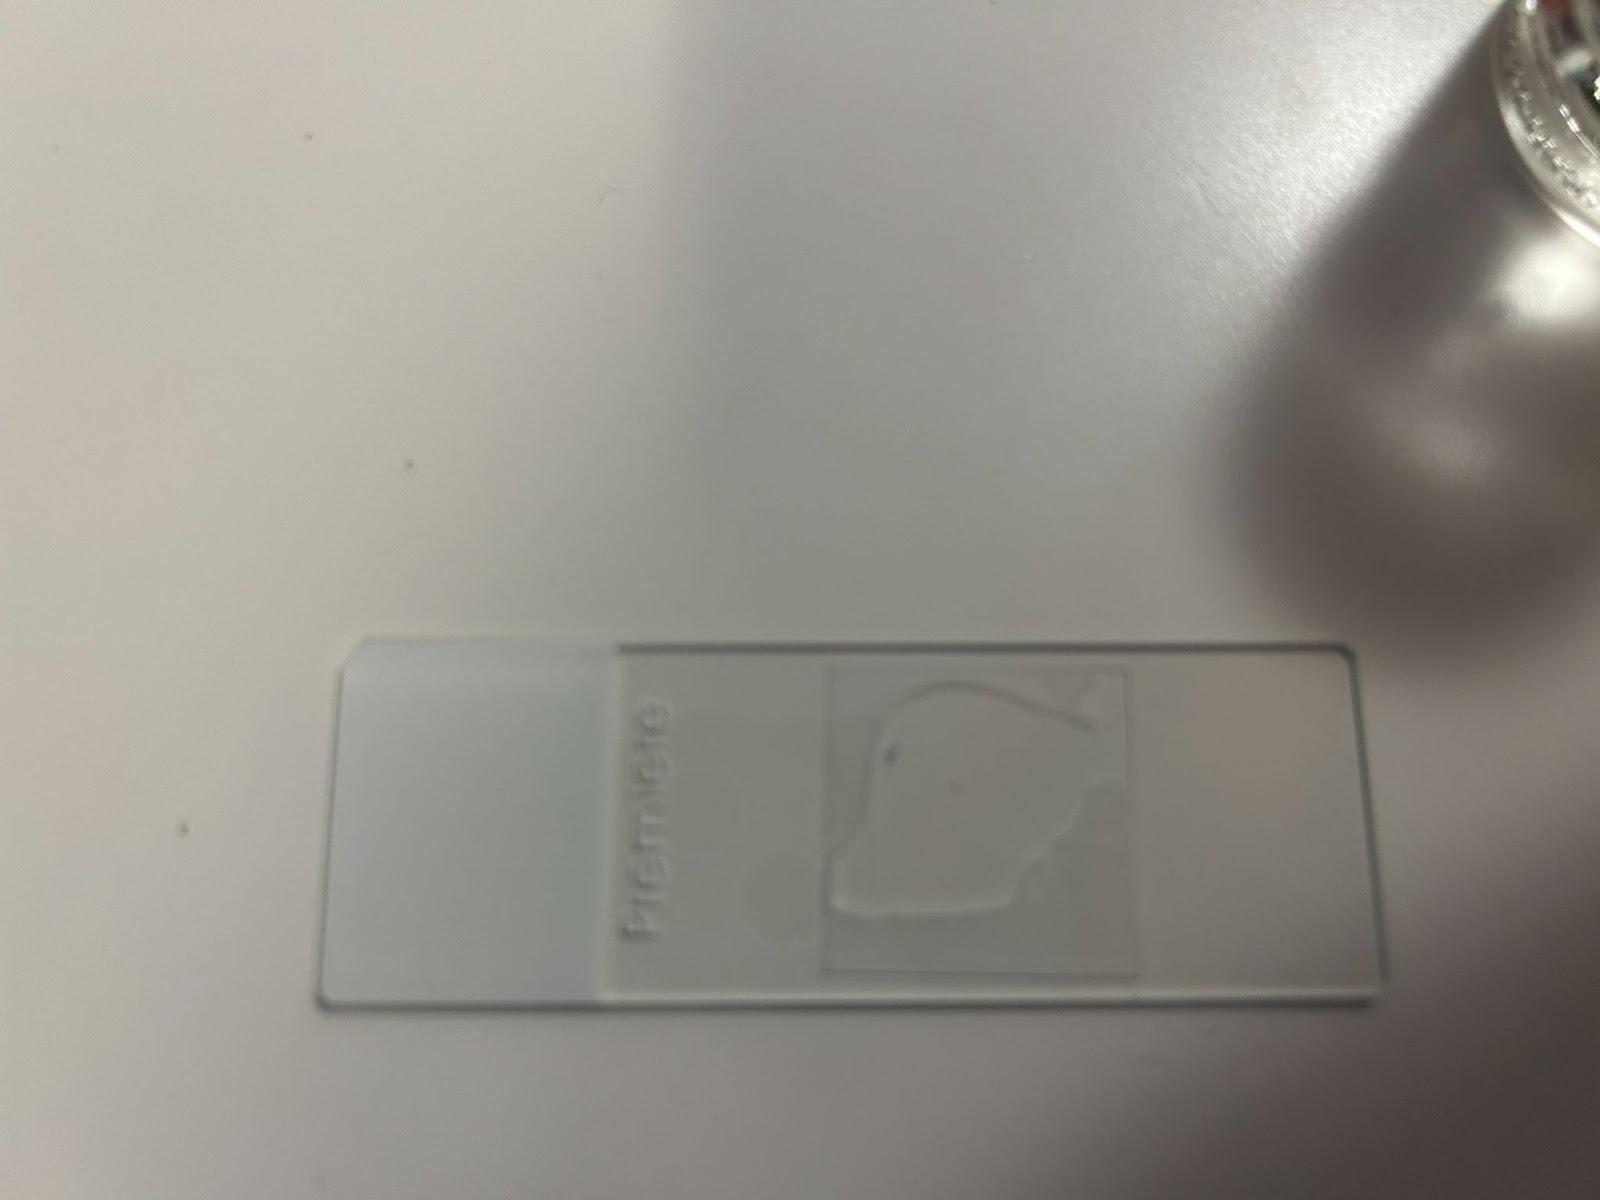
After filter slide
Sources of Error:
1) Since the moss was not real (it would collapse) and we got it from the store Micheal’s so it was colored and some of the dye leached into the output water. In the future, I will have to order organic or non-dyed moss to ensure that no leakage is caused.
2) Some of the microplastics stick to the water pump which might have caused a slight inaccurate reading in the output water.
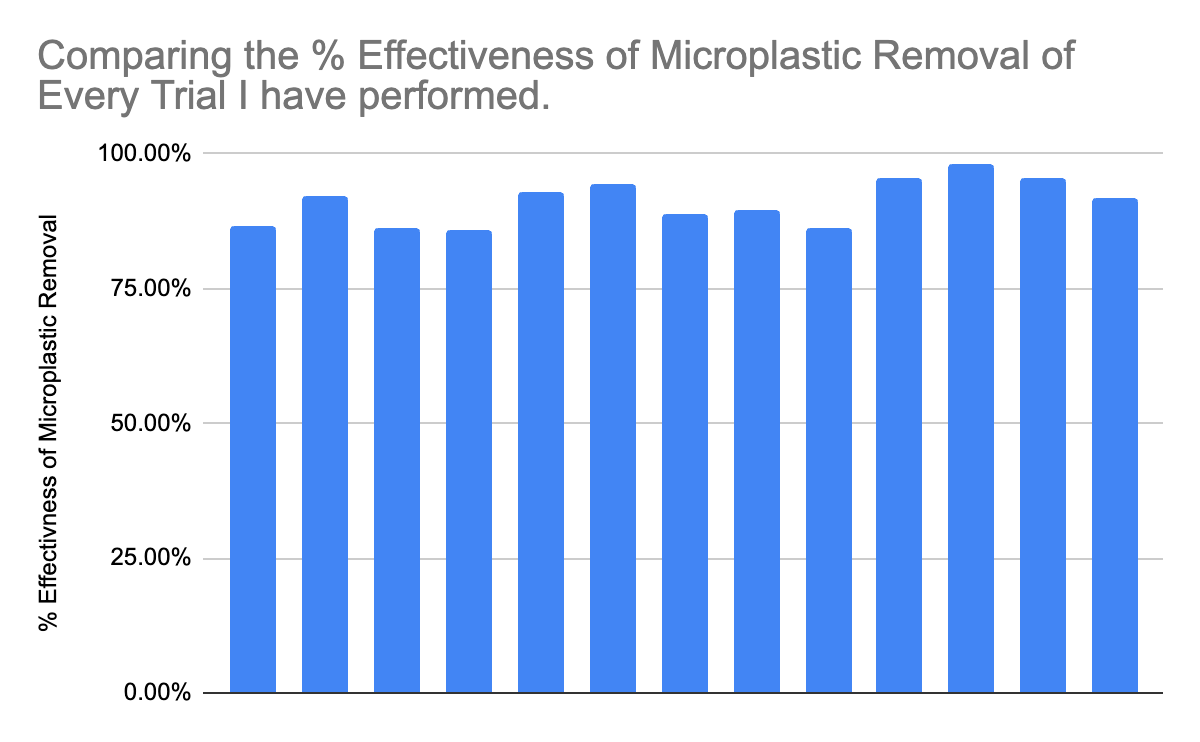
Graph:
Conclusion
Test 1 Overall effectiveness of particle removal = 88.25233333333334%
Test 2 Overall effectiveness of particle removal = 91.03433333333334%
Test 3 Overall effectiveness of particle removal = 88.19433333333332%
Test 4 Overall effectiveness of particle removal= 96.36099999999999%
Test 5 Overall effectiveness of particle removal = 90.73366666666668%
Entire average of microplastic removal effectiveness = 90.91513333333334%
Variable analysis:
1)The effectiveness of how well the materials hold up to see if after a long time, the filter won't be as effective because the materials are old.
The percentage of effectiveness was varied between trials 1, 2, 3 of each material set. Some increased in order, some decreased in order and some trials varied. This signified that continued use of materials did not affect the results. This may have been due to the fact that some materials used were not water soluble or dissolvable.
2) Effectiveness of the removal of microplastics
The overall percentage of effectiveness of microplastic removal was 90.91513333333334%. This number was proven effective as counting the particles before and after was used to determine the loss. No other particles were contaminating the sample as the salt was fully dissolved and as shown in the clear water test the filter was not leaching any particles into the water.
In conclusion, this project was a major success. The filter removal was 90.91513333333334% which signified that the filter was really effective for removing microplastics. The filter also held up against continued use as shown when the percentage of removal didn't ultimately decrease every time the filter was used before change. The filter was somewhat eco friendly as no particles were leached into the water like sediment or carbon filter specks. Although coloring from the moss tinged the water yellowish green, after the filter was used a couple of times, the yellow tinge decreased. This could be easily solved by using real moss. Unfortunately where I live it is basically impossible to come by so I was forced to substitute it with fake moss. On the topic of eco friendliness, no salinity was lost in the filter which means if it were used in the ocean it would not disturb the fragile salt balance in the ocean. Each layer in the filter played a part in absorbing different sizes of plastics. The sediment layer absorbed larger plastics and the moss/carbon layer absorbed a combination of middle and smaller particles. Lastly, the last layer seemed to absorb the smaller plates as seen when the sponge was wrung out. Of course I cannot observe what layer absorbs the plastics, that can only be seen under the microscope. This project was very successful although if I were to make changes, I would use organic moss and further analyze what layers absorbed all sizes of plastics.
Citations
NOTE - Some links do not work so you may have to copy and paste the URL into your web browser.
Images
https://www.nbcnews.com/science/science-news/microplastics-human-body-know-dont-know-rcna23331 - ( Banner Image )
https://www.mdpi.com/2072-6643/15/3/617 - Image that reprenents microplastics in the cicle of life
https://pubs.acs.org/doi/10.1021/acs.jafc.1c04199 - Image that reprenents microplastics in the cicle of life
Sites for Reaserch
https://education.nationalgeographic.org/resource/microplastics/ - National Geographic Society, Microplastics, October 31, 2023,
https://manoa.hawaii.edu/exploringourfluidearth/physical/density-effects/density-temperature-and-salinity/practices-science-making-simulated-seawater - NGSS, Practices of Science: Making Simulated Seawater
https://www.nature.com/articles/d41586-021-01143-3 - XaioZi Lim,Microplastics are everywhere — but are they harmful?,04 May 2021
https://oceanservice.noaa.gov/facts/microplastics.html#:~:text=Plastic%20debris%20can%20come%20in,microplastics%20and%20their%20impacts%20yet. - National Ocean Services,What Are Microplastics,December,14,2023
https://pubs.sciepub.com/wjce/7/2/9/#:~:text=In%20the%20production%20of%20microplastics,and%20labelled%20(Figure%201). - World Journal of Chemical Education Student Experiments on the Topic of Micro-plastics in the Environment for Secondary Education Level II: The Coffee Pad Machine Experiment and Sediment Analysis, March 24 2019
https://www.usf.edu/magazine/2019-winter/university/#:~:text=If%20the%20material%20quickly%20melted,per%20pound%20of%20dry%20sediment. - Matthew Cimitile,New Study Reveals Four Billoin Particles Of Microplastics In Tampa Bay Waters,2019
https://www.theguardian.com/environment/2022/mar/24/microplastics-found-in-human-blood-for-first-time#:~:text=Microplastic%20pollution%20has%20been%20detected,and%20may%20lodge%20in%20organs. - Microplastics found in human blood for first time,Damian Carrington,Thursday,March ,22,2024
https://www.zonmw.nl/en/program/microplastics-health - Microplastics & Health,ZonMv,Present Date ( continuously updating )
Acknowledgement
I wish to express my gratitude to all the individuals who played a significant role in making this science project a reality. First and foremost, I would like to extend my sincere gratitude to my science teacher, Mrs.Osicki, for guiding me throughout this project. Her expert advice and continuous support has been invaluable in understanding complex concepts and executing the experiments with precision. This science project would not have been possible without the generous contributions of various individuals and resources. I am also deeply grateful to my mom and dad for their support and assistance at every step of this journey such as putting up with the very expensive water bill because of my experiment as well as funding my very expensive experiment of $1000. On the topic of money, I would like to thank my aunt Rajveer for chipping in with half of the total project cost. The dedication and belief from my support network in the project has been a driving force behind its successful completion. My Scientific Supervisor I (my dad) for ensuring I was safe during the experiment. I am also thankful for my brother, Jeevan who continued to cheer me on every step of the way. Special thanks to my classmates and friends for their constructive feedback and encouragement. Finally I would like to thank the CYSF and all of its volunteers and members for organizing this event and making it all possible.