
No More Salty Sight
Aadya Jha
Mount Royal School
Grade 9
Presentation
No video provided
Hypothesis
The Null Hypothesis: Increasing sodium chloride concentrations from 0.5M to 5M of a crude lysozyme sample at physiological tear concentration, temperature, pH of 4.9, and in the presence of a protein stabilizer (ovomucoid) that mimics the role of mucins in the tear film would have no significant impact on protein aggregation turbidity. This means that the differences between the groups can be attributed to chance (p > 0.05).
The Alternative Hypothesis: If the sodium chloride concentration is increased from 0.5M to 5M of a crude lysozyme sample at physiological tear concentration, temperature, pH of 4.9, and in the presence of a protein stabilizer (ovomucoid) that mimics the role of mucins in the tear film, then, protein aggregation turbidity would increase but at a significantly lower magnitude than the relative change between the theoretical inverse debye lengths (k^-1) for the ionic strengths because, factors that are not included in the electrostatic screening theory, such as the high zeta potential of lysozyme at the given pH, low concentration, the presence of a protein stabilizer, and the hydration shield around lysozyme particles, would all prevent and slow down aggregation. Additionally, protein aggregation turbidity is hypothesised to increase over time, plateauing after 5-10 minutes at medium to high salt concentrations.
Research
Key Terms Used in the Project
- Dk - The Dk value measures oxygen permeability
- PMMA - (Polymethyl methacrylate). A rigid plastic material used in traditional, non-soft contact lenses.
- HEMA - A key component in hydrogel contact lenses, known for its ability to absorb water
- Lysozyme - It is a major\, abundant protein found in human tear fluid.
- Hydrophilic- Means water loving they attract and hold water\, making contact lenses soft and flexible.
- Turbidity - Turbidity is the measure of the cloudiness of a substance
- Ionic strength - the concentration of ions in a solution
- Osmotic stress - the stress that highly concentrated solutions pose
- Osmolarity - the concentration of particles in a solution
- Polypeptide: a chain of amino acids
- Gram positive bacteria: Bacterial with thick cell walls.
- Monosaccharide: simplest form of sugar
- Polymer: a chain of repeating units
- Denaturation: when protein particles unfold and loose their structure
- Aggregation: when protein particles clump together (become insoluble)
- Protein stability: the structural or soluble stability of a protein
- Precipitation: intense aggregation, when protein particles settle on the bottom
- Coagulation: when proteins denature and aggregate together, and starts to solidify in an irreversible way.
- Van der Waals forces: Intermolecular force between uncharged particles
- Native form of protein - when protein in its normal structural form
- Cytokines - proteins that initiate inflammation in the body
- Cuvette - a small vial used for spectrophotometry or turbidity measurements.
- Steric stabilization/hindrance - this is when another substance creates a barrier between protein particles\, preventing them from aggregation.
The Problem: Lysozyme Denaturation and Aggregation on Contact Lenses
In Canada, contact lenses have a 43% discontinuation also known as drop out rate. This means that 43% of patients who were prescribed contact lenses stopped wearing them permanently. Out of 43% patients who stopped wearing contact lenses, 50% of them attributed this to discomfort. A significant factor causing contact lenses discomfort is lysozyme denaturation and aggregation. Ionic and hydrophilic contact lens materials like hydrogel contact lenses (HEMA-Hydroxyethyl Methacrylate based) bind to positively charged lysozyme particles. Components like Methacrylic acid which are added to increase water content and Oxygen permeability are negatively charged, so they attract positively charged lysozyme in the tear film. Silicone hydrogel contact lenses (PMMA - Polymethyl methacrylate based) have a higher Dk value and bind less lysozyme. However, a greater degree of it gets denatured. Lysozyme deposition on contact lenses when lysozyme is in its native form, is actually beneficial for the eyes as it is anti-bacterial and increases wettability of contact lenses. It is when this lysozyme denatures and then aggregates on the lens surface is a problem. Factors such as temperature, ionic strength of contact lens cleaning and rinsing solutions, and individual tear chemistry can denature lysozyme and induce aggregation. Additionally, multiple studies have discovered that multipurpose solutions vary in osmolarity, meaning that they also differ in ionic strengths. This variance results in different levels of lysozyme stability. Denatured and aggregated lysozyme particles can cause blurry vision, discomfort, and can harm corneal epithelial cells by releasing inflammatory cytokines. Furthermore, these unwelcome deposits can lead to ocular pathology like papillary conjunctivitis, punctate keratitis, corneal inflammatory events, and microbial keratitis.
What is Lysozyme?
Lysozyme is an antimicrobial and antifungal protein primarily found in the aqueous layer of the human tear film, which protects the eye against pathogens. Additionally, it helps stabilize the tear film by interacting with lipids and proteins like lactoferrin and lipocalin. These interactions help maintain the surface tension of the tear film which is vital for preventing the tear from evaporating and keep the eyes lubricated. Lysozyme's chemical name is N-Acetylmuramide Glycanhydrolase. It is a single polypeptide chain consisting of 129 amino acids.
Lysozyme ruptures the peptidoglycan, a polymer found in the cell walls of the gram positive bacteria through a hydrolysis reaction.
How Does Lysozyme Kill Bacteria?
Peptidoglycan, in simple terms, is half protein and half carbohydrate. Lysozyme acts on the carbohydrate part of the peptidoglycan. The carbohydrate chain in peptidoglycan is made from repeating units of NAG and NAM. NAG (N-acetylglucosamine) is a monosaccharide that provides structure to the polymer and is a derivative of glucose. NAM (N-acetylmuramic acid) is a more complex sugar derived from NAG. It is unique to bacterial cell walls and contains the peptide chain. These repeating units are connected by glycosidic linkages. Lysozyme only breaks the NAM-NAG bond, not the NAG-NAM bond. The chemical reaction for breaking this bond is a two step displacement reaction. The two main amino acids that are involved in this reaction are aspartic acid 52 (asp 52) and glutamic acid 35 (glu 35). Tryptophan 61, tryptophan 62, aspartic acid 101 and aspartic acid 102 provide stability in the reaction. Glu 35 breaks the NAM part of the glycosidic linkage, as Glu 35 gives a proton (H+) to the oxygen atom connecting the NAG and NAM. This causes the NAM part of the linkage to break. Next, Asp 52 has a negative charge which helps it to hold on to NAG, preventing it from floating away. Then, a water molecule enters the reaction. Glu 35 regains a H+ (proton) from the water molecule and the remaining OH- breaks the link between asp 52 and NAG. This resets the glu 35 and asp 52 to break the next glycosidic linkage.
Protein Structure
Lysozyme is stabilized by electrostatic interactions between charged amino acids, hydrogen bonds, hydrophobic interactions, and Van der Waals forces. Amino acids form chains, and forces among these chains, make it fold into the protein’s tertiary structure.
Salting-out of Lysozyme: Salt Induced Lysozyme Aggregation
When sodium chloride is added to a lysozyme solution, Na+ Cl- ions surround charged amino acids of the lysozyme particles. These ions attract water molecules from the solvent, helping lysozyme maintain its hydration shell. This hydration shell is crucial for maintaining lysozyme’s tertiary structure. This is referred to as salting-in (when adding salt improves protein solubility). An excess of these ions can pull water molecules away from the lysozyme, disrupting its structural stability. This causes the protein to clump together and form a precipitate (aggregation). This is referred to as salting-out. Aggregation can be observed as the turbidity of the solution increases.
The way lysozyme responds to salt concentrations is dependent on its pH, temperature, concentration, and the other presence of other substances. At higher concentrations of lysozyme, it is easier for the proteins to aggregate together as the proteins are more densely packed, and vice versa. At higher temperatures, the increased kinetic energy makes lysozyme less stable. At different pH, the net charge of proteins vary, making them more or less prone to aggregation. More information on pH and lysozyme’s net charge under “Isoelectric Thermal Precipitation Method for purifying a Crude Extract.”
Electrostatic Screening of Lysozyme by Electrolytes and the DLVO Theory
Lysozyme is positively charged at pH lower than 10.7. The strength of this positive charge increases as the pH becomes more acidic. Lysozymes' positively charged electrostatic field makes them repel each other strongly. This strong repulsion force keeps the colloidal solution of the lysozyme in the solvent stable (prevents aggregation). When an electrolyte is present in the solution, then a phenomenon referred to as electrostatic screening occurs. The ions of the electrolyte surround the protein particles, blocking their electrostatic field. This results in the inverse debye length (how far the electrostatic field extends) to become shorter. This causes the protein particles to come closer to each other before they repel. At higher ionic strengths, the protein particles' electrostatic field is so small, that they can nearly touch, which leads to Van der Waals forces to dominate. This theory of colloidal stability is called the DLVO Theory which is named after four scientists: Derjaguin, Landau, Verwey, and Overbeek. This theory illustrates the relationship conceptually and mathematically between two competing forces (attraction and repulsion) in a colloidal system. Though this theory is not specifically for proteins, it serves as an important model in understanding protein aggregation.
Additionally, excessive electrostatic screening of lysozyme particles disrupts the forces within the protein structure such as electrostatic interactions among charged amino acids, hydrogen bonds, hydrophobic interactions and Van der Waals forces. This disruption can lead to denaturation. Conversely, low ionic strengths can help stabilize protein structures.
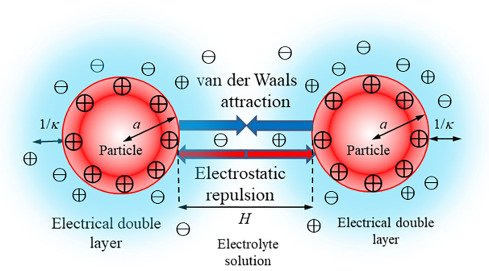 Caption: This image illustrates the electrostatic screening of particles.
Image from: Hiroyuki. (2024). Chapter 9 - DLVO Theory of Colloid Stability. Science Direct, 37, 217–244. https://www.sciencedirect.com/science/chapter/bookseries/abs/pii/B9780443161162000096
Caption: This image illustrates the electrostatic screening of particles.
Image from: Hiroyuki. (2024). Chapter 9 - DLVO Theory of Colloid Stability. Science Direct, 37, 217–244. https://www.sciencedirect.com/science/chapter/bookseries/abs/pii/B9780443161162000096
The Mathematical Model
This formula is used to calculate the inverse debye length of a particle in an electrolytic solution of varying ionic strengths. This model is part of the DLVO theory. I have sued this formula to quantitatively hypothesize the aggregation levels of different salt concentrations I am planning to use for my experiment.
 Image from: Trefalt, G., Borkovec, M., Derjaguin, Landau, Vervey, and Overbeek, Evert Verwey, & Jan Overbeek. (2014). Overview of DLVO Theory. https://colloid.ch/grouppage/pdf/Overview_DLVO_Theory1.pdf
- k^-1 represents the debye length
- kB - Boltzmann constant (1.380649 × 10^-23 - represents the proportional ratio between the temperature in kelvins and the thermal energy in joules)
- T - temperature in kelvin
- e - the dielectric constant of water at 37 degrees celsius (74.3) It is a measure of how much a substance reduces the electric field of a particle compared to vacuum.
- e0 - absolute permittivity (dielectric constant) of vacuum (8.85418 x 10^-12 F/m) - F stands for farads.
- I - the ionic strength of the electrolyte present in the solution. In the case of sodium chloride\, the concentration in molarity is proportional to the ionic strength.
- NA - the Avogadro's number: it converts moles into the number of individual ions (6.02214076 × 10^23)
- q - is the elementary charge of the particle (is it squared because it measures the strength of the charges\, if it were not squared the value\, it would appear as if the sodium ion and the chloride ion cancels out. (1.602176634 x 10^-19)
- The denominator is doubled because 1 molecule of salt brings two ions.
I applied this formula to calculate the inverse debye length for water at 37 degrees Celsius (body temperature) and 0.5 M, 1 M, 3 M, 5 M sodium chloride concentrations. Then, the result was converted from meters to nanometers.
0.5 M = 0.4259 nm
1M = 0.3012 nm
3M = 0.1739 nm
5M = 0.1347 nm
Isoelectric Thermal Precipitation Method for purifying a Crude Extract of Lysozyme from Egg White (Albumen)
Due to the fact that pure hen egg white lysozyme cannot be obtained easily by my school, I decided to use the chemical properties of the different protein to purify a crude extract of lysozyme.
Proteins in egg white (albumen) have different isoelectric points. The isoelectric point (pl) of a protein is the pH at which the protein is most insoluble as the net charge of the protein is neutral. This makes the protein more prone to aggregation due to the lack of repulsive force among the protein particles.
Albumen proteins have different isoelectric points. This difference can be used to adjust the pH to purify a crude extract of certain proteins.
Additionally, albumen proteins have different thermal coagulation temperatures, which is the temperature at which proteins coagulate. At pH 4.5, lysozyme is the most stable, while other proteins like ovalbumin and ovomacroglobulins reach their isoelectric point and coagulate. Conalbumin has a coagulation temperature of 57.3 degrees celsius, while lysozyme has a coagulation temperature of 81.5 degrees celsius. At pH around 4.5, ovalbumin and ovomucin reach their isoelectric point and coagulate, while lysozyme is the most stable. If the temperature is kept at 60 degrees celsius for 10 minutes, and the pH is buffered to around 4.5 using ascorbic acid, all the other proteins will coagulate except ovomucoid. This is not an issue as ovomucoid helps lysozyme remain stable just as mucins do in our tear film. So, my crude extract will be able to better imitate the tear film chemistry in that means. As ovomucoid is slightly negatively charged at pH 4.5, it will bind to positively charged lysozyme. This can result in the two proteins coagulating together. This can be prevented by adding 0.5M of sodium chloride to initially stabilize these two proteins. Because, neutralizing the pH of the extract to physiological tear levels (7-8) would require the addition of a base that would produce a salt as a product. This salt formation would increase the ionic strength of my sample in an uncontrolled manner. For this reason, physiological tear pH was not tested. This is a limitation with this purification method.
 Image from: Wang, L., Li, R., Lv, S., Liu, Y., Fang, S., Zang, J., Qing, M., & Chi, Y. (2025). The thermodynamic and gelation properties of ovalbumin and lysozyme. Gels, 11(6), 470. https://doi.org/10.3390/gels11060470
Variables
The manipulated variable:
The molar concentration of Windsor table salt: 0.5 M, 1 M, 3 M, 5 M, which was measured by a digital weighing scale of 0.001 g precision.
The responding variable:
The change in the raw values produced by the silicon photodiode which measured the intensity of light that passed through the cuvette. (A higher number means low turbidity: the protein is stable, and a lower number means higher turbidity: the protein is aggregating.)
The controlled variables:
Temperature was regulated to be at 35 to 40 degrees Celsius to mimic physiological temperature. The cuvettes and pipettes used were rinsed with warm distilled water to maintain thermal equilibrium. If the cuvette and pipette were not being used, they were kept in a Ziplock bag submerged in the same pot of water as the test tubes.
pH : pH was adjusted with ascorbic acid to be at 4.6. pH was measured regularly to ensure pH was not drifting. The pH during the initial buffering process was 4.6. However, the pH drifted to 4.9 and stayed there during the testing process.
Same extract batch: I used the same batch of crude lyszoyme extract. This minimized the possibility of protein concentrations varying between samples. However, due to the fact that protein solutions are heterogeneous, the solute particles are not evenly distributed throughout. This does pose a minimal chance of protein concentration varying slightly among samples.
Fixed set-up of the turbidimeter: I used a fixed setup for the turbidimeter with the same alignment of the LED, cuvette holder, and the photodiode all throughout.
A light-tight box for the turbidimeter: The turbidimeter was made in a light-tight box that was painted with matte black paint to ensure that ambient room light did not interfere with the readings.
Same brand of table salt: I used Windsor table salt which is 99% sodium chloride.
Same cuvette: The same cuvette was used to maintain consistency.
Same digital weighing scale: The same digital weighing scale was used to maintain consistency.
Procedure
1. Wire the circuit for the LED
- Calculate the resistance needed for the LED.
- At first, I used a UV LED as I thought that because of its small wavelength it would be more precise, however, I learned that some amino acids of lysozyme absorb UV light. This would make my turbidity measurements inaccurate. So, I switched to a Red LED.
- The formula for calculating resistance required:
[V(power supply) - V(LED)]/0.02A
The Voltage for an Red LED is 2.2V on average The Voltage of a USB port connected to a laptop is 5V
(5V - 2.2V)/0.02A = 2.8V/0.02A = 140 ohms When I was wiring the UV LED I realised I did not have the exact ohms resistor. So I asked myself: “How can I combine the ohms value of the resistors that I have, to get the value I need.” Then, I learned that by connecting resistors in a series, connecting each end of the resistor to the previous one on the breadboard, I can get the resistance of the sum of the ohms values connected in the series.
I connected the series resistors to the anode of the LED and then connect the end of the series to pin 12 of the Arduino Uno board. Next, connect the cathode of the LED to GND of the Arduino Uno board.
2. Write the code for the LED
Under the void setup, set pin 12 as the output and set the voltage for that pin as high. Make sure that the lines of code end in a semicolon.
-pinMode(12,OUTPUT); -digitalWrite(12,HIGH);
 Example of the wiring for the led (in this photo there is a UV LED, but in my final
model I used a red LED - just the led and ohms value changed everything else remained the same.
Example of the wiring for the led (in this photo there is a UV LED, but in my final
model I used a red LED - just the led and ohms value changed everything else remained the same.
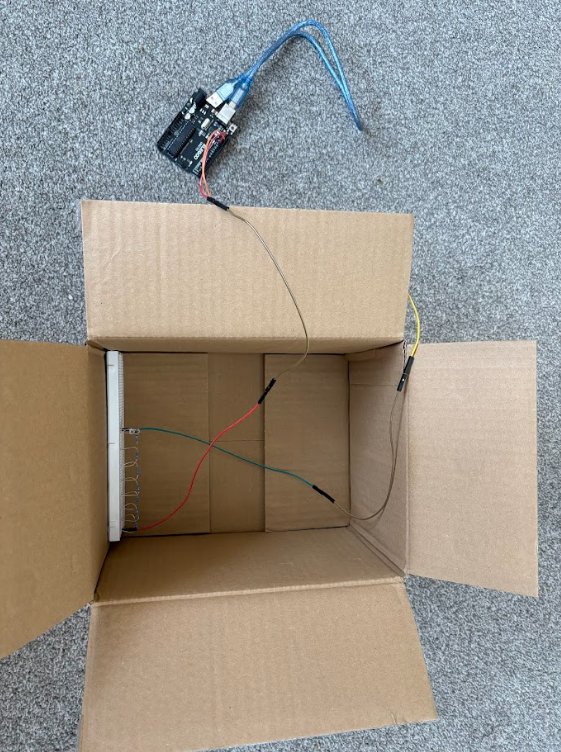
3. Plan the setup for the turbidimeter
For my setup, I found a cardboard box for my turbidimeter. I decided to stick the breadboards (one for the LED and one for the light sensor) on either side of the box. I will keep the Arduino Uno Microcontroller outside of the box and use female-to-male jumper wires to extend the connection of the wires.
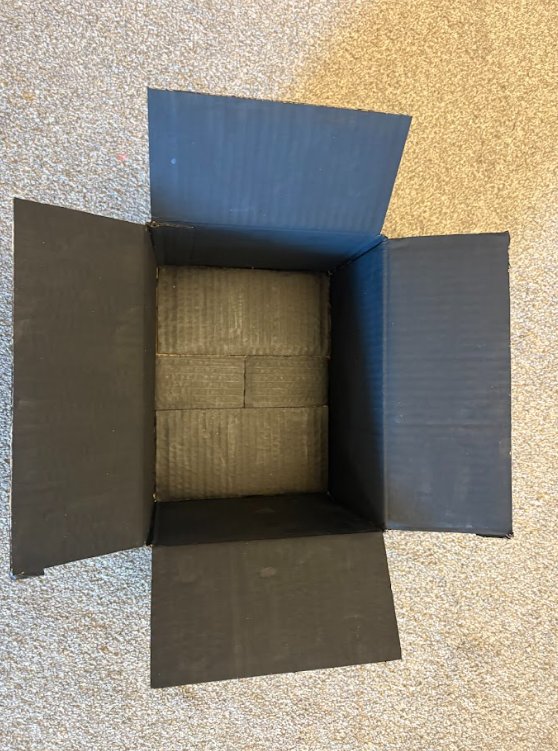
4. Paint the box black inside and out
Painting the box black will ensure that it is a light-tight box. This ensures that even a small amount of ambient light from the room will not interfere with the measurements after closing the box as it will be absorbed by the matte black color.
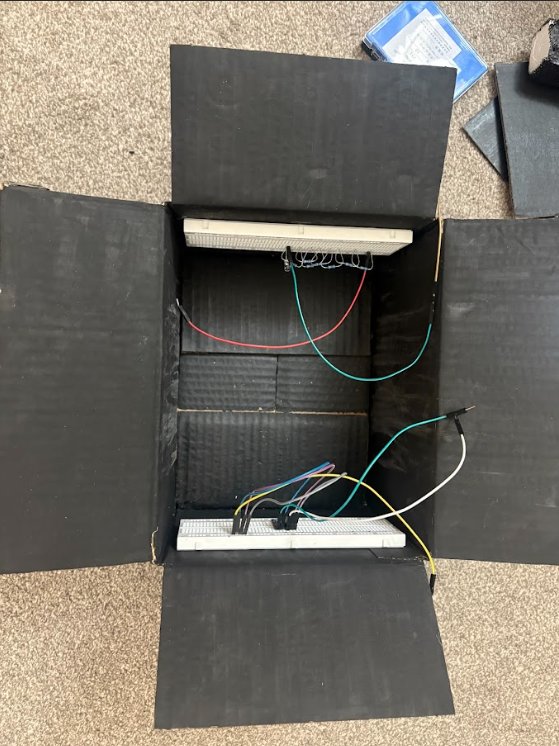
5. Stick the breadboards in the box aligned with each other
Breadboards of the LED and light sensor were carefully stuck on the sides of the box, using a toothpick to ensure the LED was directly aligned with the sensor. The alignment was checked from multiple angles to ensure proper alignment.
NOTE: In the beginning (in this picture), I used the OPT101 light sensor as it is a high precision light sensor. However, I kept getting illogical and inconsistent readings while testing it. For example, when a flashlight was shined onto the sensor, it would produce readings such as, 50, 1000, 0, 300. I figured that if a capacitor is used, it will help reduce the noise. However, that did not solve the problem. Then, I realised that the sensor could not fully connect onto the breadboard and would require soldering. Due to time and resource constraints, I resorted to using a simple BWP34 silicon PIN photodiode which gave me consistent and logical readings ranging from 0 to 50. 0 = no light, 50 = full light transmittance (without blockage) from the red led.
6. Make the cuvette holder
I cut a piece of styrofoam and made a pit in it that was the size of the cuvette. This will help the cuvette stay in place. Then, the cuvette holder was also painted black to absorb any ambient light. Next, I used hot glue to stick the cuvette holder in the middle of the box.
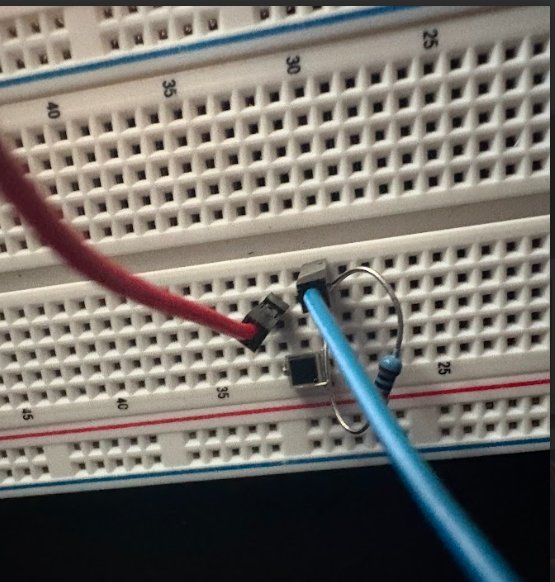
7. Wire the silicon PIN photodiode instead of the OPT101
Due to resource and time constraints, I could not solder the OPT101 so I resorted to using the BWP34 silicon PIN photodiode instead. I connected the photodiode on the breadboard so that it was perfectly aligned with the LED. I connected a 1 million ohms resistor to the anode of the photodiode. Then, I connected the end of the ressito to the analog pin of the Arduino Uno Microcontroller. Finally, the cathode of the photodiode was connected to GND (ground) of the Arduino Uno. I used male-to-male and female-to-male jumper wires to extend the connections so that the Arduino Uno Microcontroller could be kept outside of the box.
 \
\
Image of the photodiode on the breadboard
8. Code the circuit of the photodiode
First, we need to initialize the sensor pin as the analog pin of the Arduino Uno Microcontroller and set the initial sensor value as 0. The code in Arduino IDE is as follows:
int sensorPin = A0; int sensorValue = 0;
Then, under the void set up, the communication speed between the photodiode and the Arduino Uno Microcontroller needs to be set to 9600 bits per second. Serial.begin(9600);
Under the void loop, the sensor value needs to be set to the readings from the analog pin, and those readings need to be printed on the serial monitor. The delay between the readings needs to be set to 500 milliseconds, so readings are not rapidly moving past the serial monitor. The code of these actions are as follows:
void loop() { sensorValue = analogRead(sensorPin); Serial.println(sensorValue); // Corrected function name delay(500);
 Image of light shining on the photodiode.
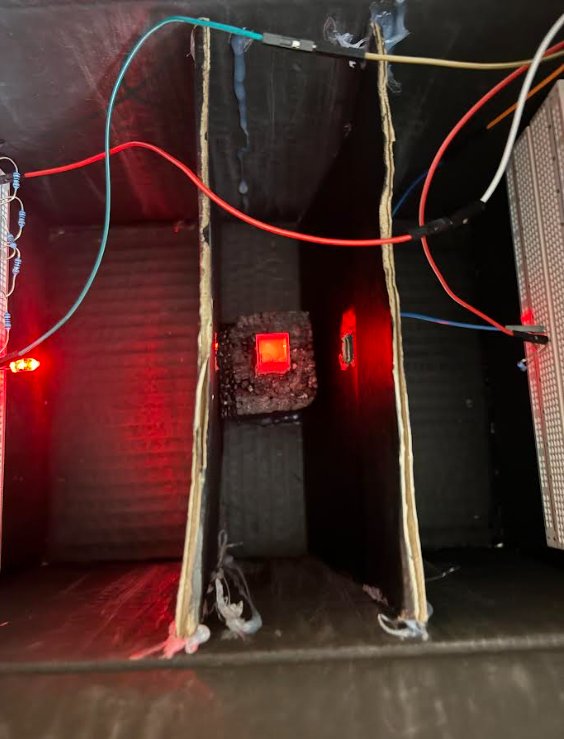
9. Make light focusing dividers for the cuvette
I cut two pieces of cardboard that would fit in the box as dividers between the LED and the photodiode. Then, I painted these pieces of cardboard black. Next, I made a hole in those cardboard pieces that lined up with the LED and the photodiode with a screwdriver. Then, I made the holes rectangular with an X-Acto knife to clean up the edges. Finally, I hot glued these light-focusing dividers on either side of the cuvette holder, so that the light is focused on the cuvette.
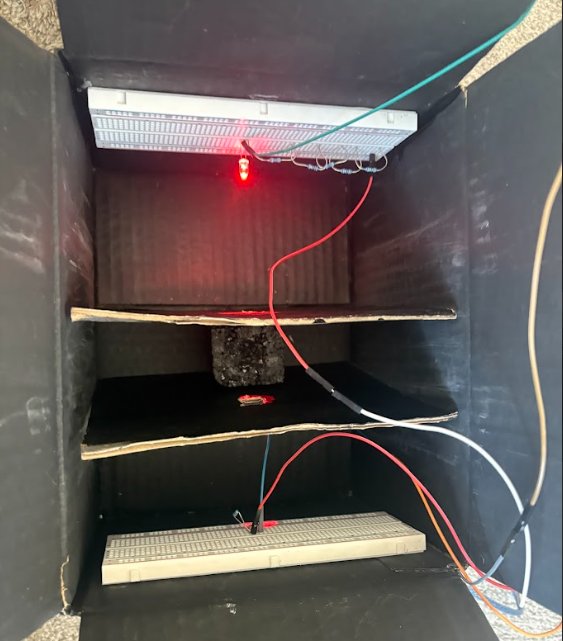 The finished design of the turbidimeter
Isoelectric Thermal Precipitation of Albumen (egg white)
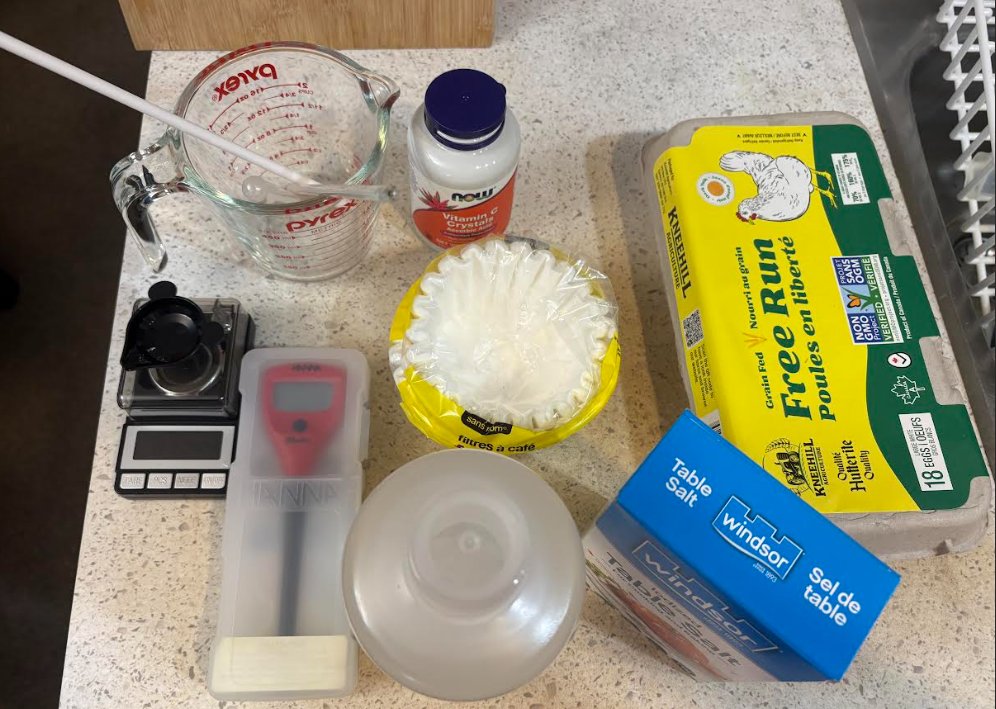
Materials needed:
- A box of hen eggs
- Distilled water
- Calibrated pH meter
- Ascorbic acid
- Windsor table salt (99% sodium chloride)
- Kitchen scale for measurements
- A digital scale 0.001 g accuracy
- Kitchen measuring cup
- Stirring rod
- Thermometer
- Coffee filters
- 2 large bowls
- 2 small bowls
- Tap water
- 1 big pot
- 1 smaller pot for double boiler system
- Nitrile gloves
- Paper towels
Procedure:
- Calibrate the pH meter using the buffer solution provided in the case.
- Calibrate the digital weighing scale with 0.001 g accuracy as per the package instructions
- Measure the volume of a large bowl so it could be subtracted from the total volume later. The volume of the bowl was 503 ml.

- 4. Collect the albumen of 17 large eggs in that large bowl
- 5. Measure the volume in ml of the albumen + the bowl on the same kitchen scale. The total volume was 1031 ml. A kitchen scale that measured in milliliters was used to avoid the use of a measuring cup, as some albumen would have been lost in the process, making my ng my measurements inaccurate.
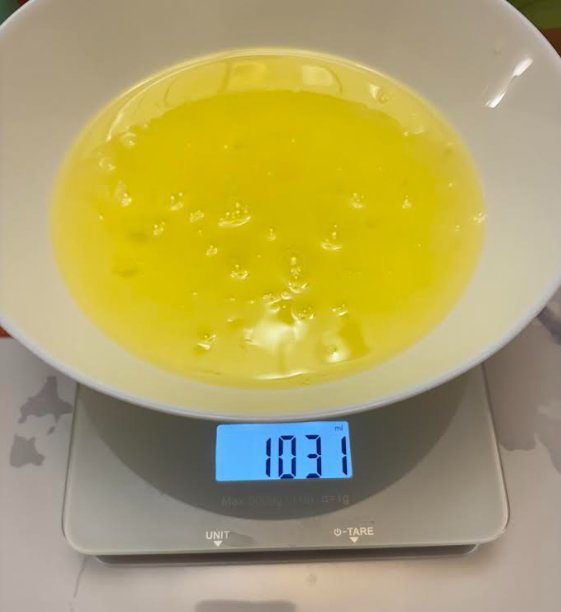
- 6. Subtract the volume of the bowl from the total volume (1031 ml - 503 ml = 528 ml)
- 7. Measure 0.5M salt for the double volume of the albumen (528 x 2 = 1056).
The steps described below were used to calculate the mass of the salt needed in grams. To convert molarity (mol/L): 0.5 moles/L x 1.056L = 0.528 moles. 1 mole of NaCl = 58,440 mg, 0.528 x 58,440 mg = 30.856 g (rounded to the nearest mg).
- 8. Measure 528 ml of distilled water. I used the same volume of distilled water as the albumen to achieve a 1:1 dilution ratio. Diluting the albumen will reduce viscosity\, which will help in obtaining a purer extract and a lysozyme concentration within the physiological tear threshold. Albumen contains roughly 3.5mg/ml concentration of lysozyme. A 1:1 dilution will reduce the concentration in half resulting in a 1.75mg/ml\, which is the average lysozyme concentration in the tear fluid. According to previous literature\, around 70% of lysozyme is retained using the purification method I am using. This means that my extract will contain about 1.225mg/ml of lysozyme\, which is within the physiological threshold.
- 9. Mix the salt with the 528 ml of distilled water with a stirring rod to prepare an electrolytic solution until the salt is fully dissolved. Adding salt will prevent lysozyme from binding to ovomucoid by creating a barrier between their opposite charges.
- 10. Mix the electrolytic solution with albumen .
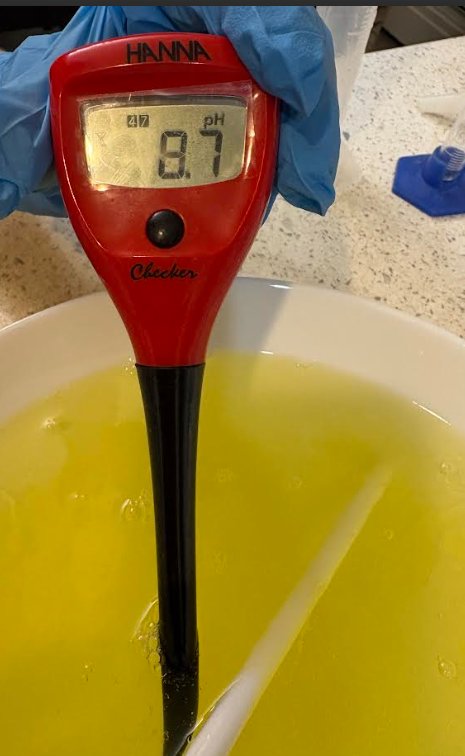
- 11. Measure the pH of the albumen\, which was 8.7 pH
- 12. Measure 8 g of ascorbic acid.
- 13.Add ascorbic acid, little by little, in a few drops of distilled water until the pH was 2-3 and then mix the acidic solution with a stirring rod until the ascorbic acid was fully dissolved.
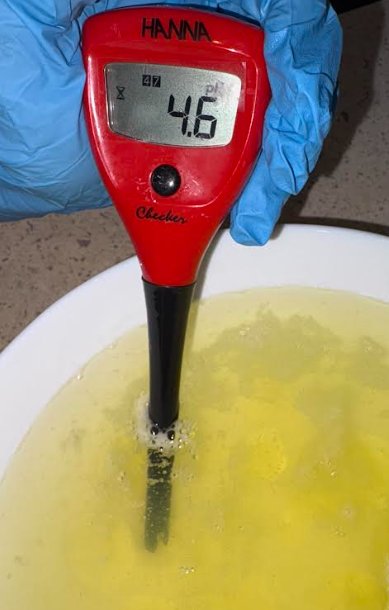
- 14. Add the ascorbic acid solution gradually into the albumen mixture until the pH was 4.4- 4.6.
- 15. Mix the albumen mixture gently and thoroughly
- 16. Fill a large pot with tap water.
- 17. Put the pot on the stove and turn the heat on high flame
- 18. Measure temperature continuously with a thermometer
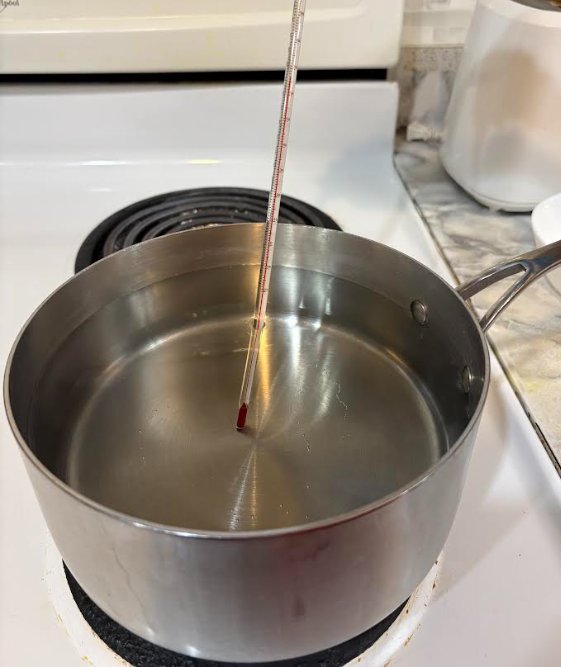
- 19. Turn the flame off when the temperature reaches 60 degrees Celsius
- 20. Pour the albumen mixture into another pot and set-up a double boiler on the heated pot of water
- 21. Turn the flame on low heat
- 22. Measure the temperature of the albumen mixture continuously
- 23. Set a timer for 10 minutes once the liquid reaches 60 degrees Celsius
And turn the flame off. If the temperature starts dipping, turn the stove on low heat again.
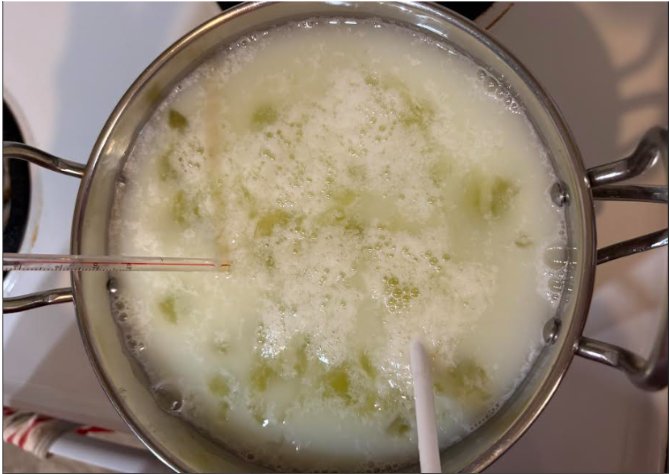
- 24. Once the 10 minutes were over\, and parts of the albumen have coagulated\, pour the hot liquid through a strainer lined with coffee filters into a separate bowl
- Wait until all that left in the strainer looks thick and white
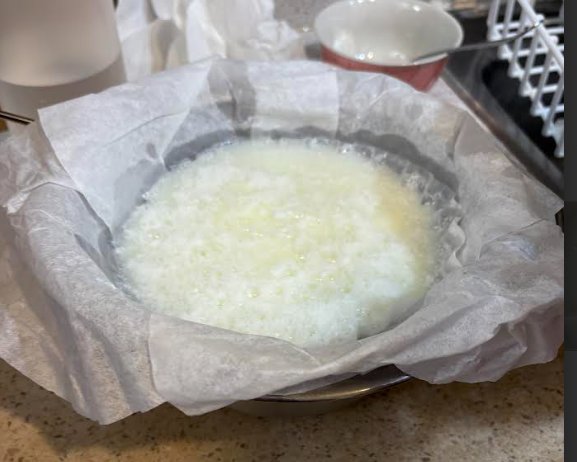
- 25. Filter the extract a few more times in the same process to purify it further
The extract looks slightly cloudy and has a yellowish tint from vitamin B
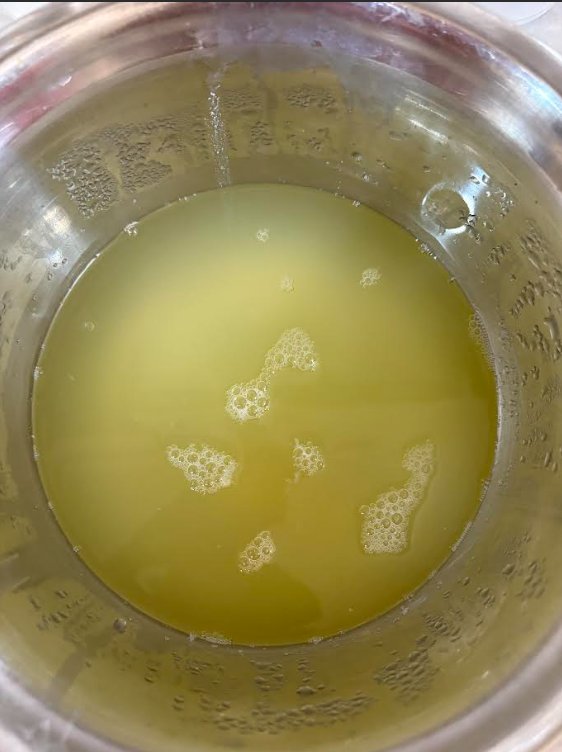
The extract is now ready, store it in the refrigerator to avoid bacterial growth.
The Salt-induced Aggregation Test
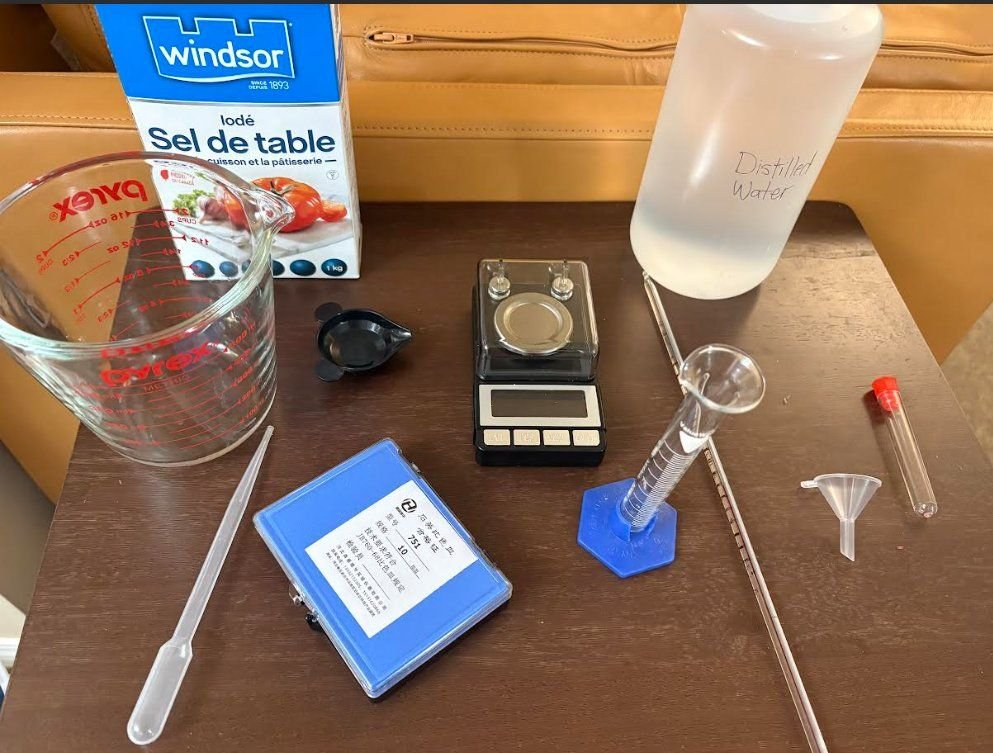
Materials needed:
- DIY Arduino Turbidimeter
- Crude lysozyme extract
- Windsor table salt (99% sodium chloride)
- Distilled water
- Small graduated cylinder
- Pipettes
- A digital scale 0.001 gram accuracy
- Quartz cuvettes for turbidity measurements
- Test tubes with stoppers
- Small funnel
- Thermometer
- Calibrated pH meter
- Tap water
- A large pot
- Tongs
- 1 smaller pot for double boiler system
- Nitrile gloves
- Paper towels
- A permanent marker for labeling
Procedure:
- 1. Wear gloves and then calibrate pH meter
- 2. Warm the extract with the same double boiler set-up to 37 degrees Celsius on low heat\, to prevent denaturing the lysozyme due to high temperature acceleration.
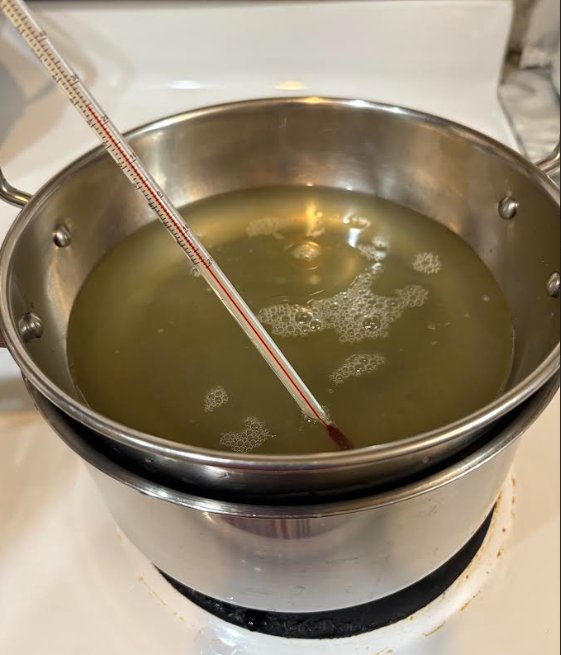
- 3. Once the lysozyme extract is at the given temperature\, use a pipette to measure 4 ml of extract in a graduated cylinder
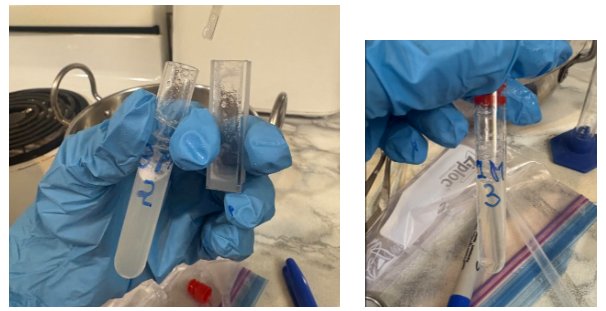
- 4. Pour the liquid from the graduated cylinder into a test tube labeled “0.5M 1” with a permanent marker.
- 5. Close the test tube with a stopper and place the test tube in a pot filled with tap water heated to 37 degrees Celsius.
- 6. Set a timer for 3 minutes.
- 7. Once the timer is over\, take the test tube out of the hot water bath using a pair of tongs.
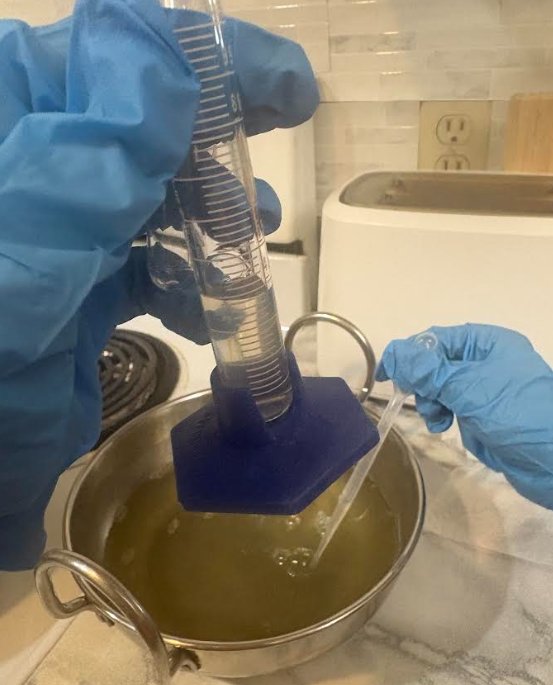
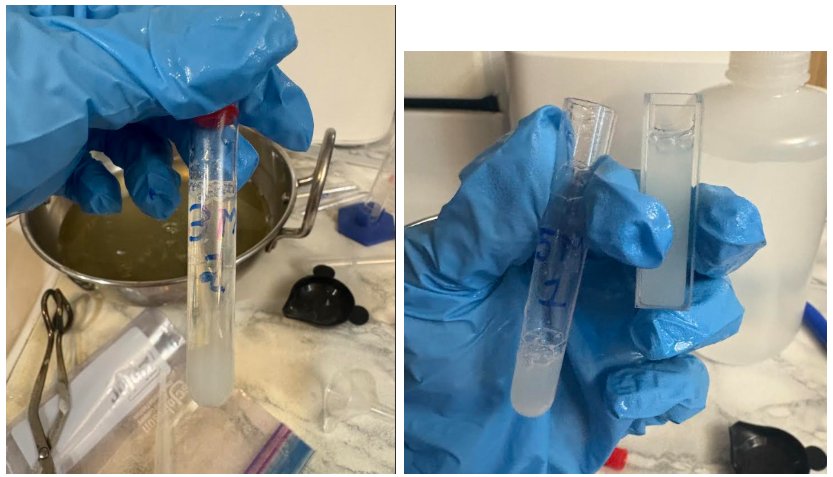
- 8. Use a pipette to transfer the solution to the cuvette.
Draw the solution from the side of the test tube, and pipette the solution into the cuvette from the side to avoid bubbles. However, some bubbles did form.
- 9. Carefully place the cuvette in the cuvette holder of the DIY turbidimeter and close the box.
- 10. Save and label multiple readings of each time interval.
- 11. Repeat the steps no. 6-10 for the 5 minutes\, 10 minutes\, 25 minutes\, 40 minutes\, and 60 minutes time intervals\, and for the other two trials.
Rinse the cuvette and pipette with warm distilled water, and dry them to maintain thermal equilibrium and avoid contamination between samples and timings.
When I had a break between my measurements, I placed the cuvette and pipette in a ziplock bag in the warm water pot.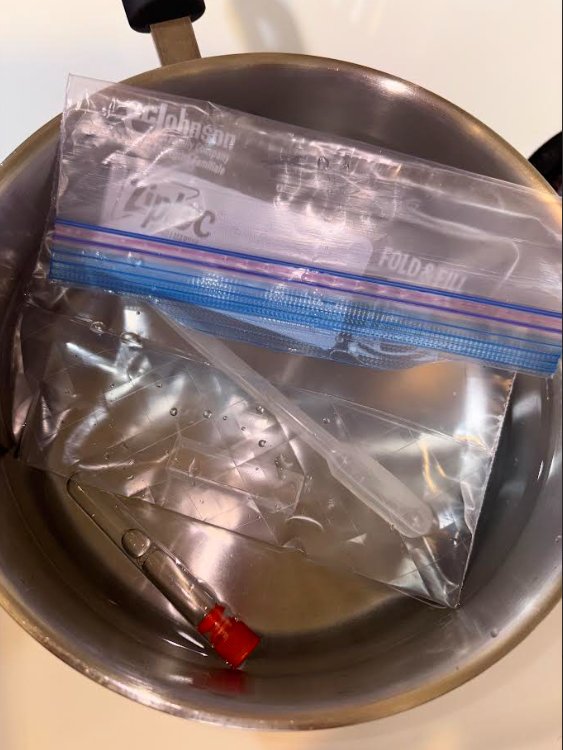
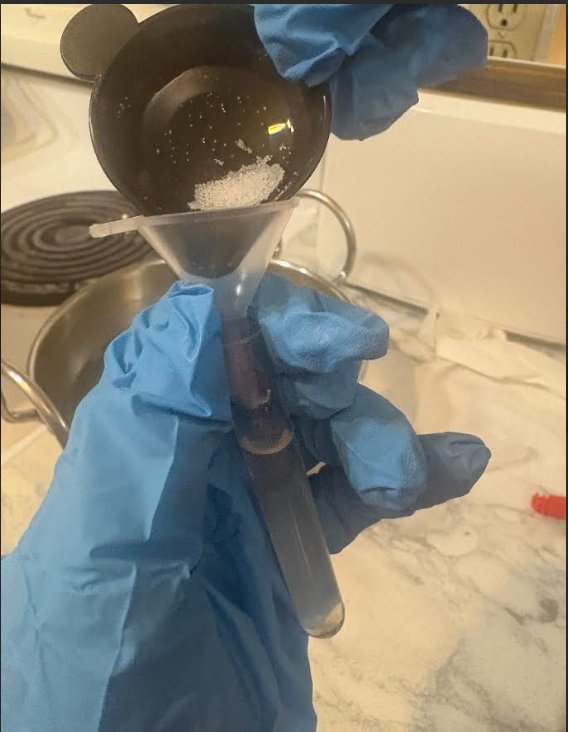
For the trials containing 1M, 3M, and 5M salt repeat the same steps, but add 0.5M (0.117 g), 2.5M (0.584 g), and 4.5M (1.052 g) into the test tube and invert it 15-20 times to ensure the salt is fully dissolved. We would add 0.5M less than our intended concentration into the test tube, because the extract already contains 0.5M salt. The mass of the concentrations in molarity were derived by following the same calculations discussed in the section: “Isoelectric Thermal Precipitation of Albumen.”
Observations
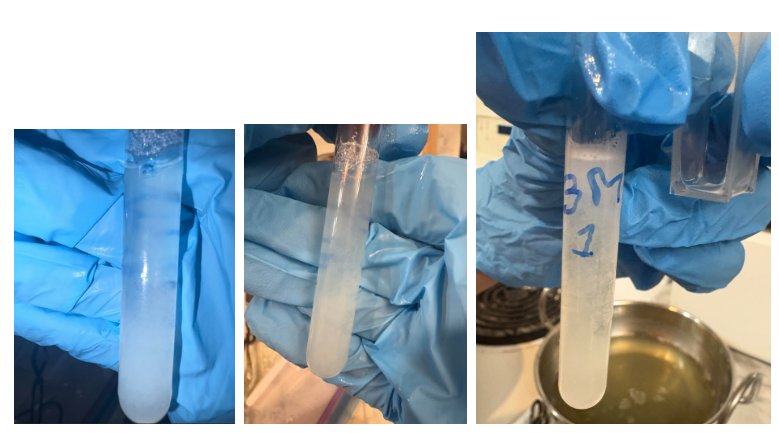
There was not a visible difference between 0.5M and 1M, 3M and 5M. However, a difference in turbidity between 1M and 3M was visible and prominent throughout the three trials.
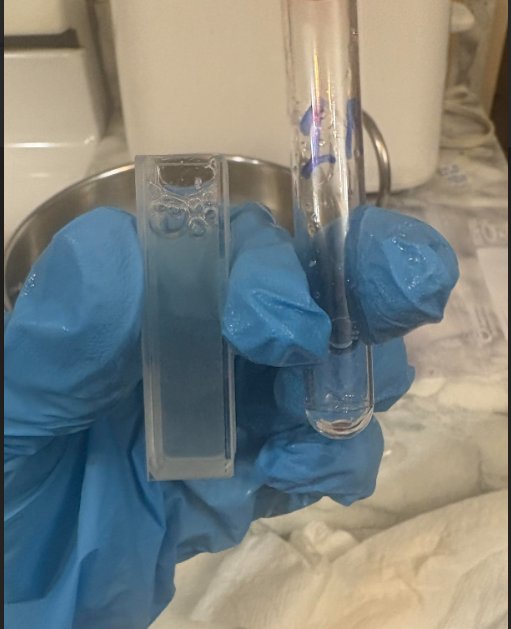
The difference in visual turbidity between 1M and 3M.
In about 5 to 10 minutes, visible aggregated strands started to form for 3M and 5M across all three trials. However, after the sample was transferred into a cuvette, all the particles redissolved.
After 20 minutes of initial addition of salt for 3M and 5M samples, salting-out started to occur. All the protein particles aggregated and settled on the bottom. However, after the sample was transferred into the cuvette for measurements, the particles redissolved.
Additional pictures:
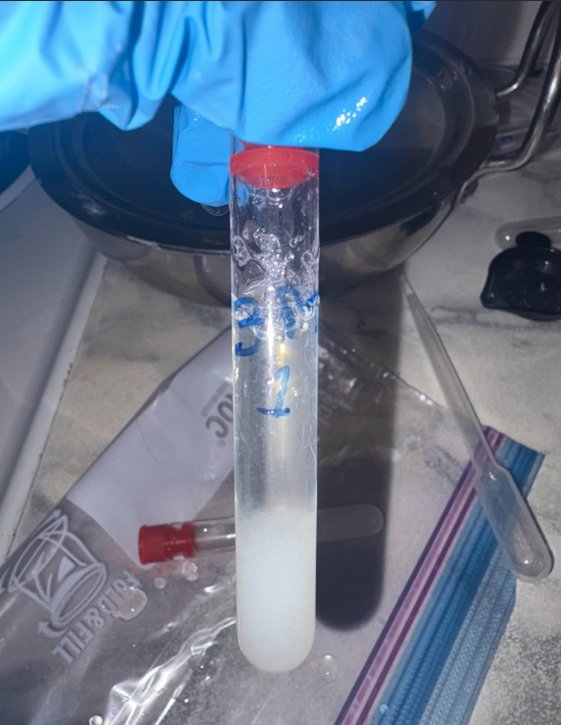
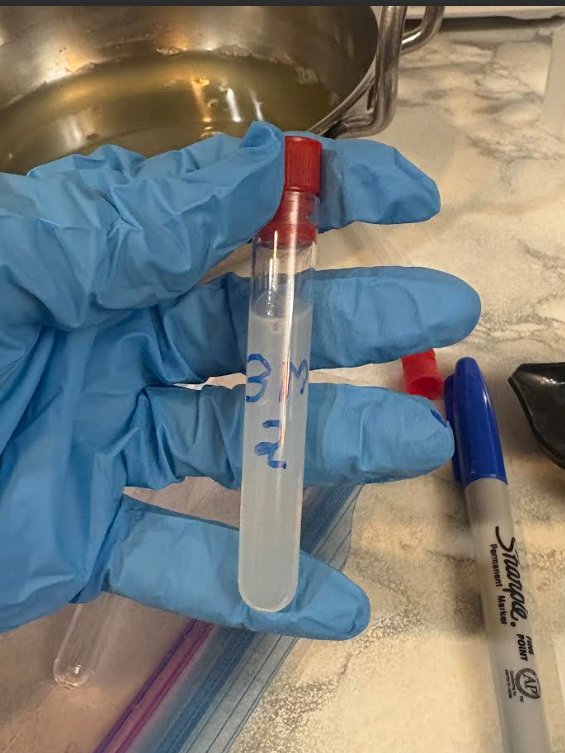 3M sodium chloride 2nd trial at 3 minutes.
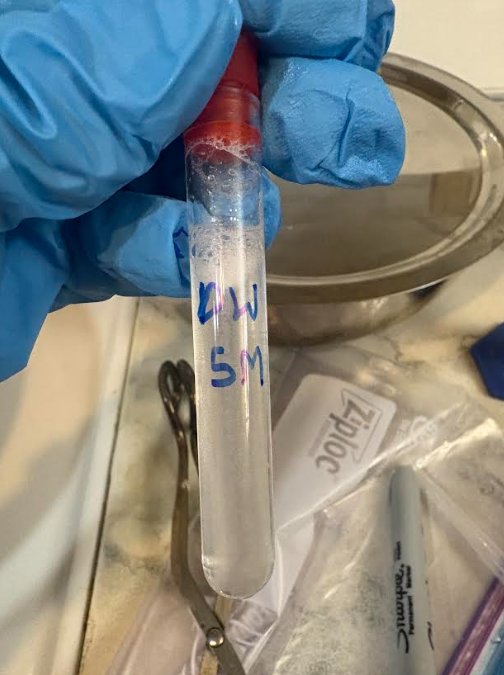 Distilled water control group 1st trial of 5M sodium chloride.
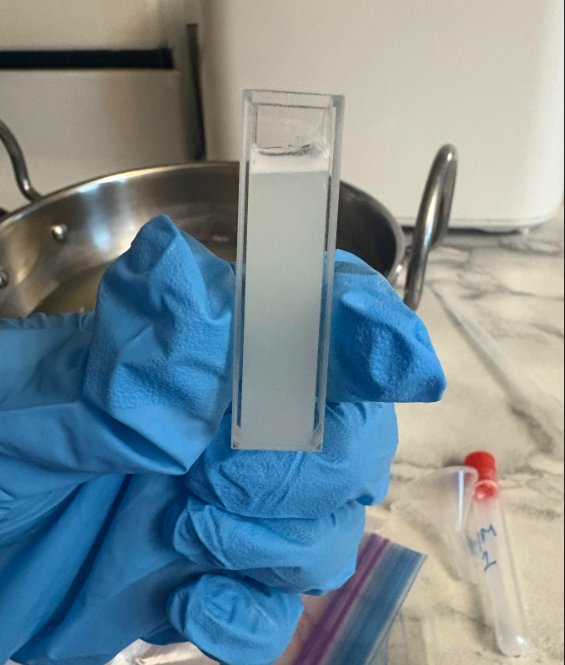 5M sample in the cuvette for measurements, first trial at 5 minutes
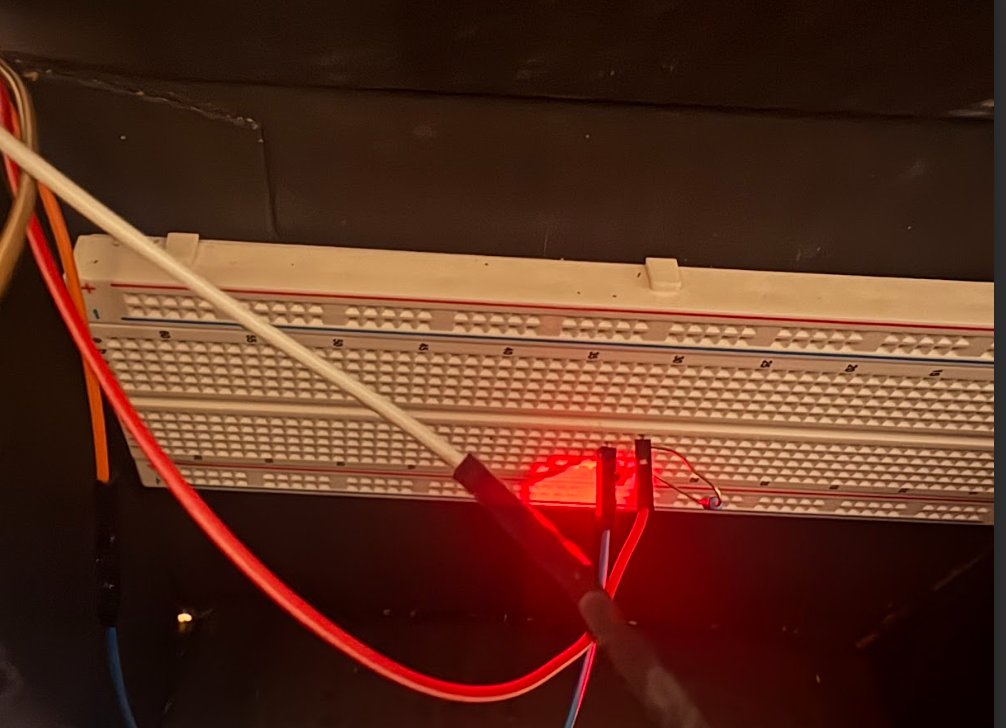 Picture how much Red light from the LED is reaching the photodiode at 5M 2nd trial 5 minutes.
 1M first trial, 10 minutes
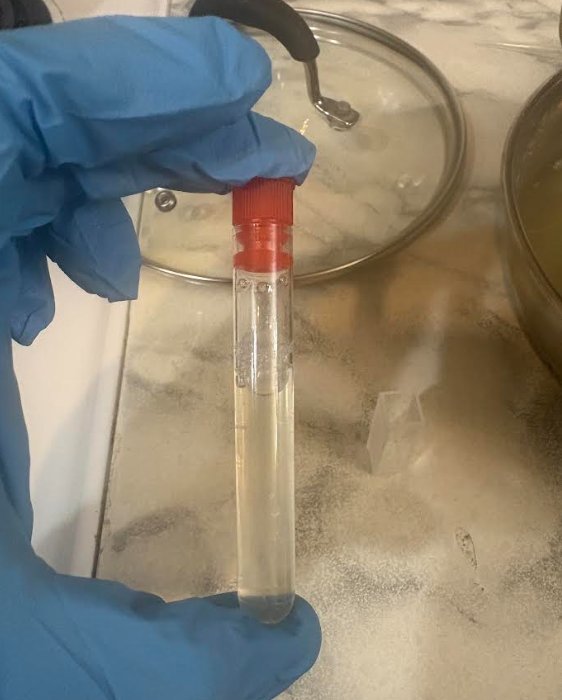 0.5M 1st trial, 10 minutes
The mean of the multiple readings taken from the turbidimeter at each time interval, trial, and salt concentration made all on Microsoft Excel. The range of the photodiode was from 0-50, 0=no light transmittance, and 50 = full light transmittance.


Analysis
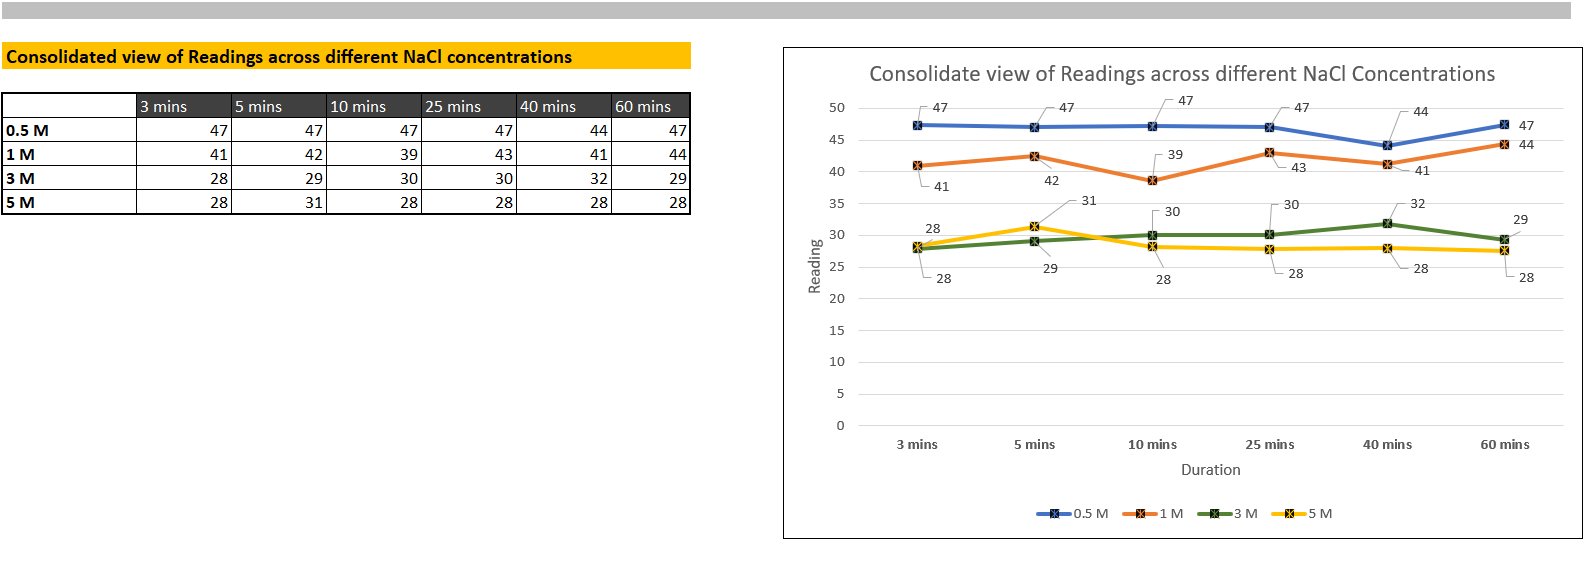
I made tables including my readings for each time interval, trial, salt concentration in a table in Excel, calculated the mean of the trials, standard deviation (how much the readings differ from the mean), standard error (how accurate my sample mean is to the 'true' mean of the population), Margin of errors, and confidence intervals, which mean that if I were to do my experiment a 100 times, 95 would fall within the confidence interval range, and the margin of error was how much my mean would vary. Additionally, I made a line graph for each salt concentration to show turbidity over time. I included standard deviation error bars on the graph to visually show how much the three trials varied.
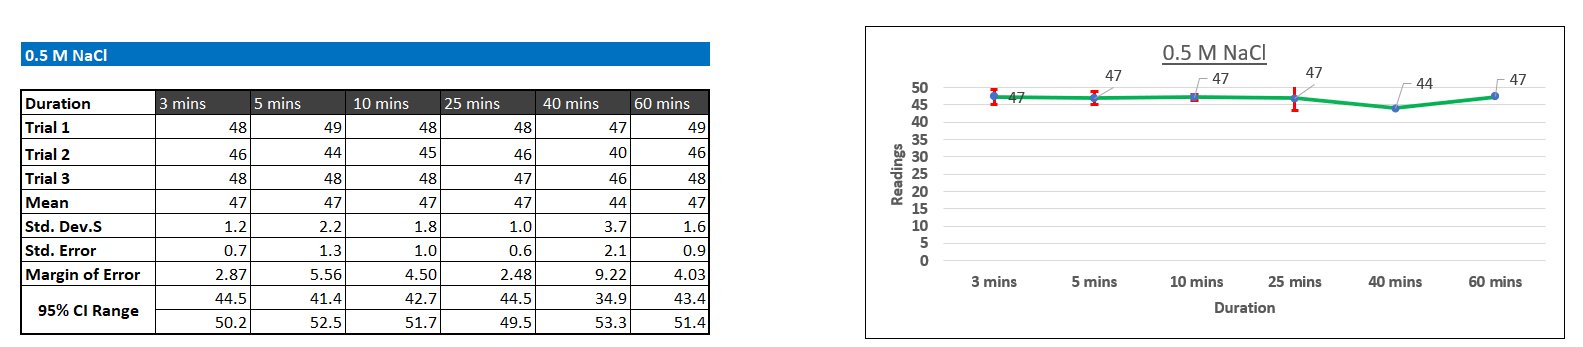
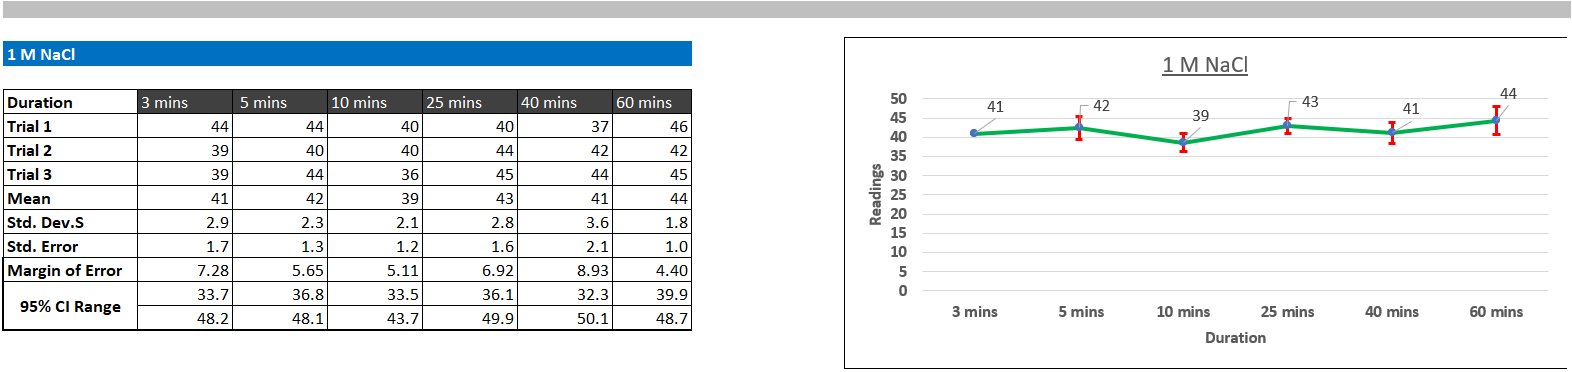
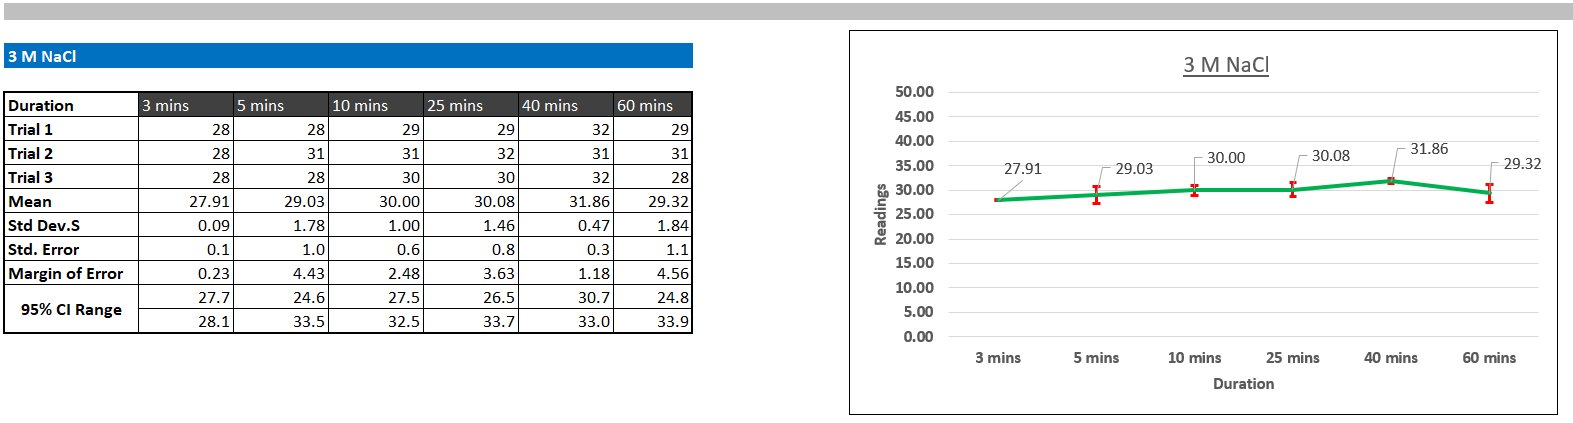
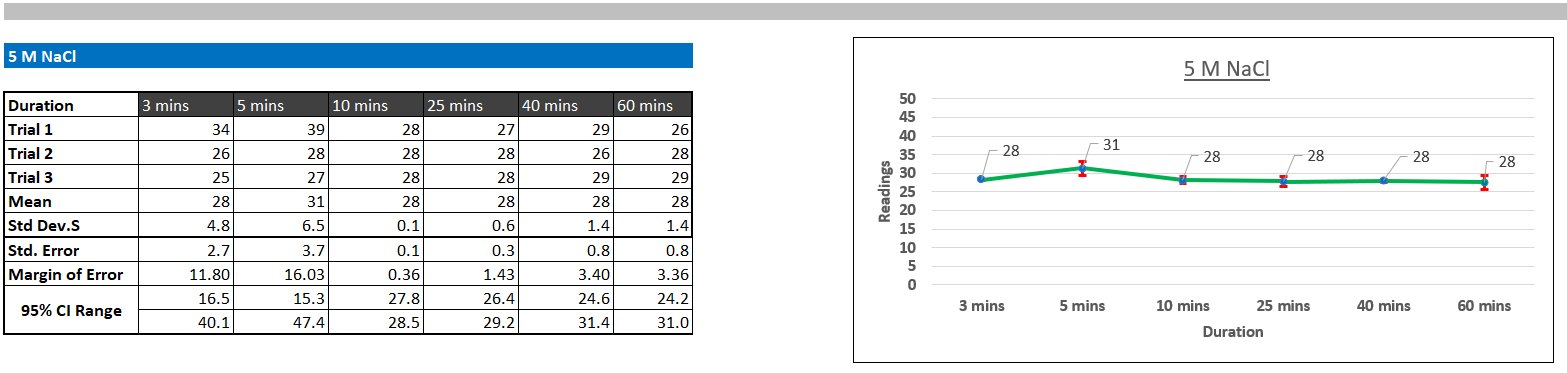
Protein aggregation turbidity did not change significantly following a set pattern over time. This suggests that most of the aggregation occurred immediately (before 3 minutes). However, visible changes in aggregation were observed. After about 20 minutes of initial addition of salt at 3M and 5M concentrations, protein particles started to settle at the bottom of the test tube, but when the sample was transferred to the cuvette for measurements, the particles redissolved. This observation suggests that even at 3M and 5M concentration, the salting-out was reversible.
I conducted a single factor analysis of variance (ANOVA) in Microsoft Excel with a tool pack edition for my final readings (at 60 mins) of each salt concentration. This test allowed me to calculate the p-value, F statistical, and F critical values of my data in order to evaluate the statistical significance of my data. A p-value is a number between 0 to 1 that expresses the likelihood of the data spread to be due to chance or an actual factor affecting the data. Similarly, an F-statistical value measures the ratio of variance between groups to the variance within groups. A higher F-statistical value means a stronger correlation between the underlying factor and the data. An F-critical value is a number that the f-statistical value must surpass in order for the result to be statistically significant. It is calculated based on the sample size, number of groups, and the chosen alpha, which is a value that if the p-value is equal to smaller than, then one is willing to believe that the results are statistically significant.

My overall p-value was approximately 0.0000007. Alpha (the threshold that the p value should be below to signify significance) was set to 0.05, which is the standard. As my p-value was significantly lower than the alpha, it signifies an extremely strong correlation of protein aggregation turbidity and salt concentrations. Additionally, my F-statistical value was 28 times larger than my F-critical value. This substantial difference further supports this strong correlation.
To assess whether the turbidity changes were due to the inherent turbidity of a salt solution or the protein aggregating, I conducted t-Test between each salt concentration's final (60 minutes) readings to its corresponding control group with only distilled water and salt in Microsoft Excel.


According to the results from the t-Test between 0.5M controlled group and the protein solution of the same salt concentration, the inherent difference in turbidity between distilled water and the protein solution was highly statistically insignificant (p = 0.7388), meaning that this difference is negligible. I used this salt concentration to formulate this claim as it was the baseline. From this understanding, the fact that the protein solution was inherently more turbid than distilled water can be ruled out due to its insignificance, and therefore it will not be considered while analyzing the t-Test of other salt concentrations.
At 1M, the readings between the distilled water control group and the protein sample was statistically insignificant (p > 0.1468), proving that no significant aggregation occurred. However, the p value of 1M is lower than that of 0.5M, meaning that at least some level of aggregation occurred.
At 3M, the readings between the distilled water control group and the protein sample was statistically significant (p < 0.00133), proving that significant aggregation did occur. The t-statistical value was approximately 1.55 times larger than the t-critical value, which further substantiates this fact. T-statistical and T-critical values have the same function as F-statistical values and F-critical values, however, t-values can only compare two groups, while f-values compare multiple groups at the same time.
At 5M, the readings between the distilled water control group and the protein sample was statistically significant (p < 0.00022), proving that aggregation was extremely strong at this concentration. The t-statistical value was approximately 4.6 times larger than the t-critical value, which further substantiates this fact.
The percentage decrease of the mean turbidity values, (at 60 minutes) of 0.5M to 1M was approximately 6.5%, between 1M to 3M, turbidity increased by 33.84%, and between 3M and 5M, turbidity increased by 5.8%. This difference follows the general trend observed in the inverse debye lengths. The largest difference is between 1M and 3M, and the difference between 0.5M and 1M is slightly larger than the difference between 3M and 5M. However, the magnitude of these differences is lower than that of the inverse debye lengths. This can be attributed to the presence of ovomucoid, the high zeta potential of lysozyme at pH 4.9, its low concentration, or the fact that the hydration shield around the lysozyme particles protected them from electrostatic screening aggregation.
I conducted a One Sample t-Test, which is used to compare experimental trials to one theoretical value on Excel. The p-values for the percentage increases in turbidity between 0.5M vs. 1M was p = 0.00039, 1M vs. 3M was p = 0.15583, 3M vs. 5M was p = 0.07111.

This means that up until 1M concentration, Non-Inverse debye length factors such as lysozyme’s hydration shield, ovomucoid’s stabilization, high zeta potential of lysozyme, and or its low concentration significantly protected lysozyme from electrostatic screening aggregation (p = 0.00039). This proves that at lower salt concentrations, non-Inverse debye length factors play a significant role in inhibiting aggregation. However, at medium salt (1M vs. 3M) concentrations, these factors fail to mitigate the effects of electrostatic screening on protein aggregation (p = 0.15583). At higher salt concentrations (3M vs. 5M), the role of the external factors was insignificant (p = 0.07111), however, an outlier between the third trials (-3.57% increase in turbidity) could have made the p-value higher than the “true” p-value. This supports that non-inverse debye length factors such as high zeta potential of lysozoyme, its low concentration, steric stabilization from ovomucoid, lysozyme's hydration shield, protect lysozyme from aggregation at low salt concentrations. More controlled experiments would be needed to investigate the effects of these factors individually.
The differences in turbidity (at 60 mins) among the salt concentrations were tested using the post-hoc Tukey test to evaluate the statistical significance of these differences. As Excel does not have a built in Tukey test, I used the key values from the ANOVA and a q table, which is a standardized table that provides critical values for analysis based on the number of groups being compared and degrees of freedom. The key values used from the ANOVA test are shown in the image from my Excel spreadsheet.

According to the q table, my critical q value was 4.53. Then, to calculate the HSD (Honestly Significant Difference), the q value needs to be multiplied to the square root of the mean of squares within groups divided by the number of samples in each group. For this formula, the number of samples in each group must be equal. This formula adjusts the q value to fit the specific scale and variability of the data. Once the HSD is calculated, the difference between the mean of each group is compared to the HSD. If that difference is larger or equal to the HSD, the difference is statistically significant. The calculations and comparisons are shown below in a screenshot from my Excel spreadsheet. The difference between 0.5M and 1M, and 3M and 5M was statistically insignificant. The difference between 1M and 3M was statistically significant. This aligns with visible observations.


Conclusion
Sodium Chloride concentration and protein aggregation turbidity have an extremely strong correlation. This is supported by the Analysis of Variance test. Increasing sodium chloride concentrations over 1M, aggregates protein which makes the sample more turbid. Therefore, the premise of my alternative hypothesis was correct. This aggregation turbidity plateaus after 3M. This is supported by the results from the post-hoc Tukey test. No statistically significant aggregation occurred at 0.5M and 1M. This is supported by the results from the t-Test between protein samples and distilled water control groups. Prominent differences between the 3 min, 5 min, 10 min, 25 min, 40 min, and 60 min time intervals for the salt concentrations were not observed, which suggests that the initial aggregation occured before the 3 minute mark. This was contrary to my alternative hypothesis, as I hypothesised that aggregation will increase rapidly from 3 minutes to 5 minutes. However, after about 20 minutes of initial addition of salt for 3M and 5M concentration, protein particles settled on the bottom of the test tube, however, when the sample was transferred to the cuvette, the protein particles redissolved. This illustrates that the protein precipitation was reversible. A statistically significant difference was found between the relative change in inverse Debye lengths and empirical results for 0.5M to 1M, though this difference vanished at higher concentrations (1M-3M and 3M-5M). This is contrary to my alternative hypothesis, as I thought that a statistically significant difference would also be present between 1M-3M and 3M-5M. This finding suggests that factors such as steric hindrance from ovomucoid, low lysozyme concentration, and lysozyme's hydration shield, high zeta potential of lysozyme at 4.9 pH, all protect lysozyme from aggregation at low salt concentrations. However, these factors fail to protect protein from aggregation at medium and high salt concentrations. More controlled experiments would be needed to investigate the effect of these factors individually.
Future improvements and extensions
If I were to do this experiment again, I would use a light sensor with a transimpedance amplifier so that the range of the raw values would be larger. The range of my raw values with only the photodiode was 0 to 50. If I had time to solder a light sensor like OPT101, I would have gotten a range from 0 to 1024, which would have been able to detect smaller changes in turbidity. Additionally, I would have converted the raw values into light transmittance percentages (0%-100%) instead of keeping them as raw values for a more standardized measure of turbidity. During the filtration process of my coagulated albumen, I would have used a cheesecloth instead of a coffee filter, as I could have squeezed the coagulated albumen to make the process of the filtration much faster. However, with the coffee filter, I could not squeeze them as they would rip easily and would have contaminated my extract.
To take my research further in this topic, I would conduct a lysoplate assay which measures lysozyme's enzyme activity which correlates with its structural stability. This was my original plan for this project. Due to the fact that my school was not able to obtain biological materials like the bacteria used in the lysoplate assay (Micrococcus luteus), I resorted to testing aggregation instead. This assay will help me to test the exact ionic strength thresholds at which lysozyme's enzyme functions are lost, which is the first step of lysozyme degradation on contact lenses. Additionally, I would also test different types of salts used in contact lens solutions as different types of ions have different effects on lysozyme even when the ionic strength is the same. Moreover, I would test lysozyme's denaturation behavior on contact lens surfaces, as lysozyme denatures more easily on polymer surfaces as it doesn’t have space to refold. Testing this aspect will make my findings even more applicable in the contact lens industry. Moreover, I would test the effect of osmoprotectants (which are tiny particles like glycerin) on lysozyme stability as they help protect lysozyme from osmotic stress due to high levels of salt. Many contact lens solutions use osmoprotectants to ensure that lysozyme stays native.
Application
My experiment's findings have many applications in vision science, clinical practice, and innovation. Firstly, the finding that protein aggregation turbidity did not increase from 0.5M to 1M, at statistically significant rate as the inverse debye length model, suggests that physiologically relevant non-electrostatic screening factors play a significant role in preventing aggregation at lower salt concentrations. This insight may guide pharmaceutical industries to consider factors such as steric stabilization, and lysozyme’ protective hydration shield when formulating contact lens solutions and eye drops, rather than just electrostatic screening principles. Secondly, the plateauing of aggregation at higher salt concentrations suggests that aggregation level on contact lenses or the ocular surface may not reflect the level of osmotic exposure. Clinically, this implies that similar observable levels of protein aggregation on contact lenses or the ocular surface between patients may arise from different levels underlying osmotic stresses. As aggregation severity may not fully reflect exposure to high ionic strengths, more nuanced evaluation would be needed. Thirdly, the statistically significant protective role of steric hindrance and lysozyme’s hydration shield supports implementing these mechanistic factors in contact lens material design, contact lens solution and eye drop formulation, all of which may help mitigate lysozyme aggregation. Fourth, the finding that most aggregation occurred within the first three minutes of high ionic exposure, supports rapid aggregation at high salt concentrations. This suggests that even short-term exposure to high ionic strengths may initiate aggregation on contact lenses and the ocular surface. Clinically, this supports the importance of protecting the eyes from osmotic stress. Additionally, the dissolvable precipitation at 3M and 5M sodium chloride indicates that early-stage precipitation may be reversible. This supports the importance of rewetting drops, which may help reduce reversible aggregation before permanent aggregation and precipitation occurs. Finally, all of these findings reinforce the risks of improperly prepared saline for contact lens and ocular use. Because high salt concentrations are strongly correlated with protein aggregation, even small differences in salt concentrations may disturb ocular homeostasis and promote protein aggregation. This supports the recommendations against the use of homemade saline for contact lens. A key limitation that the samples were tested at pH 4.9, which makes lysozyme more stable than it is at physiological pH needs to be considered, so aggregation occurred at a lower rate than it would in a healthy tear film.
Sources Of Error
Bubbles: The transfer process of the sample from the test tube into the cuvette using a pipet, created bubbles. These bubbles could have potentially affected the light intensity readings from the photodiode.
Sample-to-sample variation due to heterogeneity: Although I used the same batch of crude extract for all of my samples, the fact that a protein solution is heterogeneous could have resulted in different samples having slightly different protein concentrations.
Human error: A graduated cylinder was used. This instrument poses an error potential in human reading and precision leading to a potential risk of different samples having slightly different volumes (plus or minus 0.5 ml)
Salt not being fully dissolved: Although test tubes were inverted 15-20 times to ensure all salt particles were dissolved, some salt particles were stuck on the test tubes’ walls. This poses a minimal difference in salt concentrations among the trials.
The transfer of salt with a funnel: After salt was measured using a digital weighting scale, the salt was poured into the test tube using a funnel. Some salt particles were stuck inside the funnel, resulting in salt concentrations varying slightly among trials.
Limitations
Small range of the photodiode: The photodiode used only had a range of 0 to 50 due to the lack of a transmittance amplifier. This range was enough to show relative changes among the samples, however, was not precise enough to measure small changes.
Uncalibrated turbidimeter: A professional grade turbidimeter or spectrophotometer was not accessible, so my design could not be calibrated against formal lab equipment. Therefore, the readings of the turbidimeter were used to quantify relative change rather than absolute change.
NaCl was not pure: As pure NaCl was difficult to obtain, Windsor table salt was used. This is a high quality table salt that is 99% sodium chloride, however, it does contain 1% of components such as calcium silicate, sugar, and potassium iodide. These tiny components could have interfered with the aggregation process.
Not knowing the exact concentrations of the proteins: Due to not having access to lab grade purified hen egg white lysozyme, a crude extract of lysozyme (and ovomucoid) was purified through isoelectric thermal precipitation of albumen (egg white). This method cannot eliminate all impurities in the extract such as carbohydrates, sugars, tiny amounts of ovalbumin or conalbumin. Additionally, this method only allows us to form estimates of protein concentrations, but not measure them exactly. Moreover, specifically which protein were aggregating (lysozyme, ovomucoid, or both together) could not be determined as the sample had two major proteins.
Inability to test <0.5 M salt: Because lysozyme and ovomucoid have opposite charges, 0.5 M salt was necessary to prevent lysozyme and ovomucoid from coagulating together in the precipitation process of albumen (egg white). Therefore, salt concentrations below 0.5M could not be tested.
Inability to test lysozyme at physiological tear pH: Because buffering the lysozyme extract to neutral pH would result in a neutralization reaction, in which a salt would be produced. This extra salt would have increased the ionic strength of the solution in an uncontrolled manner. Therefore, the solution could not be tested at physiological pH.
Citations
1. Gerard\, J. (2025\, December 23). Psychological factors influencing patient adherence to contact lens care regimens. AIHCP. https://aihcp.net/2025/12/23/psychological-factors-influencing-patient-adherence-to-contact-lens-care-regimens/
2. Fogt\, J.\, Roth\, M.\, & Gardner\, H. (2024). How can we better inform patients of the importance of contact lens compliance?: Current perspectives. Clinical Optometry\, Volume 16\, 267–286. https://doi.org/10.2147/opto.s405204
3. Annunziata\, O.\, Payne\, A.\, & Wang\, Y. (2008). Solubility of lysozyme in the presence of aqueous chloride salts: Common-Ion effect and its role on solubility and crystal thermodynamics. Journal of the American Chemical Society\, 130(40)\, 13347–13352. https://doi.org/10.1021/ja804304e
4. Saari\, K. M.\, Aine\, E.\, Posz\, A.\, & Klockars\, M. (1983). Lysozyme content of tears in normal subjects and in patients with external eye infections. Graefe S Archive for Clinical and Experimental Ophthalmology\, 221(2)\, 86–88. https://doi.org/10.1007/bf02133813
5. All about the Turbidity-Based lysozyme activity assay. (2023\, August 22). GoldBio. https://www.goldbio.com/blogs/articles/all-about-the-turbidity-based-lysozyme-activity-assay#:~:text=Calculating%20lysozyme%20activity%20depends%20on,can%20then%20be%20represented%20graphi
6. K + S Windsor Salt Ltd. (n.d.). Safety Data Sheet. In Safety Data Sheet. https://riepertsalt.com/wp-content/uploads/2025/07/Windsor-Water-Conditioner-Pellets-MSDS.pdf
7. Cirkit Design. (n.d.). Cirkit Designer Tutorials. https://docs.cirkitdesigner.com/component/fbbba498-5a3a-467d-8405-4735bc62cdd4/opt101-light-sensor
8. YeasenMarketing. (2025\, August 21). Production Process and Usage Guide of Lysozyme. Yeasen - Leading Innovation in Molecular Enzymes and Reagents. https://www.yeasenbio.com/blogs/enzyme/production-process-and-usage-guide-of-lysozyme
9. Bollar\, T. (2025\, October 20). What is Contact solution made of? A simple guide. Contact Lens HQ. https://contactlenshq.com/what-is-contact-solution-made-of/#:~:text=A%20Simple%20Guide,-ALL&text=At%20its%20core%2C
10. Nucleus Biology. (2021\, December 1). Van der Waals Forces [Video]. YouTube. https://www.youtube.com/watch?v=x8PpLlKI2yo
11. Bellissent-Funel\, M.\, Hassanali\, A.\, Havenith\, M.\, Henchman\, R.\, Pohl\, P.\, Sterpone\, F.\, Van Der Spoel\, D.\, Xu\, Y.\, & Garcia\, A. E. (2016). Water determines the structure and dynamics of proteins. Chemical Reviews\, 116(13)\, 7673–7697. https://doi.org/10.1021/acs.chemrev.5b00664
12. Arnaudov\, L. N.\, & De Vries\, R. (2004). Thermally induced fibrillar aggregation of hen egg white lysozyme. Biophysical Journal\, 88(1)\, 515–526. https://doi.org/10.1529/biophysj.104.048819
13. All about the Turbidity-Based lysozyme activity assay. (2023b\, August 22). GoldBio. https://www.goldbio.com/blogs/articles/all-about-the-turbidity-based-lysozyme-activity-assay#:~:text=Calculating%20lysozyme%20activity%20depends%20on,can%20then%20be%20represented%20graphically.
14. Contact lens care & compliance. (2023\, November 30). PentaVision. https://www.clspectrum.com/issues/2013/december/contact-lens-care-compliance/
15. VanDerMeid\, K.\, Byrnes\, M. G.\, Millard\, K.\, Scheuer\, C.\, Phatak\, N.\, & Reindel\, W. (2024). Comparative analysis of the osmoprotective effects of daily disposable contact lens packaging solutions on human corneal epithelial cells. Clinical Ophthalmology\, Volume 18\, 247–258. https://doi.org/10.2147/opth.s437841
16. Scheuer\, C. A.\, Barniak\, V. L.\, Phatak\, N. R.\, Rah\, M. J.\, & Reindel\, W. (2023). Effect of contact lens solutions in stabilizing the activity of tear lysozyme. Clinical Optometry\, Volume 15\, 119–127. https://doi.org/10.2147/opto.s404261
17. Contact lens care & compliance. (2023c\, November 30). PentaVision. https://www.clspectrum.com/issues/2013/december/contact-lens-care-compliance/
18. Bausch + Lomb Biotrue Hydration Plus Multi-Purpose Solution\, 10 fl oz/296 mL Ingredients and Reviews. (n.d.). SkinSAFE. https://www.skinsafeproducts.com/bausch-lomb-biotrue-hydration-plus-multi-purpose-solution-10-fl-oz-296-ml#:~:text=Product%20is%20Teen%20Safe%20and,Potassium
19. Dalton\, K.\, Subbaraman\, L. N.\, Rogers\, R.\, & Jones\, L. (2008). Physical properties of soft contact lens solutions. Optometry and Vision Science\, 85(2)\, 122–128. https://doi.org/10.1097/opx.0b013e318162261e
20. Stahl\, U.\, Willcox\, M.\, & Stapleton\, F. (2010). Role of hypo-osmotic saline drops in ocular comfort during contact lens wear. Contact Lens and Anterior Eye\, 33(2)\, 68–75. https://doi.org/10.1016/j.clae.2010.01.001
21. Mph\, B. H. W. O. (2020\, May 15). The how and why of contact lens deposits. https://www.reviewofcontactlenses.com/article/the-how-and-why-of-contact-lens-deposits#:~:text=Lotions%20transferred%20from%20fingertips%20and,with%20lens%20discoloration%20in%20SCLs.
22. De Souza\, E. (n.d.). Chapter 17: Contact Lens Deposits. In Contact Lens Deposits (pp. 244–245). https://contamac.com/wp-content/uploads/2024/12/In-Contact_Chapter-17.pdf
23. Increased recovery of non-bacterial pathogens in contact lens-associated ulcerative keratitis. (2008\, January 25). Ocular Surgery News. https://www.healio.com/news/ophthalmology/20120331/increased-recovery-of-non-bacterial-pathogens-in-contact-lens-associated-ulcerative-keratitis#:~:text=As%20technology%20improved%2C%20manufacturers%20developed,organism%20colonization%20on%20the%20lens.
24. Heynen\, M.\, Ng\, A.\, Martell\, E.\, Subbaraman\, L. N.\, & Jones\, L. (2021). Activity of deposited lysozyme on contemporary soft contact lenses exposed to differing lens care systems. Clinical Ophthalmology\, Volume 15\, 1727–1733. https://doi.org/10.2147/opth.s296116
25. Luensmann\, D.\, Heynen\, M.\, Liu\, L.\, Sheardown\, H.\, & Jones\, L. (2010\, January 20). The efficiency of contact lens care regimens on protein removal from hydrogel and silicone hydrogel lenses. https://pmc.ncbi.nlm.nih.gov/articles/PMC2808856/#sec6
26. Snyder\, J. A.\, & Fritsch\, D. (1981). Two reliable and inexpensive lysozyme assays for teaching enzymology and microbiology. In Furman University & Virginia Commonwealth University\, Chapter 11. Unknown. https://www.ableweb.org/biologylabs/wp-content/uploads/volumes/vol-3/11-snyder.pdf
27. FAAO\, C. W. S. O. (2010\, October 18). The truth about lysozyme. https://www.reviewofcontactlenses.com/article/the-truth-about-lysozyme#:~:text=Tear%20proteins%20include%20lysozymes%2C%20lactoferrin,problem%20when%20the%20protein%20denatures.
28. Garajová\, K.\, Balogová\, A.\, Dušeková\, E.\, Sedláková\, D.\, Sedlák\, E.\, & Varhač\, R. (2016). Correlation of lysozyme activity and stability in the presence of Hofmeister series anions. Biochimica Et Biophysica Acta (BBA) - Proteins and Proteomics\, 1865(3)\, 281–288. https://doi.org/10.1016/j.bbapap.2016.11.016
29. Jones\, L.\, Senchyna\, M.\, Glasier\, M.\, Schickler\, J.\, Forbes\, I.\, Louie\, D.\, & May\, C. (2003). Lysozyme and lipid deposition on silicone hydrogel contact lens materials. Eye & Contact Lens Science & Clinical Practice\, 29(1 Suppl)\, S75–S79. https://doi.org/10.1097/00140068-200301001-00021
30. Science Insights Team. (2025\, November 10). How Lysozyme Destroys Bacteria and Protects the Body - ScienceInsights. ScienceInsights. https://scienceinsights.org/how-lysozyme-destroys-bacteria-and-protects-the-body/
31. Leake\, L.\, & Karel\, M. (1982). Polymerization and denaturation of lysozyme exposed to peroxidizing lipids. Journal of Food Science\, 47(3)\, 737–743. https://doi.org/10.1111/j.1365-2621.1982.tb12703.x
32. Contact Lenses 101\, Part 1: Contact lens materials. (n.d.). CooperVision Practitioner. https://coopervision.com/practitioner/ecp-viewpoints/technicians-and-staff/contact-lenses-101-part-1-contact-lens-materials
33. Contact lens material properties. (2017\, January 31). Contact Lens Update. https://contactlensupdate.com/2017/01/31/contact-lens-material-properties/
34. “GENERIC” SOFT CONTACT LENSES: SCIENTIFIC\, CLINICAL\, AND REGULATORY MATTERS. (2023\, December 19). PentaVision. https://clspectrum.com/issues/2021/march/generic-soft-contact-lenses-scientific-clinical-and-regulatory-matters/
35. Du\, H.\, Liu\, Z.\, Jennings\, R.\, & Qian\, X. (2016). The effects of salt ions on the dynamics and thermodynamics of lysozyme unfolding. Separation Science and Technology\, 52(2)\, 320–331. https://doi.org/10.1080/01496395.2016.1229336
36. Chang\, H.\, Yang\, C.\, & Chang\, Y. (2000). Rapid Separation of Lysozyme from Chicken Egg White by Reductants and Thermal Treatment. Journal of Agricultural and Food Chemistry\, 48(2)\, 161–164. https://doi.org/10.1021/jf9902797
37. Wang\, L.\, Li\, R.\, Lv\, S.\, Liu\, Y.\, Fang\, S.\, Zang\, J.\, Qing\, M.\, & Chi\, Y. (2025). The thermodynamic and gelation properties of ovalbumin and lysozyme. Gels\, 11(6)\, 470. https://doi.org/10.3390/gels11060470
38. Takahashi\, D.\, Nishimoto\, E.\, Murase\, T.\, & Yamashita\, S. (2008). Protein-Protein interaction on lysozyme crystallization revealed by rotational diffusion analysis. Biophysical Journal\, 94(11)\, 4484–4492. https://doi.org/10.1529/biophysj.107.111872
39. McCanna\, D. J.\, Oh\, S.\, Seo\, J.\, Coles-Brennan\, C.\, Fadli\, Z.\, Subbaraman\, L. N.\, & Jones\, L. W. (2018). The effect of denatured lysozyme on human corneal epithelial cells. Investigative Ophthalmology & Visual Science\, 59(5)\, 2006. https://doi.org/10.1167/iovs.17-22260
40. Grudzielanek\, S.\, Velkova\, A.\, & Shukla\, Anuj. (2007). Cytotoxicity of Insulin within its Self-assembly and Amyloidogenic Pathways. Journal of Molecular Biology (JMB)\, Volume 370(Issue 2\,)\, 372–384. https://doi.org/10.1016/j.jmb.2007.04.053
41. Olaf [Zschörnig]\, Paasche\, G.\, & Thieme\, C. (2005). Modulation of lysozyme charge influences interaction with phospholipid vesicles. ScienceDirect\, Volume 42(Issue 1)\, 69–78. https://www.sciencedirect.com/science/article/abs/pii/S0927776505000524#:~:text=One%20of%20the%20main%20conclusions,5%5D%2C%20%5B29%5D
42. Eye Focus Optometrist. (2024\, June 26). Types of Solutions for Cleaning Contact Lenses. https://www.eyefocus.com.au/s/stories/types-of-solutions-for-cleaning-contact-lenses-3?srsltid=AfmBOoqHL5qDULa8_59kXrmPPZ4TmTi254LGPzK3DJ4Kr0fAL1_d4BOY
43. FAAO\, C. W. S. O. (2010\, October 18). The truth about lysozyme. https://www.reviewofcontactlenses.com/article/the-truth-about-lysozyme#:~:text=Tear%20proteins%20include%20lysozymes%2C%20lactoferrin,problem%20when%20the%20protein
44. Omali\, N. B.\, Subbaraman\, L. N.\, & Heynen\, M. (2018). Surface versus bulk activity of lysozyme deposited on hydrogel contact lens materials in vitro. Contact Lens Journal\, Contact Lens & Anterior Eye Journal\, Volume 41(Issue 4)\, 329–334. https://doi.org/10.1016/j.clae.2018.03.005
45. Chang\, K. Y.\, & Carr\, C. W. (1971). Studies on the structure and function of lysozyme: I. The effect of pH and cation concentration on lysozyme activity. ScienceDirect\, Biochimica Et Biophysica Acta (BBA) - Protein Structure\, Volume 229(Issue 2)\, Pages 496-503. https://doi.org/10.1016/0005-2795(71)90210-8
46. Du\, H.\, Liu\, Z.\, Jennings\, R.\, & Qian\, X. (2016). The effects of salt ions on the dynamics and thermodynamics of lysozyme unfolding. Separation Science and Technology\, 52(2)\, 320–331. https://doi.org/10.1080/01496395.2016.1229336
47. Chang\, H.\, Yang\, C.\, & Chang\, Y. (2000). Rapid Separation of Lysozyme from Chicken Egg White by Reductants and Thermal Treatment. Journal of Agricultural and Food Chemistry\, 48(2)\, 161–164. https://doi.org/10.1021/jf9902797
48. What is a dielectric constant? How does water have a dielectric constant? (n.d.). Quora. https://www.quora.com/What-is-a-dielectric-constant-How-does-water-have-a-dielectric-constant
49. Omali\, N. B.\, & Subbaraman\, L. N. (2018). Surface versus bulk activity of lysozyme deposited on hydrogel contact lens materials in vitro. ScienceDirect\, Contact Lens and Anterior Eye\, Volume 41(Issue 4)\, 329–334. https://doi.org/10.1016/j.clae.2018.03.005
50. - YouTube. (n.d.). https://www.youtube.com/shorts/858RhPi14FU
51. Science Buddies. (2022\, October 20). How to Blink an LED with Arduino (Lesson #2) [Video]. YouTube. https://www.youtube.com/watch?v=FKekzzj5844
52. Ask About Phones & Apps. (2024\, March 3). What solution removes protein from contacts? [Video]. YouTube. https://www.youtube.com/watch?v=DroON8VHEm8
53. Ophthalmology In Hindi. (2025\, June 4). 🔴 Soft Contact Lens types & wearing time explained in Hindi | Contact Lens Full Guide | Hydrogel CL🔴 [Video]. YouTube. https://www.youtube.com/watch?v=BUjj3eTwGDQ
54. Dr. EyeGuy. (2023\, September 28). Contacts: daily vs monthly (Which is better?) [Video]. YouTube. https://www.youtube.com/watch?v=AROyk0aGm44
55. Dr Saud Javed. (2023\, September 24). Tear Film & Contact Lens Interaction | AK Khurana | Dr Saud Javed [Video]. YouTube. https://www.youtube.com/watch?v=PcQIvAiD5I8
56. Eyes On Eyecare - Optometry. (2023\, October 12). Maintaining tear film homeostasis in soft contact lens wear [Video]. YouTube. https://www.youtube.com/watch?v=28qf0V0c1SQ
57. Good Optometry Morning: EYE CARE MADE simple. (2020\, December 17). TYPES OF SOFT CONTACT LENSES: modalities & materials of soft contacts [Video]. YouTube. https://www.youtube.com/watch?v=2JHQmwvEcj0
58. Dr. EyeGuy. (2021\, May 28). Best contact lens solutions for beginners and dry eyes [Video]. YouTube. https://www.youtube.com/watch?v=S3QZsTtDKt4
59. Doctor Eye Health. (2019\, March 7). Best Contact Solution - Best contact lens solution for dry eyes [Video]. YouTube. https://www.youtube.com/watch?v=tgG_Sl_msUw
60. Joel Hayden. (2020\, November 30). Best Contact Lens Solution [Video]. YouTube. https://www.youtube.com/watch?v=W9zXo0L04D8
61. chemistry by gupta sir. (2021\, April 7). Lecture 25: Mechanism of Lysozyme\, Chemistry of Lysozyme [Video]. YouTube. https://www.youtube.com/watch?v=xuz5yOJxktQ
62. Amoeba Sisters. (2018\, September 24). Protein structure and folding [Video]. YouTube. https://www.youtube.com/watch?v=hok2hyED9go
63. Animated biology With arpan. (2020\, January 4). Salting in and salting out | How does salting out happen? | what is salting in of proteins? [Video]. YouTube. https://www.youtube.com/watch?v=gnhUh6qVD5Y
64. Shomu’s Biology. (2016\, February 28). Salting In and Salting Out of proteins [Video]. YouTube. https://www.youtube.com/watch?v=q8zg6X7hc9U
65. Walter Jahn. (2015\, September 14). FACTORS THAT DENATURE ENZYMES [Video]. YouTube. https://www.youtube.com/watch?v=1uhYxS60ILE
66. Cognito. (2022\, May 1). GCSE Biology - Enzymes - How Temperature and pH Affect Rate of Reaction (2026/27 exams) [Video]. YouTube. https://www.youtube.com/watch?v=n9He_FK6nao
67. Professor Dave Explains. (2016\, August 27). Protein structure [Video]. YouTube. https://www.youtube.com/watch?v=EweuU2fEgjw
68. Magnet Brains. (2024\, September 17). Denaturation of Protein - Biomolecules | Class 12 Chemistry Chapter 10 | CBSE 2025-26 [Video]. YouTube. https://www.youtube.com/watch?v=G1ImoulFcVU
69. StatQuest with Josh Starmer. (2020\, March 23). p-values: What they are and how to interpret them [Video]. YouTube. https://www.youtube.com/watch?v=vemZtEM63GY
70. StatQuest with Josh Starmer. (2020b\, July 6). Hypothesis testing and the null hypothesis\, clearly explained!!! [Video]. YouTube. https://www.youtube.com/watch?v=0oc49DyA3hU
71. J David Eisenberg. (2011\, July 29). Analysis of Variance (ANOVA) [Video]. YouTube. https://www.youtube.com/watch?v=ITf4vHhyGpc
72. Insight 👀. (2020\, June 17). Anatomy of tear film [Video]. YouTube. https://www.youtube.com/watch?v=f4ECnoXfOY4
73. TileStats. (2021\, October 13). Post hoc test | Tukey’s test and Dunnett’s test – Explained [Video]. YouTube. https://www.youtube.com/watch?v=5pPd2rLS1GU
74. Steven Bradburn. (2020\, February 19). How To Calculate Cohen’s d In Excel [Video]. YouTube. https://www.youtube.com/watch?v=zUmQ2PZZRJ4
75. ODG. (2025\, October 22). A Beginner’s Guide to LED resistor calculation. Origin Data Global Limited. https://www.origin-ic.com/blog/what-does-a-resistor-do-led-resistor-calculation-guide/48167#heading-19
76. Resistors in series\, Electronic Tutorials. https://www.electronics-tutorials.ws/resistor/res_3.html
77. MilliporeSigma. (n.d.). Enzymatic Assay of Lysozyme (EC 3.2.1.17). https://www.sigmaaldrich.com/CA/en. https://www.sigmaaldrich.com/CA/en/technical-documents/protocol/protein-biology/enzyme-activity-assays/enzymatic-assay-of-lysozyme
78. Le\, K. (2013). Effectiveness of varying pH levels and salt concentration on lysozyme crystallization. http://cot-digm-web.cougarnet.uh.edu/~kle10/assets/biochempaper.pdf
79. Baudouin\, C.\, Aragona\, P.\, & Messmer\, E. M. (2013). Role of hyperosmolarity in the pathogenesis and management of dry eye disease: Proceedings of the OCEAN Group meeting. ScienceDirect\, the Ocular Surface\, Volume 11(Issue 4)\, Pages 246-258. https://www.sciencedirect.com/science/article/pii/S1542012413000906
80. NPTEL IIT Guwahati. (2021\, February 10). LEC 14 : Kinetics of Protein Aggregation [Video]. YouTube. https://www.youtube.com/watch?v=1zRZO_OM8hI
81. Educational Hub. (2023\, January 10). How to conduct One Sample t-test in Excel | Step by Step Guide [Video]. YouTube. https://www.youtube.com/watch?v=Cw7ae6yIoKU
82. Valle-Delgado\, J. J.\, Molina-Bolívar\, J. A.\, & González\, F. G.-. (2011). Evidence of hydration forces between proteins. ScienceDirect\, Current Opinion in Colloid & Interface Science\, Volume 16(Issue 6)\, Pages 572-578. https://www.sciencedirect.com/science/article/abs/pii/S1359029411000471
83. Trefalt\, G.\, Borkovec\, M.\, Derjaguin\, Landau\, Vervey\, and Overbeek\, Evert Verwey\, & Jan Overbeek. (2014). Overview of DLVO Theory. https://colloid.ch/grouppage/pdf/Overview_DLVO_Theory1.pdf
84. Joseph Feser. (2020\, January 22). Charge double layers 6: Debye screening length example [Video]. YouTube. https://www.youtube.com/watch?v=tRZcraR7Avo
85. DRx.Deepak Pharma. (2022\, November 29). dlvo theory of colloids/dlvo theory in physical pharmaceutics 2/dlvo theory notes/dlvo theory #notes [Video]. YouTube. https://www.youtube.com/watch?v=dblV2boFCZs
86. P2 Passion and Progress. (2023\, March 25). dlvo theory ll Primary minimum & Secondary minimum ll potential barrier ll b pharma 4th sem [Video]. YouTube. https://www.youtube.com/watch?v=VRFAFyROtO4
87. Dumetz\, A. C.\, Chockla\, A. M.\, & Kaler\, E. W. (2008). Protein Phase Behavior in Aqueous Solutions: Crystallization\, Liquid-Liquid Phase Separation\, Gels\, and Aggregates. Biophysical Journal\, Volume 94(Issue 2)\, 570–583. https://doi.org/10.1529/biophysj.107.116152
89. Hiroyuki. (2024). Chapter 9 - DLVO Theory of Colloid Stability. Science Direct, 37, 217–244. https://www.sciencedirect.com/science/chapter/bookseries/abs/pii/B9780443161162000096
Acknowledgement
I would like to thank Mr. Webster and Ms. Easton for giving me the opportunity to participate in the Science fair and guiding me along the journey of my project. I would also like to acknowledge the generosity of Mr. Mac and Ms. Easton who let me borrow electronic materials for my turbidimeter and a kitchen scale for my experiment. I am grateful to my parents for encouraging and supporting me all throughout my journey for making these ideas come to life!
I used AI tools like Gemini, Google AI search, and ChatGPT to help in finding academic sources, answer any questions I had about them, and clarify concepts. Additionally, I used AI tools to help me better understand the values present in the inverse debye length formula. Moreover, Gemini helped me make my project title interesting and catchy. I cross-verified AI generated responses from multiple prompt types, language models, published literature, and informatory sources. I used scribbr's citation generator in APA format to format my citations.