Smarter than a SPARK...Machine Learning and Wildfire Prediction
Nathan Chu
Westmount Mid/High School
Grade 7
Presentation
Problem
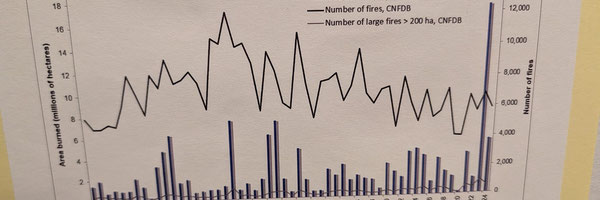
Each year, fires threaten forests, wildlife, communities and air quality, causing economic and ecological damage. With quickly changing weather conditions, predicting where and how severe a wildfire might be is challenging. The National Forestry Database shows that over 8000 fires occur each year, and burn an average of over 2.1 million hectares.
I wanted to research if Artificial Intelligence (AI) — computer systems designed to perform tasks that normally require human intelligence, such as pattern recognition, learning, and decision-making — could be used to help us better predict where to focus our efforts to help control wildfires?
I wanted to answer the question "Can AI and Machine Learning (ML) accurately predict wildfires?"
Method
- Google Scholar search
- Keywords: “Machine Learning” AND “Wildfire Prediction”
- A review article on “Machine Learning Applications in Wildfire Science and Management” was identified.
- 300 relevant publications were identified from 1996 to 2019
- Studies referenced in the review article were reviewed if available
- Medline (OVID search) was utilized with the same keyword search, filtered to studies from 2020 to present. Search was limited to articles published in English.
Research
Research:
Fire occurrence prediction (FOP) models dates back 100 years. FOP models usually use regression methods to relate response variables, such as fire reports or hotspots, to weather, lightning, and other covariates for a geographic unit. The ML method most commonly used in studies predicting fire occurrence were Artificial Neural Networks (ANN).5 The basic unit of an ANN is a neuron, also called a perception or logistic unit. A neuron involves a set of inputs which are combined linearly through multiplication with weights associated with the input resulting in an output signal.5
In 1996, an ANN for human-caused wildfire prediction in Whitecourt Provincial Forest of Alberta, Canada, accurately predicted 85% of no-fire observations and 78% of fire observations. A 314 fire and no-fire data set for the period of 1986 to 1990 was used for training. The model was then tested using data from the 1991 to 1992 fire seasons, which had 58 observed fires. The input variables were the Canadian Fire Weather Index for the day, area in km2 of the geographic zone, and district.9 This study showed that human-caused fires are predictable when enough environmental and human-activity data are included. It is often cited because it was one of the first applications of AI in wildfire prediction. It laid the groundwork for modern wildlife ML research.
A 2017 study in Yunnan Province, China found that a cost-sensitive Random Forest (RF) analysis outperformed ANN models for predicting wildfire ignition susceptibility. This study performed wildfire susceptibility assessment using multiple methods, including logistic regression, probit regression, an ANN and a RF algorithm. Sample ratio of ignition and nonignition data was investigated from 2002 to 2010. Nonignition data included meteorological, landform, and vegetation variables. The models used nonignition data because ignition events were comparatively rare. The results showed a cost-sensitive RF had the highest overall accuracy (88.47%) for all samples, and 94.23% accuracy for ignition prediction. The ANN had an accuracy of 83.78% for predicting wildfire ignitions, but only 78.44% for predicting nonignitions. The predication accuracy, variable importance, and spatial pattern of each model result were evaluated and compared for class percentage of true positive (TP), true negative (TN), false positive (FP), and false negative (FN).
True positive: RF-cost sensitive (94.23%) > RF (84.26%) > ANN (83.78%) True negative: RF-cost sensitive (88.4%) > RF (88.35%) > ANN (78.44%) False positive: RF-cost sensitive (11.6%) < RF (11.65%) < ANN (21.56%)
The factors that influence Yunnan wildfire occurrence the most were forest coverage ratio, month / season (temporal patterns), surface roughness (obtained from the Climate Forest System Reanalysis - CFSR), humidity measures ( minimum of the 6 h humidity over 10 days) , temperature measures (maximum of the 6 h average temperatures over 10 days).
A RF is a model composed of many individually trained decision tress (DT). A DT is a set of if-then-else rules with many branches joined by decision nodes and terminated by leaf nodes. The decision node is where the tree splits into different branches, with each branch corresponding to the decision being taken by the algorithm, and the leaf nodes represents the output.5 Cost-sensitive RF is an RF adjusted to handle data imbalance (few ignitions vs many non-ignitions).10
Maximum Entropy Models (MAXENT) have also been used for fire occurrence prediction. MAXENT is a ML method used to predict where events are likely to occur based on known occurrences and environmental conditions. MAXENT was originally developed for species distribution modeling. A case study of Canton Ticino, Switzerland used this ecological niche modeling to define what atmospheric conditions are most common when fires occur (“fire days”).
They compared this approach to traditional logistic regression models and also tested different sets of input variables (e.g., temperature / humidity / wind, fire weather indices or a combination). The daily meteorological variables used are: Air Temperature in Celsius degree (T), Air Humidity in percentage value (H), Wind velocity in m/s (U), Precipitation in mm (P), coverage of sky in ratio between 0 and 1(CloudCover) and coverage of snow expressed as snow presence or absence (SnowCover). Model input variables: total rainfall over the last seven days (WeekRain), the days since the last rainfall (DaysSinceRain), the sum of the last rainfall (conse cutive days with rain) (LastRainSum), the dew point temperature (Tdew), that is the temperature to which air needs to be cooled to make air water vapour saturated [40] and the vapour pressure deficit (VPD) that is the difference between the saturation vapour pressure and the actual vapour pressure at a particular temperature.
Using combinations of variables generally improved model performance. MAXENT niche modeling showed slightly better predictive power, but results varied across different fire types (e.g., winter, summer natural, summer anthropogenic - influenced by human activity). Their results support the idea of flexible statistical and ML methods can enhance fire danger forecasting.11
An Australian study investigated trends in bush-fire frequency and set out to develop a predictive model linking climatic conditions to bush-fire occurrence. They developed a two-stage ensemble ML model using unsupervised deep learning (a multi-layered neural network to learn climatic patterns without prior labels) and supervised ensemble classification. In the first unsupervised deep learning (DL) phase, multi-layered deep neural networks [Deep Belief Neural Networks with Conventional Supervised Ensemble ML (DBNet)] were used to learn about the given data and generate simple features (from environmental and climatic surfaces) without any prior information or training targets. In the second supervised ensemble classification stage, features extracted from the first stage were fed as training inputs to 10 ML classifiers to establish the best classifier for bush fire hotspot estimation. Multiple supervised classifiers were used to learn the extracted features against the ground truth bush-fire hot spot map.5
Inputs included NASA MODIS active fire data, burn area data, and weekly climatic surfaces. Variables included: Incoming Solar Irradiance (SolarMJ), Maximum Temperature (TempMax), Minimum Temperature (TempMin), Precipitation (FWPrec), Soil Moisture Upper Layer (WRel1), Soil Moisture Lower Layer (WRel2), Evaporation Soil+Vegetation (FEW), Transpiration (FWTra), Soil Evaporation (FWSoil), Potential Evaporation (FWPT), Local Discharge Runoff + Drainage (FWDis), Surface Runoff (FWRun), Deep Drainage (FWLch2), Sensible Heat Flux (PhiH), Latent Heat Flux (PhiE), NASA bush-fire ground truth hot spots (wf_gt_awap) and wind speed (wf_gt_wind). They tested over 336 weeks of data. Their model achieved 91% global accuracy in predicting bush-fire hotspots. They found that bagging and conventional k-Nearest Neighbour (KNN) classifier were the two best classifiers, with 94.5% and 91.8% accuracy, respectively.5 They concluded that ML successfully captured complex relationships between climate and fire incidence, providing reliable predictive capability.
The figure below represents Australian state-wise average weekly bush-fire intensity from NASA MODIS Active Fire data and NASA Burned Area data. Weekly averaged and normalized fire intensities (in a range of [0-100]) are plotted for seven Australian states (WA, VIC, TAS, QLD, NT, NSQ, SA). Historical verification and cross-validation of the derived bush-fire intensity data from NASA data products were performed. They found 36 major fire events occurred during 2007-2013 (indicated by red squares and labelledInputs included NASA MODIS active fire data, burn area data, and weekly climatic surfaces. Variables included: Incoming Solar Irradiance (SolarMJ), Maximum Temperature (TempMax), Minimum Temperature (TempMin), Precipitation (FWPrec), Soil Moisture Upper Layer (WRel1), Soil Moisture Lower Layer (WRel2), Evaporation Soil+Vegetation (FEW), Transpiration (FWTra), Soil Evaporation (FWSoil), Potential Evaporation (FWPT), Local Discharge Runoff + Drainage (FWDis), Surface Runoff (FWRun), Deep Drainage (FWLch2), Sensible Heat Flux (PhiH), Latent Heat Flux (PhiE), NASA bush-fire ground truth hot spots (wf_gt_awap) and wind speed (wf_gt_wind). They tested over 336 weeks of data. Their model achieved 91% global accuracy in predicting bush-fire hotspots. They found that bagging and conventional k-Nearest Neighbour (KNN) classifier were the two best classifiers, with 94.5% and 91.8% accuracy, respectively.5 They concluded that ML successfully captured complex relationships between climate and fire incidence, providing reliable predictive capability.
The figure below represents Australian state-wise average weekly bush-fire intensity from NASA MODIS Active Fire data and NASA Burned Area data. Weekly averaged and normalized fire intensities (in a range of [0-100]) are plotted for seven Australian states (WA, VIC, TAS, QLD, NT, NSQ, SA). Historical verification and cross-validation of the derived bush-fire intensity data from NASA data products were performed. They found 36 major fire events occurred during 2007-2013 (indicated by red squares and labelledE1-E36) from various data sources. To make the ground truth data used in this study more reliable and meaningful, they visualized eight of the most severe bush-fire events in Australian history [E21, E18, E24, E3, E32, E8, E26].
KNN algorithm is a very effective supervised classification algorithm based on intuitive premise that similar data points are in close proximity according to some metric.5
A study out of British Columbia built and evaluated a data-driven wildfire prediction system tailored to BC’s specific conditions. They constructed a high-resolution dataset integrating 5 years of wildlife incident records from the Canadian Wildland Fire Information System (CWFIS), climate data from ERA5 reanalysis as well as environmental, meteorological and geospatial variables. They tested five predictive models: Random Forest, XGBoost, Light GBM, CatBoost, RNN + LSTM (DL). They found CatBoost achieved the highest metrics with an accuracy of 93.4%. Random Forest also performed well with \~92.6% accuracy. The most influential environmental and climatic features for wildfire occurrence included: surface temperature, humidity, wind speed and soil moisture.
CatBoost is a ML algorithm for classification, regression, and ranking that is especially strong at handling categorical variables directly, without extensive preprocessing. CatBoost is based on gradient boosting,which builds an ensemble of decision trees sequentially. Each new tree attempts to correct the errors of previous trees.
A study in Russia set out to build a unified data-driven pipeline for predicting wildfire occurrence. They developed a unified pipeline for data acquisition and subset ML-based algorithm development. They analyzed the following algorithms:
- Deep Learning: ConvLSTM, RegNetX (CNN), Attention MLP (AMLP)
- Machine Learning: Random Forest and XGBoost
- Anomaly Detection: Autoencoder (AE)
They collected a unique dataset covering several large regions in central Russia, incorporating more than 17,000 verified wildfire events over a period of 10 years.
The areas studied were as follows:
Amur:
- 2 different climate zones, dominated by monsoon-influenced subarctic climate
- Population / Land: \~750,000 / 361 900 km2
- Avg Jan Temperature: -23.5 to -21.8°C
- Avg July Temperatures: +18 to +21.2°C
- Avg Annual Precipitation: \~674 mL
Irkutsk:
- Characterized by subarctic climate
- Population / Land: \~ 2,330,000 / 774 800 km2
- Avg Jan Temperature: -20.6 to -19.6°C
- Avg July Temperature: +18.1 to +20°C
- Avg Annual Precipitation: \~454 mL
Rostovo:
- Hot humid continental climate
- Population / Land: \~4,150,000 / 101 000 km2
- Avg Jan Temperature: -3.5 to -1.9°C
- Avg July Temperature: +24.2 to +24.9°C
- Avg Annual Precipitation: \~460 mL
Sverdlovsk:
- Dominated by a moderately continental climate
- Population / Land: \~4,230,000 / 194 300 km2
- Avg Jan Temperature: -14.7 to -14.3°C
- Avg July Temperature: +17.9 to +19.2°C
- Avg Annual Precipitation: \~601 mL
XGBoost featured the importance for different regions:
 Their findings underscore the necessity of developing individual ML models tailored to each region, taking into account the specific environmental features correlated with the probability of fire occurrence. No single approach consistently yielded the best results across all regions. Each region, with different climatological zones, requires a tailored approach. DL models were generally better at predicting non-fire (fewer false positives). Classical ML models were better at predicting fire (higher recall). The autoencoder was consistently worse.
For Amur and Irktsk (Siberia), Nesterov index, Normalized Difference Vegetation Index (NDVI), Potential Evapotranspiration (PET), precipitation were dominant features.
For Rostove, Evapotranspiration (ET), population density and land cover matter most.
For Sverdlovsk (Ural forest), Nestervo index and land cover dominate.
XGBoost consistently delivered strong results and is easier to interrupt. Using XG Boost’s Gain metric, Nestervo index is the most important feature in 3 of 4 regions. Vegetation indices (NDVI, EVI, LAI, FPARP) are consistently important. Precipitation and PET/ET matter in moist-sensitive regions. Furthermore, population density is a strong predictor in human-dominated landscapes.
Their meteorological data analysis compared weather distributions at different offsets from fire days (0, 1, 3, 5 days before. Some features (i.e., Nestervo index, precipitation) showed statistically significant differences. However, weather alone could not precisely pinpoint the fire day, but still provided strong predictive signals. The Nesterov index is a key indicator, capturing the cumulative impact of heat and drought on wildfire risk.
The authors concluded that a unified wildfire prediction model is not feasible and regional models perform better. They found that environmental features vary in importance by region, driven by climate, vegetation and human activity. Classical ML models (RF, XGBoost) remained highly competitive. DL models excel in spatial generalization and reducing false alarms.
XGBoost is a distributed, open-source ML library that uses gradient boosted decision trees, a supervised learning boost algorithm that makes use of gradient descent. XGBoost is known for its speed, efficiency and ability to scale well with large datasets. Boosting combines multiple individual weak trees (i.e., models that perform slightly better than random chance), to form a strong learner. Each weak learner is trained sequentially to correct the errors made by the previous models.
Data
Research:
Fire occurrence prediction (FOP) models dates back 100 years. FOP models usually use regression methods to relate response variables, such as fire reports or hotspots, to weather, lightning, and other covariates for a geographic unit. The ML method most commonly used in studies predicting fire occurrence were Artificial Neural Networks (ANN).5 The basic unit of an ANN is a neuron, also called a perception or logistic unit. A neuron involves a set of inputs which are combined linearly through multiplication with weights associated with the input resulting in an output signal.5
In 1996, an ANN for human-caused wildfire prediction in Whitecourt Provincial Forest of Alberta, Canada, accurately predicted 85% of no-fire observations and 78% of fire observations. A 314 fire and no-fire data set for the period of 1986 to 1990 was used for training. The model was then tested using data from the 1991 to 1992 fire seasons, which had 58 observed fires. The input variables were the Canadian Fire Weather Index for the day, area in km2 of the geographic zone, and district.9 This study showed that human-caused fires are predictable when enough environmental and human-activity data are included. It is often cited because it was one of the first applications of AI in wildfire prediction. It laid the groundwork for modern wildlife ML research.
A 2017 study in Yunnan Province, China found that a cost-sensitive Random Forest (RF) analysis outperformed ANN models for predicting wildfire ignition susceptibility. This study performed wildfire susceptibility assessment using multiple methods, including logistic regression, probit regression, an ANN and a RF algorithm. Sample ratio of ignition and nonignition data was investigated from 2002 to 2010. Nonignition data included meteorological, landform, and vegetation variables. The models used nonignition data because ignition events were comparatively rare. The results showed a cost-sensitive RF had the highest overall accuracy (88.47%) for all samples, and 94.23% accuracy for ignition prediction. The ANN had an accuracy of 83.78% for predicting wildfire ignitions, but only 78.44% for predicting nonignitions. The predication accuracy, variable importance, and spatial pattern of each model result were evaluated and compared for class percentage of true positive (TP), true negative (TN), false positive (FP), and false negative (FN).
True positive: RF-cost sensitive (94.23%) > RF (84.26%) > ANN (83.78%) True negative: RF-cost sensitive (88.4%) > RF (88.35%) > ANN (78.44%) False positive: RF-cost sensitive (11.6%) < RF (11.65%) < ANN (21.56%)
The factors that influence Yunnan wildfire occurrence the most were forest coverage ratio, month / season (temporal patterns), surface roughness (obtained from the Climate Forest System Reanalysis - CFSR), humidity measures ( minimum of the 6 h humidity over 10 days) , temperature measures (maximum of the 6 h average temperatures over 10 days).
A RF is a model composed of many individually trained decision tress (DT). A DT is a set of if-then-else rules with many branches joined by decision nodes and terminated by leaf nodes. The decision node is where the tree splits into different branches, with each branch corresponding to the decision being taken by the algorithm, and the leaf nodes represents the output.5 Cost-sensitive RF is an RF adjusted to handle data imbalance (few ignitions vs many non-ignitions).10
Maximum Entropy Models (MAXENT) have also been used for fire occurrence prediction. MAXENT is a ML method used to predict where events are likely to occur based on known occurrences and environmental conditions. MAXENT was originally developed for species distribution modeling. A case study of Canton Ticino, Switzerland used this ecological niche modeling to define what atmospheric conditions are most common when fires occur (“fire days”).
They compared this approach to traditional logistic regression models and also tested different sets of input variables (e.g., temperature / humidity / wind, fire weather indices or a combination). The daily meteorological variables used are: Air Temperature in Celsius degree (T), Air Humidity in percentage value (H), Wind velocity in m/s (U), Precipitation in mm (P), coverage of sky in ratio between 0 and 1(CloudCover) and coverage of snow expressed as snow presence or absence (SnowCover). Model input variables: total rainfall over the last seven days (WeekRain), the days since the last rainfall (DaysSinceRain), the sum of the last rainfall (conse cutive days with rain) (LastRainSum), the dew point temperature (Tdew), that is the temperature to which air needs to be cooled to make air water vapour saturated [40] and the vapour pressure deficit (VPD) that is the difference between the saturation vapour pressure and the actual vapour pressure at a particular temperature.
Using combinations of variables generally improved model performance. MAXENT niche modeling showed slightly better predictive power, but results varied across different fire types (e.g., winter, summer natural, summer anthropogenic - influenced by human activity). Their results support the idea of flexible statistical and ML methods can enhance fire danger forecasting.11
An Australian study investigated trends in bush-fire frequency and set out to develop a predictive model linking climatic conditions to bush-fire occurrence. They developed a two-stage ensemble ML model using unsupervised deep learning (a multi-layered neural network to learn climatic patterns without prior labels) and supervised ensemble classification. In the first unsupervised deep learning (DL) phase, multi-layered deep neural networks [Deep Belief Neural Networks with Conventional Supervised Ensemble ML (DBNet)] were used to learn about the given data and generate simple features (from environmental and climatic surfaces) without any prior information or training targets. In the second supervised ensemble classification stage, features extracted from the first stage were fed as training inputs to 10 ML classifiers to establish the best classifier for bush fire hotspot estimation. Multiple supervised classifiers were used to learn the extracted features against the ground truth bush-fire hot spot map.5
Inputs included NASA MODIS active fire data, burn area data, and weekly climatic surfaces. Variables included: Incoming Solar Irradiance (SolarMJ), Maximum Temperature (TempMax), Minimum Temperature (TempMin), Precipitation (FWPrec), Soil Moisture Upper Layer (WRel1), Soil Moisture Lower Layer (WRel2), Evaporation Soil+Vegetation (FEW), Transpiration (FWTra), Soil Evaporation (FWSoil), Potential Evaporation (FWPT), Local Discharge Runoff + Drainage (FWDis), Surface Runoff (FWRun), Deep Drainage (FWLch2), Sensible Heat Flux (PhiH), Latent Heat Flux (PhiE), NASA bush-fire ground truth hot spots (wf_gt_awap) and wind speed (wf_gt_wind). They tested over 336 weeks of data. Their model achieved 91% global accuracy in predicting bush-fire hotspots. They found that bagging and conventional k-Nearest Neighbour (KNN) classifier were the two best classifiers, with 94.5% and 91.8% accuracy, respectively.5 They concluded that ML successfully captured complex relationships between climate and fire incidence, providing reliable predictive capability.
The figure below represents Australian state-wise average weekly bush-fire intensity from NASA MODIS Active Fire data and NASA Burned Area data. Weekly averaged and normalized fire intensities (in a range of [0-100]) are plotted for seven Australian states (WA, VIC, TAS, QLD, NT, NSQ, SA). Historical verification and cross-validation of the derived bush-fire intensity data from NASA data products were performed. They found 36 major fire events occurred during 2007-2013 (indicated by red squares and labelledInputs included NASA MODIS active fire data, burn area data, and weekly climatic surfaces. Variables included: Incoming Solar Irradiance (SolarMJ), Maximum Temperature (TempMax), Minimum Temperature (TempMin), Precipitation (FWPrec), Soil Moisture Upper Layer (WRel1), Soil Moisture Lower Layer (WRel2), Evaporation Soil+Vegetation (FEW), Transpiration (FWTra), Soil Evaporation (FWSoil), Potential Evaporation (FWPT), Local Discharge Runoff + Drainage (FWDis), Surface Runoff (FWRun), Deep Drainage (FWLch2), Sensible Heat Flux (PhiH), Latent Heat Flux (PhiE), NASA bush-fire ground truth hot spots (wf_gt_awap) and wind speed (wf_gt_wind). They tested over 336 weeks of data. Their model achieved 91% global accuracy in predicting bush-fire hotspots. They found that bagging and conventional k-Nearest Neighbour (KNN) classifier were the two best classifiers, with 94.5% and 91.8% accuracy, respectively.5 They concluded that ML successfully captured complex relationships between climate and fire incidence, providing reliable predictive capability.
The figure below represents Australian state-wise average weekly bush-fire intensity from NASA MODIS Active Fire data and NASA Burned Area data. Weekly averaged and normalized fire intensities (in a range of [0-100]) are plotted for seven Australian states (WA, VIC, TAS, QLD, NT, NSQ, SA). Historical verification and cross-validation of the derived bush-fire intensity data from NASA data products were performed. They found 36 major fire events occurred during 2007-2013 (indicated by red squares and labelledE1-E36) from various data sources. To make the ground truth data used in this study more reliable and meaningful, they visualized eight of the most severe bush-fire events in Australian history [E21, E18, E24, E3, E32, E8, E26].
KNN algorithm is a very effective supervised classification algorithm based on intuitive premise that similar data points are in close proximity according to some metric.5
A study out of British Columbia built and evaluated a data-driven wildfire prediction system tailored to BC’s specific conditions. They constructed a high-resolution dataset integrating 5 years of wildlife incident records from the Canadian Wildland Fire Information System (CWFIS), climate data from ERA5 reanalysis as well as environmental, meteorological and geospatial variables. They tested five predictive models: Random Forest, XGBoost, Light GBM, CatBoost, RNN + LSTM (DL). They found CatBoost achieved the highest metrics with an accuracy of 93.4%. Random Forest also performed well with \~92.6% accuracy. The most influential environmental and climatic features for wildfire occurrence included: surface temperature, humidity, wind speed and soil moisture.
CatBoost is a ML algorithm for classification, regression, and ranking that is especially strong at handling categorical variables directly, without extensive preprocessing. CatBoost is based on gradient boosting,which builds an ensemble of decision trees sequentially. Each new tree attempts to correct the errors of previous trees.
A study in Russia set out to build a unified data-driven pipeline for predicting wildfire occurrence. They developed a unified pipeline for data acquisition and subset ML-based algorithm development. They analyzed the following algorithms:
- Deep Learning: ConvLSTM, RegNetX (CNN), Attention MLP (AMLP)
- Machine Learning: Random Forest and XGBoost
- Anomaly Detection: Autoencoder (AE)
They collected a unique dataset covering several large regions in central Russia, incorporating more than 17,000 verified wildfire events over a period of 10 years.
The areas studied were as follows:
Amur:
- 2 different climate zones, dominated by monsoon-influenced subarctic climate
- Population / Land: \~750,000 / 361 900 km2
- Avg Jan Temperature: -23.5 to -21.8°C
- Avg July Temperatures: +18 to +21.2°C
- Avg Annual Precipitation: \~674 mL
Irkutsk:
- Characterized by subarctic climate
- Population / Land: \~ 2,330,000 / 774 800 km2
- Avg Jan Temperature: -20.6 to -19.6°C
- Avg July Temperature: +18.1 to +20°C
- Avg Annual Precipitation: \~454 mL
Rostovo:
- Hot humid continental climate
- Population / Land: \~4,150,000 / 101 000 km2
- Avg Jan Temperature: -3.5 to -1.9°C
- Avg July Temperature: +24.2 to +24.9°C
- Avg Annual Precipitation: \~460 mL
Sverdlovsk:
- Dominated by a moderately continental climate
- Population / Land: \~4,230,000 / 194 300 km2
- Avg Jan Temperature: -14.7 to -14.3°C
- Avg July Temperature: +17.9 to +19.2°C
- Avg Annual Precipitation: \~601 mL
XGBoost featured the importance for different regions:
Their findings underscore the necessity of developing individual ML models tailored to each region, taking into account the specific environmental features correlated with the probability of fire occurrence. No single approach consistently yielded the best results across all regions. Each region, with different climatological zones, requires a tailored approach. DL models were generally better at predicting non-fire (fewer false positives). Classical ML models were better at predicting fire (higher recall). The autoencoder was consistently worse.
For Amur and Irktsk (Siberia), Nesterov index, Normalized Difference Vegetation Index (NDVI), Potential Evapotranspiration (PET), precipitation were dominant features.
For Rostove, Evapotranspiration (ET), population density and land cover matter most.
For Sverdlovsk (Ural forest), Nestervo index and land cover dominate.
XGBoost consistently delivered strong results and is easier to interrupt. Using XG Boost’s Gain metric, Nestervo index is the most important feature in 3 of 4 regions. Vegetation indices (NDVI, EVI, LAI, FPARP) are consistently important. Precipitation and PET/ET matter in moist-sensitive regions. Furthermore, population density is a strong predictor in human-dominated landscapes.
Their meteorological data analysis compared weather distributions at different offsets from fire days (0, 1, 3, 5 days before. Some features (i.e., Nestervo index, precipitation) showed statistically significant differences. However, weather alone could not precisely pinpoint the fire day, but still provided strong predictive signals. The Nesterov index is a key indicator, capturing the cumulative impact of heat and drought on wildfire risk.
The authors concluded that a unified wildfire prediction model is not feasible and regional models perform better. They found that environmental features vary in importance by region, driven by climate, vegetation and human activity. Classical ML models (RF, XGBoost) remained highly competitive. DL models excel in spatial generalization and reducing false alarms.
XGBoost is a distributed, open-source ML library that uses gradient boosted decision trees, a supervised learning boost algorithm that makes use of gradient descent. XGBoost is known for its speed, efficiency and ability to scale well with large datasets. Boosting combines multiple individual weak trees (i.e., models that perform slightly better than random chance), to form a strong learner. Each weak learner is trained sequentially to correct the errors made by the previous models.
Conclusion
- Machine Learning models can accurately predict wildfire occurrence
- CatBoost and XGBoost are strong candidates for operational early-warning systems
- A unified wildfire prediction model is not feasible - regional models perform better
- Environmental features vary in importance by region, driven by climate, vegetation, and human activity
- High-resolution environmental data enables localized risk assessment
-
Using a combination of variables generally improved model performance
-
Common key predictors include:
- Temperature
- Relative humidity
- Wind
-
- Practical Implications:
- The BC framework could be scalable to other provinces, including Alberta.
- A well engineered ML pipeline can deliver accurate, province-wide wildfire occurrence predictions and support proactive fire management.
- Alberta has AI tools, but not a scientific study equivalent to the BC study.
- Alberta could benefit from BC’s study methodology, feature engineering and model comparison framework
- The same pipeline could be retrained on Alberta specific data
- Alberta would have to consider:
- Spring temperature anomalies
- Overwinter snowpack melt timing
- Drought code / soil moisture deficit
- Lightning density
- Chinook-driven humidity drops and wind patterns
- Practical Implications:
-
Citations
- www.canadawildfire.org/wildfirefacts
- https://cwfis.cfs.nrcan.gc.ca/ha/nfdb
- https://climateinstitute.ca/wp-content/uploads/2024/07/Fact-sheet-wildfires-Canadian-Climate-Institute.pdf
- https://parks.canada.ca/nature/science/conservation/feu-fire/incendies-wildfires
- https://parks.canada.ca/pn-np/nt/thaidene-nene/security-safety/feu_qfp_faq_fire
- https://www.rockyview.ca/safety-and-enforcement/fire-services/fire-bans
- https://www.alberta.ca/fire-bans
- https://open.alberta.ca/dataset/8259a745-2f34-427d-86e3-69fea634f20c/resource/fe04e384-df22-4719-9da3-93eb553c1ed9/download/fp-fire-ban-system-approved-activities-list-2025.pdf
- https://www.ibm.com/think/topics/artificial-intelligence
- https://www.ibm.com/think/topics/supervised-vs-unsupervised-learning
- A review of machine learning applications in wildfire science and management [https://cdnsciencepub.com/doi/full/10.1139/er-2020-0019]
- https://www.ibm.com/think/topics/neural-networks
- Vega-Garcia C., Lee B.S., Woodard P.M., and Titus S.J. 1996. Applying neural network technology to human-caused wildfire occurrence prediction.
- https://www.ibm.com/think/topics/random-forest
- Wildfire Susceptibility Assessment in Southern China: A Comparison of Multiple Methods [https://link.springer.com/content/pdf/10.1007/s13753-017-0129-6.pdf]
- De Angelis A., Ricotta C., Conedera M., and Pezzatti G.B. 2015. Modelling the meteorological forest fire niche in heterogeneous pyrologic conditions. PLoS ONE, 10(2): e0116875.
- https://www.ibm.com/think/topics/ensemble-learning
- https://www.ibm.com/think/topics/knn
- Dutta R., Das A., and Aryal J. 2016. Big data integration shows Australian bush-fire frequency is increasing significantly. R. Soc. Open Sci. 3(2): 150241.
- Liudmila Prokhorenkova, Gleb Gusev, Aleksandr Vorobev, Anna Veronika Dorogush, Andrey Gulin — CatBoost: unbiased boosting with categorical features (2017)
- Wildfire Prediction in British Columbia Using Machine Learning and Deep Learning Models: A Data-Driven Framework [https://www.mdpi.com/2504-2289/9/11/290]
- Exploration of geo-spatial data and machine learning algorithms for robust wildfire occurrence prediction | Scientific Reports [https://www.nature.com/articles/s41598-025-94002-4]
- https://www.ibm.com/think/topics/xgboost
- Artificial Neural Networks and its Applications - GeeksforGeeks [https://www.geeksforgeeks.org/artificial-intelligence/artificial-neural-networks-and-its-applications/]
- Random Forest Algorithm in Machine Learning - GeeksforGeeks [https://www.geeksforgeeks.org/machine-learning/random-forest-algorithm-in-machine-learning/]
- Ensemble Learning - GeeksforGeeks [https://www.geeksforgeeks.org/machine-learning/a-comprehensive-guide-to-ensemble-learning/]
- K-Nearest Neighbor(KNN) Algorithm - GeeksforGeeks [https://www.geeksforgeeks.org/machine-learning/k-nearest-neighbours/]
- CatBoost in Machine Learning - GeeksforGeeks [https://www.geeksforgeeks.org/machine-learning/catboost-ml/]
- XGBoost - GeeksforGeeks [https://www.geeksforgeeks.org/machine-learning/xgboost/]
Acknowledgement
I would like to thank my parents for their endless encouragement and support. They have consistently supported me in my studies and have encouraged me along the way. I would also like to thank my wonderful science coordinator, Ms. Lai, for her constant support, advice and motivation. I would also like to acknowledge my school judges for there work and time. Thank you to everyone who supported me.