Alzheimer's Speaks: Lingustic Impairment and Vocabulary Richness in Alzheimer's Disease
Grade 9
Presentation
Hypothesis
Research Question: How is vocabulary richness expressed in Alzheimer’s Disease?
Objective: to determine if type-token ratio changes based on the diagnosis
Null Hypothesis (H0): There is no difference between unique word expression based on the diagnosis.
Alternate Hypothesis (Ha): If the number of unique words used in samples is measured, then AD samples will have a smaller proportion of language made up of unique words (reduced TTR) because individuals with AD tend to have impaired language.
Research
Research
Alzheimer’s Disease (AD) is an incurable progressive neurodegenerative disease that is projected to affect 955,900 Canadians by 2030. One in nine seniors aged 65 and older (10.7%) have been diagnosed with AD, a number that will continue to grow as the population ages. There are 6.2 million Americans living with the disease and today AD kills for more annually than breast cancer and prostate cancer combined. AD causes the buildup of amyloid-beta plaques and tau tangles in the brain and is characterised by progressive cognitive impairment, a decline in thinking and independence in daily activities, and impulsive and violent behaviour. [1][2][3]
Phases of AD and language impairment [4][7]
|
Phase |
||
|
Mild |
Moderate |
Severe |
|
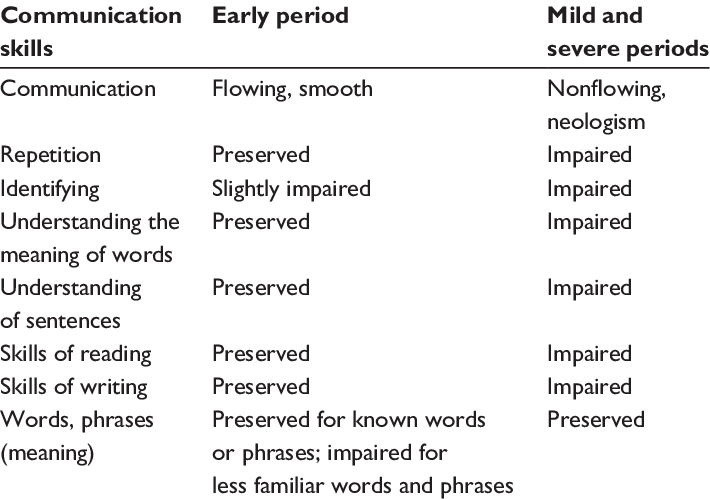
Alzheimer’s Disease first affects the memory. Short-term memory is affected the most, and the speech of patients is fluent. They usually have small lexical-semantic impairments such as naming things or being vague. The speech may be empty (eg. “The thing is over there, you know.”) but perfectly structured. This leads to increased insolation. AD patients may suffer from depression and anxiety, stemming from their awareness of their own deterioration. Other symptoms include losing things or misplacing them in odd places, wandering and getting lost, and taking longer to complete normal and daily tasks. |
This phase is the longest of the three (lasts from 2 to 10 years) and the most serious. The patient is not able to remember their thoughts long enough to express them. Sometimes, they may repeat words, sounds and sentences in an attempt to make themselves understood. Patients may also experience a change in sleep pattern, repetitive movement and muscle twitch, and withdrawal from social activities. |
The deterioration of the brain spreads to the frontal lobe. In this phase, all nerve cells are damaged. The affected person's memory may be impaired, but can be brought back with the help of photos. Sometimes, it may not be clear to caregivers and family how much the affected person can understand them. This phase lasts for 1 to 3 years and the most common cause of death is pneumonia. |
Fig 1. Summary of linguistic impairments in Alzheimer’s Disease.
Linguistic Impairments in AD
AD is characterised by a progressive worsening of many cognitive functions, including language. The superior parietal, posterior temporal and occipital cortical areas of the brain (central in language processing) is known to be affected in AD and Mild Cognitive Impairment (MCI). Individuals with AD often have the following impairments:
- Difficulties finding words
- Diminished vocabulaires
- Anomia (difficulties in recalling the names of everyday objects)
- Echolalia (a tendency to repeat words)
- Verbal apraxia (a difficulty in producing sounds and syllables)
Spontaneous speech in mild AD is described to have reduced information content compared to normal speakers of the same age.
Another observable trait of AD is the change in semantic variability and granularity as the disease progresses. Semantic variation is when a word is used to mean multiple things, or polysemy. A word has high semantic variability when it has multiple meanings (ex. “Food” has a higher semantic variability than more specific words like “carrot” [6]). Semantic granularity is the measure of how informative a word is. A word has a low semantic granularity when it is general (ex. “Animal” has a lower semantic granularity than “Dog” because less general assumptions can be made about it [5]).
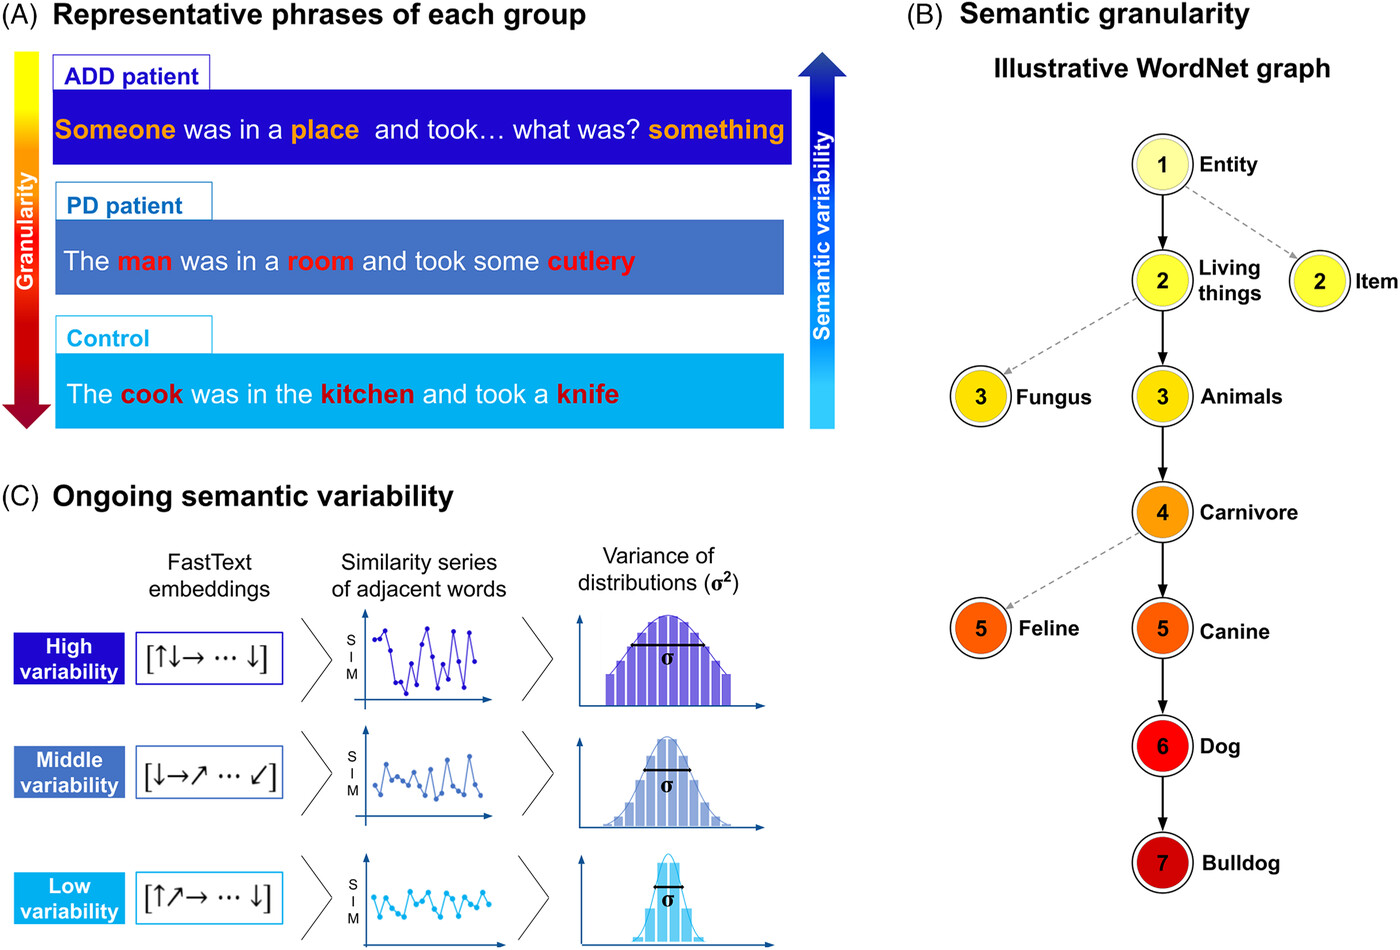
Fig 2: Semantic granularity and variability in dementia.
AD patients were found to have significantly higher semantic variability scores than HCs (P = 0.11, d=0.97). AD patients also exhibited more use of low granularity words. They scored significantly higher (P=0.72, d=0.73) than HCs in the use of words with a granularity score of 5, and significantly lower (P = 0.008, d= 1) than HCs in the use of high granularity words (granularity score of 11). In general, AD patients use coarse and less precise concepts than HCs. This phenomenon has been observed in multiple different word tasks. [8] While I was not able to measure semantic granularity, AD patients also had a greater semantic variability, allowing me to measure semantic variability by measuring Type-token ratio (TTR); because AD patients have increased semantic variability, they use less unique words less often.
Vocabulary and Loss of Information
Vocabulary errors are the most common linguistic impairments in dementia. Patients tend to substitute words with superordinate words (nouns that stand for a class of things, ie ‘vehicle’ is superordinate to ‘tram’, ‘bike’ and ‘car’ [11]) and use circumlocutory (when a patients refers to an object's characteristic instead of using its name [12]) speech. Aramaki et al (2016) measured vocabulary size in control and MCI patients (MCI is considered the boundary between normal cognition and AD, therefore vocabulary decline in MCI patients may be a predictor for developing AD). Aramaki et al (2016) measured TTR, among other factors measuring vocabulary, was associated with MCI. They concluded that vocabulary is an indicator of cognitive decline. [10]
The “loss of information” hypothesis states that people with AD forget the meaning of words, and therefore have trouble retrieving them in speech. Gainotti et al (1996) asked 16 AD participants and eleven healthy controls to name as many words from a specific topic as they could in one minute. In comparison to controls, AD participants produced significantly less words, which suggests that they have trouble recalling meanings and definitions in words. [9] I think that individuals with AD produce unique words less frequently than healthy adults and therefore will have a lower Type Token Ratio.
Previous Research
While TTR has been used in Machine Learning and Natural Language Processing, little research has been done on how TTR is affected by Alzheimer’s Disease, and if it is a statistically significant metric. Guinn et al. found a statistically significant difference in TTR use between controls and participants with AD in interviews (p=0.0021), but reported that control samples came from the interviewer and AD samples from the subject. They reported that the interviewers may be trying to match the vocabulary richness of the subject, and that comparing the two groups is often misleading. Interviewers were graduate students, and far younger than the subjects they were interviewing. This implies that they had a higher level of education than AD participants. [13] This project aims to identify if TTR is a predictor of AD, give a quantitative and qualitative analysis of TTR use in participants with and without AD, while mitigating confounding factors such as age and education level.
Variables
Variables
|
Manipulated |
|
|
Responding |
|
|
Controlled |
|
Hypothesis Testing
The P-value is the probability of obtaining results as extreme as the ones observed, under the assumption that the null hypothesis is true. A low P-value indicates that the samples are not consistent with the null hypothesis, a high P-value indicates the samples are consistent with the null hypothesis. The P-value is compared to the significance value (α). α can be any number and the significance level is different for each problem, but most studies use α = 0.1 or α = 0.05. P-values below α are generally considered statistically significant. [15]
α = 0.05
If p-value > α: the result is not statistically significant
If p-value < α: the result is statistically significant
Features Measured
TTR is defined by the equation:
TTR = Number of Unique Words/Number of Total Words
Interview Length
Due to the nature of TTR, it has a natural tendency to decline as the Total Word Count decreases. Previous research (Zozuk 2023) has shown that control tend to have larger total word counts than AD participants (120 for controls vs 50 in AD). To reduce the effect of this, I limited the maximum number of words per interview to 150. Sajjadi et al (2012) found that a 150 word sample is adequate enough to provide a true reflection of the extent of language impairment.
Education and Age
I wanted to avoid the confounding factors mentioned by Guinn et al. To control the effect of age and education level in my dataset, as these factors have a big impact on language ability, I matched the education and age of the control and AD group.
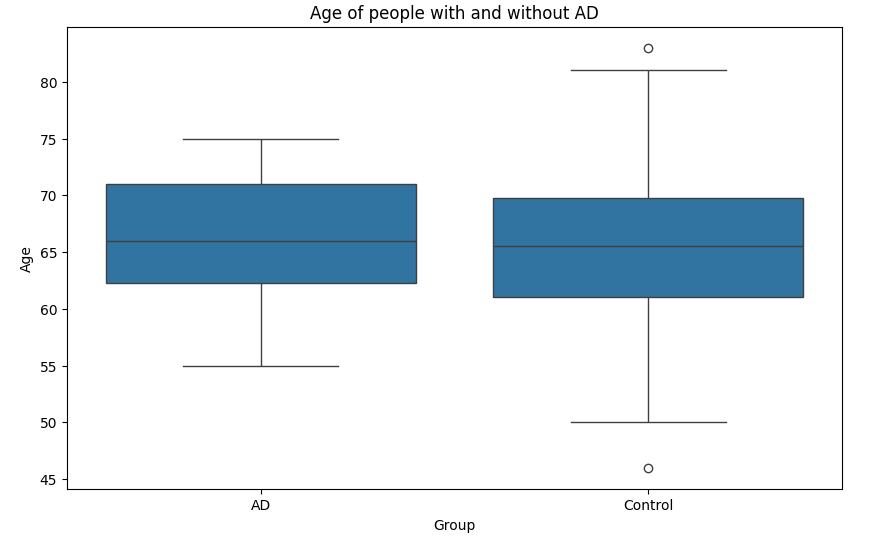
Fig 3: A box plot of mean age in AD and Control groups
- The mean age of participants was 65.3 years in AD participants and 64.2 years in control participants
- The t-test result is t=1.14, p=0.25
- Because the p values is greater than 0.05, the t-test is not statistically significant
- A non-significant t-test indicates that the mean age of participants in each group is “random”. The age of participants is not skewed to either group
- Additionally, age has a non significant correlation with TTR (0.02, p=0.74)
- Therefore, the the effect of age on my results is minimal
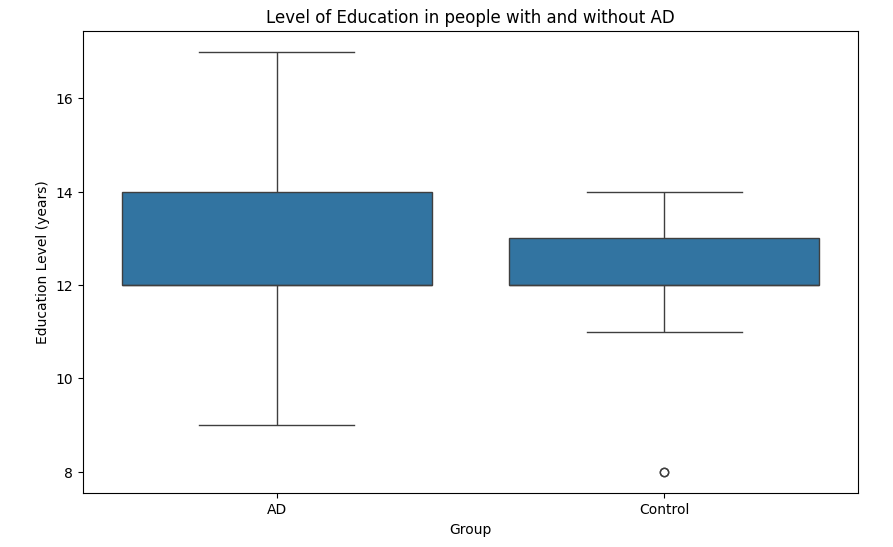
Fig 4: A box plot of mean years of education in AD and Control groups
- The mean years of education is 12.46 years in the AD class and 12.34 years in the control class
- The t-test result is t=0.42, p=0.67
- Because the p values is greater than 0.05, the t-test is statistically insignificant
- Education has an insignificant correlation with TTR (0.02, p=0.74)
- Because both age and years of education are not statistically significant in t-tests, I know that there is no significant bias from either the AD or control group (ie. all individuals in the control group happen to have more education than individuals in the AD group)
Materials
All sources used is in Citations
DementiaBank
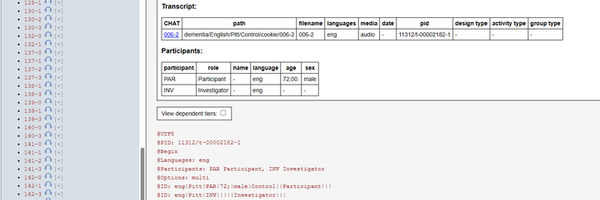
DementiaBank is a large language database run by Carnegie Mellon University that contains data on communication in dementia. DementiaBank is divided into smaller datasets called corpuses. The Pitt corpus, by Dr Francois Boller and Dr Jmes Becker, was chosen as it contains the most numerous samples and extensive demographic data including race, gender, Mini Mental State Exam scores, onset age, and years of education. The corpus contains audio recordings and associated transcripts from the Boston Cookie Description Task. Participants are asked to describe an illustration of two children stealing a cookie. 136 interviews were analysed.
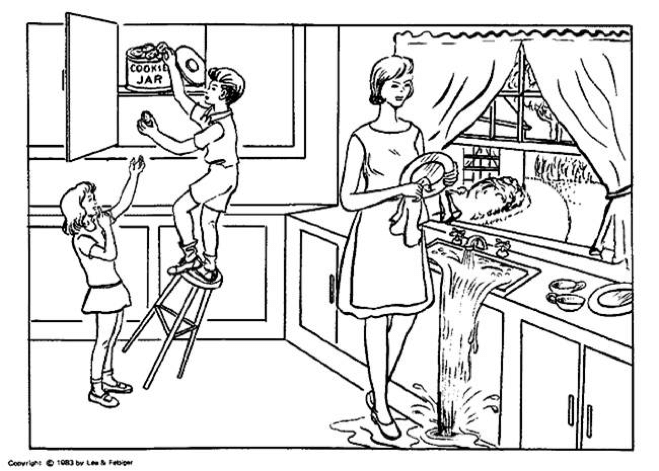
Fig 5: The Cookie Theft image from the Boston Cookie Task
Demographic Data
|
Total |
Alzheimer’s Disease |
Control |
|
|
# of individuals |
136 |
78 |
58 |
|
Mean Age |
65.8 |
66.3 |
65.2 |
|
Mean Years of Education |
12.41 |
12.46 |
12.34 |
|
Gender |
|||
|
Male:Female |
48:88 |
26:52 |
22:36 |
Procedure
DementiaBank
DementiaBank corpuses are transcribed in a custom format called CHAT. Transcript logs were stored as “.cha” file extensions on the DementiaBank browser. My general procedure was as follows:
- Access to DementiaBank was obtained by emailing macw@cmu.edu
- Python code in Jupyter Notebook was ran to extract the text into a CSV file
- Any dialogue made by the interviewer, symbolised by “INV”, was removed as they are not the focus of the study
- DementiaBank was designed to store phonetic information, like pauses and stutters in speech and timestamps of recordings. Since these were not in the scope of the project, all symbols like numbers, brackets, math signs and currency signs were removed. Below is a full list of all removed signs
|
Removed |
Kept |
|
@ # & = + { } [ ] * ^ % \ / : ` ~ $ < > |
. , ? ! ; |
|
Removed (this is not an exhaustive list, just examples of non word characters) |
|
- The CHAT (Codes for the Human Analysis of Transcripts) format paraphrases words that are incorrectly pronounced for clarity. I removed the mispronounced words and kept the paraphrase word as this project is primarily concerned with the vocabulary. Paraphrases are enclosed in two square brackets and a colon.
Below is an example of a paraphrase word
A: He is at the think [:sink]
After Preprocessing
A: He is at the sink
- When I ran word clouds on the processed text, I observed that there was a large quantity of filled pauses. Filled pauses are classified in CHAT as filler words like “um”, “uh”, “er”, and “em”. They were removed for clarity when doing qualitative analysis.
Observations
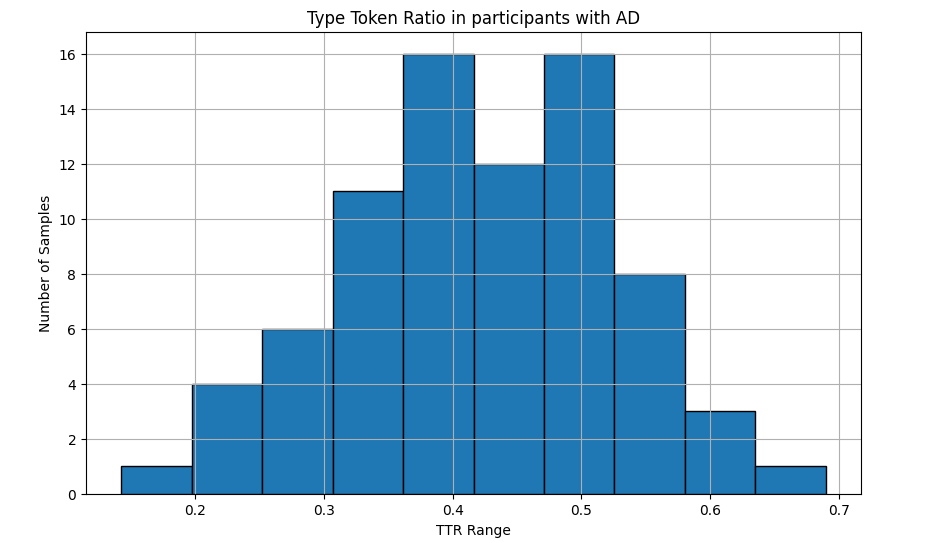
Fig 6: TTR distrubution in the AD group
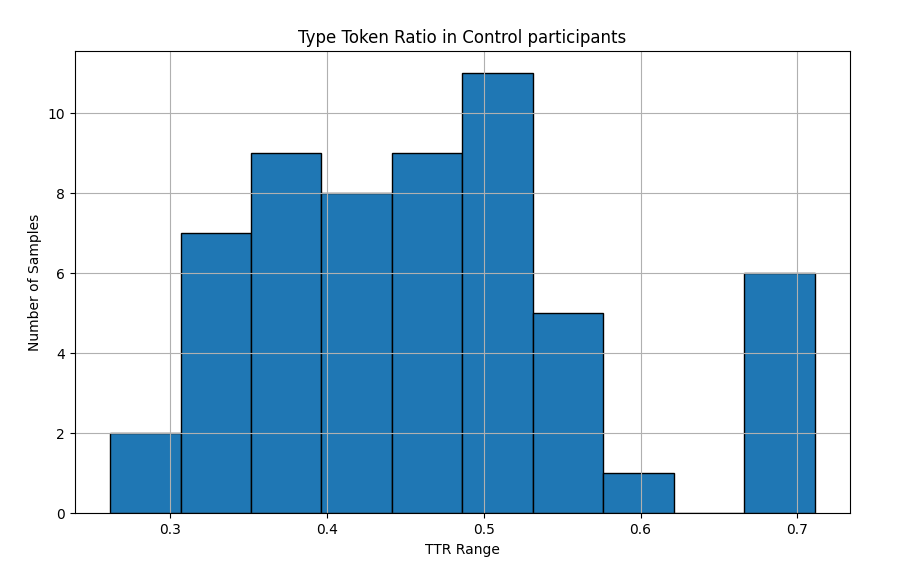
Fig 7: TTR distrubution in the Control group
Shapiro-Wilk Test
|
Class |
N |
Shapiro-Wilk Test |
P |
|
AD |
78 |
0.99 |
0.97 |
|
Control |
58 |
0.96 |
0.06 |
- The Shapiro-Wilk Test is a test of normal distribution in data, the closer to 1 the test is the more normally distributed the data is
- As the null hypothesis in this case is that the data has a normal distribution, a p-value > 0.05 is normally distributed
- Both datasets have a normal distribution
- The Shapiro-Wilk test is important because other tests, like t-test and Cohen’s d only function accurately on normally distributed data
T-test of Means
|
N |
Mean |
Raw Difference |
T-test |
|
|
AD |
78 |
0.42 |
0.04 |
-2.05, p=0.04 |
|
Control |
58 |
0.46 |
- T-test measures the difference between the mean TTR of AD and control samples
- A large absolute value indicates a large difference between the means
- The direction of the value indicates if the mean TTR of the AD group is larger than the mean TTR of the control group. A positive sign indicates that the mean TTR of the control group is smaller.
- Since the direction is negative, the mean TTR of the control group is greater
- A p-value < 0.05 indicates that the difference is statistically significant
- The t-test is statistically significant
- We know that there is a real world effect, and the results are not due to random chance
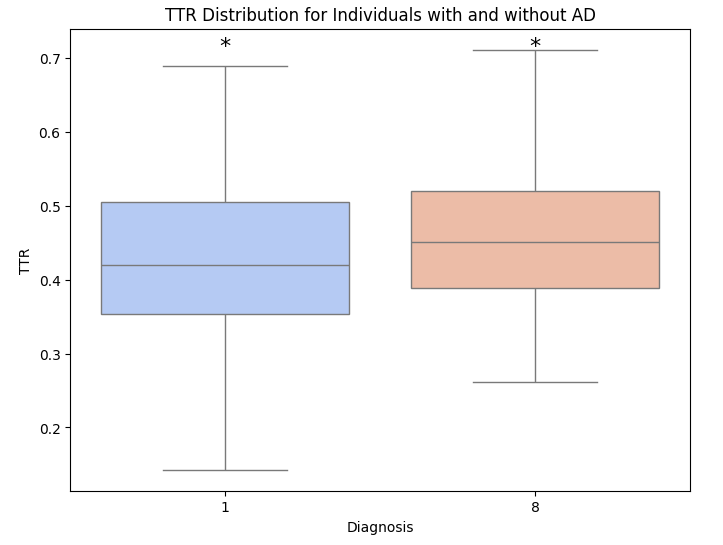
Fig 8: Box plot of mean TTR in the Control and AD group
Cohen’s D
|
Class |
N |
SD |
95% Upper |
95% Lower |
Cohen’s d |
|
AD |
78 |
0.10 |
0.39 |
0.44 |
-0.35, p=0.04 |
|
Control |
58 |
0.11 |
0.43 |
0.48 |
Cohen’s d measure the effect size, or practical significance of the means
- The practical significance measures the real-world importance of the difference
- Ie. a dataset can be statistically significant, but not practically significant
- It's important to note that Cohen’s d is standardised, meaning that the value is unitless
- Sullivan (2012) has the following recommendations for determining effect size in Cohen’s d (absolute value):
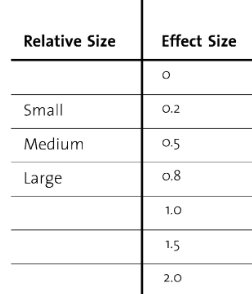
Fig 9: Effect size interpretations
- The effect size of spontaneous speech is small and statistically significant (d=-0.35, p=0.04)
Analysis
Analysis
The AD group has a lower mean TTR (0.42) than the control group (0.46). This is partially due to AD participants using repetition during the interview.
- “kids are trying to get a. its full of its full of mistakes . its full of mistakes . its full of mistakes . hes changing taking cookie jar. thats all . the mothers just drying the dishes. from the from . this is …” -Participant with AD (repetition of “full of mistakes”)
- “mhm . theres a young boy going in a cookie jar . and theres a lit a girl young girl . and Im saying hes a boy because you can its and hes hes in the cookie jar . and theres a stool that he is on and it already is starting to and so is the water in the sink is overflowing in the sink hm I I dont know about the this hickey here I like it the wife or I mean the the and shes she has has . oh I I cant think of the ... she has the shes trying to wipe wipe dishes . oh and stop the water from going out .” Participant with AD (repetition of “shes”, wipe”, “the” “hes”, and “I”)
- “this boy is getting cookies out of this jar . .. well why why they must they they must . no youve gotta you gotta get the you gotta get . yeah I guess so .” -Participant with AD (repetition of “you gotta”, “why”, and “they must”)
I found that control participants used less repetition:
- “oh goody . that boys climbed on a stool thats falling over to get a cookie . and the little girl is standing below him trying to get the and the mother is washing dishes while the waters running over and the window is the suns shining . theres two cups and this plate on the counter . and maybe the mother is drying a plate . thats all I see .” -Participant without AD (no phrase or word repeated 2 time or more consecutively)
- “theres a child reaching for a cookie . the stool is tilted . the girl is possibly moving her finger towards her mouth and waters running out of the sink . the mothers drying dishes . somebodys gonna be screaming when the kid falls . I dont know if its action but mom was standing in water . thats about all I see .” - Participant without AD
Repetition of words and phrases lowers TTR by increasing the total word count while not increasing the unique word count. While the number of certain words used in an interview is similar in both classes (B and D have 10 and 7 uses of the word “and” respectively), control samples have less common unique words such as “maybe” and “screaming”, compensating for repeated words.
Verbal repetition occurs for several reasons.
There is a correlation between attention span and the frequency of repetitions, with lower attention spans linked to increased repetition, suggesting that the inability for individuals with AD to focus on the image contributes to language impairment.
Perseverations are the main types of errors made in spontaneous speech tasks and was the main type of repetition observed. (Examples of perseverations in bold) Sabat 1994 defines perseveration as “ the inappropriate repetition of an entire phrase (e.g., “he is falling, he has a cookie, he is falling”).” Studies have theorised that verbal perseverations occur because of word finding difficulties (Word finding difficulties are a person's inability to remember the meaning of words, and can manifest as not being able to remembers the names of objects and people, and “tip-of-the-tongue states, where a speaker is momentarily unable to retrieve the lexical representation of a word, despite a frustrating feeling that the word is known and just beyond reach.” [See Background Research for more information]). If a word cannot be easily retrieved, then the individual will revert to repeating the word already said. Studies have documented that people with AD have language deficits compared to adults of the same age (Perverations make up 1-3% of speech in healthy older adults, and Miozzo et al (2012) found that 74% of AD participants had preservation rates above the average). Reeve et al (2017) reported that perseverations were detected in 9.3% of participants with mild, 25.5% of moderate, 24.6% of severe AD, and 15.9% of all participants with AD, in a study population of n=1707. (p<0.002)
Verbal perseverations may also be caused by inhibitory deficits. While participants were retrieving additional responses, previous potential responses accumulate, resulting in the participant being unable to suppress a response even when they are aware that a phrase or word has already been said. Response inhibition prevents repetitive phrases, and any impairments in response inhibition affects this ability. Studies have reported contradictory effects of this hypothesis, so more research is needed in this area. [17][18][19][20]
In summary, TTR is lower in the AD group because they repeat words and phrases more often than control due to perseverations.
I found that effect size of mean TTR is small to medium (d=0.35). This means that the magnitude of the TTR difference between the two groups was small. [25] I think this is because of the context that the participants were interpreting the illustration in.
Participants of the Pitt Corpus completed the interview while having the illustration in front of them (as opposed to having to recall the image from memory), in some cases the interviewer referenced the image itself- “Can you tell me what this is?” Participants didn’t need to use long or short term memory while completing the task. Difficulties recalling words from memory is an indicator of AD, and a study found that AD participants make more errors when recalling words (32% of the population) than controls (16% of the population).
In a study measuring the benefit of visual cues in conversation Chaves et al. (2007) found that people with AD have increased mean Global Cognition Scores when shown a picture relating to the topic (54.1 without a visual cue compared to 83.45 with). Visual cues can remind the person of the topic at hand, and provide concrete topics for communication by limiting the number of choices needed. [21][22][23][24]
Therefore, because AD participants were not using memory when completing the task, and instead given a visual cue, language impairments were less apparent in the AD group. It also suggests that analysing a simple linguistic feature like “number of unique words” is an important identification of dementia. Using data with a recall task might yield a larger effect size and lower TTR in AD participants.
Conclusion
- My first hypothesis was correct that people with AD use unique words less than healthy controls
- Mean TTR is greater in the control group (X=0.46) than in the AD group (X=0.42)
- This is partially due to people with AD using repetition more often to compensate for word finding difficulties
- The difference in mean TTR use between the two classes was statistically significant (-2.05, p=0.04)
- The was small practical effect size between the two groups (d=-0.35, p=0.04)
- This may be due to the task not being recalled from memory
- Participants with AD tend to relate what they see in image to experiences in their own life
- Measuring the number of unique words used is a good indicator of dementia
Application
Applications
- Machine learning: Machine learning is an increasing research topic in neuroscience and presents a cheaper and more accessible method to diagnose and detect dementia. Determining how vocabulary changes in AD and if TTR is a strong indicator of language impairment can inform researchers on what features are the most effective. TTR is already being used in some models and studies. With further research, machine learning models may be able to predict dementia with TTR and other metrics.
- Information for caregivers: Informing caregivers on linguistic impairments in AD (ie repeating phrases, trouble remembering words) can help them interact with patients in a calm and productive way. It can also help clear up common misconceptions about AD (ie That repetitive phrases are them just being annoying and attention seeking) and techniques that can improve communication (ie. Using visual aids like images)
Sources Of Error
Sources of error
- I didn’t account for the additional diagnoses of the participants. Some participants with AD had secondary and tertiary diagnosis other diseases such as Parkinsons and Lewy Body dementia, which may have impacted my results
- Other demographic data like the the progression of AD (if it was severe or mild), bilingualism, socioeconomic status, genetic factors, and if English was their first or second language weren’t available in the dataset, so they were not accounted for
Citations
Citations
Pitt corpus from:
Becker, J. T., Boller, F., Lopez, O. L., Saxton, J., & McGonigle, K. L. (1994). The natural history of Alzheimer's disease: description of study cohort and accuracy of diagnosis. Archives of Neurology, 51(6), 585-594.
Grant from: NIA AG03705 and AG05133
[1] Dementia numbers in Canada. (2024, February 1). Alzheimer Society of Canada. Retrieved March 12, 2024, from https://alzheimer.ca/en/about-dementia/what-dementia/dementia-numbers-canada
[2] Alzheimer's Facts and Figures Report. (n.d.). Alzheimer's Association. Retrieved March 12, 2024, from https://www.alz.org/alzheimers-dementia/facts-figures
[3] Klimova, B. (2009, June 3). Alzheimer’s disease and language impairments: social intervention and medical treatment. Retrieved March 12, 2024, from https://www.ncbi.nlm.nih.gov/pmc/articles/PMC4555976/%20,
Yc-20350447
[4] What Are the Signs of Alzheimer's Disease? | National Institute on Aging. (2022, October 18). National Institute on Aging. Retrieved March 12, 2024, from https://www.nia.nih.gov/health/what-are-signs-alzheimers-disease
[5] Albertoni, R. (2023, January 6). Semantic Granularity for the Semantic Web. Retrieved March 12, 2024, from https://link.springer.com/chapter/10.1007/11915072_93
[6] Strong, H. A. (2018, September 28). Four kinds of semantic variation · bill noble. bill noble. Retrieved March 12, 2024, from https://winobes.github.io/kinds-of-semantic-variation.html
[7] Altmann, L. (n.d.). Effects of Semantic Impairment on Language Use in Alzheimer's Disease. Retrieved March 12, 2024, from https://users.phhp.ufl.edu/rbauer/cognitive/articles/altmann_mcclung_semantic_AD.pdf
[8] Stanz, C. (2023, January 6). ,Alzheimer's & Dementia: Diagnosis, Assessment & Disease Monitoring Alzheimer's & Dementia: Diagnosis, Assessment & Disease Monitoring RESEARCH ARTICLE Open Access Automated text-level semantic markers of Alzheimer's disease. Retrieved March 12, 2024, from https://alz-journals.onlinelibrary.wiley.com/doi/full/10.1002/dad2.12276
[9] Lai, Y.-H., & Lin, Y.-T. (2012, October 23). Factors in action-object semantic disorder for Chinese- speaking persons with or without Alzheimer’s disease. Journal of Neurolinguistics.
[10] Aramaki, E. (n.d.). Vocabulary Size in Speech May Be an Early Indicator of Cognitive Impairment. Retrieved March 12, 2024, from https://journals.plos.org/plosone/article?id=10.1371/journal.pone.0155195
[11] Superordinates. (n.d.). Superordinate terms. Retrieved March 12, 2024, from http://sana.aalto.fi/awe/grammar/superordinate.htm
[12] Gang, E. (2022, September 6). What is Circumlocutory Speech in Disabled Veterans? Veterans Disability Info. Retrieved March 12, 2024, from https://www.veteransdisabilityinfo.com/blog/what-is-circumlocutory-speech-in-disabled-veterans/
[13] Guinn, C. (n.d.). A Comparison of Syntax, Semantics, and Pragmatics in Spoken Language among Residents with Alzheimer's Disease in Managed-Care. UNCW. Retrieved March 13, 2024, from https://people.uncw.edu/guinnc/papers/IEEE2014/Comparison-syntax-Guinn.pdf
[14] Rosselli, M. (2022, March 28). Culture, Ethnicity, and Level of Education in Alzheimer's Disease. PubMed. Retrieved March 14, 2024, from https://pubmed.ncbi.nlm.nih.gov/35347644/
[15] Frost, J. (n.d.). T Test Overview: How to Use & Examples. Statistics By Jim. Retrieved March 12, 2024, from https://statisticsbyjim.com/hypothesis-testing/t-test/
[16] Zozuk, N. C. (2023). Lexical diversity and language impairment. Sciendo. Retrieved March 14, 2024, from https://intapi.sciendo.com/pdf/10.2478/jazcas-2023-0047azcas-2023-0047
[17] Reeve, E. (2017). Exploration of verbal repetition in people with dementia using an online symptom-tracking tool. Retrieved March 12, 2024, from https://www.cambridge.org/core/services/aop-cambridge-core/content/view/28BB08AD166CF991B27E79F371CF2F0A/S1041610216002180a.pdf/exploration_of_verbal_repetition_in_people_with_dementia_using_an_online_symptomtracking_tool.pdf
[18] Abnormalities of connected speech in semantic dementia vs Alzheimer's disease. (2011). Retrieved March 12, 2024, from https://www.tandfonline.com/doi/full/10.1080/02687038.2012.654933?needAccess=true
[19] Miozzo, M. (2012). Perseverations in Alzheimer’s disease: Memory slips? Retrieved March 12, 2024, from https://newschoolcogneurolab.files.wordpress.com/2015/07/miozzo-et-al.pdf
[20] Troyer, M. (2023, May 5). Current Understanding of Verbal Fluency in Alzheimer's Disease: Evidence to Date. NCBI. Retrieved March 12, 2024, from https://www.ncbi.nlm.nih.gov/pmc/articles/PMC10167999/
[21] Sabat, S. (2009, June 3). Language function in Alzheimer's disease: A critical review of selected literature. Retrieved March 12, 2024, from https://www.academia.edu/31812210/Language_function_in_Alzheimers_disease_A_critical_review_of_selected_literature
[22] Egan, M. (2010). Methods to Enhance Verbal Communication between Individuals with Alzheimer's Disease and Their Formal and Informal Caregivers: A Systematic Review. NCBI. Retrieved March 12, 2024, from https://www.ncbi.nlm.nih.gov/pmc/articles/PMC2925413/
[23] Chaves, M. (2007). How many items from a word list can Alzheimer's disease patients and normal controls recall? Do they recall in a similar way? NCBI. Retrieved March 12, 2024, from https://www.ncbi.nlm.nih.gov/pmc/articles/PMC5619384/
[24] Brandão, L., & Monção, A. M. (2009, June 3). Discourse intervention strategies in Alzheimer's disease: Eye-tracking and the effect of visual cues in conversation. Retrieved March 12, 2024, from https://www.ncbi.nlm.nih.gov/pmc/articles/PMC5619405/
[25] McLeod, S. (2019). What does effect size tell you? PSY 210. Retrieved March 12, 2024, from https://online210.psych.wisc.edu/wp-content/uploads/PSY-210_Unit_Materials/PSY-210_Unit09_Materials/McLeod_EffectSize_2019.pdf
Image Credits
Fig 1: Maresova, P. (2015). Language impairments in the individual phases of Alzheimer's... ResearchGate. Retrieved March 14, 2024, from https://www.researchgate.net/figure/Language-impairments-in-the-individual-phases-of-Alzheimers-disease_tbl1_281289444
Fig 2: Sanz, C. (2022, January 14). Automated text-level semantic markers of Alzheimer's disease. Retrieved March 14, 2024, from https://alz-journals.onlinelibrary.wiley.com/doi/full/10.1002/dad2.12276
Fig 5: Niu, T. (2018). Boston cookie theft description task. Participants were asked... ResearchGate. Retrieved March 14, 2024, from https://www.researchgate.net/figure/Boston-cookie-theft-description-task-Participants-were-asked-to-describe-all-events-in_fig2_324600277
Fig 9: Sullivan, G. M., & Feinn, R. (2012). Using Effect Size—or Why the P Value Is Not Enough. NCBI. Retrieved March 14, 2024, from https://www.ncbi.nlm.nih.gov/pmc/articles/PMC3444174/
Project header is a screenshot of the Dementiabank site.
Acknowledgement
Thanks to:
- Dr. Tanya Dash and Dr. Vaden Masrani for being my mentors throughout this project
- Dr. Davida Fromm and Dr .Brian MacWhinney at DementiaBank, for entrusting me with the data
- Special thanks goes to Joshua Chow for reviewing my work