SharkWings: Hydrodynamic Shark Scales that Improve Aircraft Airfoil Aerodynamics
William Song
Renert School
Grade 11
Presentation
Problem
Please see Paper in Attachments for full Paper including all Figures and Abstract/Supplemental Information
Introduction:
The aviation industry uses 279 billion kilograms of jet fuel each year, equivalent to 8% of the world’s refined oil usage. Furthermore, jets release 950 million tons of carbon dioxide annually, 2.5% of global emissions. To combat pollution and save costs on fuel, aircraft manufacturers and airlines have turned to improving the aerodynamics of the planes, with decreasing drag having the most emphasis.
While it is possible to reshape the bodywork of existing aircraft, the costs and time associated with it would be monumental, so airlines need to find other ways of improving the aerodynamics of current aircraft. The phenomenon of passive flow control is a trending solution. Passive flow control adds small changes to the exterior of objects, passively manipulating airflow, being more accessible than active flow control, which uses sensors to adjust exterior components of objects. A well-known example of passive flow control is the dimples on a golf ball.
A new passive flow-control innovation in the aviation industry is Lufthansa Technik’s AeroSHARK, a film applied to an aircraft’s fuselage (Figure 1 (a)) with simplified denticles inspired by the Shortfin Mako Shark (Figure 1 (b)). The shark’s dermal denticles make it one of the most hydrodynamic fish in the world. Since 2024, all of Lufthansa’s Boeing 777s have AeroSHARK film and have reported a 1.1% drag reduction. If every aircraft in the world had AeroSHARK, they would save 2 billion kilograms of jet fuel and 6.3 billion kilograms of CO2, the equivalent of 1.3 million gas-powered cars, saving the aviation industry 1.2 billion dollars annually.

 Figure 1 (a): AeroSHARK Denticle Film
Lufthansa Technik. (n.d.). AeroSHARK. Lufthansa Technik. Retrieved February 26, 2026, from https://www.lufthansa-technik.com/en/aeroshark
Figure 1 (b): Microscopic View of AeroSHARK Denticle
Kuntzagk, S. K. (2024, April 18th). Aeroshark – Drag Reduction Using Riblet Film on Commercial Aircraft. Retrieved 11 19, 2025, from https://www.fzt.haw-hamburg.de/pers/Scholz/dglr/hh/text_2024_04_18_Aeroshark.pdf
Figure 1 (a): AeroSHARK Denticle Film
Lufthansa Technik. (n.d.). AeroSHARK. Lufthansa Technik. Retrieved February 26, 2026, from https://www.lufthansa-technik.com/en/aeroshark
Figure 1 (b): Microscopic View of AeroSHARK Denticle
Kuntzagk, S. K. (2024, April 18th). Aeroshark – Drag Reduction Using Riblet Film on Commercial Aircraft. Retrieved 11 19, 2025, from https://www.fzt.haw-hamburg.de/pers/Scholz/dglr/hh/text_2024_04_18_Aeroshark.pdf
Theory:
Drag force pulls the plane back, resulting in the need for more thrust to propel the aircraft, consuming more fuel and emitting more emissions. Drag force (Dtotal) is the sum of frictional drag (Df) and pressure drag (Dp) (Equation 1). Induced drag, the drag caused by wingtip vortices,also contributes to total drag, but does not affect this study and will be disregarded. Frictional drag is the drag when airflow passes over an object. The layer of molecules of air closest to the object’s surface will latch onto the surface and will become static, called the no-slip condition. Then, the layers above will also be slowed down by the air’s viscosity, causing a velocity gradient (Figure 2). The layers of air lose kinetic energy and are called the boundary layer.
Dtotal = Df + Dp Equation 1: Decomposition of Total Drag Force
Figure 2: Velocity Gradient of an Airfoil with Boundary Layer
The airflow above the wing is all low pressure, but as it slows down at the trailing end, it becomes higher relative pressure. As the boundary layer loses kinetic energy, it can no longer move forward towards the trailing edge against the adverse pressure gradient (Figure 3 (a)) that pushes back and stagnates. Once stagnant, the higher relative pressure air downstream pushes the boundary layer towards the leading edge, separating from the surface, and pushes the airflow above upwards. The airflow above still has ample kinetic energy and can push against the adverse pressure gradient. This is called flow separation (Figure 3 (b)).

 Figure 3 (a): Pressure gradient of an Airfoil
Figure 3 (b): Flow Separation on an Airfoil
Wikipedia. (n.d.). Flow separation. Wikipedia. Retrieved October 10, 2025, from https://en.wikipedia.org/wiki/Flow_separation
Figure 3 (a): Pressure gradient of an Airfoil
Figure 3 (b): Flow Separation on an Airfoil
Wikipedia. (n.d.). Flow separation. Wikipedia. Retrieved October 10, 2025, from https://en.wikipedia.org/wiki/Flow_separation
Flow separation creates pressure drag; it also reduces the amount of lift generated by the airfoil as the low-pressure air sucking the airfoil up detaches earlier. In high angles of attack, flow separation can lead to stall. It also decreases lift as the separated boundary layer becomes higher pressure and no longer provides upward suction force on the airfoil.
Currently, denticles increase the velocity of the boundary layer of an aircraft’s fuselage by straightening out any spanwise flow and microscopic turbulent eddies; the boundary layer is much more turbulent than free-stream air, reducing frictional drag. Airfoils could further benefit from denticles: by reducing frictional drag, their boundary layer energy is conserved, and it may reduce flow separation, thus reducing pressure drag.
Problem: Denticles can be found in many passive flow control applications, such as the hulls of ships, wind turbine blades, PC cooling fans, and airplane fuselages, but not on airfoils. This new niche lacks research; the only time denticles on airfoils were ever tested was by Lauder et al in 2018. In a water tank, not air, they found that Shortfin Mako Shark denticles (Figure 4) improved the lift/drag ratio by up to 323% at low angles of attack, a drag decrease far greater than the 1.1% decrease achieved by AeroSHARK on a flat surface in air. They also found, using Particle Image Velocimetry, a small recirculation bubble after the denticle that drew fast-moving air down to the boundary layer, but on a flat surface rather than a curved airfoil. Proof of concept exists for denticles reducing frictional and pressure drag in fluids; however, until now, no prior research has been conducted on reducing airfoil drag in air with denticles. Air is much less viscous than water and may produce significantly different results.
 Figure 4: 3D Models of Denticles Tested by Lauder et al
This project aims to determine whether or not denticles can reduce flow separation and increase lift on an airfoil in air, and find the best denticle geometry for reducing total drag. It is hypothesized that denticles will reduce flow separation and increase lift by straightening out the boundary layer, while also reducing frictional drag. The denticles are expected to reduce drag to an extent similar to AeroSHARK both from reduced frictional drag and pressure drag.
Method
A NACA 0012 airfoil was used for consistency with previous research on similar aerodynamic topics. It had a chord length of 1 meter and a wingspan of 0.25 meters; the small geometry was chosen for cheaper, less computationally demanding simulations while still addressing denticle effects. It had an angle of attack of 5 degrees for consistency with aircraft at cruising conditions. The base airfoil was tested, and the orientation of the airfoil was kept constant throughout while differing denticle geometries were added to the top surface of the airfoil (Figure 5 (a)).
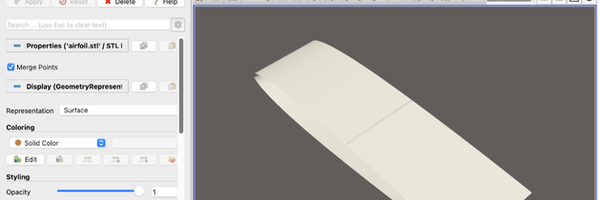
Rectangular prism denticles were chosen as their film can be manufactured cheaply by the aviation industry compared to exact replicas of the Shortfin Mako’s dermal denticles. The manipulated denticle dimensions, to find the best denticle geometry, were: denticle height, row placement on % chord, spanwise gap length, chordwise length, and number of rows (Figure 5 (b)). To test, CAD models were created by the ChatGPT Large Language Model from human-made prompts specifying all airfoil and denticle dimensions. Baseline denticle dimensions were: 0.001m height, 0.008m chordwise length, 0.001 spanwise width, 0.0025m spanwise gap, and 25% and 55% chord placement. All prompts requested a watertight wing, smoothness being prioritized, the denticles to be fully attached to the surface of the wing, and the final CAD model to be a downloadable binary STL file. The models were then put through FreeCAD to create ASCII STL meshes required for OpenFOAM CFD simulations.

 Figure 5 (a): CAD Airfoil with Denticles Model with Dimensions and Labels
Figure 5 (b): Two Staggered Denticle Rows of Denticle Length 0.004 and Total Length 0.008m
Figure 5 (a): CAD Airfoil with Denticles Model with Dimensions and Labels
Figure 5 (b): Two Staggered Denticle Rows of Denticle Length 0.004 and Total Length 0.008m
To test the airfoils, OpenFOAM, an open-source, free computational fluid dynamics simulation software, was used. The computational domain was 4 meters long by 2 meters tall by 0.25 meters wide, leaving nearly 1 meter above and below the airfoil, the inlet 1 meter in front of the airfoil’s leading edge, and the outlet 2 meters behind the airfoil’s trailing edge. The width matches the airfoil’s width, removing induced drag and isolating frictional and pressure drag. The side walls, front and back in the simulation, and top and bottom walls were set as “type symmetry” and “slip” to prevent any friction, similar to real life. The airfoil was set as “type wall” and “noSlip” to generate a boundary layer. The inlet was set at a constant velocity of 26m/s and the outlet was set to “freeStreamPressure”, letting the airflow exit unimpeded.
At 26m/s, a slower velocity compared to widebody aircraft was intentionally chosen for a smaller Reynolds number, closer to the 4.00x10⁴ that Lauder et al. used for their water tank. The larger the Reynolds number, the more turbulent the flow is. The kinematic viscosity of air set by OpenFOAM is 1.5x10⁻⁵m2/s. The 1.73x10⁶ used (Equation 2) was far greater as air was used. It also shows that the simulation is expected to be turbulent as Re >> 4,000 and a turbulent boundary layer exists. This Reynolds number allows easy denticle assessment while providing similar results. If Re were much larger, the boundary layer would have been far more turbulent and the denticle’s effects may have been diminished, making it more difficult to assess. Similar to real life, the airflow was already turbulent before it hit the airfoil: kinematic viscosity entering the inlet (nuTilda) is 4x10⁻⁵, making it 2.67 times more turbulent than still air at baseline air turbulence at 1.5x10⁻⁵.
Re = (v * L) / ν v is Fluid Velocity (26m/s) L is Flow Distance (1m) ν is the Kinematic Viscosity Equation 2: Reynolds Number Formula
A simpleFoam Spalart Allmaras RAS turbulence simulation solver was used as the air was turbulent and the velocity was subsonic, thus incompressible. There are three types of turbulence models: RAS, LES, and DNS. RAS stands for Reynolds Averaged Navier-Stokes and is the cheapest simulation to run on a personal laptop; however, it is not very accurate. LES and DNS are both transient solvers and require too much computing power, although they are much more accurate. Finding every microscopic eddy on the airfoil was not necessary, and estimating the turbulence was enough to determine if denticles have an effect and what the best denticle geometry is. The Spalart-Allmaras model is one of many RAS models and works best for external aerodynamics, while also being the cheapest.
RAS models are grid-dependent, so they are influenced heavily by mesh changes compared to LES and DNS. The blockMesh contained 67,584 cells: 132 in the X axis, 64 in the Y axis, and 8 in the Z axis (Figure 6 (a)). A denser blockMesh is not needed as the boundary layer is most important and that is captured by snappyHexMesh. snappyHexMesh contained 2,476,050 cells and created two refinement boxes: one for the entire airfoil and a second, smaller box that refines the denticle shape (Figure 6 (b)). The boundary layer is captured by the first refinement box’s six prism surface layers above the airfoil. The bottom prism layer sits entirely inside the viscous sublayer (Figure 6 (c)), the microscopic layer shearing against the static air trapped by the surface, keeping y+ around 1, making Spalart Allmaras most accurate. As the second refinement box mesh moves with different denticle % chord placements, data values through RAS will be influenced, and a baseline airfoil without denticles with a new second refinement box mesh must be simulated to keep the baseline airfoil constant, so the denticle effects can be compared.


 Figure 6 (a): blockMesh and snappyHexMesh of Computational Domain
Figure 6 (b): snappyHexMesh of Airfoil with both Refinement Boxes
Figure 6 (c): snappyHexMesh Prism Surface Layers
Figure 6 (a): blockMesh and snappyHexMesh of Computational Domain
Figure 6 (b): snappyHexMesh of Airfoil with both Refinement Boxes
Figure 6 (c): snappyHexMesh Prism Surface Layers
Data Extraction:
All RAS solvers have accuracy issues for micro-eddies and are heavily grid-dependent, leaving many companies to move to LES. Knowing the limitation, trends in forces and force coefficients were used rather than specific values. Initially, the coefficient of drag (Cd) and wallShearStress, the shear stress (τw) of the airfoil’s surface, in the X-direction 0.009m before (τw-) and 0.005m after the denticles (τw+) were chosen as they provide insight into total and frictional drag.
Cd is directly proportional to total drag (Equation 3). Frictional drag reduction of the entire airfoil after the denticles is not proportional to τw+, but the reduction right behind the denticles is (Equation 4). However, a reduction of frictional drag of the entire airfoil is indicated by a decrease in τw+, and was predominantly used in the analysis. The coefficient of lift (Cl) was also chosen as it shows boundary-layer pressure changes, and thus pressure drag. The forceCoeffs dict used had drag direction (dragDir) of (1 0 0), lift direction (liftDir) of (0 1 0), and frontal area (Aref) of 0.035. All forceCoeffs dict values, these ones in particular, were cross-checked by mentor Professor Towne and were confirmed correct. First, the denticle height at 25% chord was tested. As denticle height increased from 0m to 0.001m, Cd fell from 5.877x10⁻³ to 5.314x10⁻³. Then, it fell significantly to 3.381x10⁻³ at the denticle height of 0.002m. At denticle height 0.004m, Cd converged to a negative value -1.945x10⁻³.
Dtotal = ½CdρAv2 ρ is Fluid Density A is Frontal Area v is Fluid Velocity Equation 3: Formula of Total Drag Force
τw = V/A V is the Frictional Drag Force A is the Area Equation 4: Formula of Wall Shear Stress
The simulation converged when Cd became constant for multiple timesteps. Initially, the simulation would end at 1,500 timesteps, and was then raised to 2,500. At this timestep, all coefficients in forceCoeffs had been consistent for the past 750 timesteps and constant for the last 400. An average coefficient value of the last 100 timesteps was not needed. τw- and τw+ values were found through ParaView post-processing.
Since Cd of the 0.004m tall denticle was negative, changes to forceCoeffs Aref value were made, but failed to correct the anomaly. The issue was unclear, but flow conditions exceeded the limitations of the RAS solver. The same issue may have caused the significant decrease in Cd between the 0.001m tall and 0.002m tall denticles. Some possible reasons for the RAS problem could have been that it averaged the turbulence and recirculation generated by the taller 0.004m denticle over the entire airfoil rather than a specific area where the micro-eddies actually are, or it could have been an inherent limitation that they predict attached boundary layer flow and often struggle with pressure drag. Cl and τw values remained consistent across the simulations.
Neither I nor my mentor Professor Towne knew how to simply correct the solver issue, but I realized that Cd and τw values were reliable and confirmed with my mentor. Knowing that total drag is the sum of frictional drag and pressure drag, and that frictional drag is directly proportional to τw, frictional drag can be isolated. Shear stress after the denticle was more important than before the denticle, as it showed the frictional drag reduction compared to the baseline airfoil. Pressure drag can be estimated by Cl: since lift is created by a pressure difference, and the airfoil remains constant, lift only changes with boundary layer attachment. If the boundary layer separated, its pressure would increase and would create much less suction on the top of the airfoil, less lift. Boundary layer separation also leads to increased pressure drag, and as flow separation is isolated by Cl change, changes in pressure drag are inversely proportional to changes in Cl. A similar level of accuracy is also kept by analyzing trends of Cl and τw+, as is with trends of Cd.
Data collected for this experiment were Cl and τw before and after the denticles at a timestep of 2,500. As RAS solvers are mesh dependent, the results of a baseline airfoil with its second snappyHexMesh refinement box moved would change. To preserve accuracy, a baseline airfoil was generated with every new denticle % chord placement. All airfoils with denticle results would be compared to the base airfoil with the same mesh. Trends in Cl and τw+were analyzed, any denticle that reduced τw+ and increased Cl would reduce total drag. The boundary layer velocity was visualized through ParaView post-processing. The reduced velocity region after the denticles was analyzed for qualitative denticle effects.
Analysis
Results & Analysis:
Manipulated Denticle Height at 25% Chord:
τw and Cl of the airfoil of manipulated denticle heights: 0.001m, 0.002m, 0.004m at 25% chord are shown (Table 1). Compared to the baseline airfoil at 25% chord, a consistent trend is that τw+ decreased as denticle height increased, indicating a reduction in frictional drag. τw+ of the 0.001m tall denticle is 1.699 N/m2 (i.e., a 5.98% reduction in frictional drag compared to the baseline airfoil at 1.807 N/m2). It is 1.444 N/m2 for the 0.002m tall denticle (20.1% reduction), and 1.000 N/m2 for the 0.004m tall denticle (44.7% reduction). By channeling the boundary layer, it became less turbulent, reducing frictional drag. As height increased, Cl decreased, indicating an increase in pressure drag. Cl of the baseline airfoil is 4.147 and 4.141 of the 0.001m tall denticle (i.e., a 0.14% decrease in lift). Cl of the 0.002m tall denticle is 4.124 (0.55% decrease) and Cl of the 0.004m tall denticle is 4.087 (1.45% decrease). While lift is not directly proportional to pressure drag, a decrease in the entire airfoil’s lift indicates increased boundary layer pressure and results in a large drag increase.
Table 1: Post-Processing Results of Manipulated Denticle Heights at 25% Chord
| Denticle Arrangement | τw- X dir (N/m2) | τw+ X dir N/m2 | Cl | Estimated increase or decrease Cd |
|---|---|---|---|---|
| Baseline at 25% Chord | 2.557 | 1.807 | 4.147 | N/A |
| 0.001m Height at 25% Chord | 2.526 | 1.699 | 4.141 | ≈ |
| 0.002m Height at 25% Chord | 2.5 | 0.144 | 4.124 | ≈ |
| 0.004m Height at 25% Chord | 2.578 | 1 | 4.087 | ≈ |
Also noted was a small recirculation bubble behind the denticles (Figure 7 (a)). A low-pressure region on the top surface of the denticle (Figure 7 (b)), as airflow passes the front face of the denticle, vortices are created. Together, they draw high-energy airflow down to the boundary layer, increasing its velocity. By adding forward momentum, the boundary layer becomes more turbulent and results in more frictional drag, a direct trade-off to increased boundary straightening. It was not an issue as τw+ still decreased, and can be beneficial by delaying flow separation, reducing pressure drag. The presence of a recirculation bubble is consistent with Lauder et al’s findings and detected by a negative τw (Figure 7 (c)). A reason the denticle increased pressure drag is that the denticle creates a turbulent wake behind it, which cannot be resolved in post-processing by RAS solvers. That turbulent wake inside the boundary layer may have overridden the benefits of the recirculation bubble and made the boundary layer more turbulent and even thicker after the denticles, increasing pressure drag. The 0.004m tall denticle sticks outside the boundary layer and creates a turbulent wake, making the boundary layer larger behind it.


 Figure 7 (a): Velocity of 0.002m Tall Denticle at 25% Chord with Recirculation Bubble and Flow Reattachment
Figure 7 (b): Pressure of 0.002m Tall Denticle at 25% Chord
Figure 7 (c): τw X-axis of Denticles with Recirculation Bubble
Figure 7 (a): Velocity of 0.002m Tall Denticle at 25% Chord with Recirculation Bubble and Flow Reattachment
Figure 7 (b): Pressure of 0.002m Tall Denticle at 25% Chord
Figure 7 (c): τw X-axis of Denticles with Recirculation Bubble
Wall shear stress upstream of the denticles, τw-, was also recorded to investigate the impact of the denticles on the frictional drag of the flow before hitting it. Specifically, τw- was 2.557 N/m2 for the baseline airfoil, 2.526 N/m2 for the 0.001 m tall denticles (i.e., a 1.21% decrease from the baseline), 2.500 N/m2 (2.23% decrease) for the 0.002m tall, and 2.587 N/m2 (0.83% increase) for the 0.004m tall. The changing frictional force is caused by the high and low pressure variations that the denticles create. The flow immediately before the denticles experiences a pressure buildup, and the fluid above the denticles experiences a pressure decrease. The low-pressure region overrides the high-pressure region in the 0.001m and 0.002m denticles, speeding up the boundary layer and reducing turbulence. The high-pressure region dominates in the 0.004m denticles, creating a small adverse pressure gradient, increasing turbulence before the denticles. However, as changes in τw- are so small, they have a negligible effect on frictional drag.
To estimate the effect of the denticles on total drag, changes in both frictional and pressure drag were compared to the baseline airfoil. Since all denticles decreased frictional drag but increased pressure drag as they got taller, their effect on total drag canceled out and was negligible. Furthermore, decreasing lift is not beneficial for many aerospace applications, such as gliders, military drones, and small planes that require lift.
Manipulated Denticle % Chord Placement:
As the single row of denticles was moved along the top of the airfoil to 25, 50, 55, and 70%, τw+ change compared to the baseline airfoil decreased for all denticles (Table 2). The 25% chord placement created a 5.98% decrease in frictional drag at 1.699 N/m2 from 1.807 N/m2; the 40% chord placement created a 8.16% decrease at 1.260 N/m2 from 1.372 N/m2; the 55% chord placement created a 5.31% decrease at 1.053 N/m2 from 1.112 N/m2 ; the 70% chord placement created a 6.58% decrease at 0.823 N/m2 from 0.882 N/m2. Cl decreased for all denticles compared to their baseline airfoil, except the regular denticle at 55% chord. The 25% chord placement created a 0.14% decrease in lift at 4.141 from 4.147; the 40% chord placement created a 0.22% decrease at 4.140 from 4.149; the 55% chord placement created a 0.70% increase at 4.181 from 4.152; the 70% chord placement created a 0.10% decrease at 4.138 from 4.142.
Table 2: Post-Processing Results of Manipulated % Chord Placements
| Denticle Arrangement | τw- X dir (N/m2) | τw+ X dir (N/m2) | Cl | Estimated increase or decrease Cd |
|---|---|---|---|---|
| Baseline at 25% Chord | 2.557 | 1.807 | 4.147 | N/A |
| 0.001m Height at 25% Chord | 2.526 | 1.699 | 4.141 | ≈ |
| Baseline at 40% Chord | 1.689 | 1.372 | 4.149 | N/A |
| 0.001m Height at 40% Chord | 1.791 | 1.26 | 4.14 | ≈ |
| Baseline at 55% Chord | 1.359 | 1.112 | 4.152 | N/A |
| 0.001m Height at 55% Chord | 1.368 | 1.053 | 4.181 | Decrease |
| Baseline at 70% Chord | 1.101 | 0.882 | 4.142 | N/A |
| 0.001m Height at 70% Chord | 1.062 | 0.824 | 4.138 | ≈ |
All the denticles decreased boundary-layer turbulence, with the 40% doing the most. Approximately from ParaView post processing, 30% chord is when the adverse pressure gradient begins. The denticle straightens out the flow with greater effect as turbulence begins. The 55% chord placement denticle was the only one that decreased pressure drag. The 25% and 40% chord denticle rows all stuck out of the boundary layer, drawing fast air down to the boundary layer but also creating a turbulent wake, enlarging the boundary layer, leading to earlier stagnation, with the 40% denticle creating more stagnation. The 70% denticles were entirely within the boundary layer, rendering the recirculation bubble useless as fast air is not drawn down. Also, it creates a smaller wake in comparison to the earlier denticles, and inside the boundary layer, slowing it down even more. The 55% denticles barely stick out into the boundary layer, drawing high-energy air down into the boundary layer, and its wake is contained within the boundary layer, but the high-energy air overrides its effects, making it the only % chord placement that reduces total drag.
Manipulated Denticle Height at 55% Chord:
As the 0.001m tall baseline dimensions denticle at 55% chord was the only geometry so far to decrease drag, all future geometry manipulations were done at 55% chord placement. A taller 0.002m denticle was also tried at 55% chord (Table 3). It had a τw+ of 0.915 N/m2 and Cl of 4.128, showing the same trend as a taller denticle at 25% chord. Its lesser Cl was smaller than the baseline airfoil’s at 4.152 (i.e., a 0.72% decrease), and its τw+ is 17.8% less. It creates less total drag than the shorter 0.001m tall denticle and similar drag as the baseline airfoil by sticking out past the boundary layer into fast-flowing air.
Table 3: Post-Processing Results of Manipulated Denticle Height at 55% Chord Placement
| Denticle Arrangement | τw- X dir (N/m2) | τw+ X dir (N/m2) | Cl | Estimated increase or decrease Cd |
|---|---|---|---|---|
| Baseline at 55% Chord | 1.359 | 1.112 | 4.152 | N/A |
| 0.001m Height at 55% Chord | 1.368 | 1.053 | 4.181 | Decrease |
| 0.002m Height at 55% Chord | 1.35 | 0.915 | 4.128 | ≈ |
Manipulated Denticle Spanwise Gap:
Spanwise gap between denticles at 55% chord aims to show how many denticles are needed to best and sufficiently straighten out the turbulent boundary layer (Table 4). The narrower 0.001m gap had a τw+ of 0.994 N/m2 compared to the 1.112 N/m2 of the baseline airfoil (i.e., a 10.61% decrease). The wider 0.004m gap had a τw+ of 1.045 N/m2 (6.03% decrease). Cl of the narrow gap was 4.135 (i.e., a 0.41% decrease compared to the baseline airfoil at 4.152) and Cl of the wide gap was 4.143 (0.22% decrease). They were not effective in reducing the total drag, unlike the 0.0025m gap.
Table 4: Post-Processing Results of Manipulated Denticle Spanwise Gap at 55% Chord
| Denticle Arrangement | τw- X dir (N/m2) | τw+ X dir (N/m2) | Cl | Estimated increase or decrease Cd |
|---|---|---|---|---|
| Narrow 0.001m Spanwise Gap at 55% Chord | 1.364 | 0.994 | 4.135 | ≈ |
| Wide 0.004m Spanwise Gap at 55% Chord | 1.354 | 1.045 | 4.143 | ≈ |
There is a trend that as the denticle spanwise gap decreases, the τw+ decreases as the turbulent boundary layer is straightened more. As the denticles have the same height and placement, the recirculation bubble increases as denticles become denser, drawing more high-energy air down. However, as denticle density increases, the turbulent wake increases. There was no trend in Cl as the denticle spanwise gap decreased, as the best gap was the middle 0.0025m. As the gap is larger, the denticles create a less turbulent wake but draws less air down in the smaller recirculation bubble. A spanwise gap of 0.0025m is the sweet spot.
Manipulation of Denticle Chordwise Length:
Manipulating the chordwise length of the denticles shows how much boundary layer straightening is needed to best reduce drag (Table 5). The short 0.004m long denticles had a τw+ of 1.041 N/m2 (i.e., a 6.38% decrease compared to the baseline airfoil) and the long denticles had a τw+ of 1.019 N/m2 (8.36% decrease). The short denticles had a Cl of 4.141 (i.e., a 0.26% decrease compared to the baseline airfoil) and the long denticles had a Cl of 4.139 (0.31% decrease). They were not effective at reducing the total drag, unlike the regular 0.008m long denticle.
Table 5: Post-Processing Results of Manipulated Chordwise Length at 55% Chord
| Denticle Arrangement | τw- X dir (N/m2) | τw+ X dir (N/m2) | Cl | Estimated increase or decrease Cd |
|---|---|---|---|---|
| Baseline at 55% Chord | 1.359 | 1.112 | 4.152 | N/A |
| 0.001m Height at 55% Chord | 1.368 | 1.053 | 4.181 | Decrease |
| Short 0.004m Chordwise Length at 55% Chord | 1.354 | 1.041 | 4.141 | ≈ |
| Long 0.016m Chordwise Length at 55% Chord | 1.376 | 1.019 | 4.139 | ≈ |
There is a trend that as denticle chordwise length increased, the frictional drag after the denticles decreased. This shows that the longer denticles did straighten out the boundary layer better. Denticle length did not have a trend in Cl, as the regular 0.008m long denticle increased Cl while the short and long denticles decreased it. It was because of flow attachment over a blunt body: as airflow encounters the blunt front denticle surface, it creates strong vortices which eventually reattach to the denticle’s surface (Figure 12). The vortices were unable to reattach to the short denticle and caused a strong turbulent wake, and were unable to form a recirculation bubble. That led to a low Cl. On the long denticle, the vortices reattached but, since they were so turbulent, lost kinetic energy quickly. They were unable to create a strong recirculation bubble, but had a smaller wake, supported by a similar Cl to that of the short denticle. The medium 0.008m long denticle again is the sweet spot.
Manipulation of Second Denticle Row Length:
The final manipulation was whether splitting the single denticle row into two staggered rows would have any effect at 55% chord. The denticle lengths 0.004, 0.008, and 0.016m were split into two rows, each 0.002, 0.004, and 0.008m long, respectively (Table 6). The τw+ of the short 0.002m long denticle rows was 0.989 N/m2 (i.e., a 11.06% decrease from the baseline airfoil). The τw+ of the 0.004m long denticle rows was 0.971 N/m2 (12.68% decrease). The τw+ of the 0.008m long denticle rows was 0.978 N/m2 (12.05% decrease). All staggered second denticle rows had lower τw+ than the single row of the same total length. Cl of the 0.002m long denticle rows was 4.132 (i.e., a 0.48% decrease from the baseline airfoil). Cl of the 0.004m long denticle rows was 4.136 (0.39% decrease) and Cl of the 0.008m long rows was 4.135 (0.41% decrease). All Cl of two staggered rows was lower than the Cl of a single row of the same total length.
Table 6: Post-Processing Results of Single Denticle Row and Additional Denticle Row
| Denticle Arrangement | τw- X dir (N/m2) | τw+ X dir (N/m2) | Cl | Estimated increase or decrease Cd |
|---|---|---|---|---|
| Baseline at 55% Chord | 1.359 | 1.112 | 4.152 | N/A |
| 0.001m Height at 55% Chord | 1.368 | 1.053 | 4.181 | Decrease |
| Short 0.004m Chordwise Length at 55% Chord | 1.354 | 1.041 | 4.141 | ≈ |
| Long 0.016m Chordwise Length at 55% Chord | 1.376 | 1.019 | 4.139 | ≈ |
| 2 Staggered Rows 0.002m Chordwise Length at 55% Chord | 1.461 | 0.989 | 4.132 | ≈ |
| 2 Staggered Rows 0.004m Chordwise Length at 55% Chord | 1.453 | 0.971 | 4.136 | ≈ |
| 2 Staggered Rows 0.008m Chordwise Length at 55% Chord | 1.422 | 0.978 | 4.135 | ≈ |
There was no trend as the total length of the staggered rows increased in either τw+ or Cl. The 0.004m long row staggered rows had the lowest τw+ and the highest Cl. It had the same total length as the 0.008m long denticle. A second staggered row did not decrease total drag as it increased pressure drag. Cl of the second staggered row decreased in comparison with the single row of the same total length. It was seen that the pressure at the start of the second row was the lowest throughout the denticles (Figure 8). This indicates that the flow hitting the second denticle is more turbulent and higher velocity than the flow hitting the first denticle, showing that the first denticle energized the flow in between as it was straightened. The low-pressure region also indicates that the vortices generated by the blunt edge of the second denticle row were much stronger, which would reattach later, thus creating a large wake behind the second row. This supports Cl being lower for all two row lengths. τw+ is lower compared to the single row denticles, as the second row straightens out the boundary layer much more. Interestingly, the 0.004m long staggered rows had the least frictional drag and the least pressure drag. The shorter 0.002m long staggered rows would have not been able to straighten the boundary layer much, only adding more turbulence compared to the longer two denticle rows. The longer 0.008m staggered rows would slow the airflow around it down just like the 0.016m long single row. Once slowed, it would become turbulent as it shears along the denticle gaps, decreasing the velocity of the boundary layer and stagnating earlier than the 0.004 staggered rows.
Figure 8: Pressure of Second Staggered Denticle Row
Conclusion
In conclusion, this study demonstrates that denticles on an airfoil can reduce its drag and increase lift. However, the denticle geometry must fall under a sweet spot. Denticles straighten out the turbulent boundary layer and increase boundary-layer velocity, decreasing drag. But, as the rectangular prism denticles are bluff bodies, they create their own turbulent wake. If the denticle protrudes out of the boundary layer, its wake thickens the boundary layer. If the denticle is too short, the wake will not be contained, overriding the ability of the recirculation bubble, reducing the boundary layer velocity. If the denticle is too long, its surface decreases the energy of the boundary layer and the vortices it generates, and the boundary layer will become more turbulent, and the recirculation bubble will become weak. The geometries tested could be easily manufactured, so they were not as aerodynamically efficient. The optimal denticle geometry, the only one that succeeded, was a single row of 0.001m tall, 0.008m long, 0.001m wide denticles spaced 0.0025m apart, placed at 55% chord. The exact drag reduction is unknown, as data only gives an estimate of whether or not drag was reduced, but is estimated to be within \~1-3% compared to an airfoil without denticles. This value is within the range of Lufthansa’s AeroSHARK denticle film, possibly saving the aviation industry billions of dollars annually.
The biggest limitation came from the Spalart-Allmaras RAS solver. Due to low computational ability, the cheapest OpenFOAM solver was used. Furthermore, a simplified blockMesh and snappyHexMesh, especially using a second snappyHexMesh refinement box. Future simulations should be conducted with a LES or Hybrid RAS-LES solver and with a blockMesh of 10m x 10m x 0.25m and a single snappyHexMesh refinement box able to resolve the denticles, which meshes the entire airfoil. The decreased mesh dependency of LES solvers will give consistent Cd and Cl results as denticles are manipulated. A Hybrid RAS-LES solver is cheaper; the LES solver will simulate the boundary layer, while the RAS solver will simulate airflow at a distance from the airfoil. The LES solver in Hybrid RAS-LES is also not mesh-dependent. By taking Cd and Cl values from the simulation, accurate denticle effects can be determined. RAS solvers also underpredict flow separation, so Cl and pressure drag differences created by denticles were deflated, although trends remained the same. The optimal denticle found should have made a larger decrease in pressure drag. Airflow entering through the inlet was turbulent, 2.67 times more turbulent than still air and similar to that of a wind tunnel and that of airflow hitting the wing of an aircraft in flight. Future experiments can also be done in a wind tunnel for the most accurate Cd and Cl. Another future direction is to explore whether or not covering the entire airfoil’s surface with denticles has any effect. Due to mesh limitations, a maximum of 2 staggered rows were tested, but AeroSHARK uses a single long denticle row for their film.
Denticle film can be implemented in many fields that experience flow separation over curved edges. Such fields include Formula One and the automotive industry, where decreasing flow separation behind sedans, under diffusers, and over wings can provide much more downforce, making cars safer and giving electric vehicles a longer range. They can also benefit water mains and oil pipelines as denticles reduce frictional drag, putting less strain on the pipes, and reduce the size of the boundary layer, increasing the velocity of the flow. Liquid flows have larger boundary layer sizes than gas flows, due to increased viscosity, making the denticles more powerful as seen by Lauder et al’s 323% increase in Cl/Cd for an airfoil in water. Ships and submarines can also benefit from denticles, which create smaller wakes.
Citations
Citations: International Energy Agency. (n.d.). Aviation. https://www.iea.org/energy-system/transport/aviation (Retrieved October 1, 2025) Kuntzagk, S. (2024, April 18). AeroSHARK – Drag reduction using riblet film on commercial aircraft [Lecture presentation]. Hamburg Aerospace Lecture Series RAeS Hamburg, DGLR, VDI, ZAL & HAW Hamburg. https://www.fzt.haw-hamburg.de/pers/Scholz/dglr/hh/text_2024_04_18_Aeroshark.pdf (Retrieved October 12, 2025) Lufthansa Group. (n.d.). AeroSHARK – DCEC article [Brochure/article]. https://cdn0.scrvt.com/fcc1c913dc63063c259fa05200249ccd/2296f9cbf99c2b86/0abb82c6b860/23-29-055-AeroSHARK-DCEC-Artikel_EN_screen-04.pdf (Retrieved October 12, 2025) Farrell, D. T., McCann, C. M., Forte, A. E., et al. (2025). Programmable surface dimpling of textile metamaterials for aerodynamic control. Advanced Materials. Advance online publication. https://doi.org/10.1002/adma.202505817 (Retrieved November 20, 2025) Domel, A. G., Saadat, M., Weaver, J. C., Haj-Hariri, H., Bertoldi, K., & Lauder, G. V. (2018). Shark skin-inspired designs that improve aerodynamic performance. Journal of the Royal Society Interface, 15(139), Article 20170828. https://doi.org/10.1098/rsif.2017.0828 (Retrieved October 15, 2025) Ladson, C. L. (1988). Effects of independent variation of Mach and Reynolds numbers on the low-speed aerodynamic characteristics of the NACA 0012 airfoil section (NASA Technical Memorandum 4074). National Aeronautics and Space Administration. https://ntrs.nasa.gov/api/citations/19880019495/downloads/19880019495.pdf (Retrieved January 5, 2026) SimScale. (n.d.). What is the Reynolds number? https://www.simscale.com/docs/simwiki/numerics-background/what-is-the-reynolds-number/ (Retrieved December 1, 2025) National Aeronautics and Space Administration. (n.d.). Spalart-Allmaras turbulence model. Turbulence Modeling Resource. https://turbmodels.larc.nasa.gov/spalart.html (Retrieved December 1, 2025) Diskin, B., et al. (2020). High-fidelity CFD verification workshop: Spalart-Allmaras turbulence model (or related verification report; adjust based on exact match). National Aeronautics and Space Administration. https://ntrs.nasa.gov/api/citations/20200002463/downloads/20200002463.pdf (Retrieved December 20, 2025) Stanford University. (n.d.). Turbulence influences the world, and turbulence research providing advanced understanding of complex flows. Engineering News. https://engineering.stanford.edu/news/turbulence-influences-world-and-turbulence-research-providing-advanced-understanding-complex (Retrieved January 25, 2026) Jamal, T. (2025, August 21). AMS presentation. NASA Advanced Supercomputing Division. https://www.nas.nasa.gov/assets/nas/pdf/ams/2025/AMS_20250821_Jamal.pdf (Retrieved February 15, 2026) Embry-Riddle Aeronautical University. (n.d.). Bluff body flows. In Introduction to aerospace flight vehicles. Eagle Publications. https://eaglepubs.erau.edu/introductiontoaerospaceflightvehicles/chapter/bluff-body-flows/ (Retrieved November 10, 2025) Matsui, K. (n.d.). Calibration of Spalart-Allmaras model for simulation of corner flow separation. Global Power and Propulsion Society Journal. https://journal.gpps.global/Calibration-of-Spalart-Allmaras-model-for-simulation-of-corner-flow-separation-in,135174,0,2.html (Retrieved October 20, 2025) Irwin, P. A. (2007). Bluff body aerodynamics in wind engineering. Science Direct. https://www.sciencedirect.com/science/article/abs/pii/S0167610507001250) (Retrieved January 17, 2026) Embry-Riddle Aeronautical University. (n.d.). Turbulent flows. In Introduction to aerospace flight vehicles. Eagle Publications. https://eaglepubs.erau.edu/introductiontoaerospaceflightvehicles/chapter/turbulent-flows/ (Retrieved November 10, 2025) Agusto, G. L. (n.d.). Evaluation of NACA4412 smooth and denticle-covered airfoils using blade element momentum theory. IOP Conference Series: Earth and Environmental Science, 1500(1), Article 012009. https://doi.org/10.1088/1755-1315/1500/1/012009 (Retrieved October 20, 2025) AskNature. (n.d.). Low-noise surface coating for wind turbine blades inspired by shark skin. https://asknature.org/innovation/low-noise-surface-coating-for-wind-turbine-blades-inspired-by-shark-skin/ (Retrieved November 5, 2025) Noctua. (n.d.). Vortex control notches. https://www.noctua.at/en/expertise/tech/vortex-control-notches (Retrieved October 10, 2025) Noctua. (n.d.). Flow acceleration channels. https://www.noctua.at/en/expertise/tech/flow-acceleration-channels (Retrieved January 10, 2026) Lekkaka, M. R. (2022, 10 1). Recent advances in understanding the flow over bluff bodies with different geometries at moderate Reynolds numbers. ScienceDirect, 261(111611). https://www.sciencedirect.com/science/article/pii/S0029801822009751 (Retrieved January 17, 2026) Elsevier. (n.d.). Flow separation. ScienceDirect Topics. https://www.sciencedirect.com/topics/engineering/flow-separation (Retrieved October 1, 2025) OpenFOAM Foundation. (2021). wallShearStress [Function object documentation]. OpenFOAM v2112 User Guide. https://www.openfoam.com/documentation/guides/v2112/doc/guide-fos-field-wallShearStress.html (Retrieved January 16, 2026)
Acknowledgement
Acknowledgements:
The author would like to thank Mr. Carlos Schroeder (Renert School), Mr. Assaf Gordon (Renert School), and Dr. Aaron Towne (The University of Michigan) for their incredible guidance.
The author would also like to thank Dr. Iaci Soares (Renert School), Mx. Mythril Dallas (Renert School), Mr. Phillip Heidebrecht (Renert School), and Ms. Rachel Reed (Renert School) for their thoughtful feedback and guidance.
Finally, the author thanks his friends, teachers, and family for their support and enthusiasm throughout the scientific process.