How efficient is the trading bot when performing for certain selected assets over a set timeframe compared to a human?
Grade 9
Presentation
Hypothesis
If the trading bot can swiftly make trades and analyse data in volatile markets, then it will likely generate higher returns compared to a human as the human cannot match its celerity in making trades and analysing data.
Research
In the modern world of finance and trading, and with the increasing technological advancements in society today, the idea of using bots to automate trades is one that has greatly increased in interest. With the advent of technology, stock trading has the potential to evolve into something where bots can be utilised to execute time-consuming strategies within simply just a few moments. These bots leverage algorithms and a multitude of varying strategies to make real-time decisions in financial markets. In contrast, human traders rely on their experience, intuition, and time-consuming analysis to make similar decisions. It may take hours of analysing previous data and consultation within trading groups/communities to simply guarantee or promote a higher probability of profit for a regular human or beginner trader. Additionally, it may be difficult to trade a multitude of stocks simply in one day due to the need for eating, sleeping, and more activities in a person's daily routine. However, due to the inexperience of the bot, its inability to exactly think for itself, and it being limited to options and decisions it was programmed for, it is debatable and contradictory on whether or not the tradeoff is worth it.
The primary objective of this experiment is to compare the efficiency of the trading bot in volatile and vastly differing markets to human trades in the very same market. This will mainly be done by evaluating their performance in terms of profitability and accuracy
Stock Trading Bot
A stock trading bot, or algorithmic trading system, is a software application that uses predefined algorithms to analyse market data and execute buy and sell orders on behalf of investors. We programmed our bot to utilise strategies such as SMA, RSI and Volume when analysing the patterns of the stock. One advantage about using bots as discussed before, is that it can process vast amounts of data in a brief moment. This allows them to capitalize on market movements that would normally be overlooked or consume a large sum of time to find by regular traders. Another large advantage the bot has is its ability to and minimise the emotional biases that often affect human traders. A very problematic part of trading is emotional bias, and things such as FoMO are common. FoMO is a unique term that has only recently arisen to describe the perception of or the fear of missing out, traders often feel obliged to hold something despite signs and signals that the stock will dip due to the fear of them selling right before exponentially increases in price. This is especially common due to people looking at the exponential growth of stocks such as Apple, NVIDIA, Microsoft, etc.
Modern trading bots use various strategies such as:
- Trend Following: Bots identify and follow market trends, buying when prices are rising and selling when they are falling.
- Arbitrage: Bots exploit price discrepancies between markets or instruments to secure profits.
- Market Making: Bots provide liquidity by simultaneously offering buy and sell orders, profiting from the difference (spread) between them.
- Mean Reversion: Bots take advantage of price fluctuations around a perceived "normal" or average value, betting that prices will return to this average over time.
- RSI: Relative Strength Index (RSI) is a momentum oscillator that measures the speed of price changes relative to the speed of price changes. The RSI operates on a scale of 0-100 to assess whether something is overbought or oversold. For example, an overbought stock has an RSI over 70, while an oversold stock has an RSI under 30. The calculation involves average gains and losses over a set time, whereas the standard period for calculation is 14 periods. Traders use RSI to find reversals, divergences, and to validate price direction. For instance, a bullish divergence occurs when the RSI moves up and the price moves down; this means that a price increase will soon come. The contrary is also true when RSI moves down and the price goes up—this is a bearish divergence which indicates that the price will soon drop. In addition, RSI is utilised alongside many other technical indicators to reinforce and corroborate results.
- Simple Moving Average (SMA) is the average price of an asset over a defined number of days. So, for example, if one averages the price of a stock over ten days (summing the price of the last ten days and dividing by ten), one has a ten-day simple moving average. This simple moving average helps one average the spikes and drops and, in hindsight, see a trend going up or down during that time frame. SMA is useful from a trader's perspective because it helps them assess beyond the more recent micro price movements and instead deduce the macro trends over time. For example, when something is trading above the simple moving average, it's considered bullish; when it's trading below the SMA, it's considered bearish. In conjunction with other indicators, simple moving averages provide a better indication of entry and exit.
- The Volume Indicator reveals how much a stock is transacted over time. If the Volume Indicator reads higher than average, it's as if more people are trading this stock or crypto and thus, it appears to have more interest and/or momentum. The same goes for lower-than-average. Traders use volume as confirmation of price actions. If a price change moves to the upside and volume simultaneously increases, that price increase appears to be more than a fluke and instead a real market increase. If, however, prices fluctuate one way or the other but volume does not confirm the trend, then it suggests a tenuous trend that can reverse at any time. Volume increases, however, are emergencies—crisis situations of too much buying or too much selling within too short of a time frame. Therefore, assessing how much traders truly want price changes is a simple, effective means to do so.
Though, the bot may have some drawbacks to it which puts the market in jeopardy, for example, the following are concerns of utilising bots commonly in trades and what the consequences may be:
- Flash Crashes: Bots have been implicated in (or have been responsible for) "flash crashes," where the market suddenly drops by a significant amount due to a series of automated trades. This can happen when an algorithm triggers a chain reaction that causes market instability. The sheer amount of securities being bought and sold at high rates creates very unpredictable and unstable up-and-down patterns rather than a consistent increase in price and momentum, this may also cause panic and many may feel obligated to sell as it reaches a high in fear of it going down and collapsing. The sheer amount being sold may cause a flash crash.
- Market Manipulation: Bots can be programmed to manipulate the market by executing large numbers of small trades to influence stock prices artificially. Regulatory bodies like the SEC have implemented measures to mitigate or reduce the chance of this risk, but it remains a concern.
- Unaware of Ongoing World Events: Bots are for the most part unable to see ongoing world or political events and may be confused by or make a multitude of errors, which if a large amount of people are using bots (a likely possible in the future), would cause unexpected fluctuations and lows within the stock.
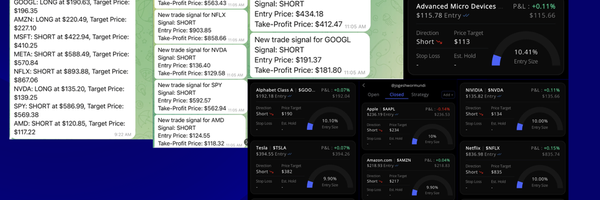
How Does The Trading Bot Work?
This trading bot will analyse stocks and send buy/sell signals to your device. It will use many indicators like SMA (Simple Moving Average), RSI (Relative Strength Index) and Vol (Volume) . It will take real-time stock prices and charts using financial APIs to measure the Simple Moving Average, Relative Strength Index and Volume over multiple time-frames and periods. The Relative Strength Index determines whether the stock is overbought or oversold (an RSI less than 70 is oversold and an RSI more than 30 is overbought and not oversold) and uses this to craft a decision. It will also use a Simple Moving Average over different periods to see the overall direction of the stock, the last thing the bot will use is Volume which will tell you how many people are trading at one time, if it is a higher volume it can mean bigger price movements or if its lower volume it may mean that there will be lower chances of huge price movements (Higher Volume can cause unpredictable price’s). After combining all these indicator’s the bot will decide whether to open a Long or Short position. The bot will also use these indicators to find the potential take-profit price that you can add to your investment. The following research also influenced parts of our study and the configuration/creation of both our and other bots:
- Research by Zhang et al. (2020), who suggests that algorithmic trading can increase market volatility during periods of high uncertainty, but in stable market conditions, bots outperform human traders in terms of profitability.
- A study by Kearns et al. (2018), who found that machine learning-based trading bots were able to generate more consistent profits compared to rule-based systems and human traders during periods of market growth, but they performed poorly during major market crashes.
- Additionally, other studies have also explored hybrid approaches, where human traders and bots work together, with humans providing strategic oversight while bots handle the execution of trades. This method allows traders to capitalize on the speed and consistency of bots while using their judgment to refine trading strategies.
Human Trading
Human traders rely on their own cognitive abilities and utilise things such as their own intuition and experience to make decisions when trading. They may use fundamental analysis (evaluating a company’s financial health) or technical analysis (examining market trends, charts, and indicators) to guide their trades. Unlike bots, human traders are subject to emotional influences such as fear, greed, overconfidence, FoMO, and more which can impact their decision-making process. They are also often slower in executing trades compared to algorithms. However, some consider manual trading to be better due to the fact that humans can interpret complex information and adjust strategies based on news events, market sentiment and more. Hence, humans have an augmented ability to adapt to volatile and fluctuating markets.
Comparing The Efficiency of The Human and Bot
Efficiency in the context of trading refers to how well the trader (whether human or bot) can generate profits while minimising risks and operational costs. For trading bots, efficiency is a large skill and asset due to their ability to process data swiftly, execute trades, and react to market conditions faster than a human could. They are particularly efficient in high-frequency trading (HFT), where the goal is to capitalize on tiny price movements in a very short time frame. Bots can handle thousands of trades per second, a feat impossible for any human.
Human traders, however, might excel in certain situations where adaptability, flexibility, and knowledge of outside or real world (possibly political) events are required. For instance, in highly volatile markets or during major news events, a human trader may be able to make sense of complex situations that are not easily quantifiable in algorithmic terms. Donald J Trump for example, promoted the idea of cryptocurrency and bitcoin quite a bit, due to it not being able to be inflated and it being a viable option to pay off large debt more easily. Due to his endorsements, bitcoin’s price skyrocketed due to the sheer amount being bought by people after his victory in the 2024 elections, as many are under the assumption that bitcoin will play a more vital role in the economy if Trump were to utilise it more. However, one issue as stated before is humans are also prone to making impulsive decisions and may struggle with maintaining discipline during periods of loss, they may sell when it starts to dip a considerable amount and miss out on a vital breaking point for the stock when it goes back up, or keep the stock despite it rapidly decreasing in value or consolidating due to the fear of missing out on that very breaking point. Bots are programmed to stick strictly to their strategy without emotional interference.
There are a multitude of metrics used to typically compare two traders, though some are:
- Profitability: How much profit is generated by each trader (bot or human) over a given period.
- Consistency: The ability to generate consistent profits without significant downturns and extremely differing results rather than constantly arising profits. The human may be more consistent due to spending more time and having higher overall conscious and cognitive abilities and due to the fact that humans do less trades.
- Speed: Bots can process market data and execute trades within milliseconds, whereas humans are limited by their cognitive processing speed. This speed advantage makes bots more effective in high-frequency trading and fast-moving markets.
- Emotion and Bias: Trading bots are not affected by emotions, which can often lead to poor decision-making in humans. Humans may fall prey to cognitive biases, such as loss aversion or confirmation bias, which can negatively affect trading performance.
- Adaptability: Human traders excel at interpreting information, such as news events or market sentiment. Bots, on the other hand, rely on quantitative data and can struggle when market conditions deviate from historical patterns.
- Risk Management: Bots can execute risk management strategies such as stop-loss orders and diversification automatically and consistently, without the emotional hesitation that may occur with human traders.
- Market Context: In certain market conditions (e.g., highly volatile or unpredictable events like earnings reports or political instability), human traders may outperform bots by using their judgment and intuition to assess risks and opportunities that the algorithm may not recognise.
The Nature of Stock Trading
Stock trading is the process of buying and selling stocks or securities in financial markets to make a profit. Traditionally, this was done by human traders in person on exchange floors or through phone calls with brokers. Over time, technological advances, such as the rise of electronic trading, have led to the creation of sophisticated algorithms that enable automated trading. Automated trading has the potential to dramatically increase the speed, accuracy, and volume of trades, leading to higher profits for those who can optimise these systems.
There are two main types of stock trading that are relevant to this experiment, which are:
- Day Trading: This involves buying and selling stocks within a single trading day to capitalize on short-term price fluctuations.
- Long-Term Investing: This involves buying stocks and holding them for an extended period, with an expectation that they will increase in value over time. This is a less time-sensitive form of trading compared to day trading.
The stock market is immensely important due to the sheer economic size and reliance countries, companies, people in general have on the market. Many studies have shown that stock portfolios have been a major force in things such as the growth of consumer spending. Furthermore, the rise of algorithmic and high-frequency trading itself has changed the landscape of global financial markets. Not only has the importance and value of stock, crypto, and similar volatile currencies rapidly arisen, but they allow companies to receive funds to innovate and invest into specific projects without receiving a brobdingnagian proportion of debt due to the shares being public.
Variables
CONTROLLED
- Initial Investment, Platform, and Duration - Both the trading bot and the human trading strategies will begin with the same investment and operate within the same timeframe (being when the stock market is open, from 7:30 AM - 2:00 PM). This ensures that the market conditions are the same for both strategies allowing more accuracy and reliability in the comparison. Both will be using Involio as the stock simulation.
- Stocks used - All 3 portfolio’s will be utilising the following 10 stocks: Tesla, S&P 500, Advanced Micro Devices (AMD), Microsoft, META, Alphabet Class A (Google), Amazon, Netflix, Apple, and NVIDIA.
MANIPULATED
- Algorithm Adjustments; How The Performance Will Be Evaluated: - The trading bot’s performance will be tested for each trade's quality, like the ROI. We will also test whether the bot can coordinate with multiple indicators combined to give a polished result that is easy for a user to understand, like whether to open a Long Position or a Short Position.
UNCONTROLLED
- Unexpected Market Events - Factors such as geopolitical events, economic announcements, or sudden regulatory changes may cause unpredictable price movements that cannot be controlled. The market will have consistently metamorphosing volatility and complexity when reading data.
- Market Liquidity - Variations in liquidity might influence asset pricing and execution speed, which may cause potential discrepancies in the results.
RESPONDING
- Total Returns - The percentage of profit or loss generated by the trading bot and human trading strategies at the end of the investment period.
- Trade Efficiency/Profitability - We will evaluate this by seeing the average ROI per trade made by each portfolio for every consecutive day.
Procedure
Code Link: https://docs.google.com/document/d/1mNlk1R3GXLXgbnu5dhWM9F2qMb_MRJ_gYLPjSixP8Zw/edit?tab=t.0
-Tracking software or a spreadsheet can help log values for both the human and bot at regular intervals.
-Record all trades the bot executes, including entry/exit prices and timestamps.
-Track cumulative transaction fees for the bot’s trades.
-Note any significant market events (e.g., news, economic announcements) that may affect results to prevent false or vastly different data as compared to other future experiments similar to ours.
-Ensure no manual interference with either the bot or the buy-and-hold portfolio during the testing period to prevent conflicting/inconsistent data from other experiments. (1): First we will create the trading bot, using a technical analysis plugin called Panda TA which will show the bot whether the stock is overbought or oversold based on the RSI chart. If the stock is oversold, then there is a chance of the stock going up, if the stock is overbought the stock has a chance of going down. (2): To code the robot, start by importing the libraries. For our project, we used the telegram library to send notifications to the device.
We used Panda for the indicators and chart data with yfinance for more chart data.

After defining the libraries add the telegram bot identification so the code knows to send information to your device.

Start by making a function called fetch_stock_data which will find the stock chart data of our 10 stocks used.

In the same function, we tell the bot to get the indicator data for SMA, RSI and Volume which will inform you of the decision to long or short. The second function is analyze_stock which will put the indicators mentioned into action on the chart to open a long or short position.

The next function send_telegram_message will prepare the bot to send the signal, this leads to the last function send_signals which will work upon the send_telegram_message to send the position fully with long or short with the stock value and take profit estimate to your device.

(3): Activate the bot. We will activate the bot, buy our stocks to hold, and start the one the human will trade on the simulation.
(4): We will have 3 different tests to evaluate the efficiency of the bot. One of us will use a basic buy-and-hold strategy for the entire time, serving as a control and median for the experiment. We will also have another and use real-time data, a multitude of strategies, and other things to try and maximise our profits. Finally, we will have the trading bot participate in the stock exchange simulation. All of these will start at the same time and on the same stock. (5): We will collect the data and see how efficient each entity was, we will look at the net profit, leverage used, and more to decide this.
Observations
Observations
|
December 29, 2024 Start of the experiment Day 1 |
The Control had begun and started with a fall in all stocks. This was not due to any economic news or geopolitical events. The bot shared a similar fate with all stocks being down except $TSLA. Human Trading also was in the negatives in ROI. The control did the worst out of these and human trading did the best. Average ROI of Control: -1.631% Average ROI of Trading Bot: -0.522% Average ROI of Human: -0.475% |
|
December 30, 2024 Day 2 |
Control had continued in the downward direction reaching new lows in this project. The Trading Bot had won all trades that day. With that, there is one human trade with $NVDA which had small profits. The Control did the worst and Human did the best., However, the trading bot had more successful trades.
Average ROI of Control: -2.423% Average ROI of Trading Bot: +0.184% Average ROI of Human: +0.20% |
|
December 31, 2024 Day 3 (Half-Day due to it being New Year’s Eve) |
The control has started rising slowly while still in the negative, possibly due to it being New Year’s Eve. For the trading bot, all trades were in the green except $GOOGL. There were no Human Trades that day due to there being no clear opportunity. The Control did the worst and Trading Bot did the best. Average ROI of Control: -1.631% Average ROI of Trading Bot:+ 0.065% Average ROI of Human Trade: N/A |
|
January 2, 2025 Day 4 |
Control remained mostly in the negative with the exception of $NVDA. $TSLA stock crashed reaching a -14.57% ROI on just one stock. The market is clearly trending down. The Trading Bot had another successful day with 8 out of 10 trades being in the positive. Human Trading has had 2 successful trades with a relatively low ROI. The trading bot did more trades, however. Average ROI of Control: -3.419% Average ROI of Trading Bot: +0.081% Average Human: +0.125% |
|
January 3, 2025 Day 5 |
For Control most of the stock’s were in the negative except $AMD and $NVDA. $TSLA had -9.67% ROI which was better than the -14.67% ROI that happened on Day 4. For the Trading Bot it still won about 8 out of 10 of the trades with constant ROI increase. $NVDA and $AMD couldn't not be correctly guessed by the bot today. For Human there were no clear signal to trade. The Control did the worst and Trading Bot did the best. Average ROI of Control: -3.123% Average ROI of Trading Bot: +0.088% Average ROI of Human: N/A |
|
January 6, 2025 Day 6 |
For Day 6, the control finally started slowly going up. Now 50 percent of the Control is in the positives. $GOOGL and $NVDA has the best net profits of all stocks that have been in Control. For the Trading Bot it had 3 trade’s that ended up in the negative’s like $AAPL, $NFLX, and $NVDA. For the Human Trading the $SPX was breakeven with no movement, $NVDA was in the negative’s and $AAPL was slightly profitable but the ROI was still in the negative’s. TheTrading Bot did the best and Control did the worst. Average ROI of Control: -1.466% Average ROI of Trading Bot: +0.075% Average ROI of Human: -0.08% |
|
January 7, 2025 Day 7 |
The control was still in the negatives in the ROI and only 3 out of 10 trades are in the positive’s at all. The Trading Bot is constantly doing good with 8 out of 10 trades in the positive except $GOOGL and $META. Human Trading had 4 opportunities that all were in the positive’s in the ROI for that day. The Trading Bot did the best and Control did the worst. Average ROI of Control: -2.788% Average ROI of Trading Bot: +0.079% Average ROI of Human: +0.071% |
|
January 8, 2025 Day 8 |
The Control was mostly in the negative except for 2 trades that were barely giving any ROI. The Trading Bot again had a 70 percent win rate for the day. This proves that the bot can give good results under various market conditions due to constant good results during the 8 days. Human Trading only had 1 good trade as the market had gone in favor of the strategies. The Trading Bot did the best and Control did the worst. Average ROI of Control: -3.392% Average ROI of Trading Bot: +0.051% Average ROI of Human: +0.045% |
|
January 10, 2025 Day 9 |
Today was the last day of the project. The Control is in the negatives except 1. The Market was straight neither going up nor down. There was a slight ROI change for the trading bot but still in positive. We tried some human trades but it was still low ROI. The control has the least ROI, while the trading bot has the highest. Total Control ROI: -5.229% Total Trading Bot ROI: +0.061% Total Human Trading ROI: +0.016% |
Analysis


We can infer from this chart that due to the control being constantly in the negatives, that the market itself is overall heading downwards. Meaning that the Human and Trading Bot portfolio may likely do much better in other market circumstances otherwise, as the goal is partly to mitigate damage done to the profit overall rather than entirely focus on making a profit on its own. Though the values themselves seem small, there is an immense difference between the given values. This is due to the amount of trades being done, the trading bot may seem to be making a very small profit, but this is rather the average profit per trade, when multiplied by the 90 trades it had done in the minute time of simply 9 days, it grows enormously. The bot being able to make a profit on average alone is very important, as the amount made grows to a tremendous size after some time due to the amount of trades being done by the bot. Day 1 was interestingly very unpredictable due to the high volume of the stocks, which seemed to also have jeopardised the human and trading bot’s overall average ROI and was uncommon as compared to the other days were mainly profits were made rather than losses.
Conclusion
In this experiment, we created a trading bot and compared it to a simple buy-and-hold strategy along with Human Trading. This was in hopes of answering our testable question: How does the profitability and accuracy of a stock trading bot compare to that of a human trader in different market conditions (e.g., volatile, stable, or news-driven markets) over 9 days? We can infer that a Trading Bot is considerably more profitable than both a basic buy-and-hold strategy and also the typical human trader. Additionally, it provides a much more stable profit compared to the buy-and-hold strategy and is faster and less time-consuming than human trading. The Trading Bot not only had the only positive overall ROI, but also made a hefty magnitude of trades per day, allowing for that small amount to consistently/rapidly increase from both the number of trades but also compound interest. The Trading Bot had an overall average ROI of +0.0092%, while the human trading had an average loss of -0.00111111111%. Therefore, we can comfortably say that the trading bot is more efficient than all other methods used in this experiment due to its accuracy, ability to swiftly read complex data.
Application
Investing is very important to secure your financial future. People need to invest for a multitude of reasons, such as retirement, buying a home, education, etc. There are multiple ways to invest for different types of reasons. You may get a RESP if you need money for education, or get a RRSP if you want to slowly build your retirement. Also many people want to grow their money further from just their jobs, and investing in stock markets or precious metals like gold, silver or platinum can be a great way to build wealth especially if you start early. People also invest in real estate which can make them millionaires if housing prices increase and they wait long enough before selling their houses. Multiple types of trading methods like Day Trading (Buying or selling on the same day) or Swing Trading (Holding for more than a day) can also exponentially grow your wealth overtime which is very important. To have a trading bot which can not only rapidly grow your finance/money but also work as a playground and catalyst to gain knowledge and experience in such an important and thriving industry is of the utmost importance to utilise. It is evident that with the introduction, endorsement, and use of stock and cryptocurrency by world leaders, among others, makes it evident that it may very likely be the future and one of the key components of our economy. We are still early, and to act on this opportunity soon is both relevant and important.
Sources Of Error
We came across a multitude of unexpected/unprecedented errors within our experiment. Although it could not be easily helped, one main error was the fact that the bot could not utilise too many strategies easily without us coding all of them, meaning at certain times it may get very confused, as it did on Day 1 when there was high volume within the stocks. Additionally, due to the stock market being closed on weekends and holidays, along with it only being open from 7:30 AM to 2:00 PM meant that we could only conduct the experiment during the break, and finishing the bot early could have allowed us to have more time/days to conduct the experiment and get us even more accurate/reliable results. Another variable was how we measured the accuracy, and having more specific data and ways on how to conduct it aside from accuracy could have given a clearer insight on how much better one portfolio was than the other (ex. How much profit each trade actually made on average). Finally, the human trading skill/profit may vary from person to person, and though the bot was partly intended to aid beginners learn more, due to the index of skill varying, the data may slightly alter/vary which makes the result not entirely objective.
Citations
Banz, R. W. (1981, March). The relationship between return and market value of common stock. ScienceDirect. Retrieved December 18, 2024, from https://www.sciencedirect.com/science/article/abs/pii/0304405X81900180#preview-section-cited-by
Chong, T. T.-L., Ng, W.-K., & Liew, V. K.-S. (2014). Revisiting the Performance of MACD and RSI Oscillators. Journal of Risk and Financial Management, 7(1), 1-12. Retrieved January 6, 2025 from https://doi.org/10.3390/jrfm7010001
Clayton, J., & Mckinnon, G. (2003, July). The Relative Importance of Stock, Bond and Real Estate Factors in Explaining REIT Returns. LinkSpringer. Retrieved from, January 6, 2025 from https://link.springer.com/article/10.1023/A:1023607412927
Guo, H., Lin, Q., & Pai, Y.-J. (2018, March 26). A Tale of Fear and Euphoria in the Stock Market. SSRN. Retrieved December 21, 2024, from https://papers.ssrn.com/sol3/papers.cfm?abstract_id=3149682
Kerns, M., Neel, S., Roth, A., & Wu, Z. S. (2019, January 29). An Empirical Study of Rich Subgroup Fairness for Machine Learning. Association for Computing Machinery. https://dl.acm.org/doi/abs/10.1145/3287560.3287592
Steindel, C., & Ludvigson, S. V. (1999, July ). How Important is the Stock Market Effect on Consumption? SSRN. Retrieved January 6, 2025, from https://papers.ssrn.com/sol3/papers.cfm?abstract_id=1004353
(2024, June 26). What Are Crypto Trading Bots? A Beginner’s Guide. KuCoin. Retrieved December 18, 2024, from https://www.kucoin.com/learn/trading/what-are-crypto-trading-bots
Vijh, A. M. (n.d.). S&P 500 Trading Strategies and Stock Betas. Oxford Academic. Retrieved December 21, 2024, from https://academic.oup.com/rfs/article-abstract/7/1/215/1568661?login=false6
Zhang, L., Wu, T., Lahrichi, S., Salas-Flores, C. G., & Li, J. (2022). A Data Science Pipeline for Algorithmic Trading: A Comparative Study of Applications for Finance and Cryptoeconomics. In Proceedings - 2022 IEEE International Conference on Blockchain, Blockchain 2022 (pp. 298–303). Retrieved December 13, 2024, from https://doi.org/10.1109/Blockchain55522.2022.00048
Acknowledgement
Special thanks to our moms and dads for their unwavering support and direction and for motivating us in ways they'll never know. Special thanks to Mrs. Aulakh, the coordinator, for her direction and endeavors. Much appreciated.