Clean Water for All: Designing Sustainable, Low-Cost Water Filters using Common Household Waste
Grade 8
Presentation
Problem
The World Water crisis is a very present and serious issue. Even now, 1 in 10 people globally still do not have access to safe drinking water, giving them a greater risk of contracting water-borne diseases and robbing them of valuable time and physical effort in the process of procuring clean water. Over a million people die each year from drinking water contaminated with bacteria, chemicals, and heavy metals. In Canada, despite being the country the the world's third-highest freshwater stores, many First Nations communities also cannot access potable water, being disproportionately affected by water pollution and treatment issues. This causes significant financial strain, as drinking water advisories can last for multiple years. In this project, the aim was to create an effective water filtration system out of everyday items typically found as waste, such as plastic bottles and bags. The potential cost of the system, sustainable items used, and efficiency compared to a commercial water filter in filtering common water pollutants were analyzed and compared to the results of a commercial filter. Overall, this filter could be constructed on demand out of these common materials, with little to no cost, and be a more accessible way to quickly and efficiently clean polluted water.
Method
The first step of the project was to design the blueprint for the filter, as well as coming up with what could be used to simulate common pollutants. The concept was designed according to the principle used in many DIY water filters that the coarsest material should be filtered at the top, with the finer aspects taking place at the bottom. For example:
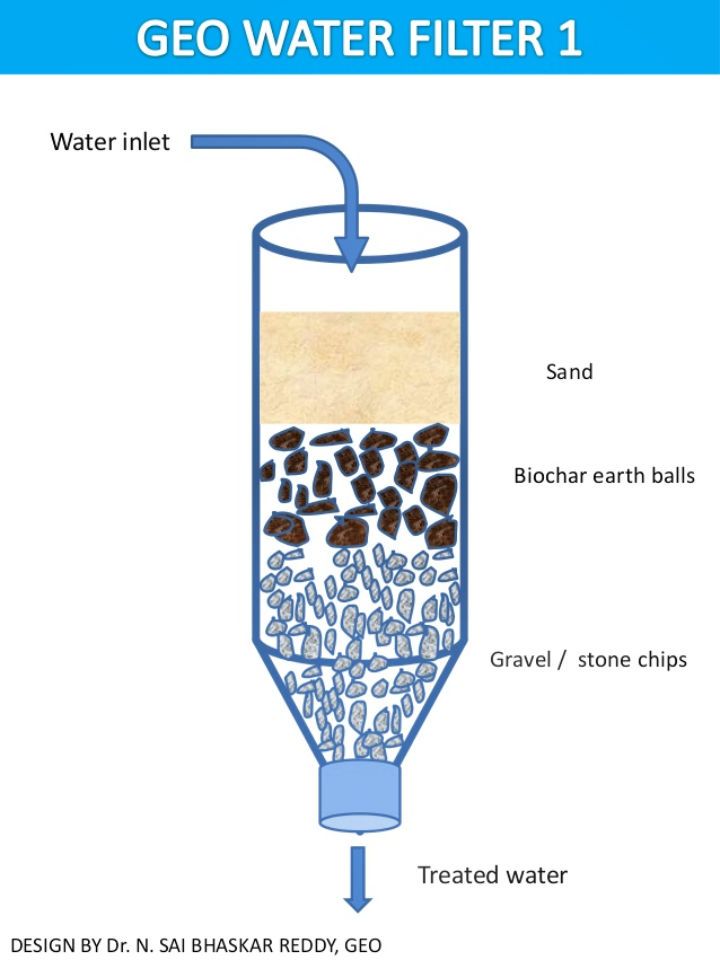
Below is the final design I settled on:
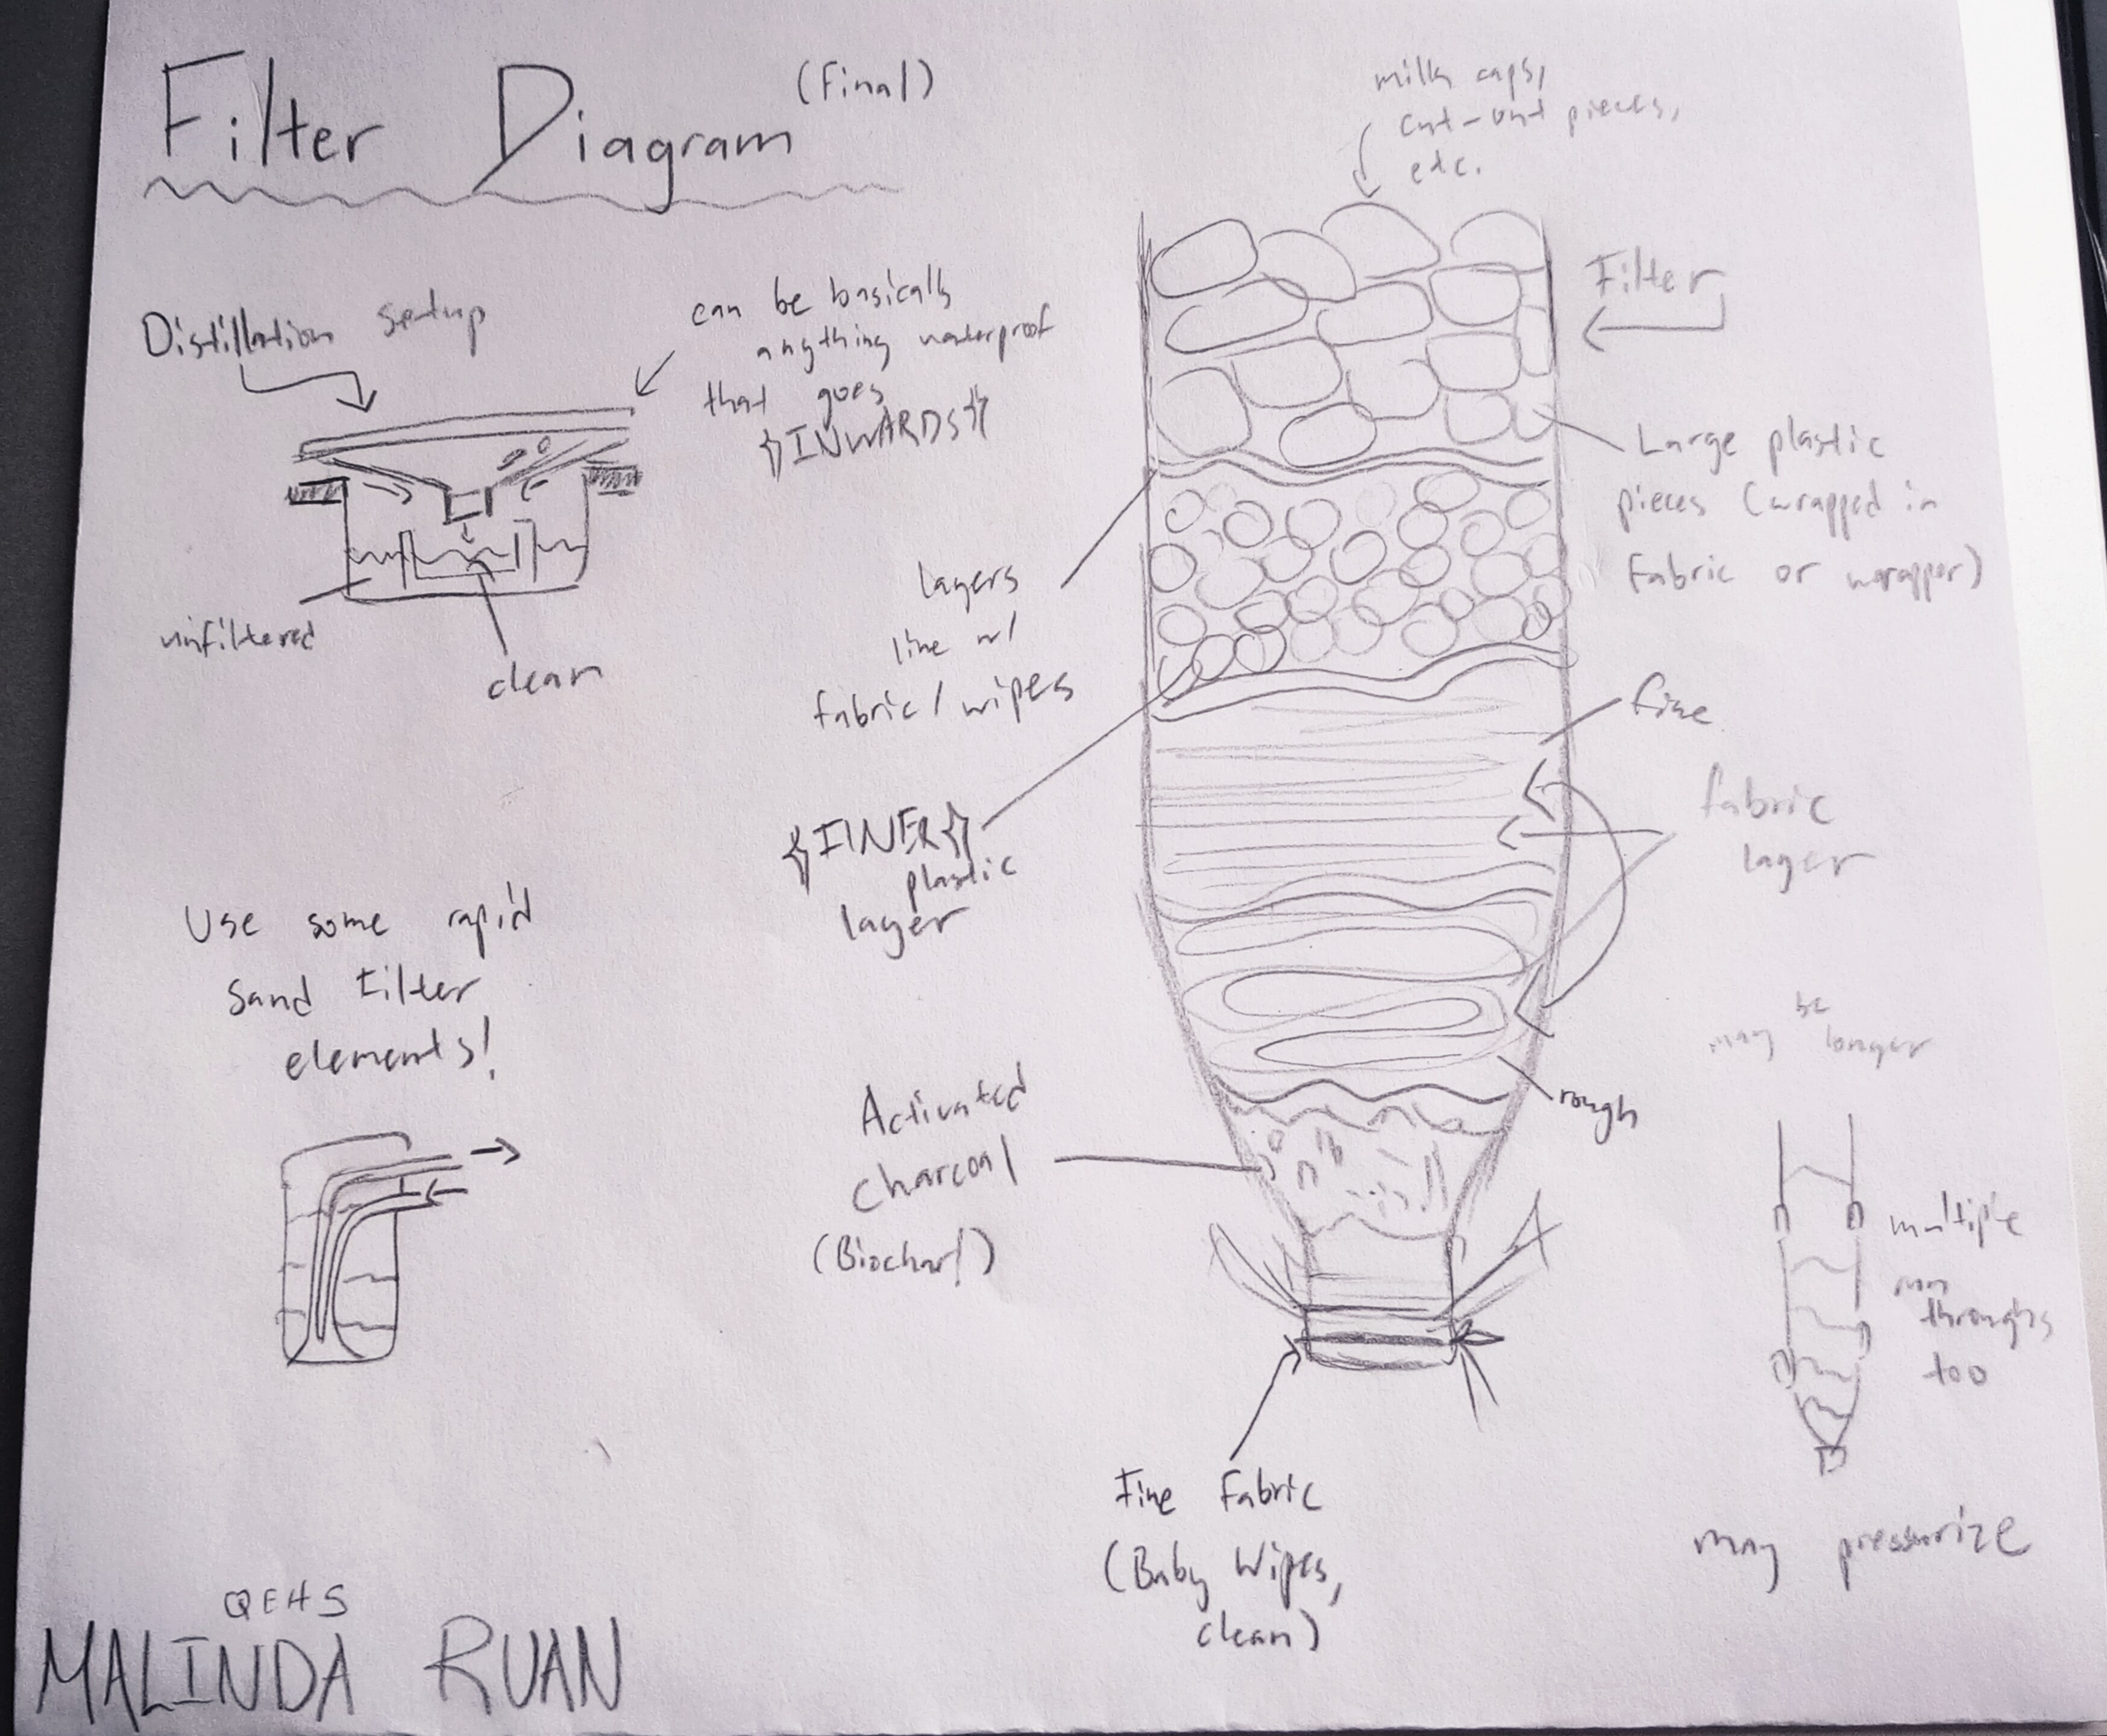
The materials were chosen and gathered based on common waste items (in landfills). Substitutes for potential real-life situations were researched for materials that weren't in this category (just the activated charcoal filter).
Layer Content (Coarse to Fine)
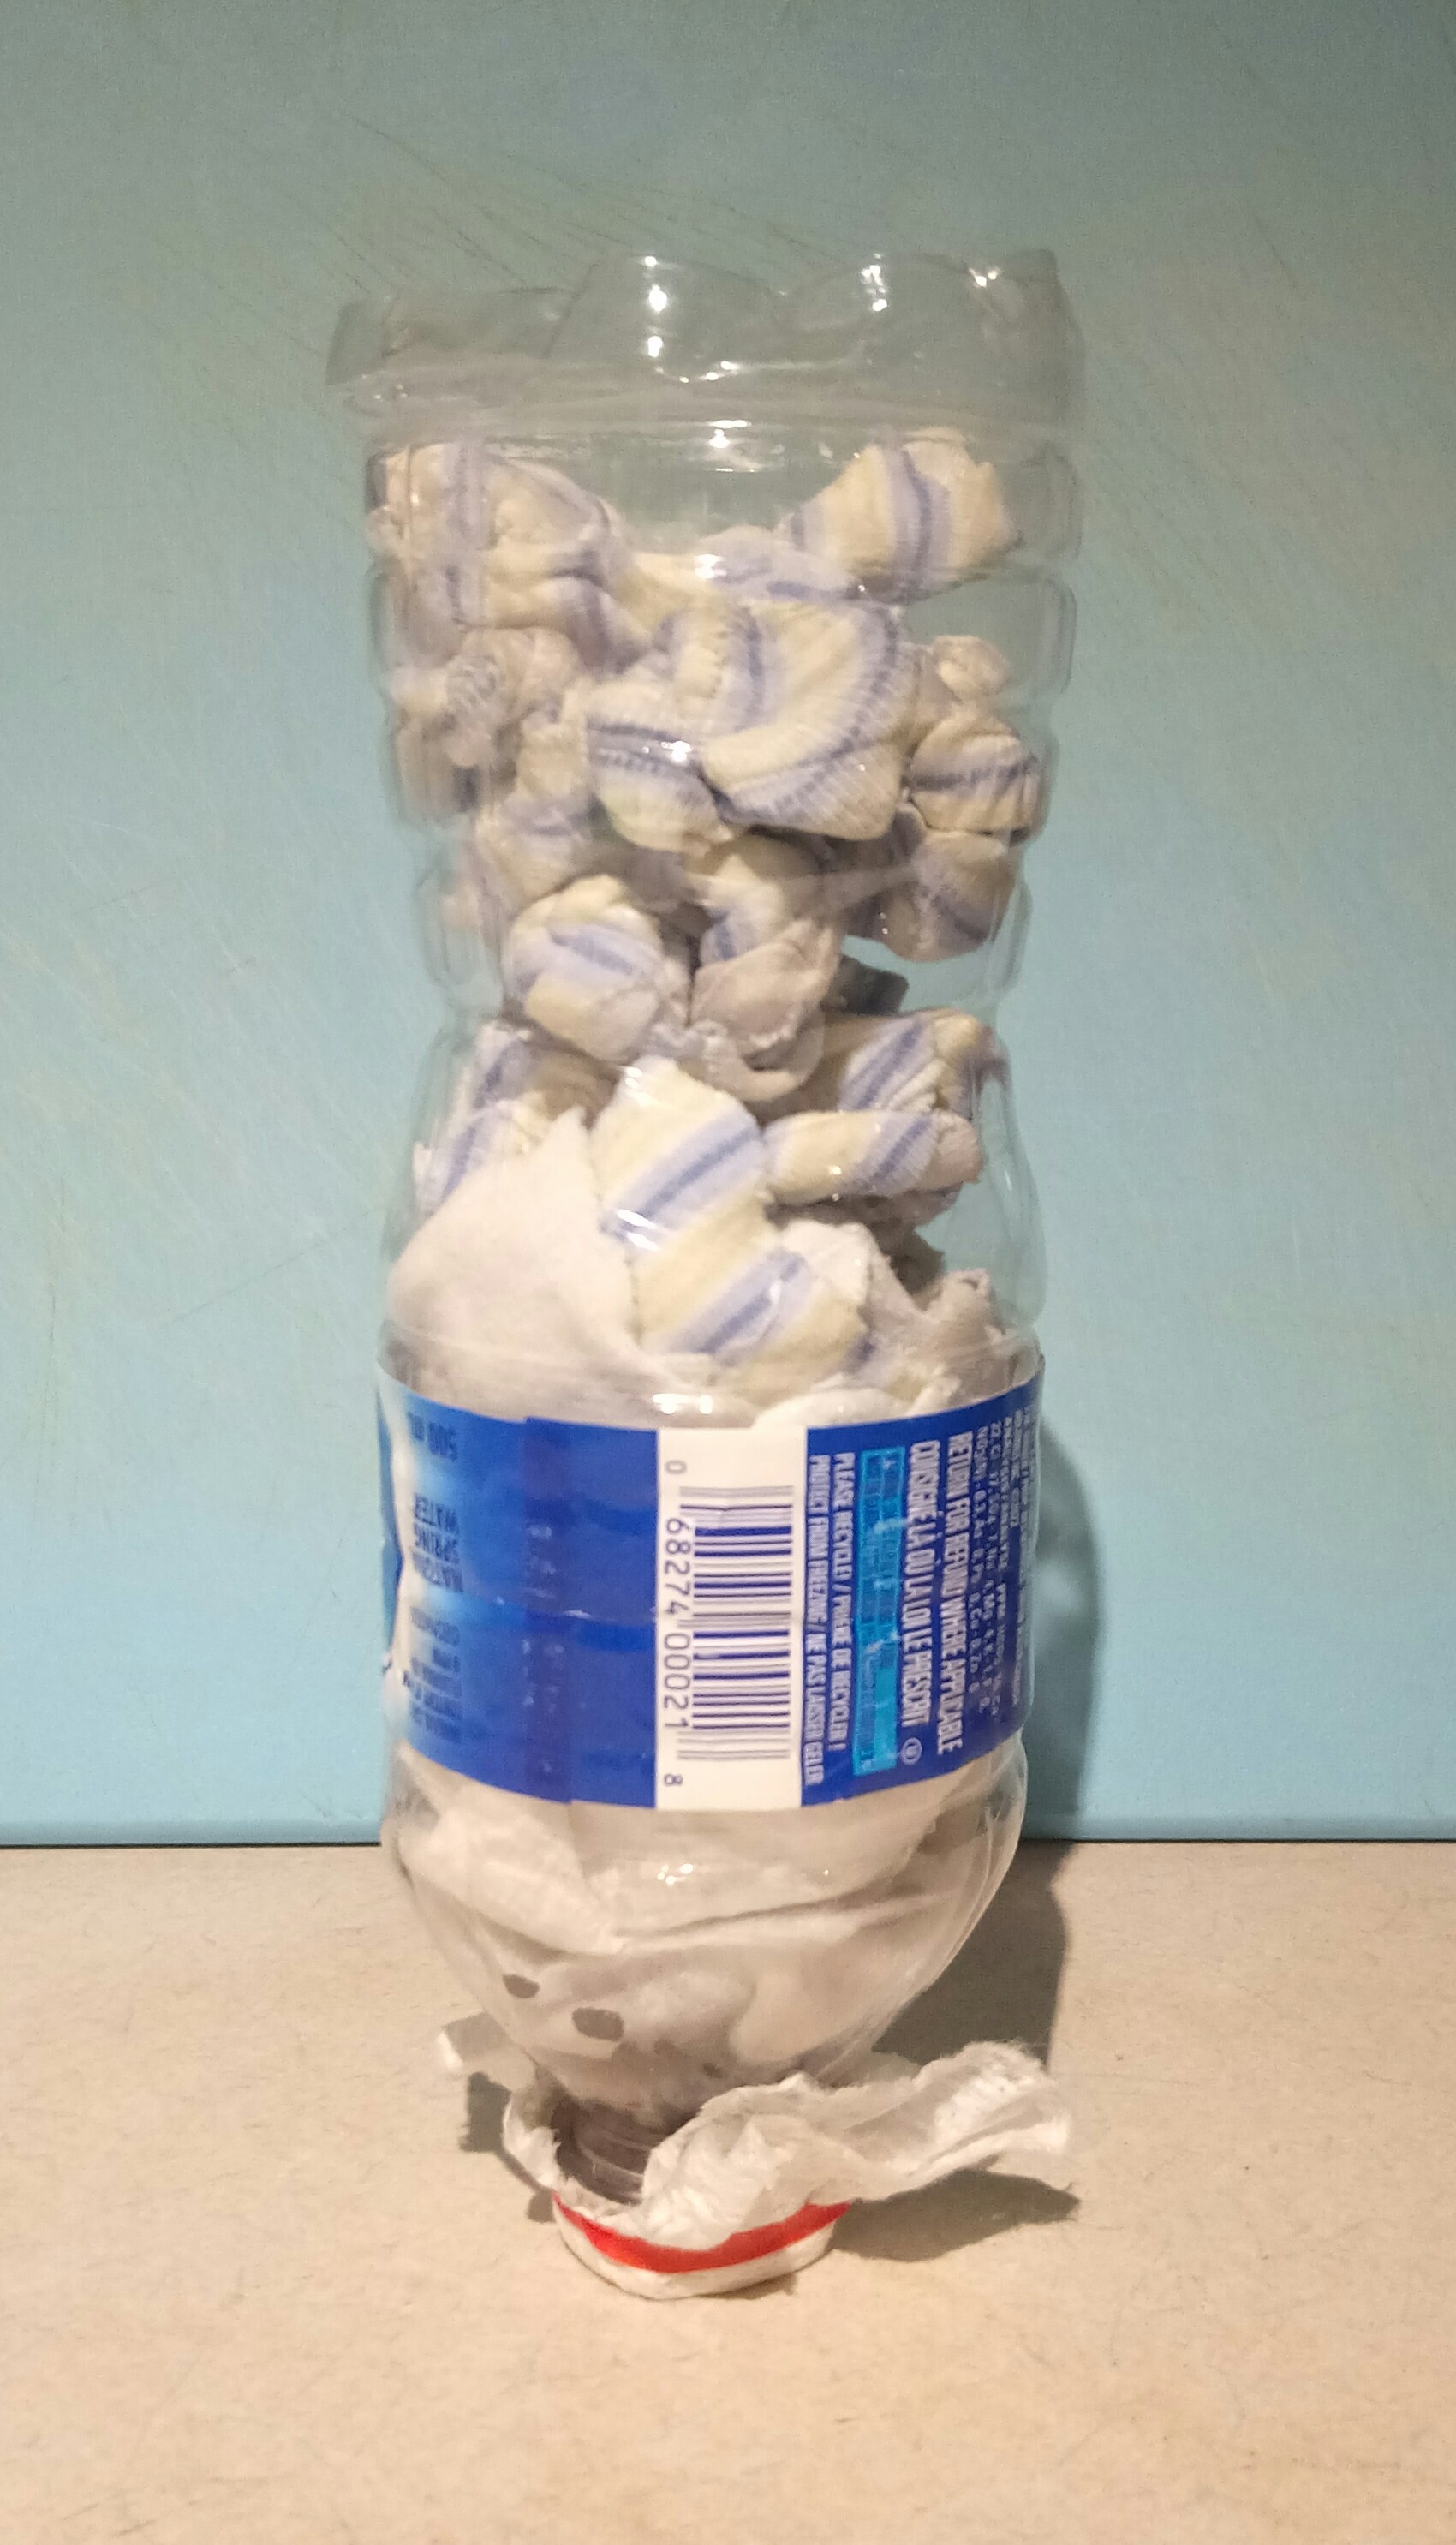
Outside: A plastic water bottle
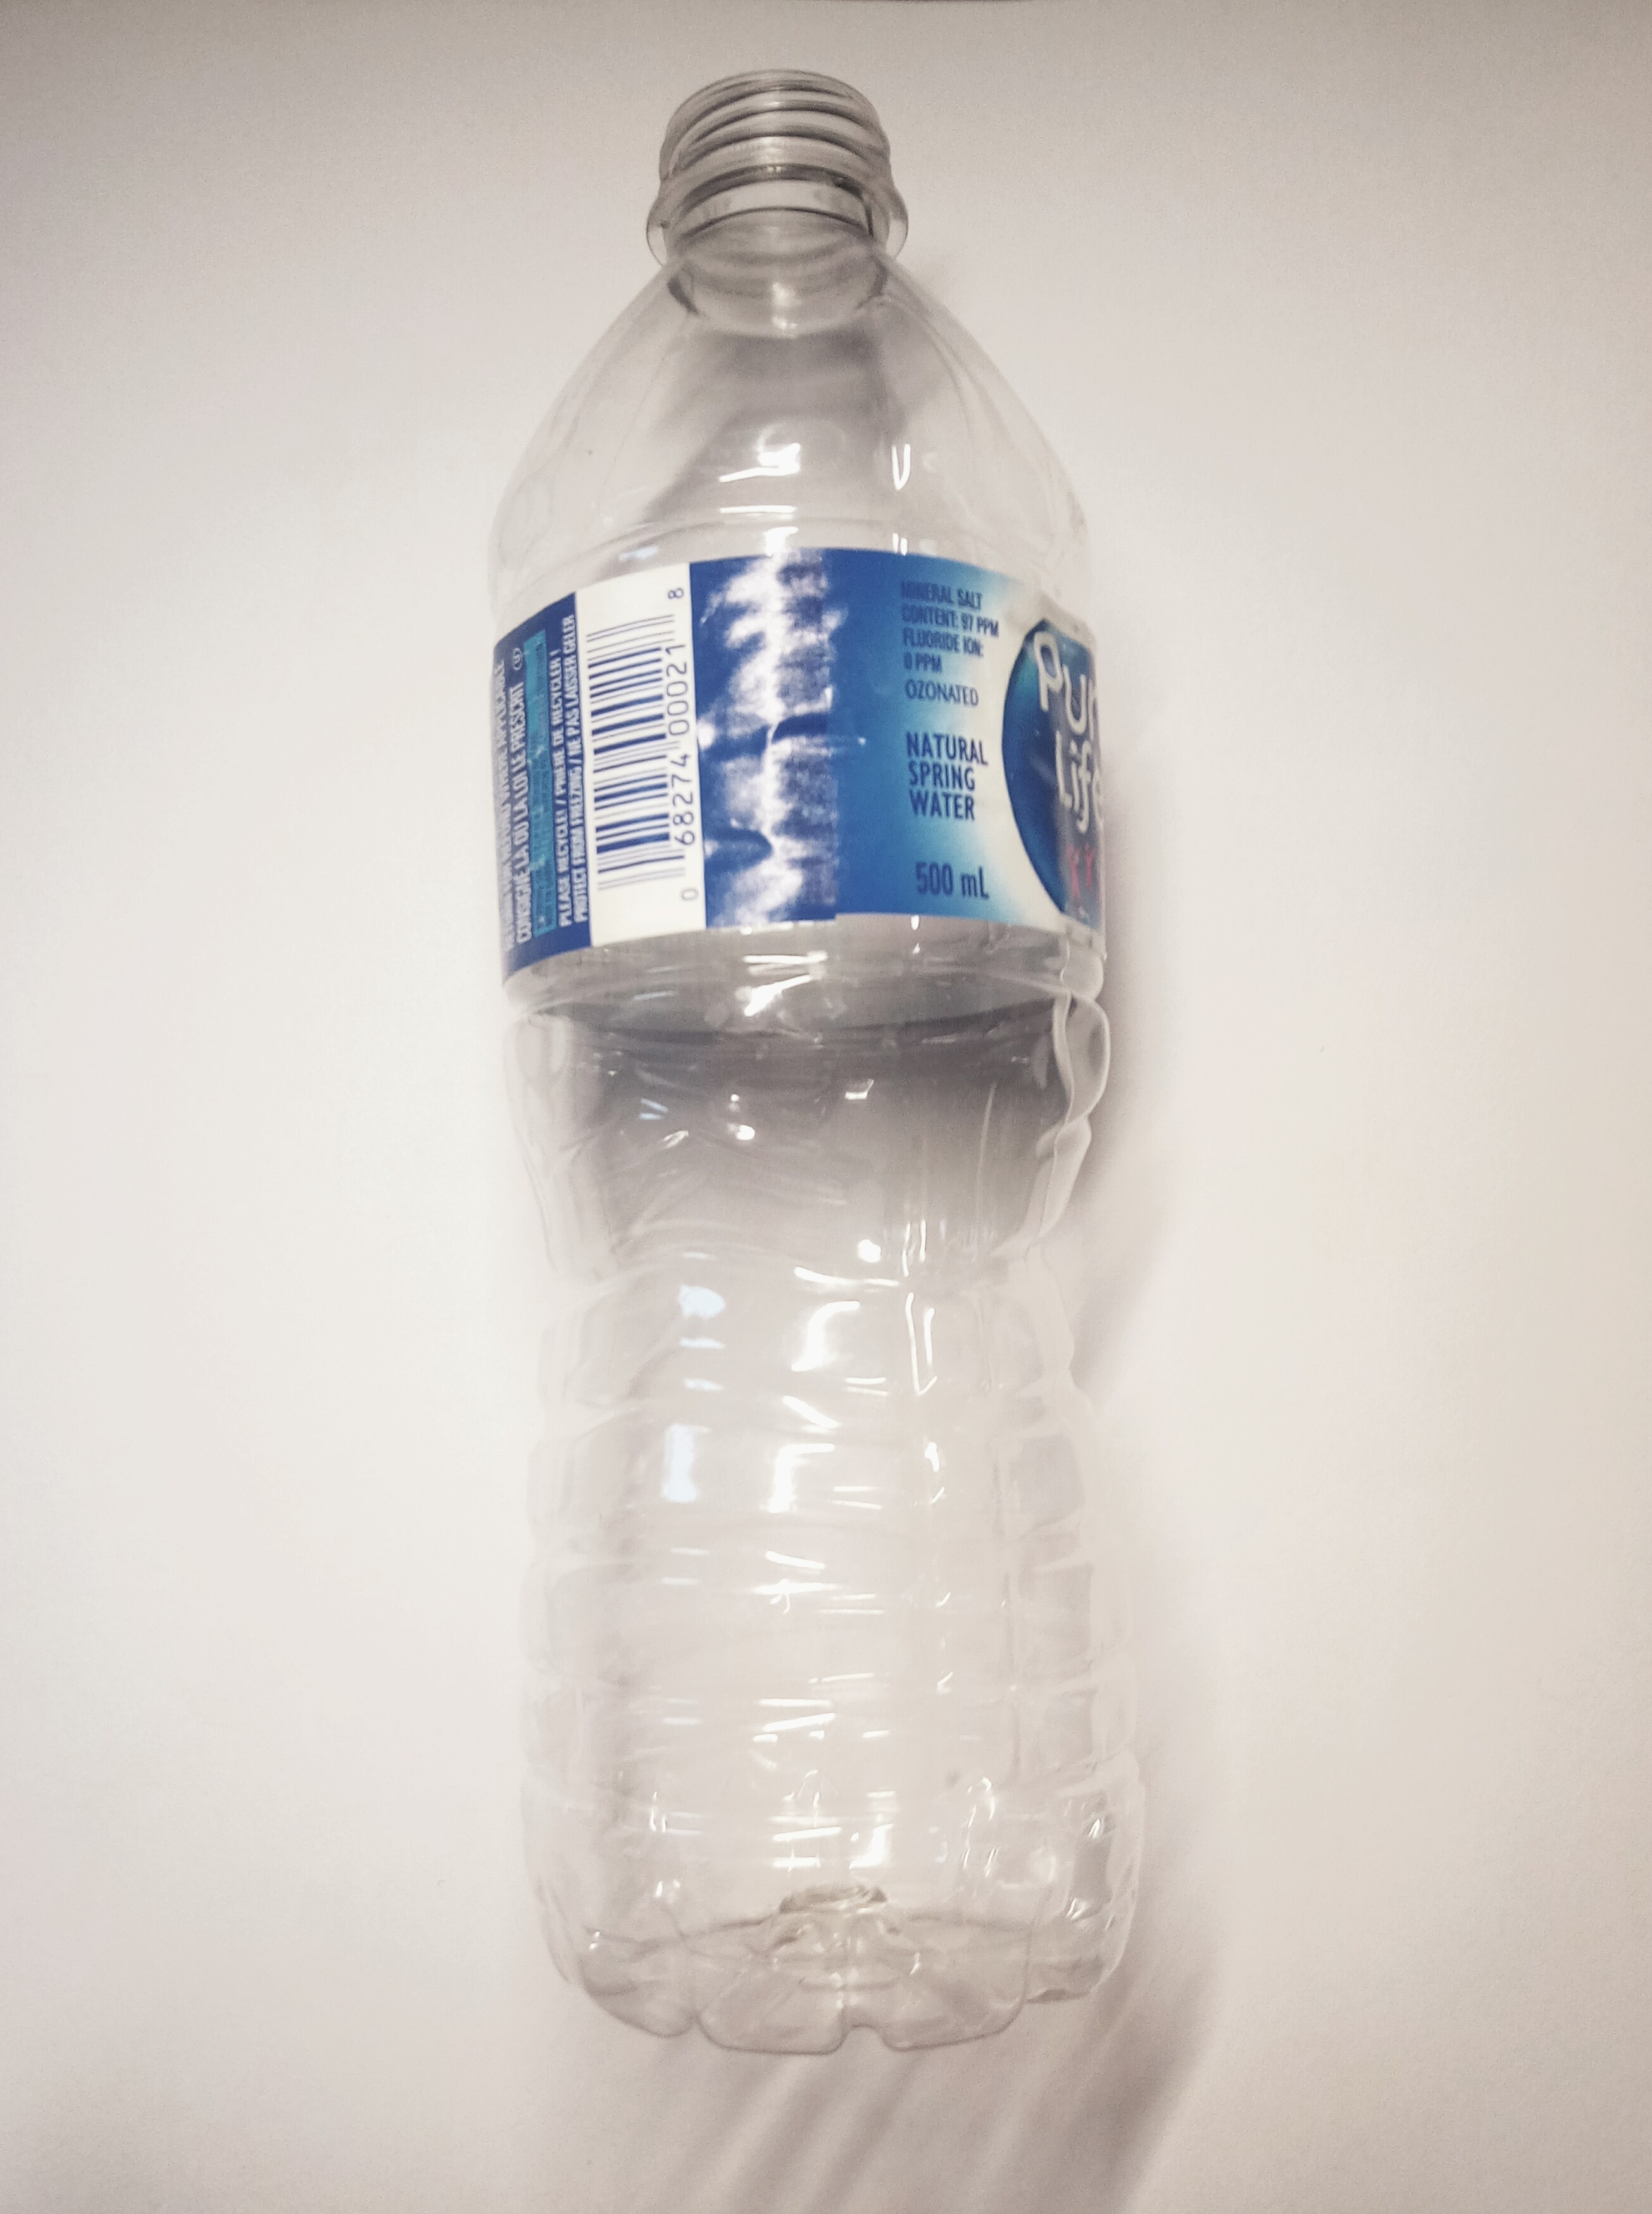
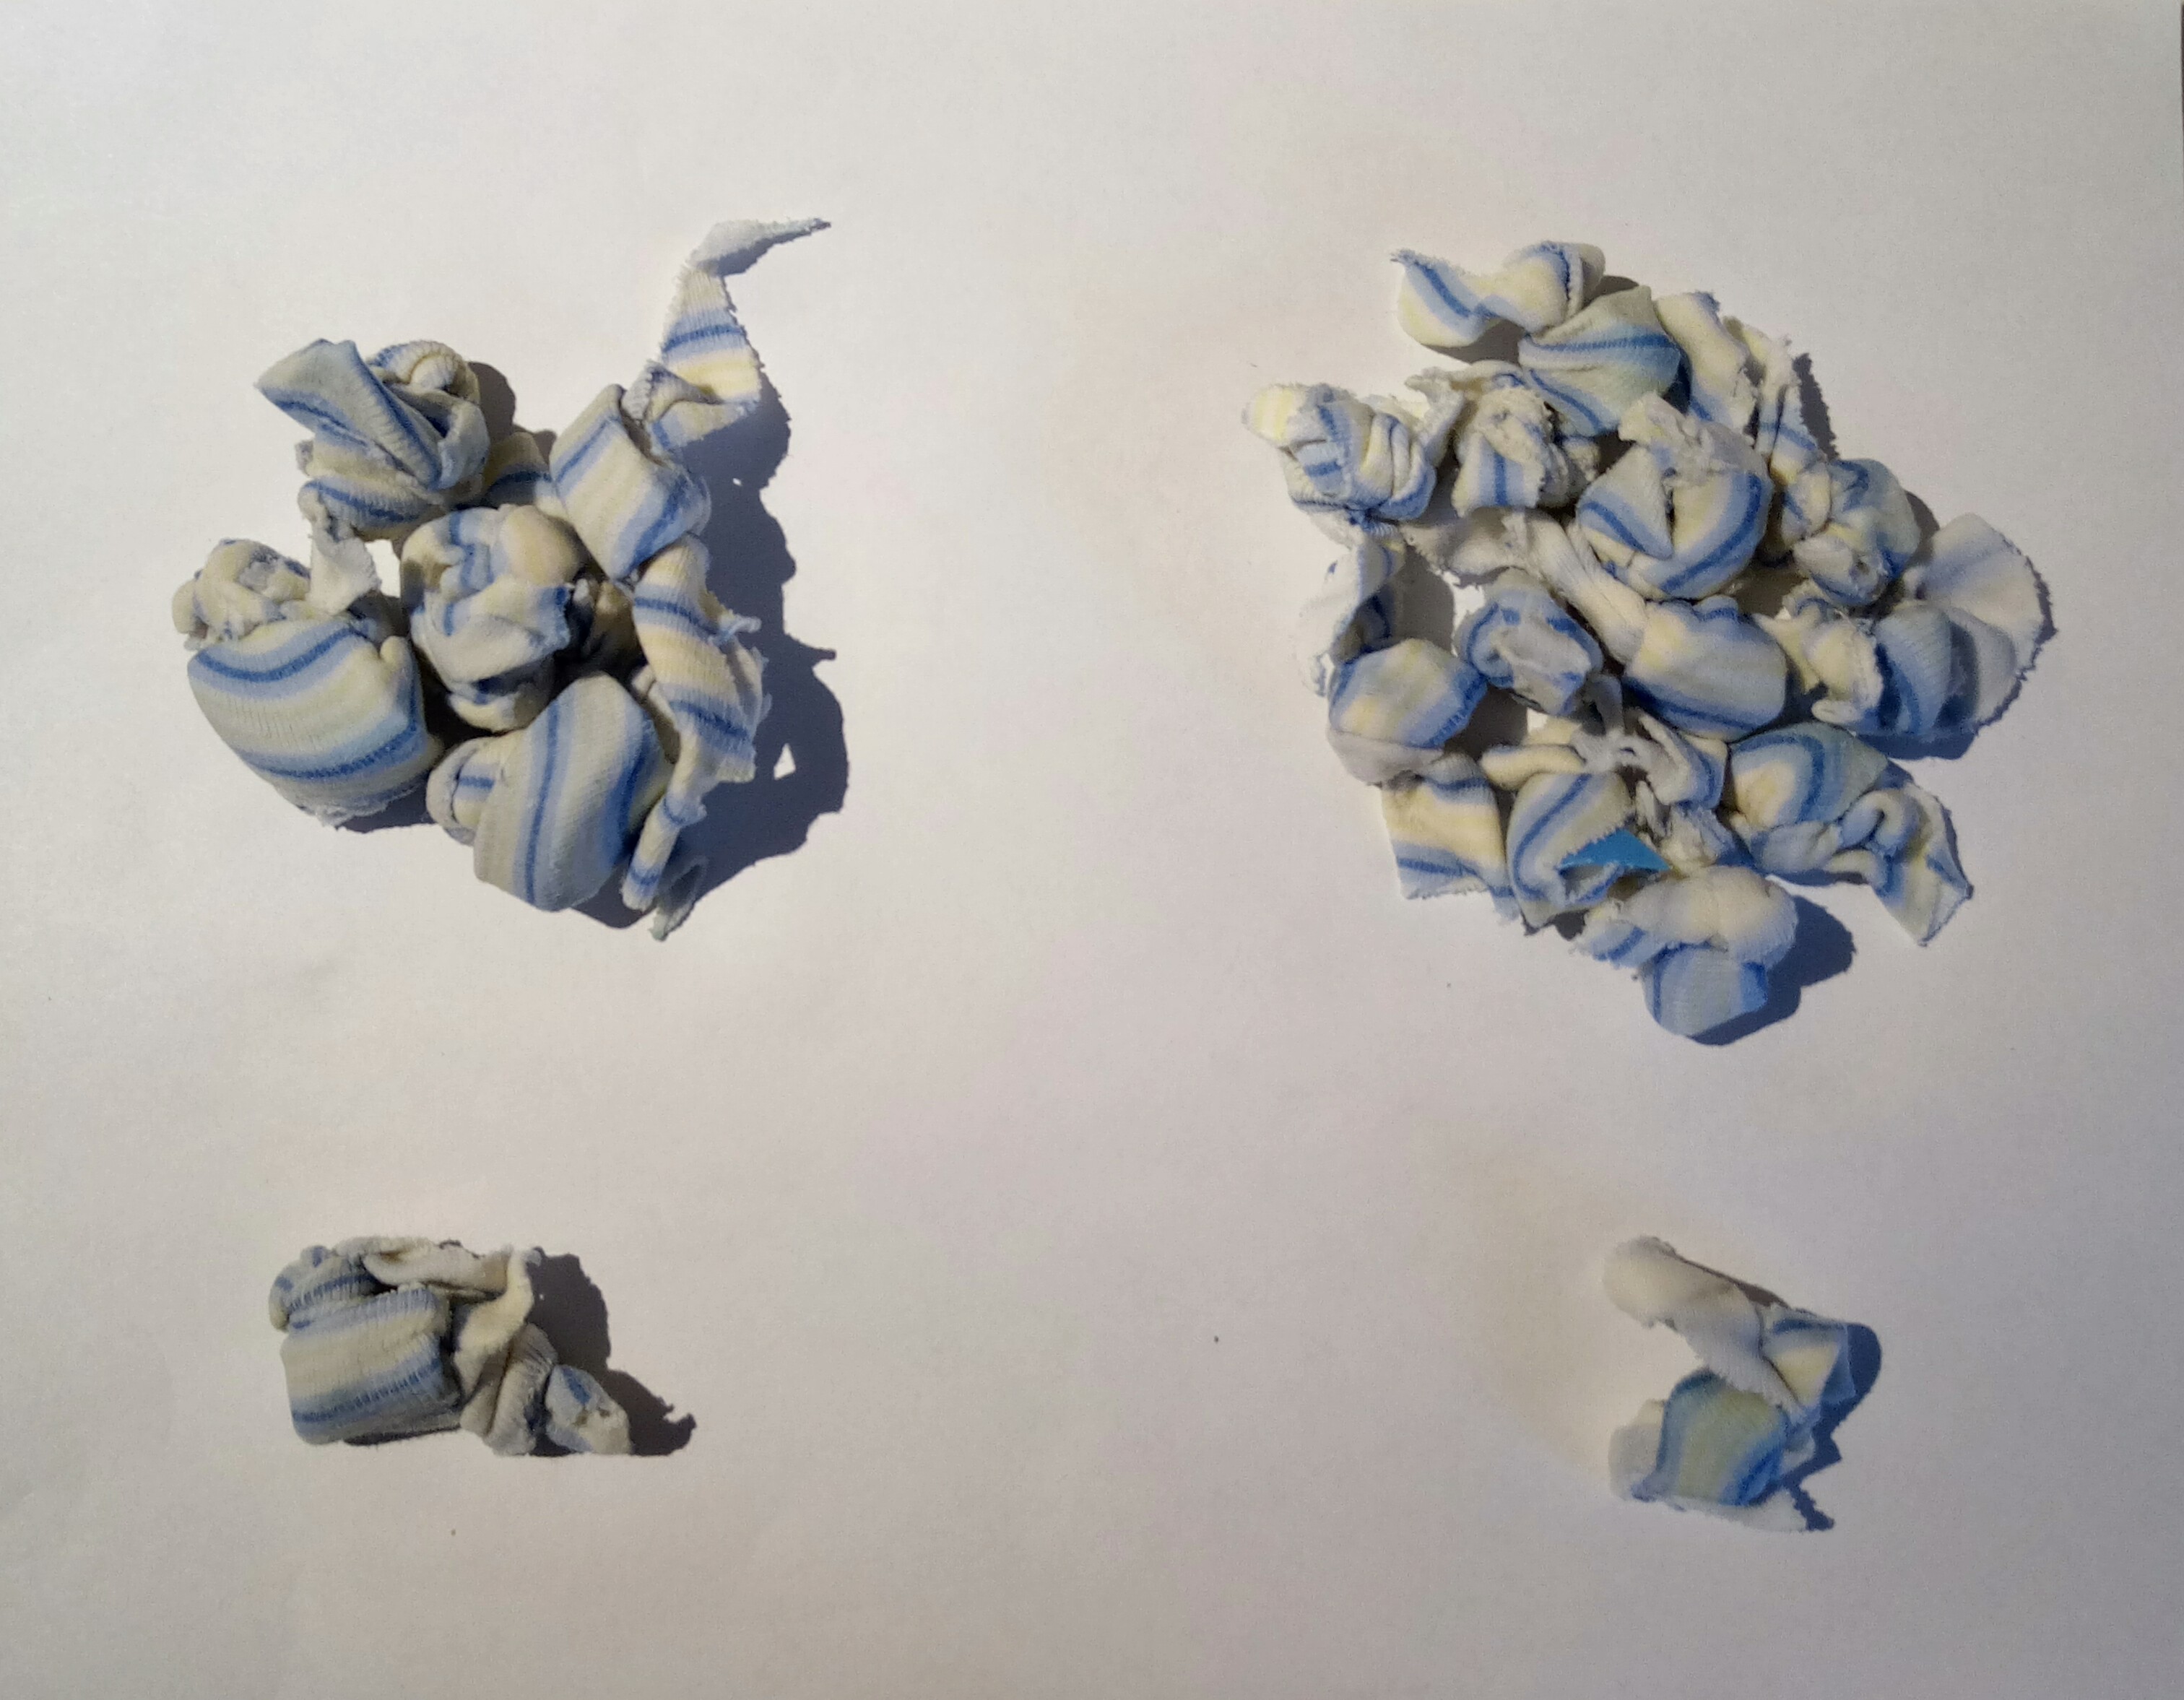
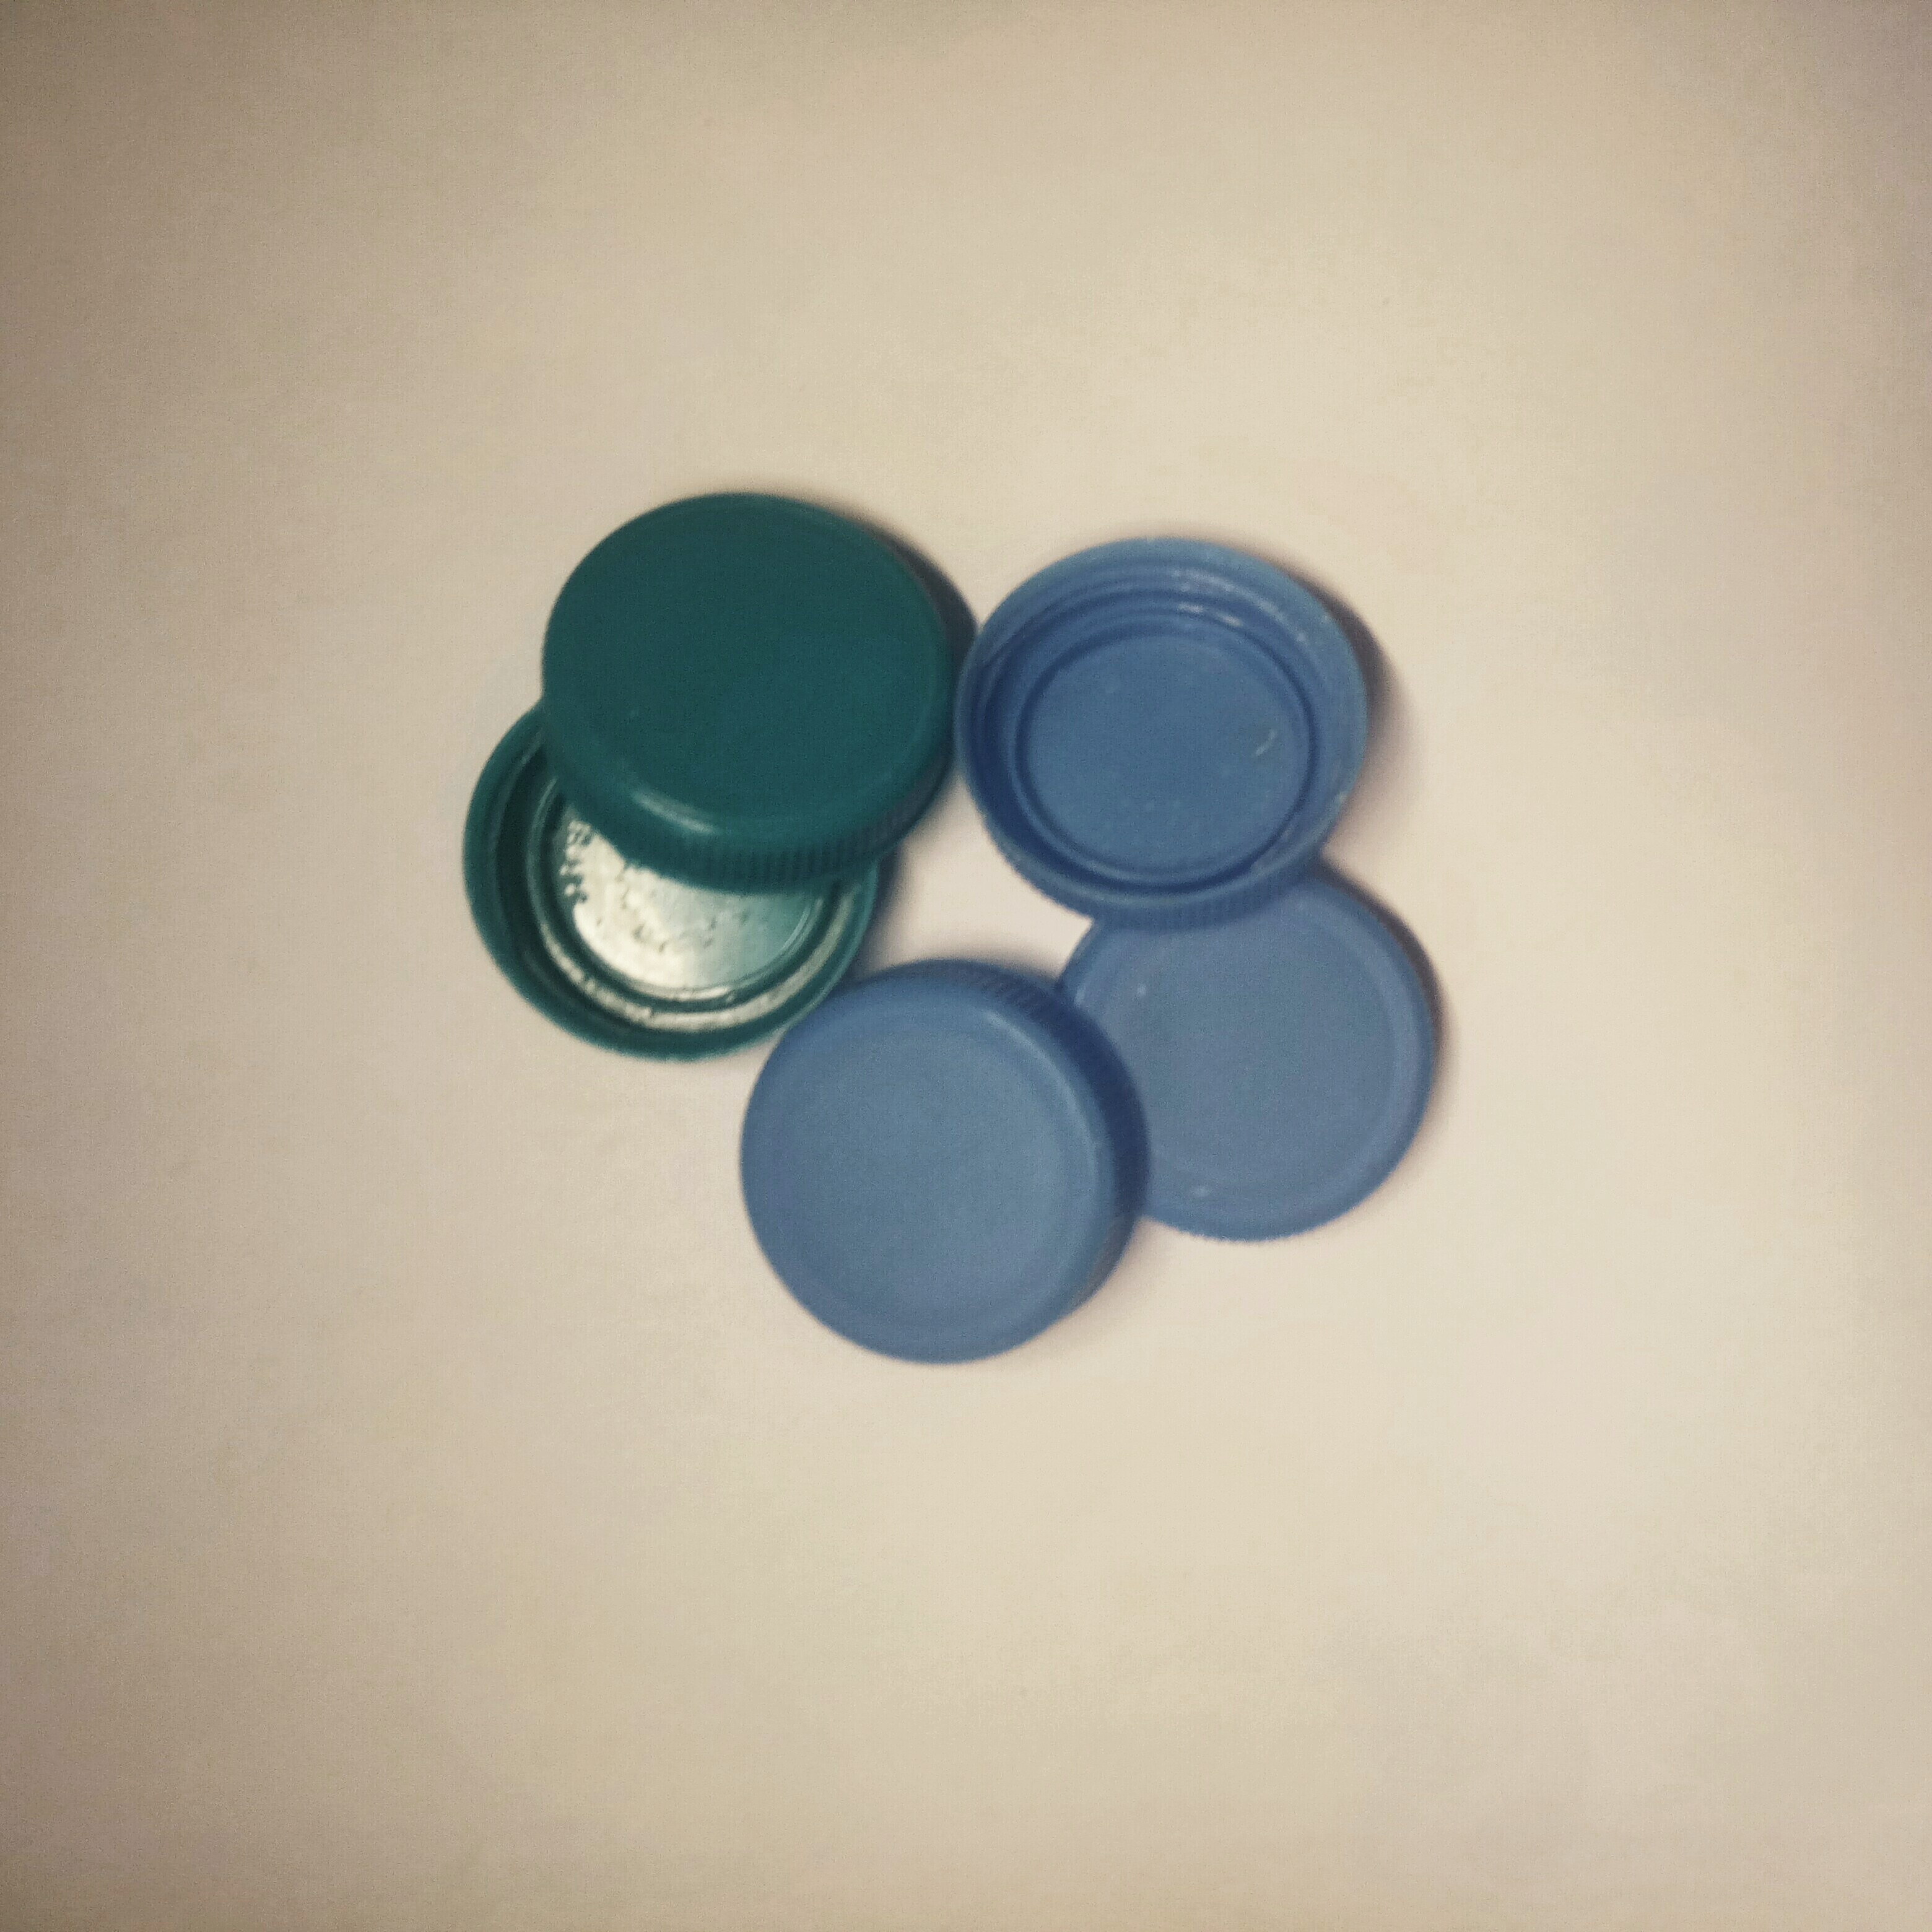
1 & 2: Plastic Pieces (bottlecaps) wrapped in fabric
These were the coarsest layers, meant to filter the largest particulate matter. The plastic bottle lids were cut up and wrapped in fabric in an effort to prevent microplastics from the plastic getting into the water. There were two sizes of these pieces, one larger and one smaller, to comprehensively filter out the largest pollutants.
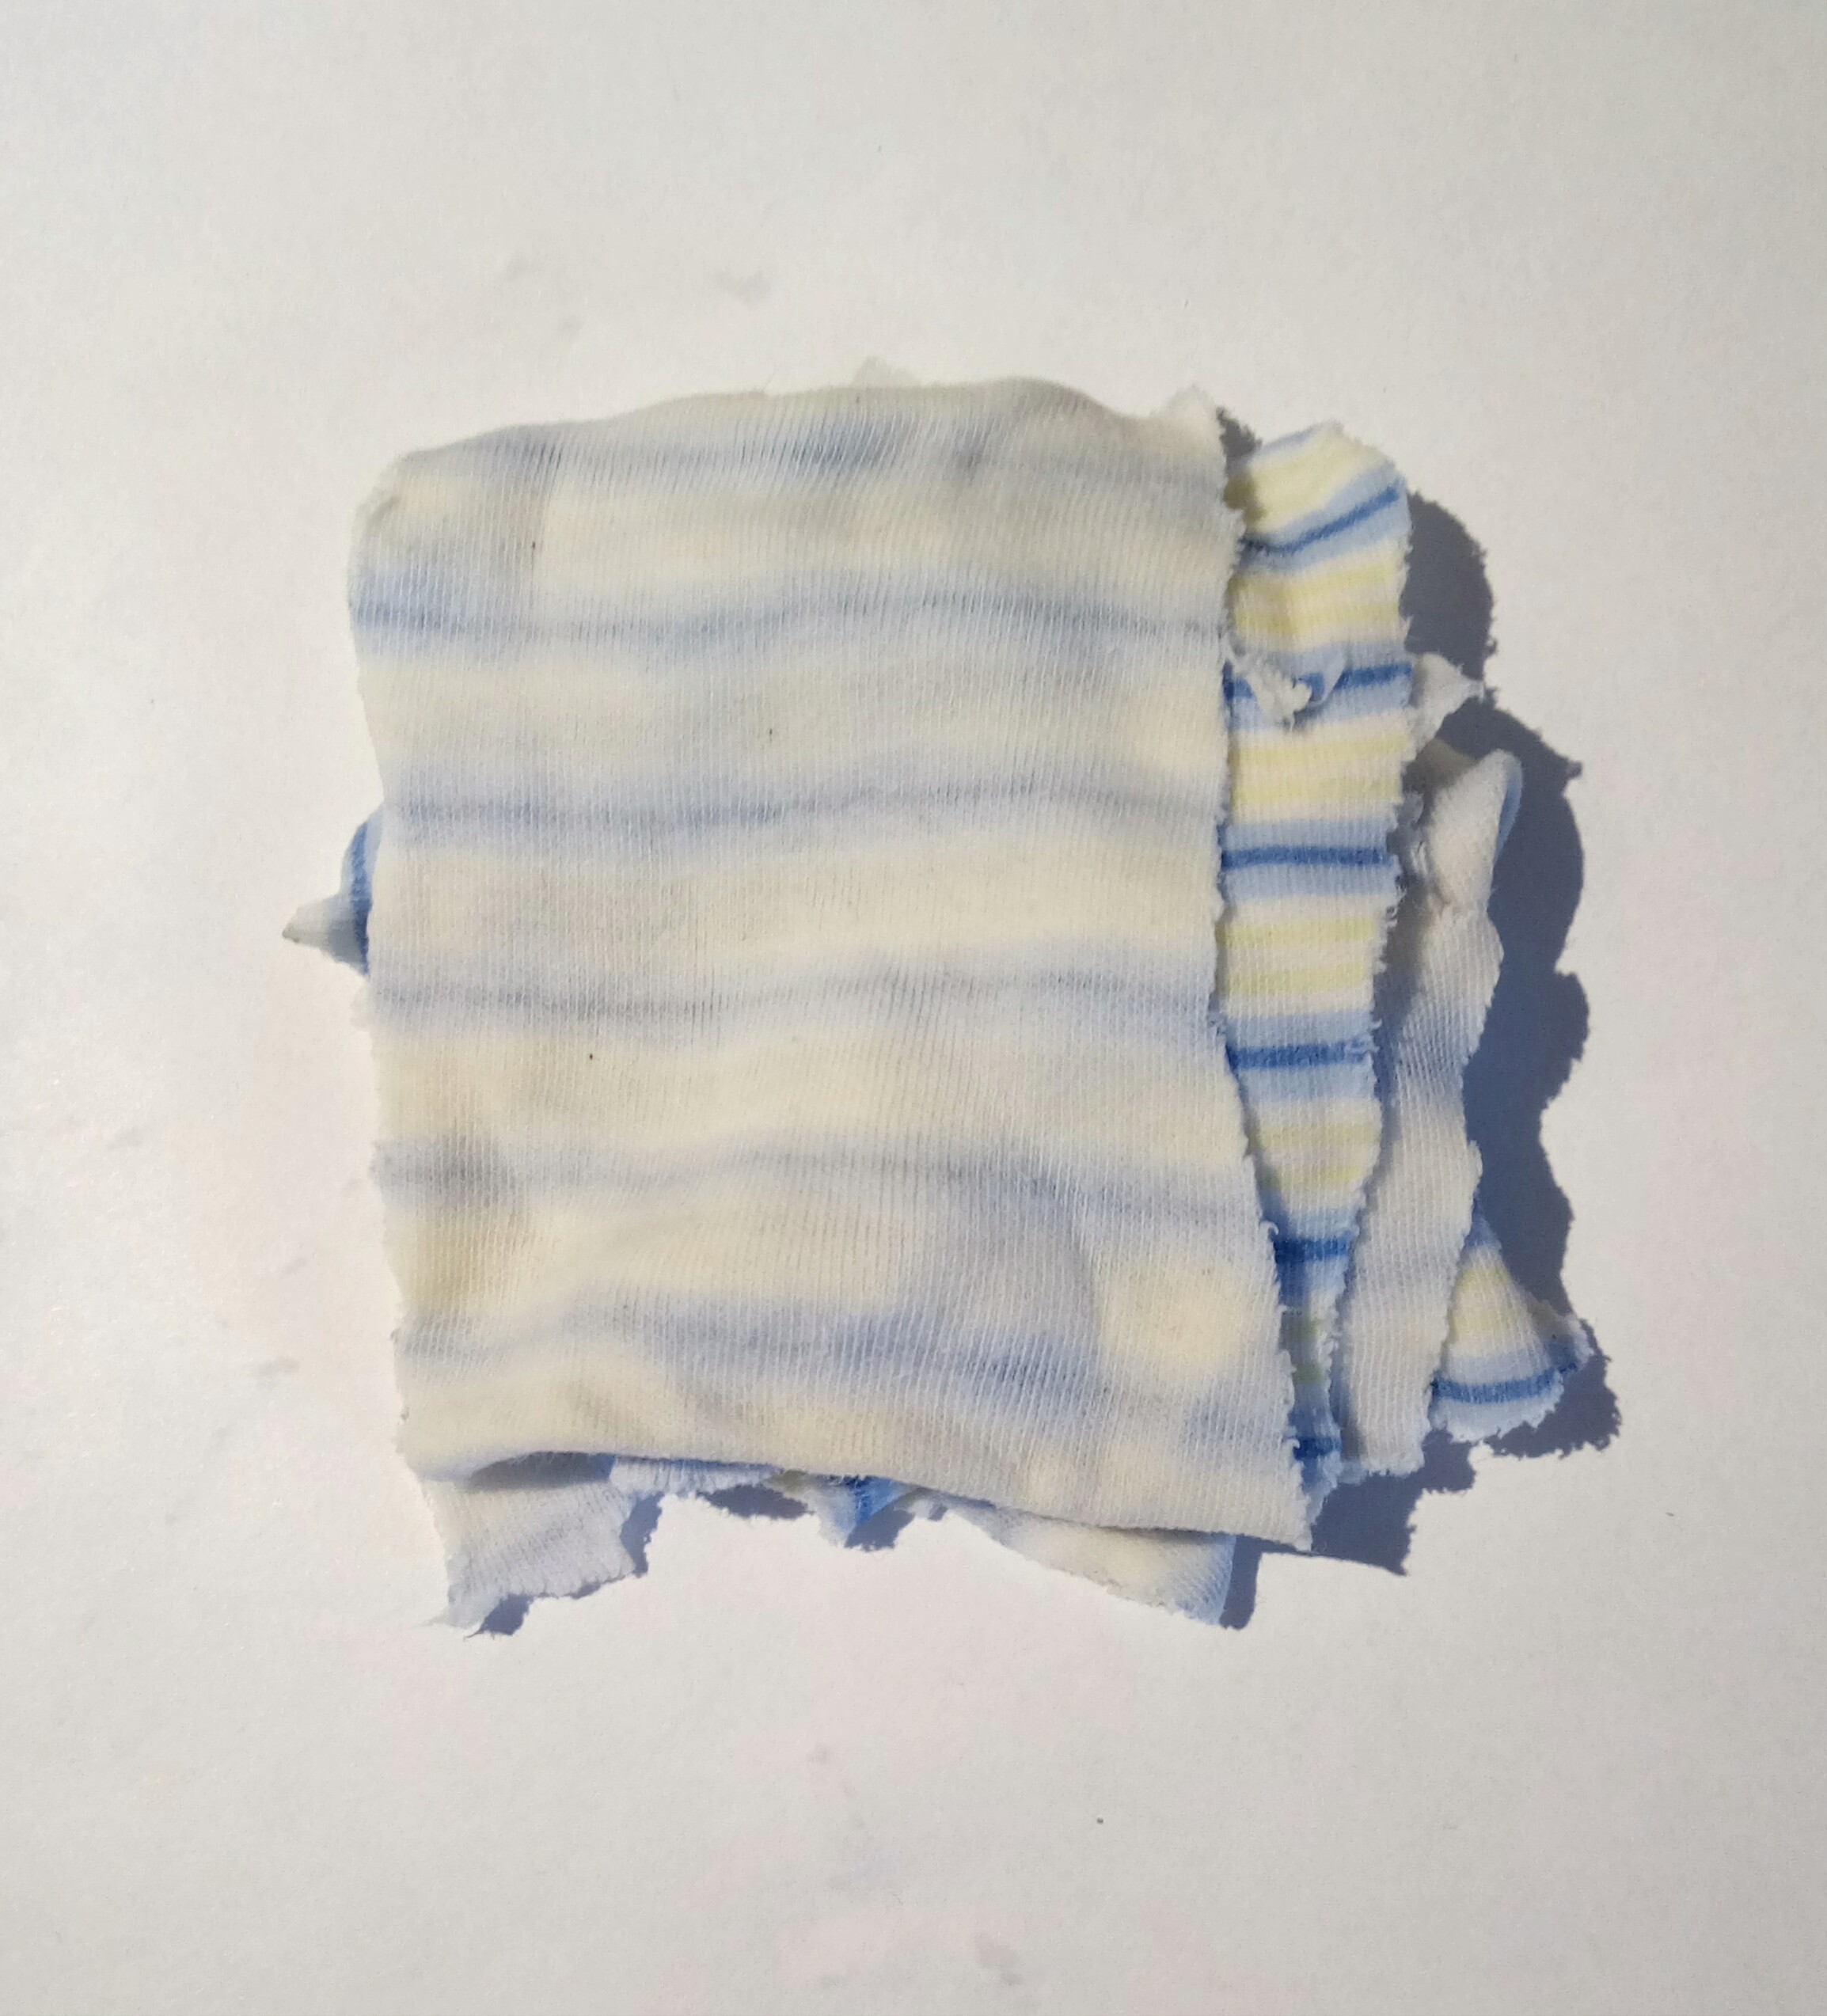
3: Coarse Fabric
This layer was meant to begin filtering out some of the finer particulate, such as dirt not caught by the previous layer. The fabric used was also the fabric used to wrap the plastic in the previous layer. Finally, this fabric was also used to separate and define layer boundaries for easier cleaning.
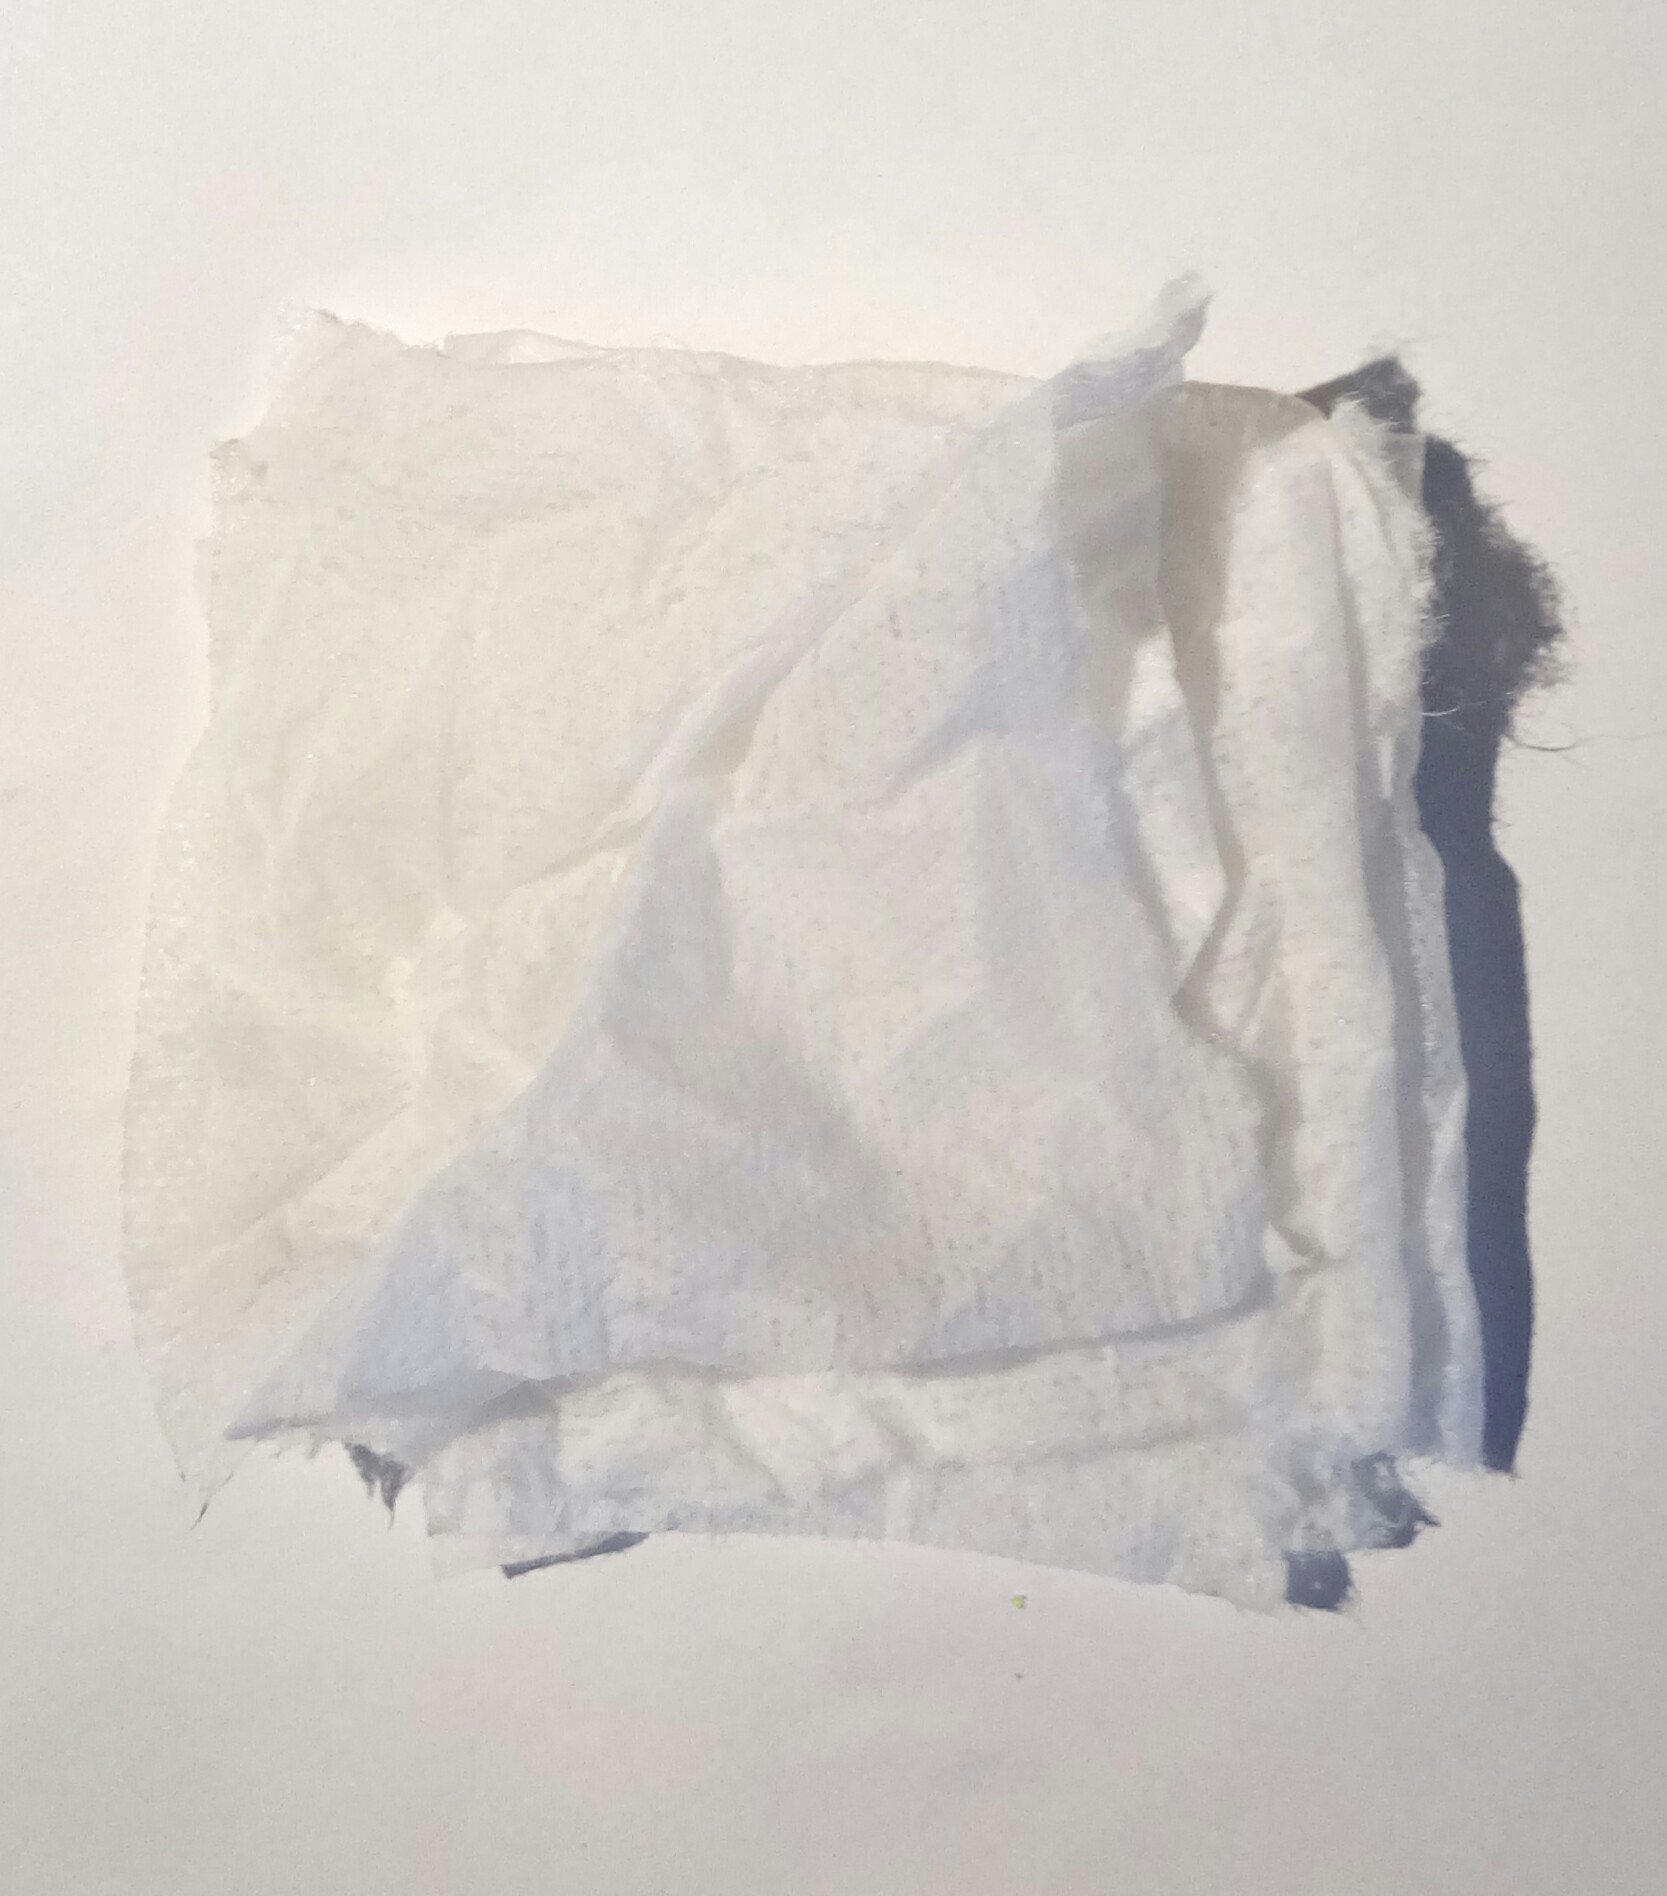
4: Finer Fabric (Wet wipes, consistency like cheesecloth)
The fabric used in this layer was cleaned prior to the first filtration process. This layer was the final one before the charcoal filter, so it was ultimately fairly thick in comparison to the previous layer, to clean out as much of the remaining pollutants as possible. A square of this was also used after the charcoal filter in case any water bypassed it.
5: Activated Charcoal Filter
The final and finest layer in the physical filter. This part was the only material that wouldn't commonly be found as waste. In a real-life situation, it can instead be substituted with raw biochar, which is a fine charcoal created from burning food waste, usually banana peels.
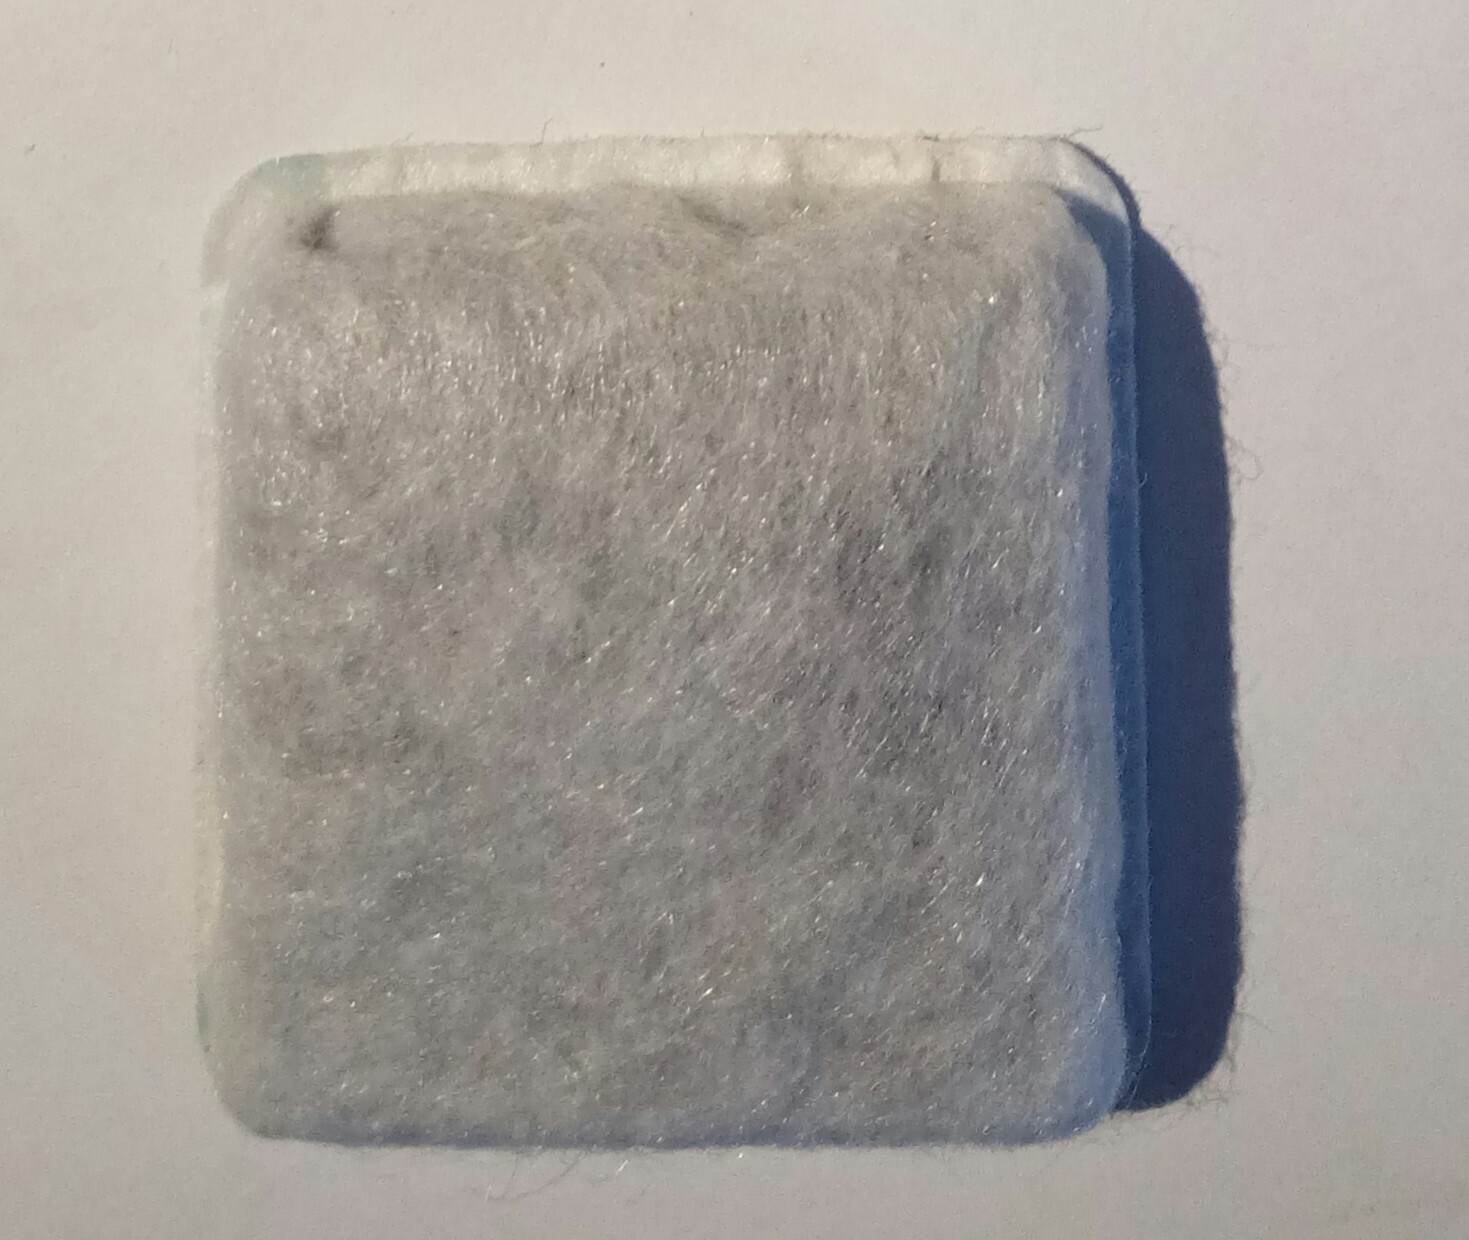
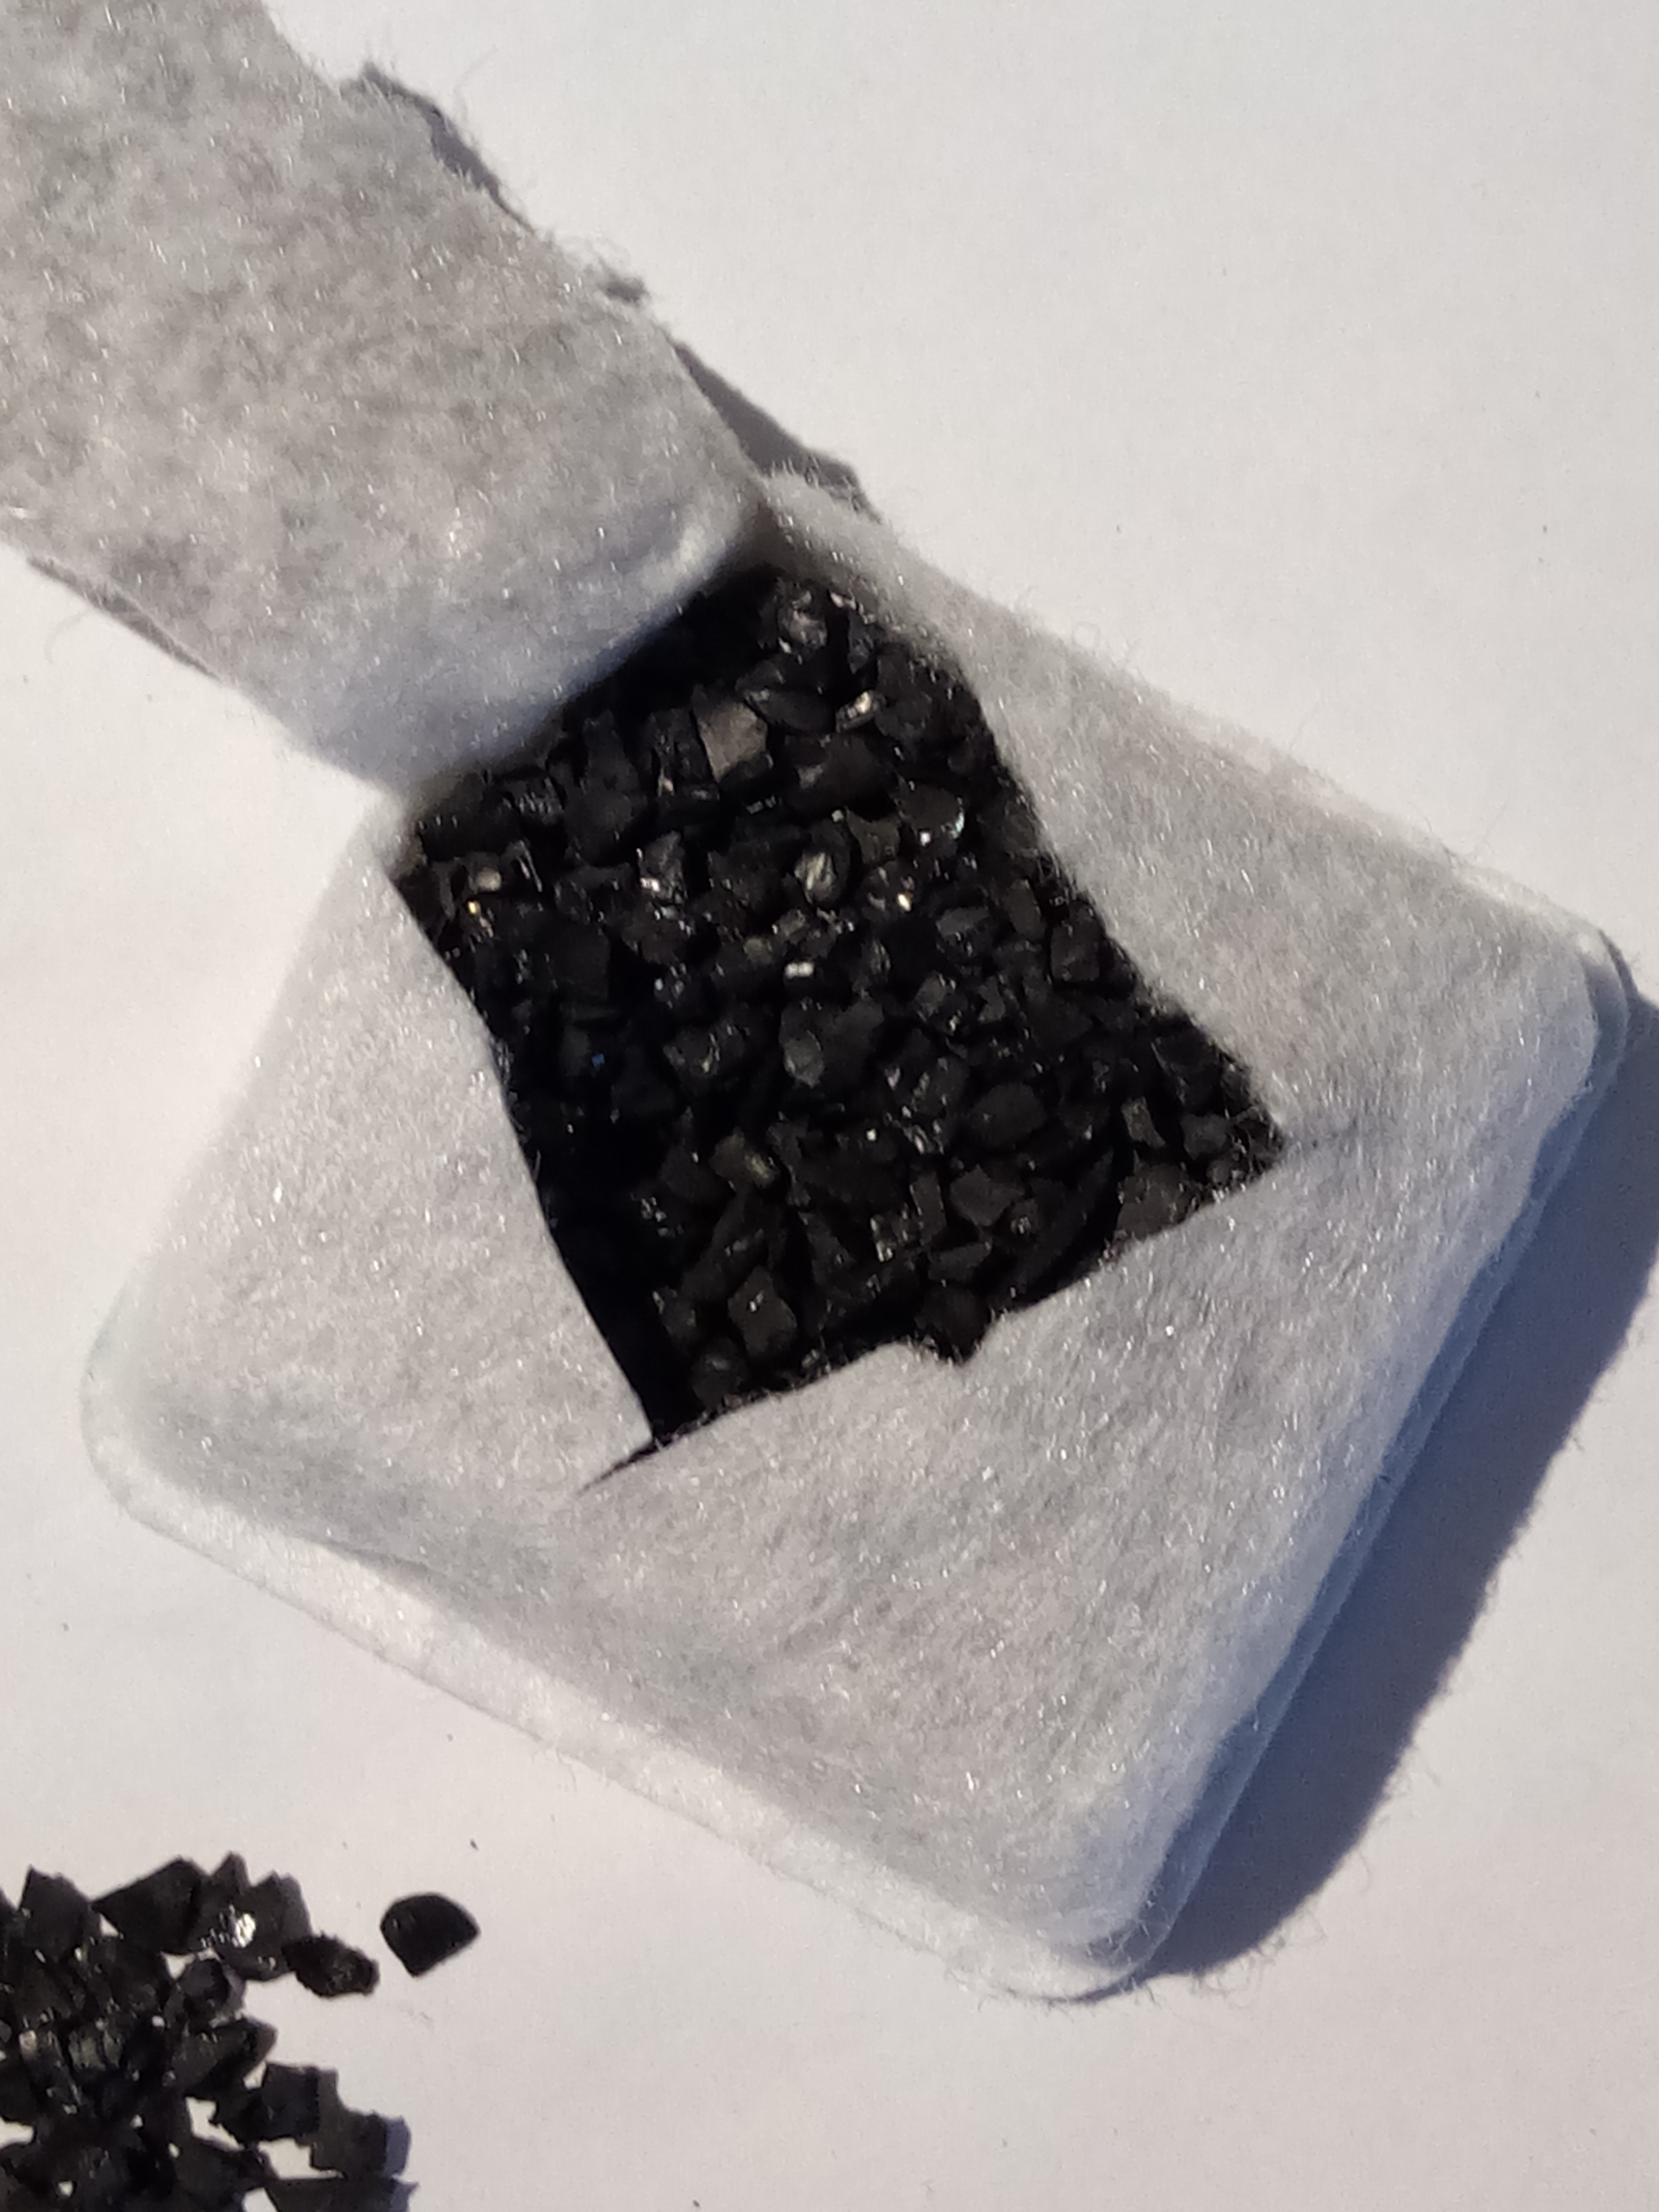
Distillation System
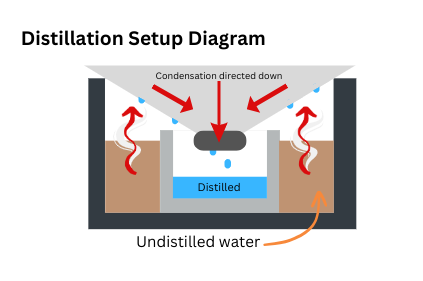
The second part of the filtration, the distillation system, was constructed out of a steel pot, with an upside-down conical lid that would direct the water condensation that collected on it into a smaller vessel within the pot (a graphic of this can be found under the testing protocol section). This part was primarily used as a finisher for anything that the particulate filter could not remove, as well as a sterilization agent because of the heat that was needed to boil the water. With an absence of steel pots and lids, this system could be recreated with any type of semi heat-resistant material that is generally bowl-shaped, such as plastic milk jugs, though the heat used in the process would have to be reduced to prevent melting, with the distillation taking longer.
Next, the samples that the filter would be tested against were gathered and tested, as well as a control.
Samples
- A control, taken from boiled kettle water
- A sample of driveway snow ('clean' snow)
- A sample of snow taken closer to the road (visibly grey; dirt, road salt and other chemicals)
- Water contaminated with fertilizer
- Achieved by putting 10 grams of Miracle-Gro All Purpose Fertilizer into a jar of tap water
- Water contaminated with disinfection chemicals
- Achieved by placing two Lysol wipes into a jar of tap water and leaving to soak overnight
- Water contaminated with fluoride
- Achieved by mixing 25 mL of fluoride toothpaste into a jar of tap water
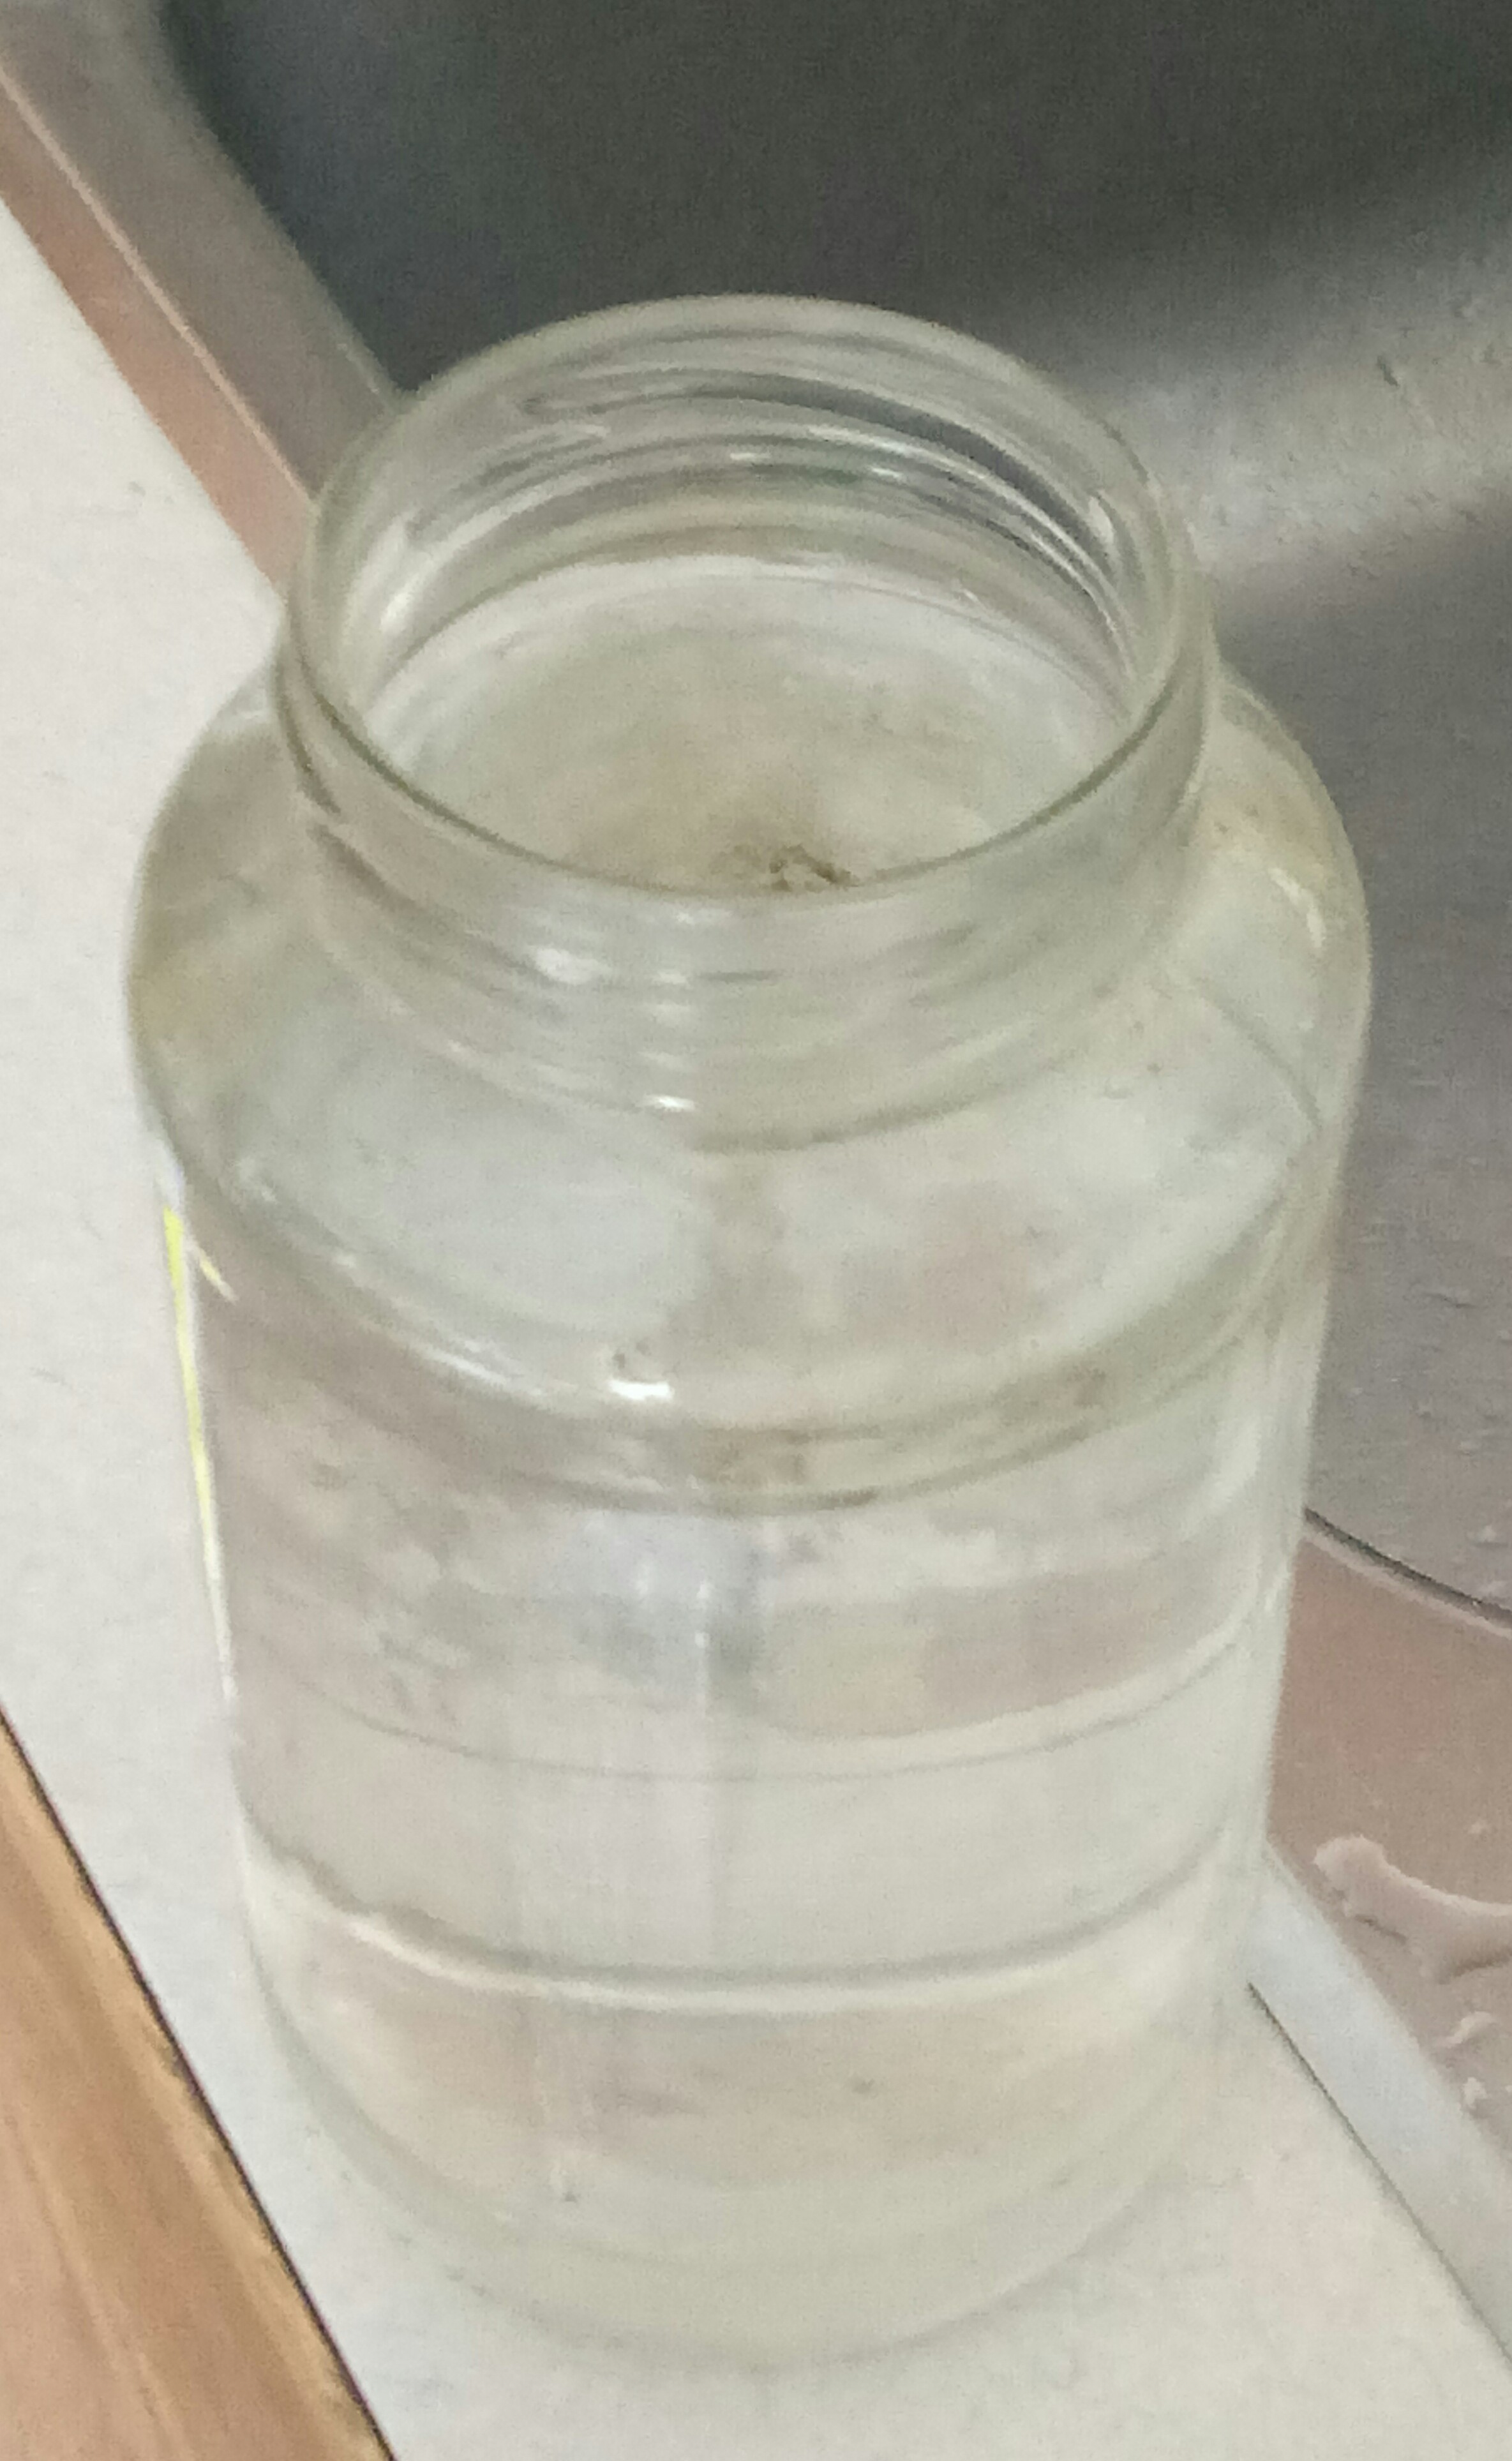
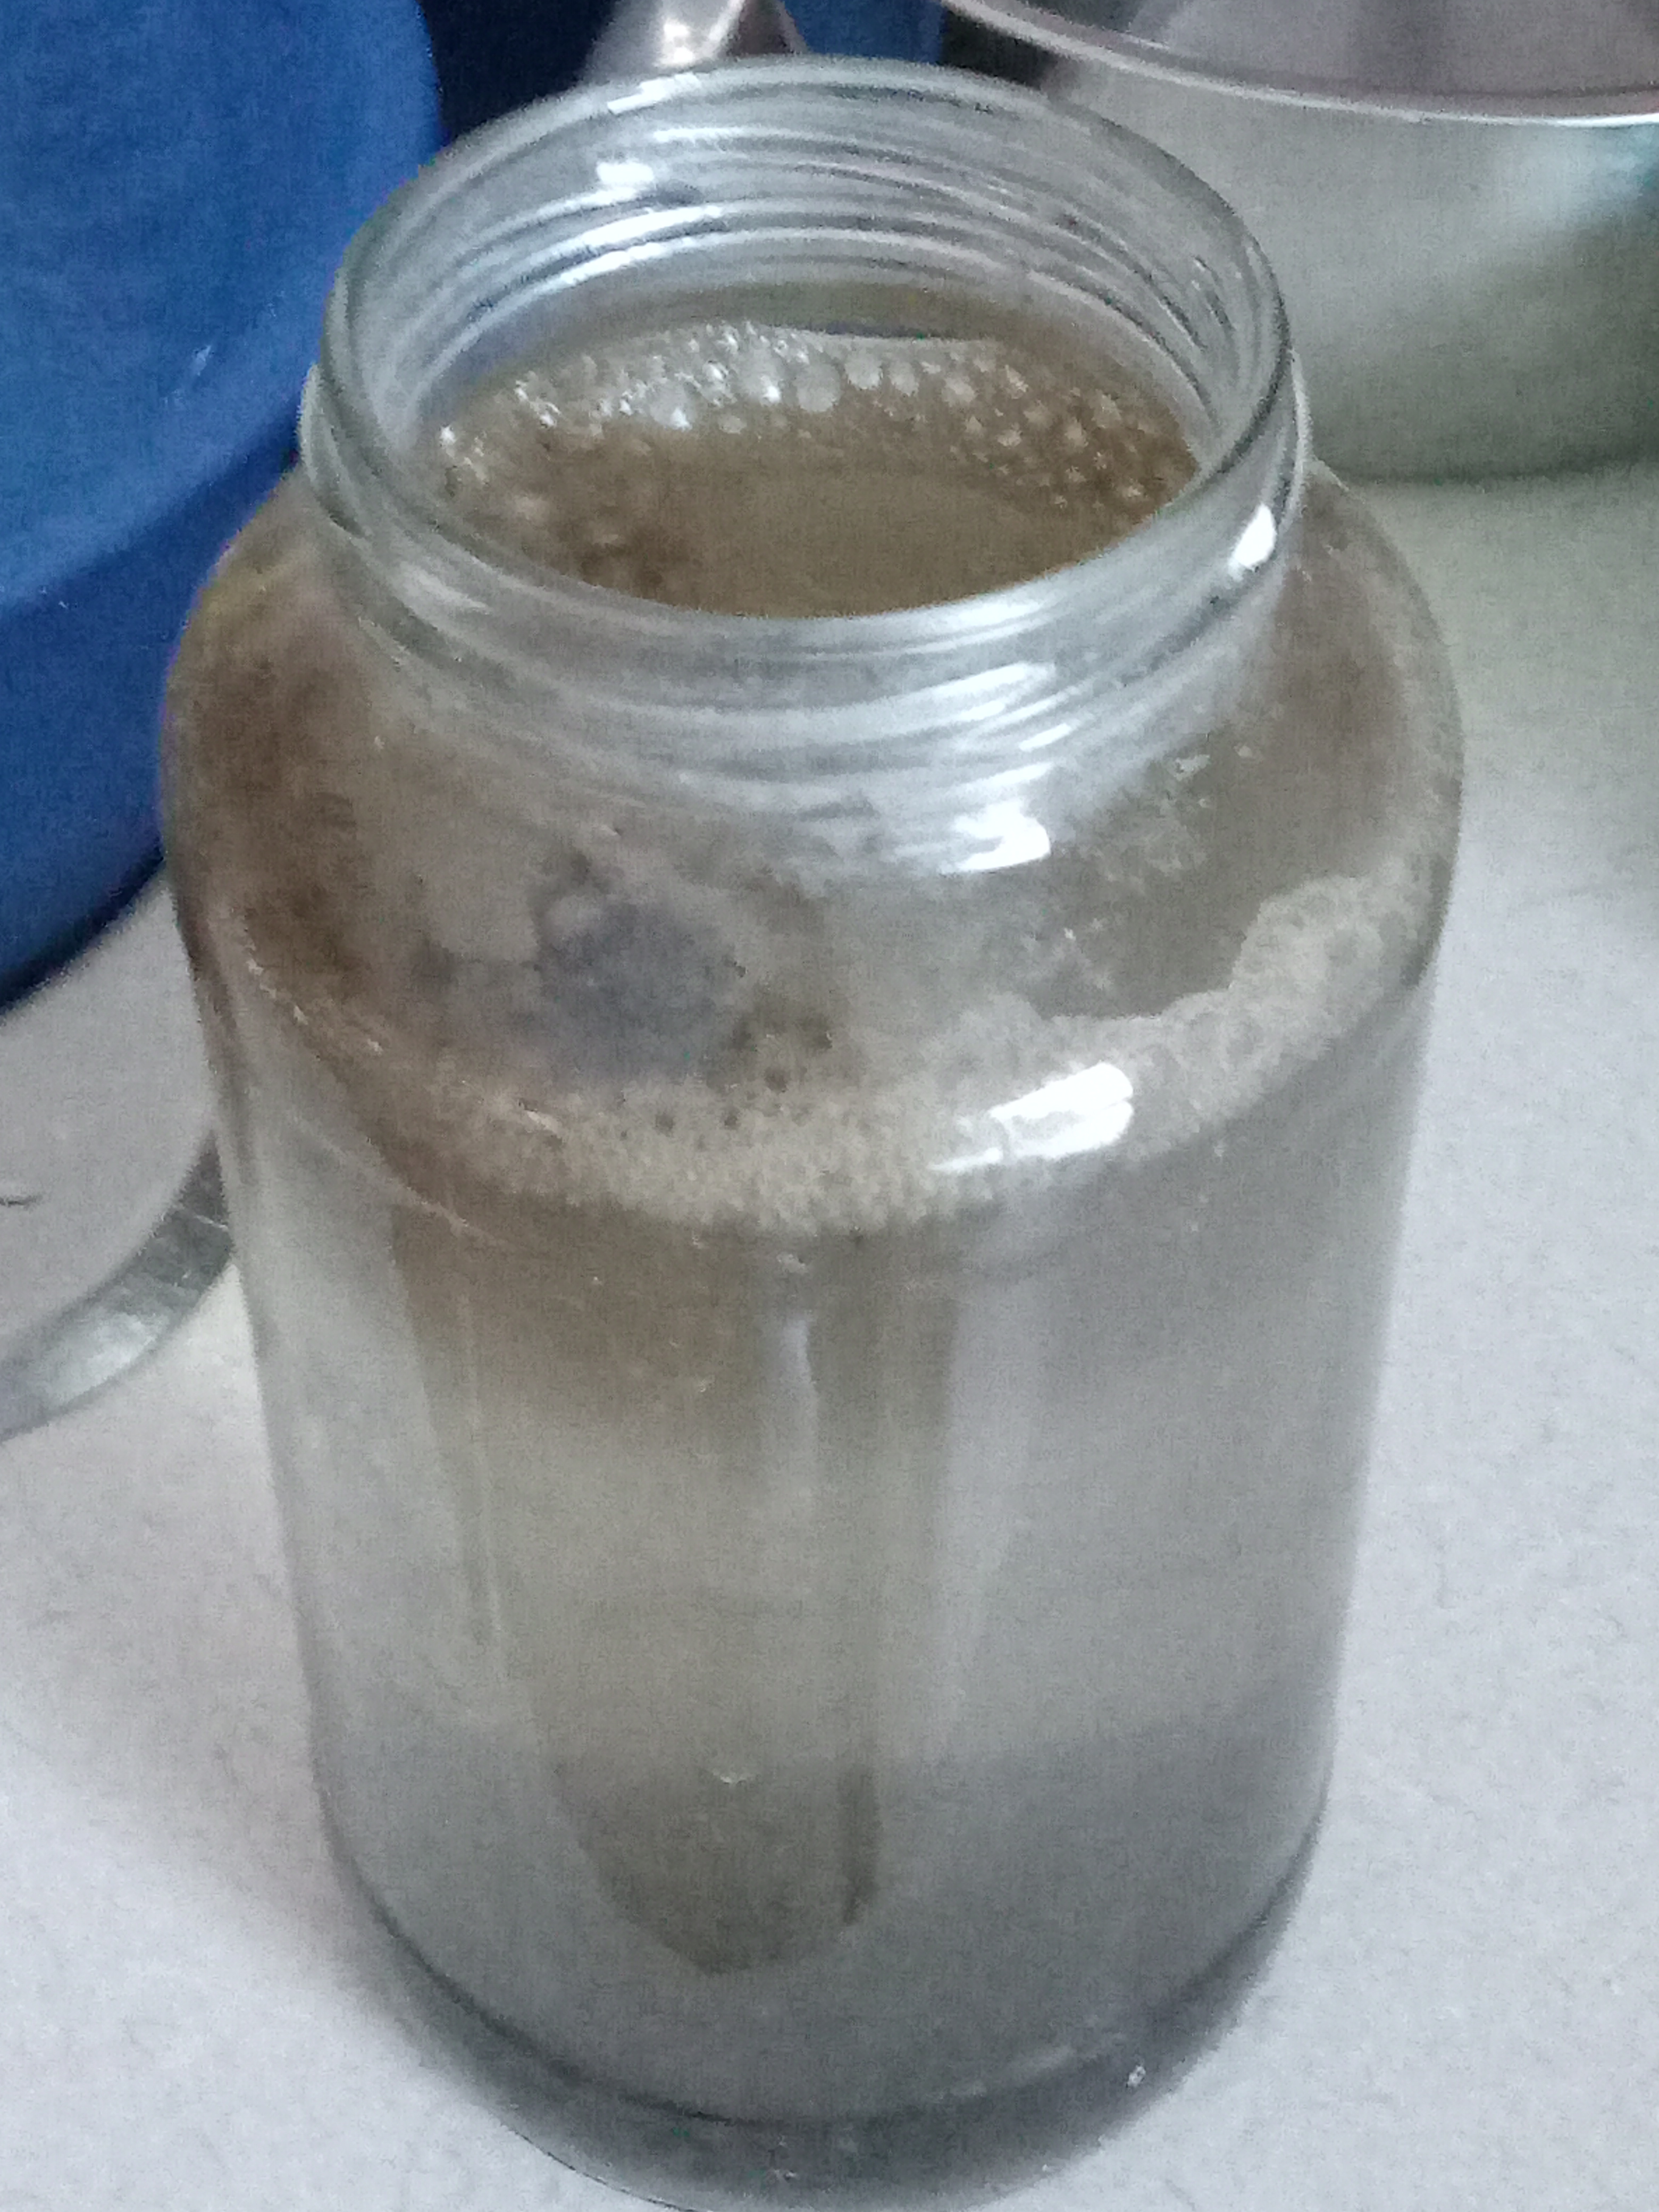
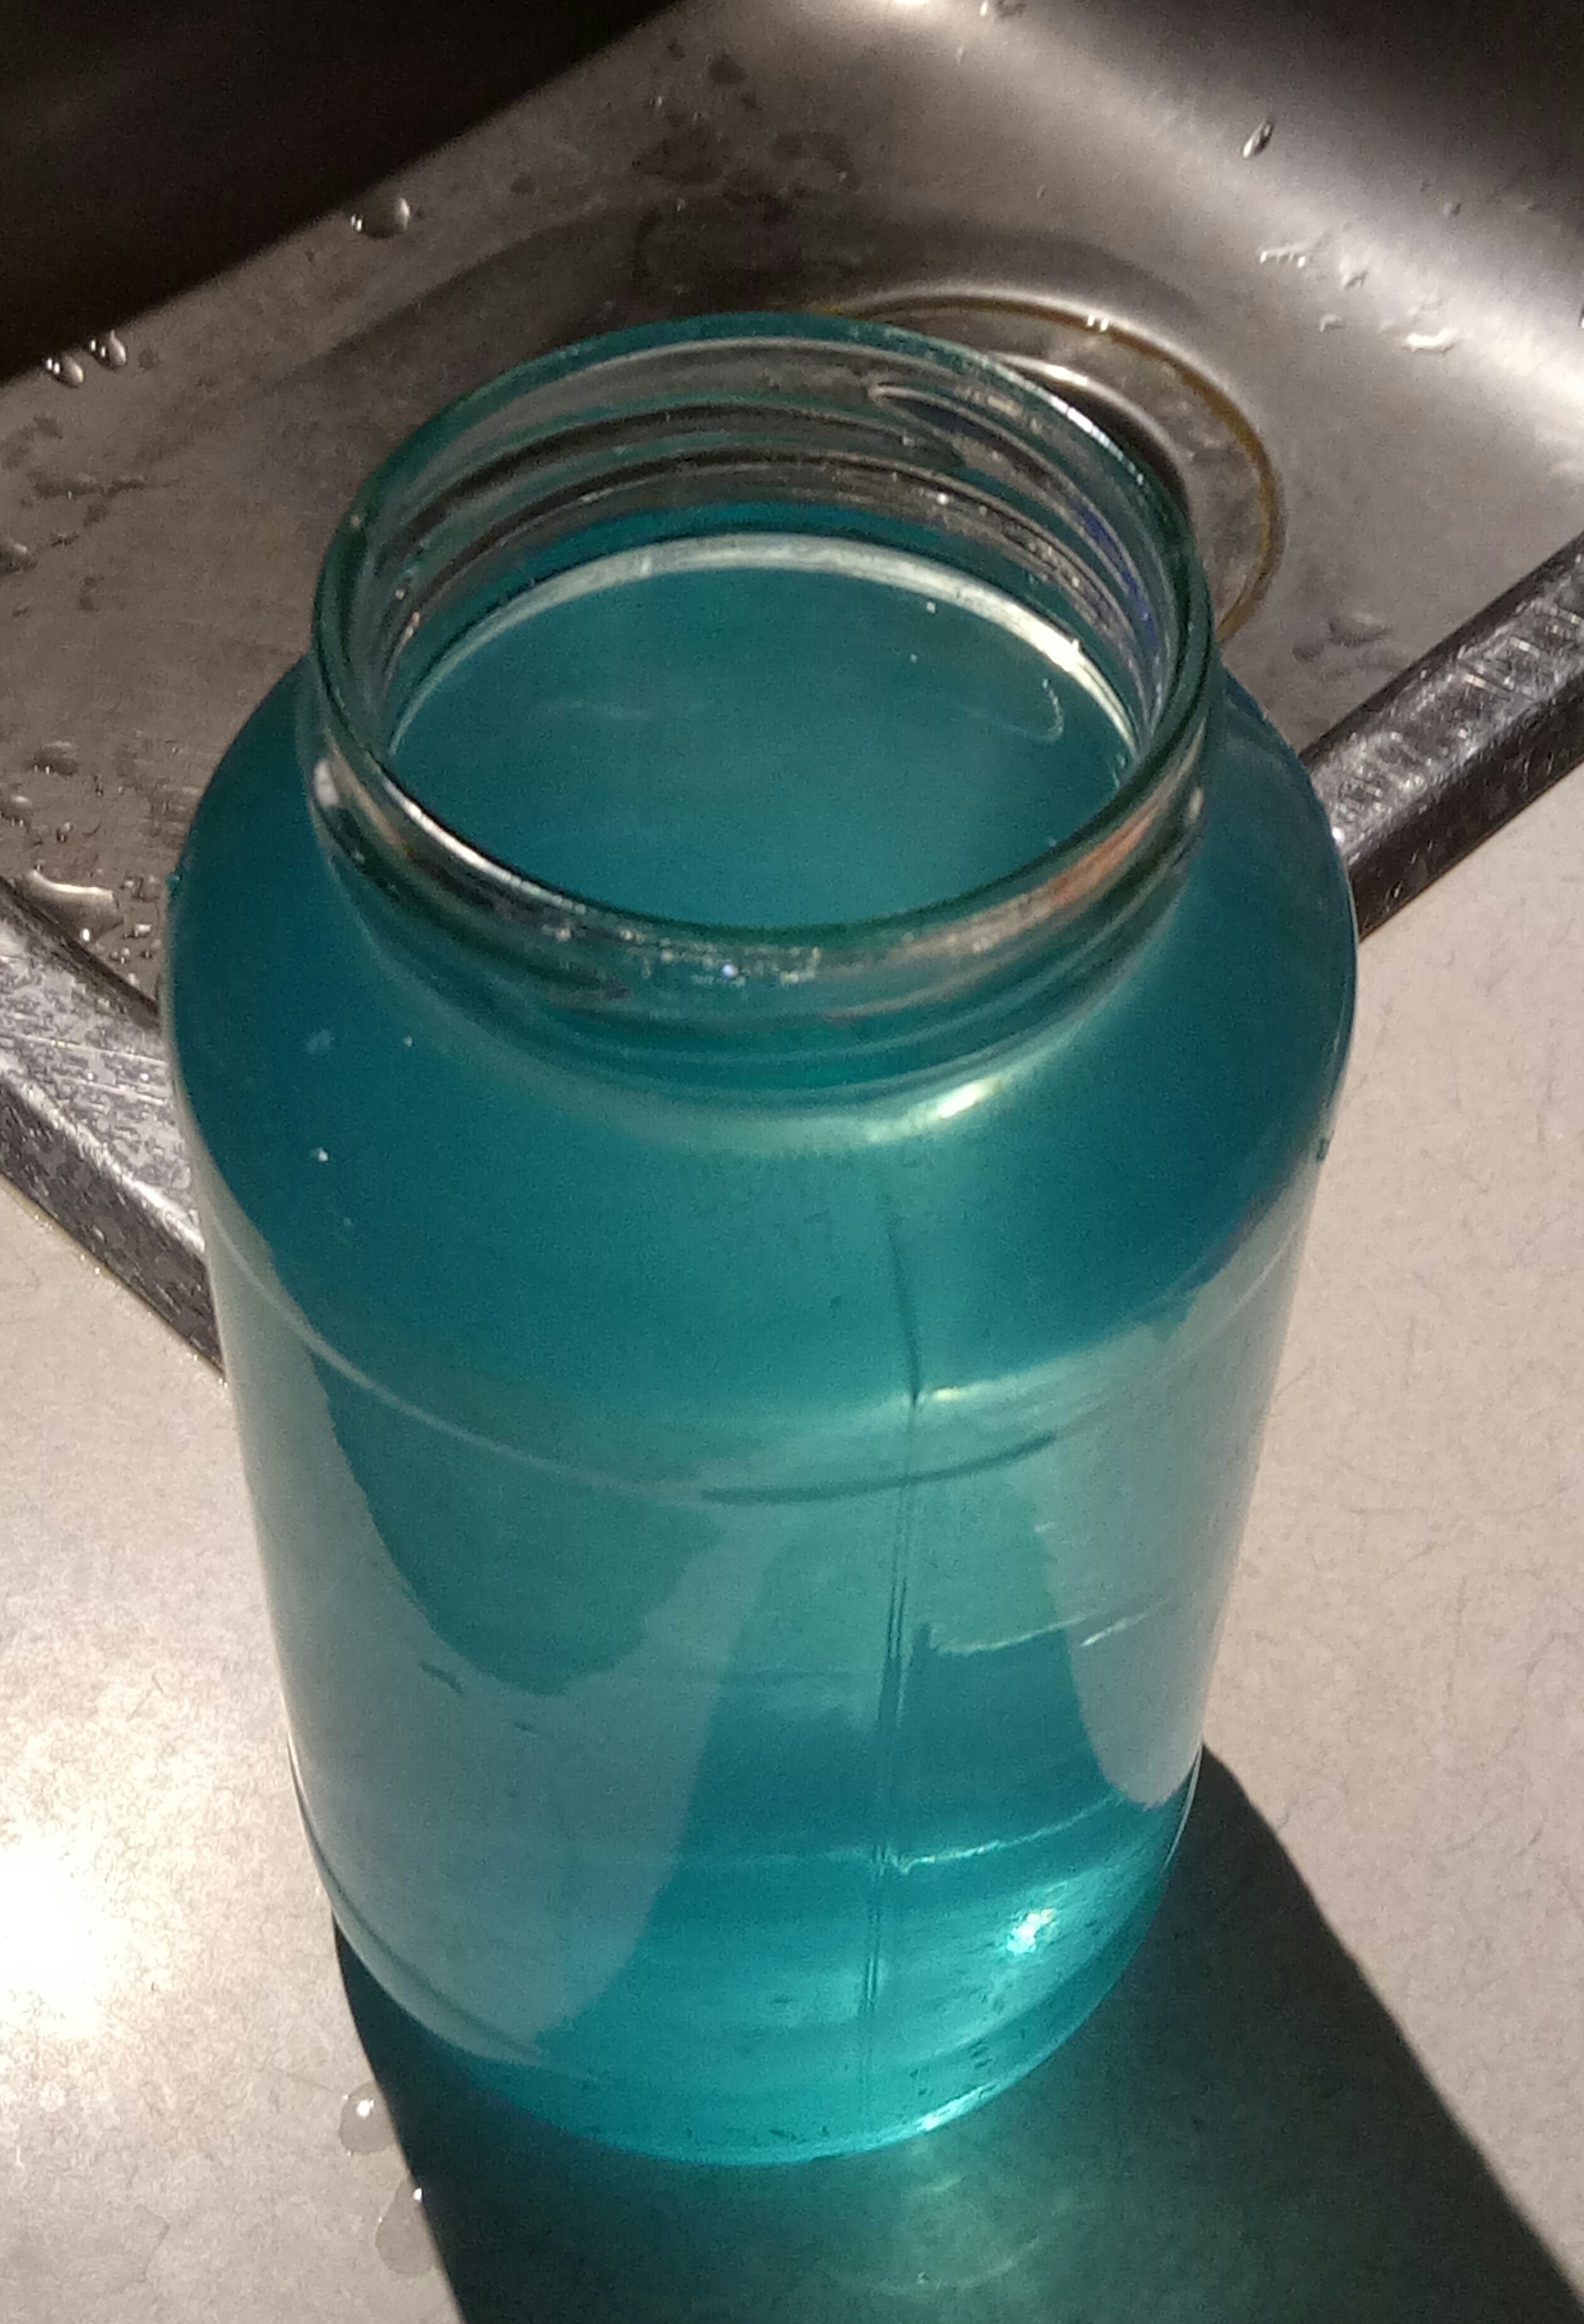
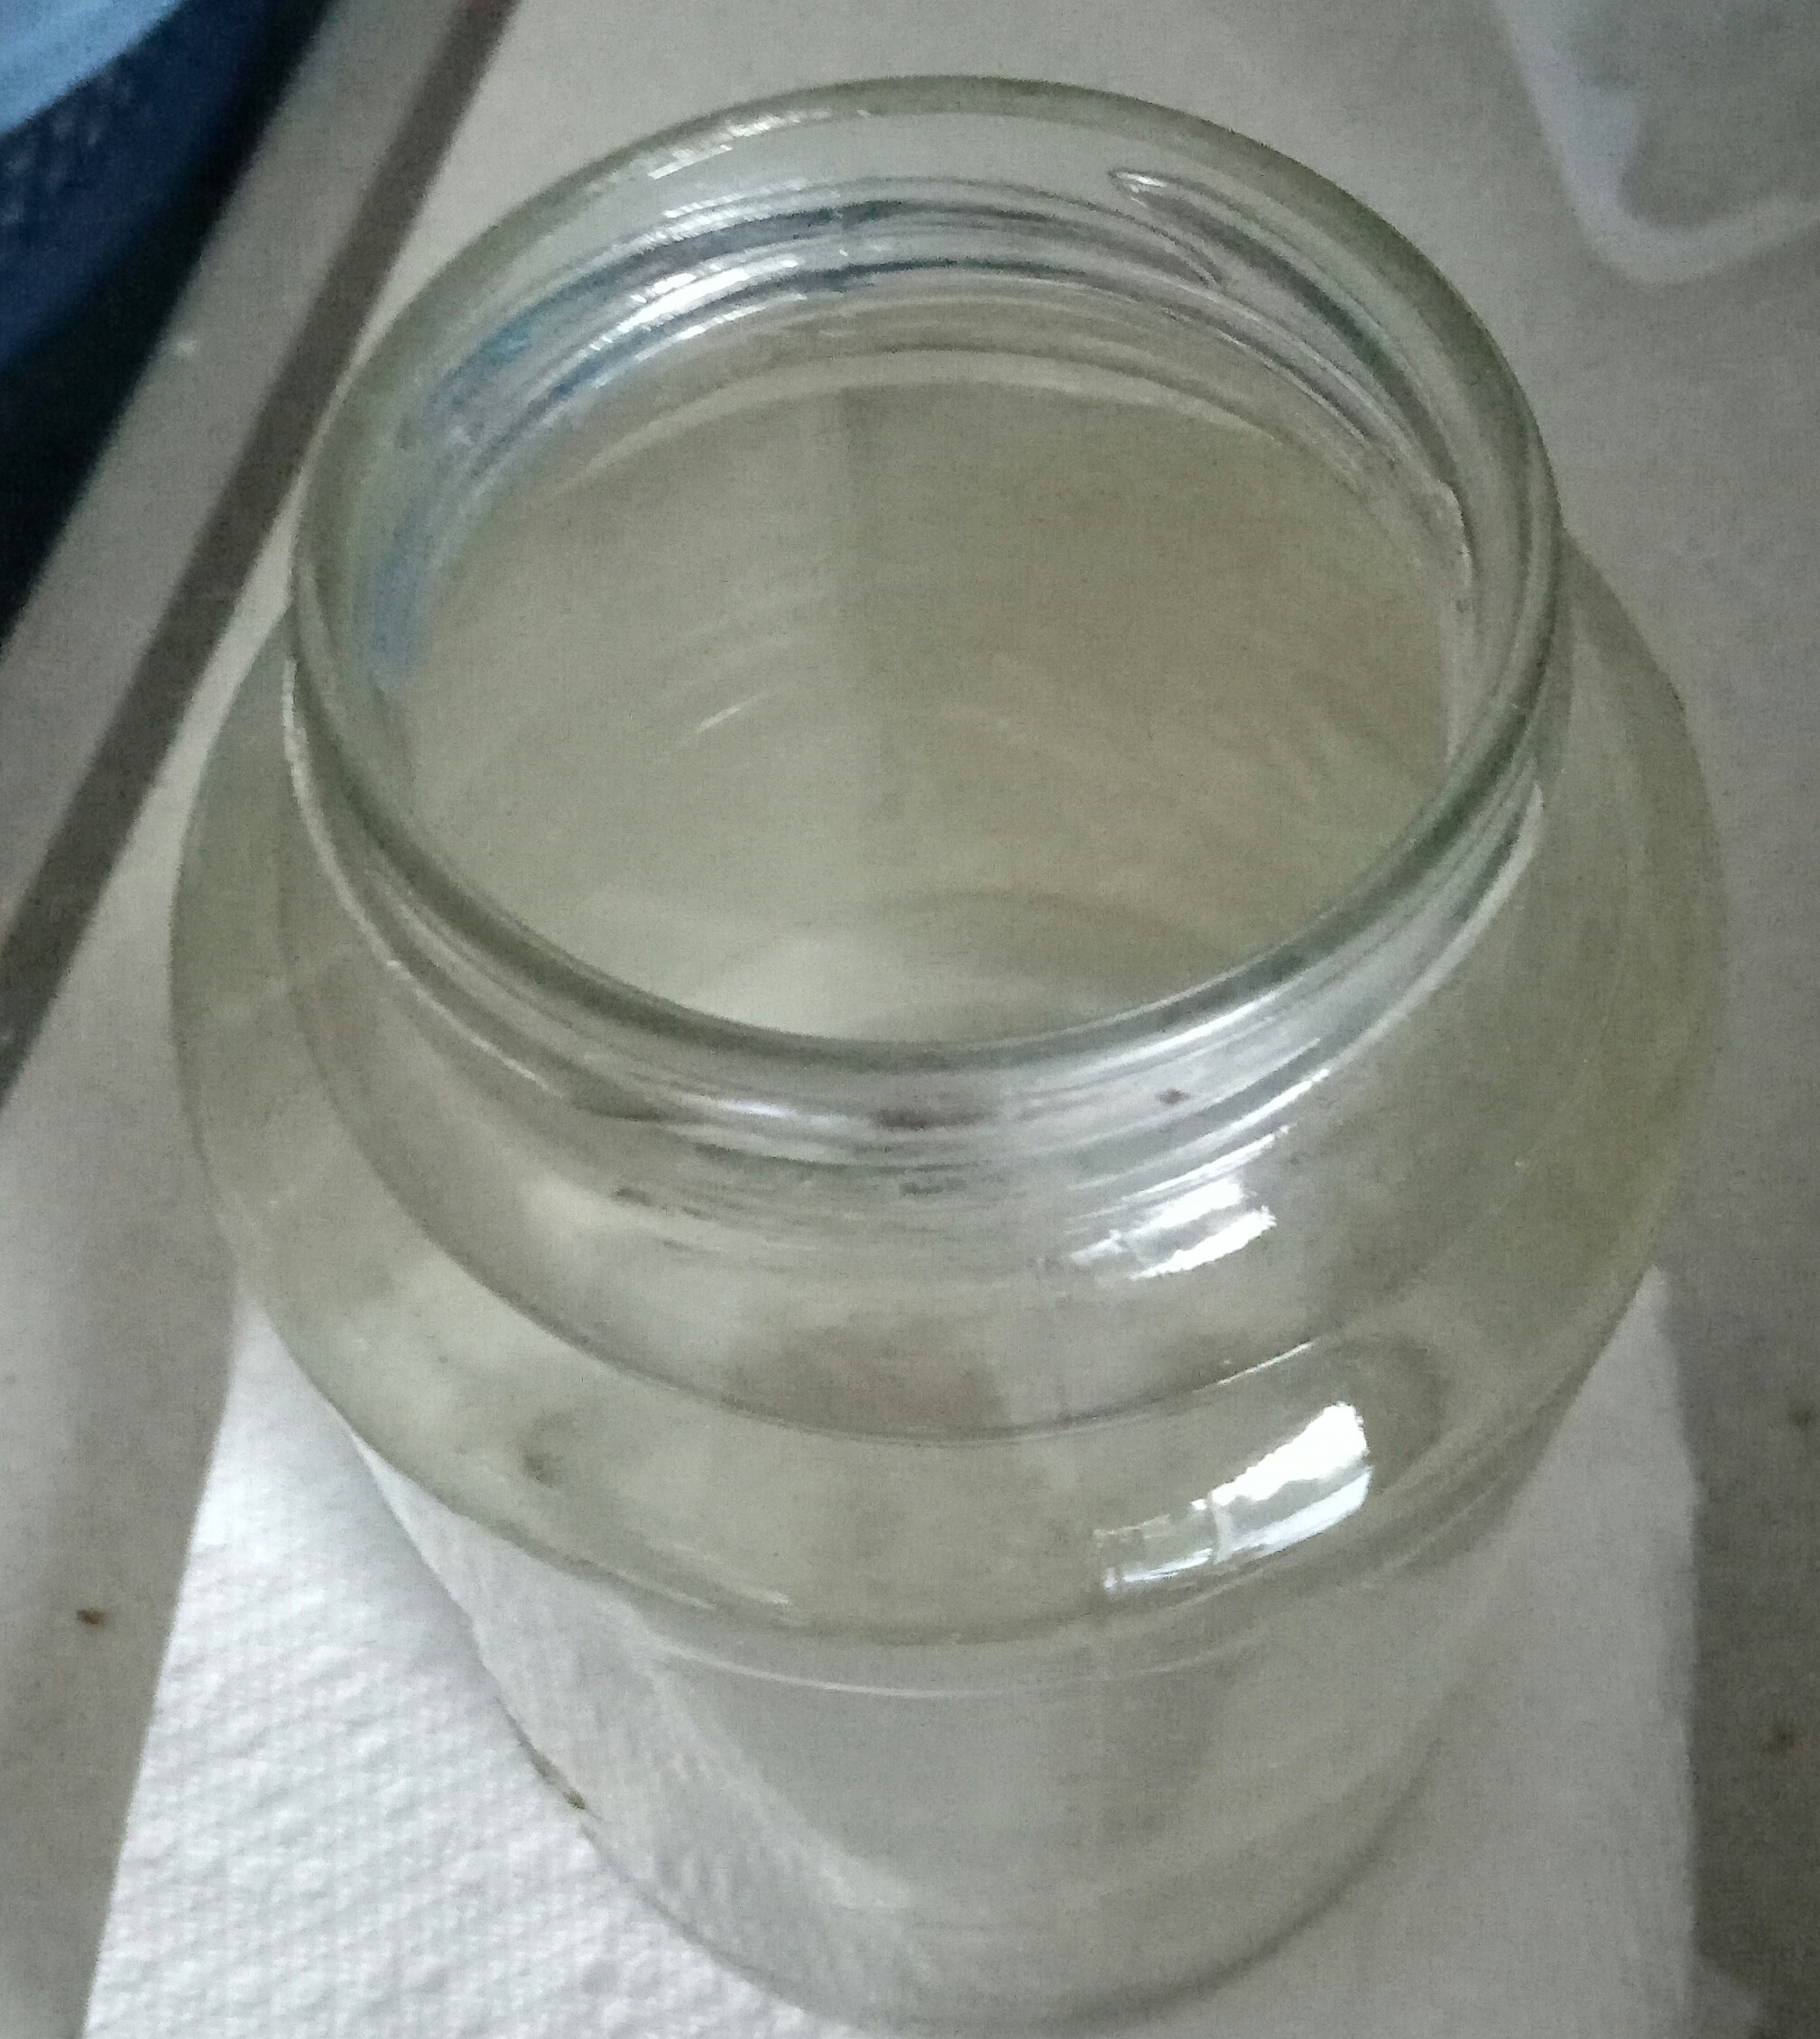
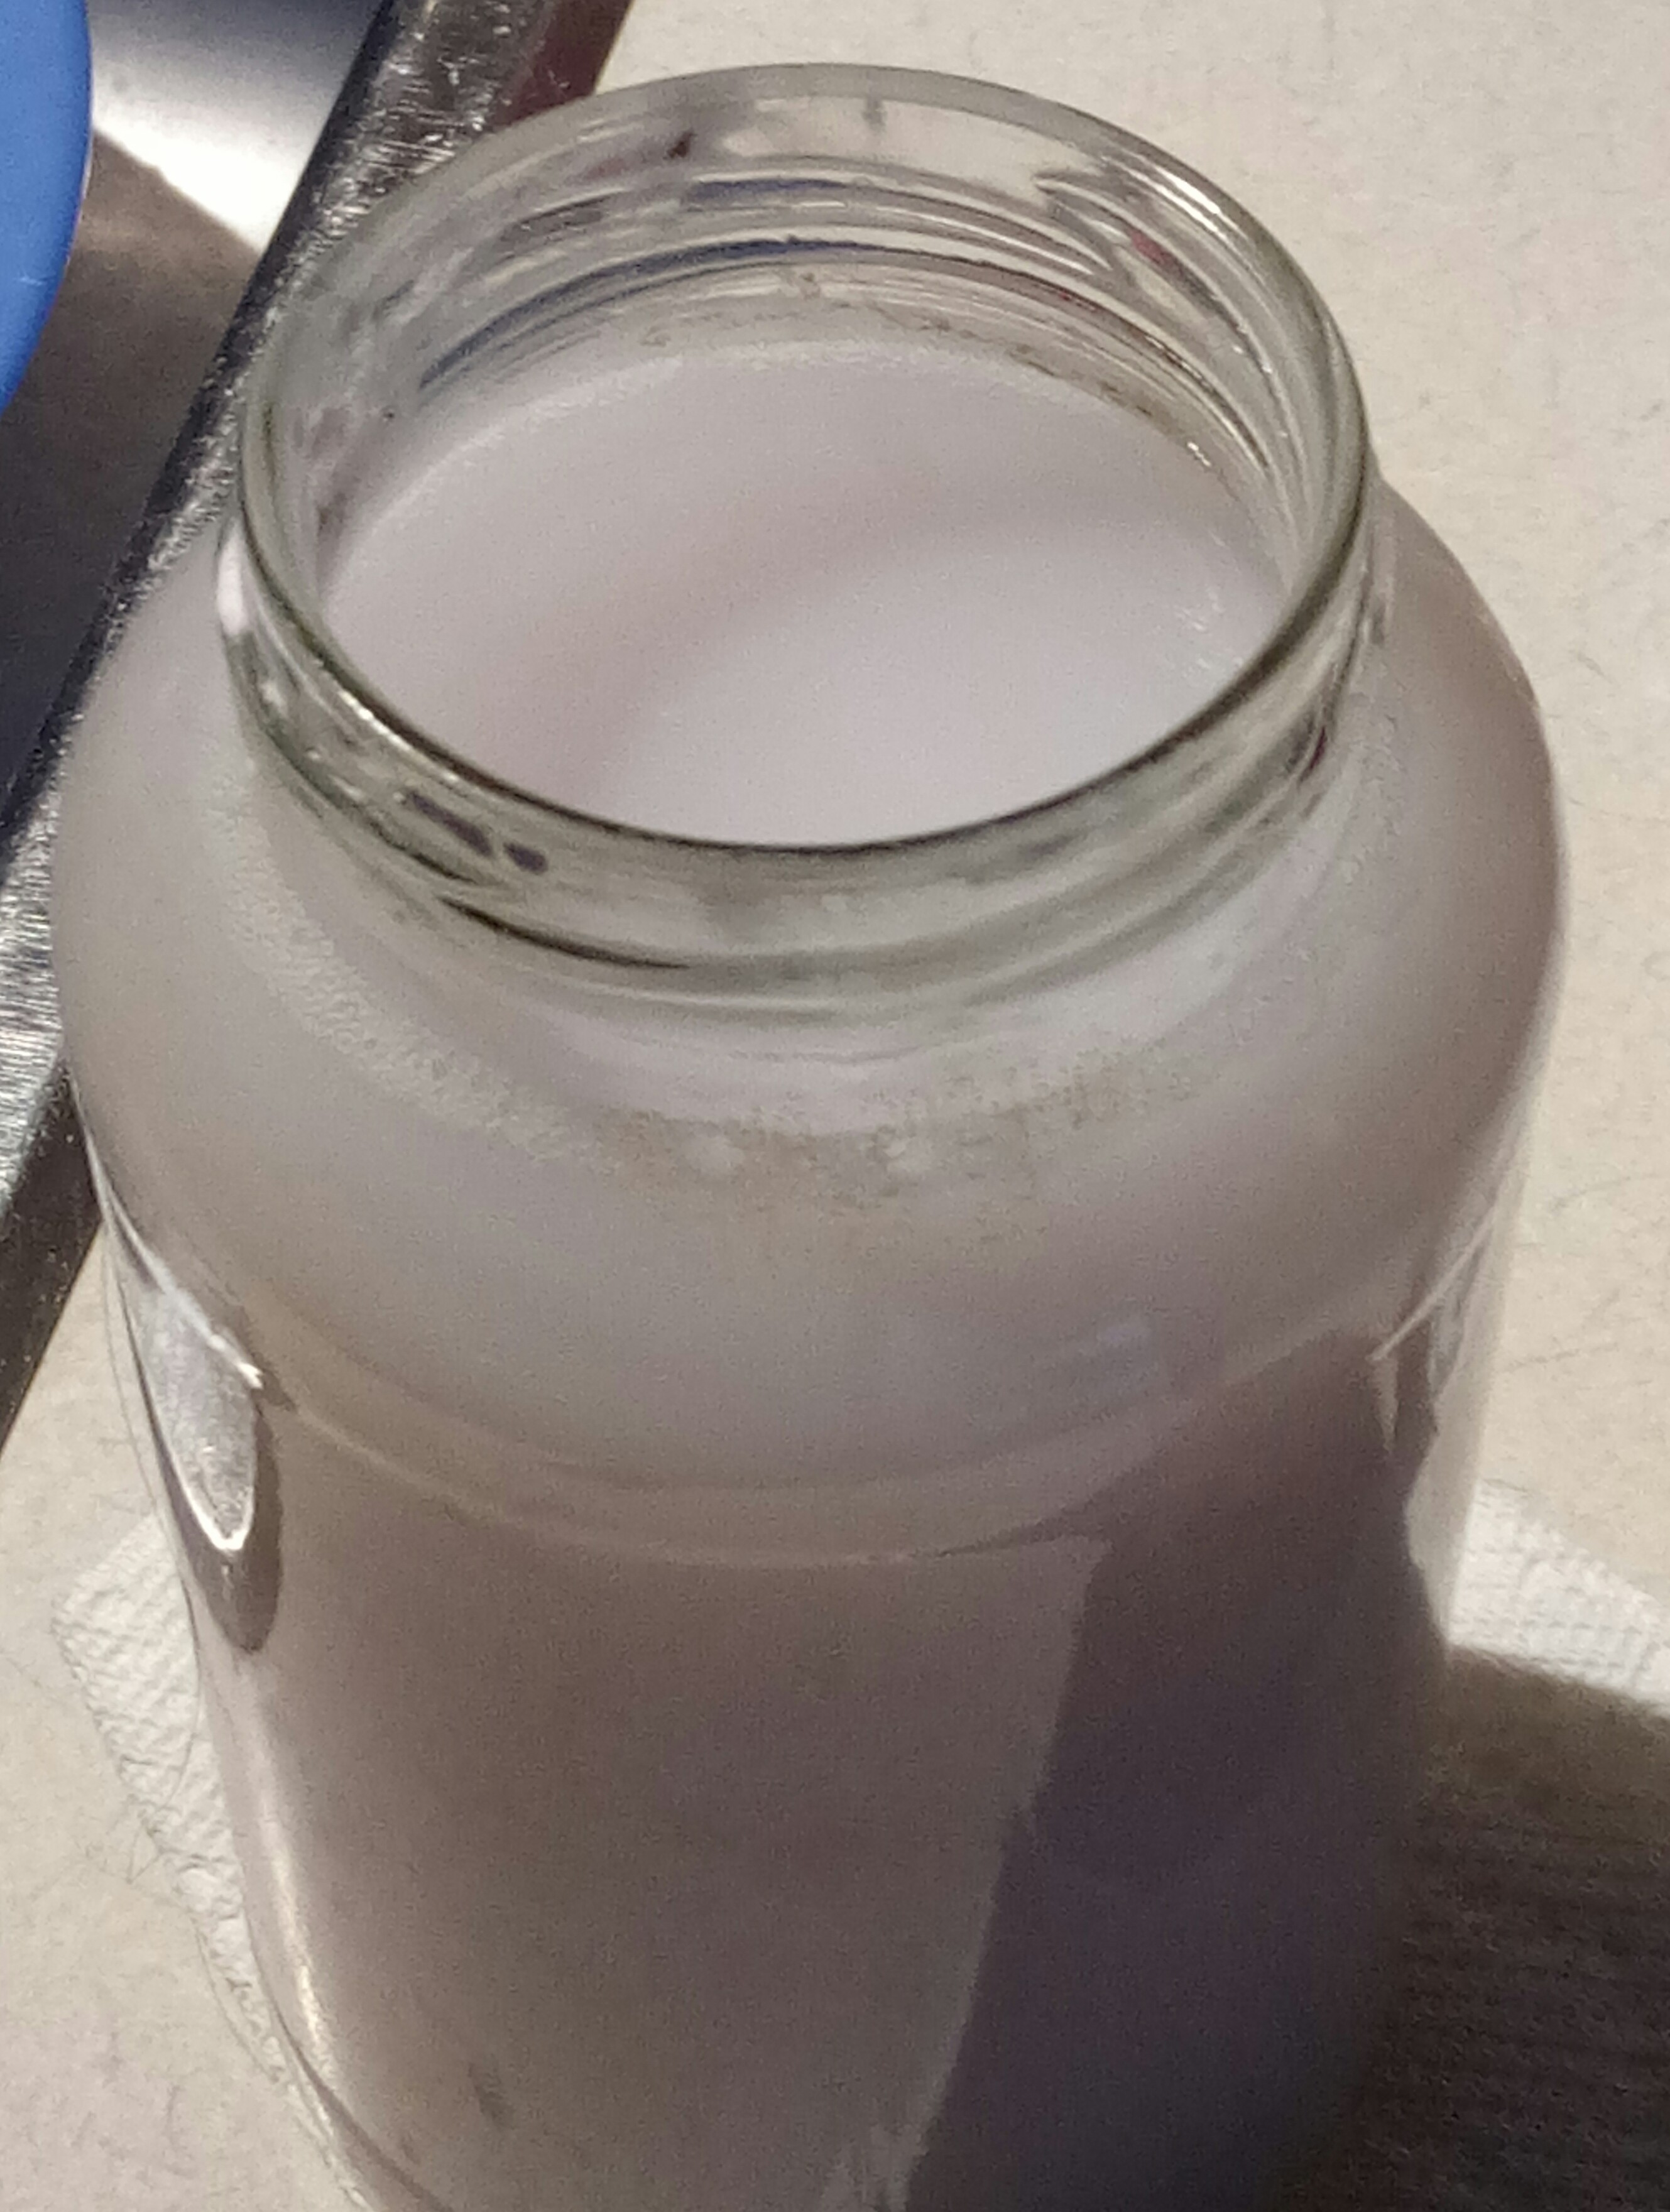
Samples (1. Clean snow, 2. Dirty Snow, 3. Fertilizer, 4. Disinfection, 5. Flouride.)
Testing Protocol:
1. Firstly, the contaminated samples were tested with water testing strips and their volume measured. 500 mL from each sample was allocated to be purified to reduce bias in the results.
2. The sample water was run through the physical filter ONCE, with its volume and quality measured directly afterwards to determine the amount of water lost and the effects of the first stage.
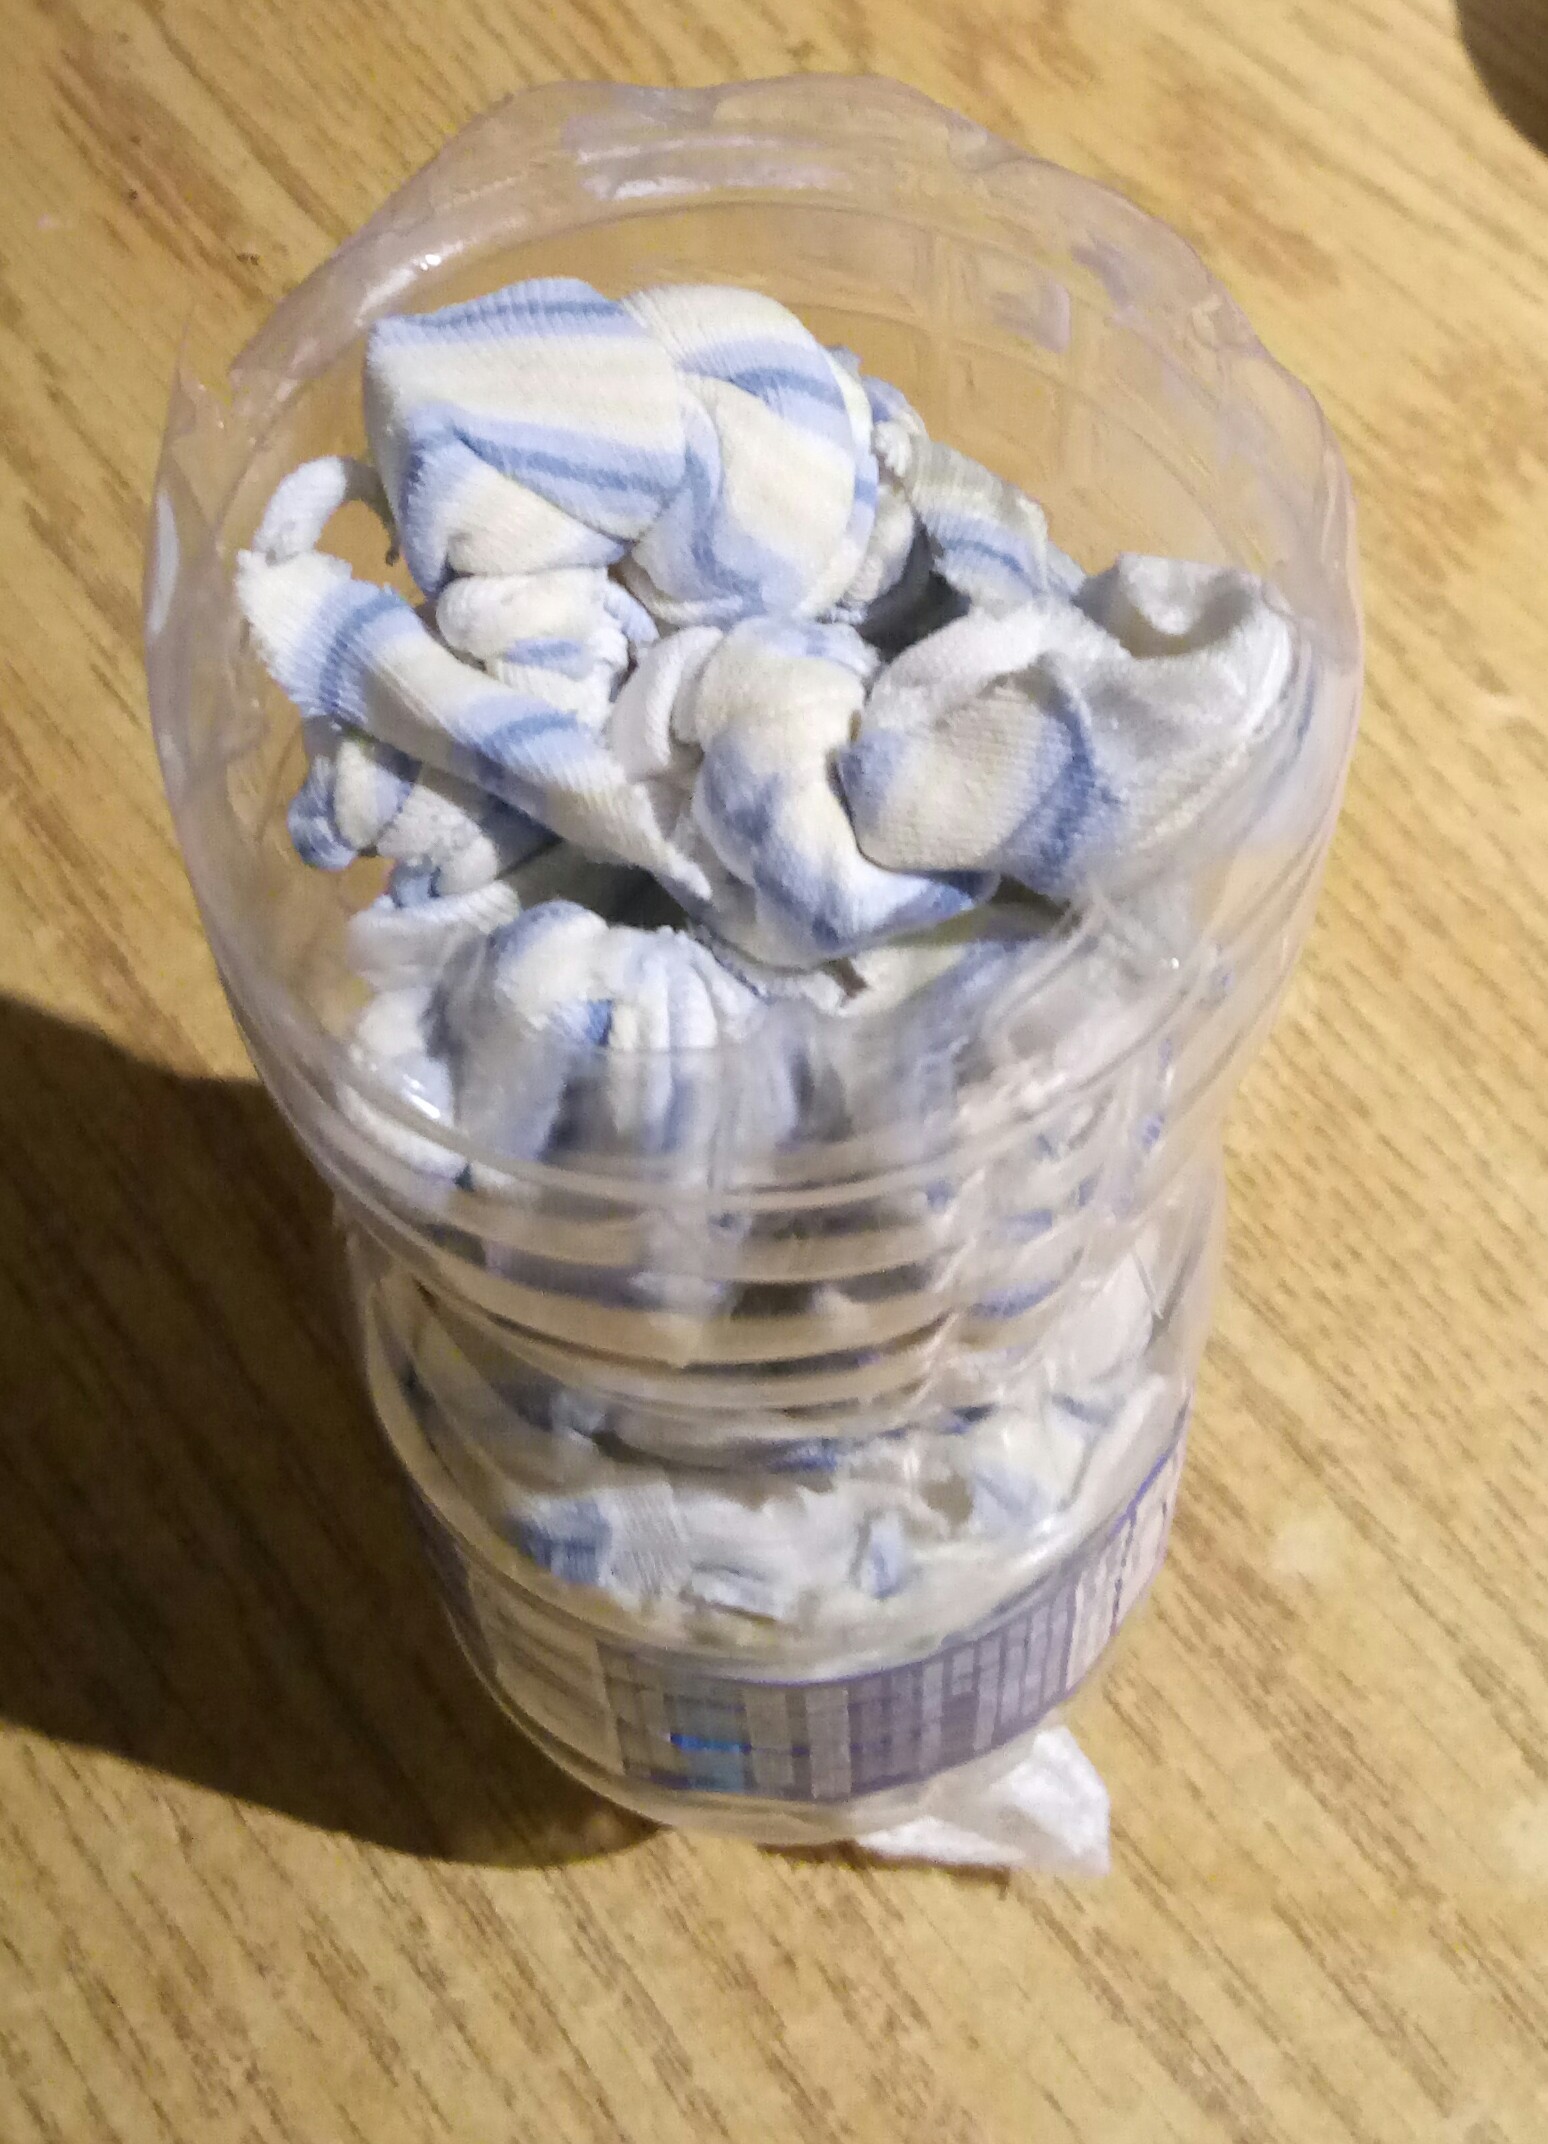
3. The water was transferred to the distillation setup. It was then distilled, with the process being timed.
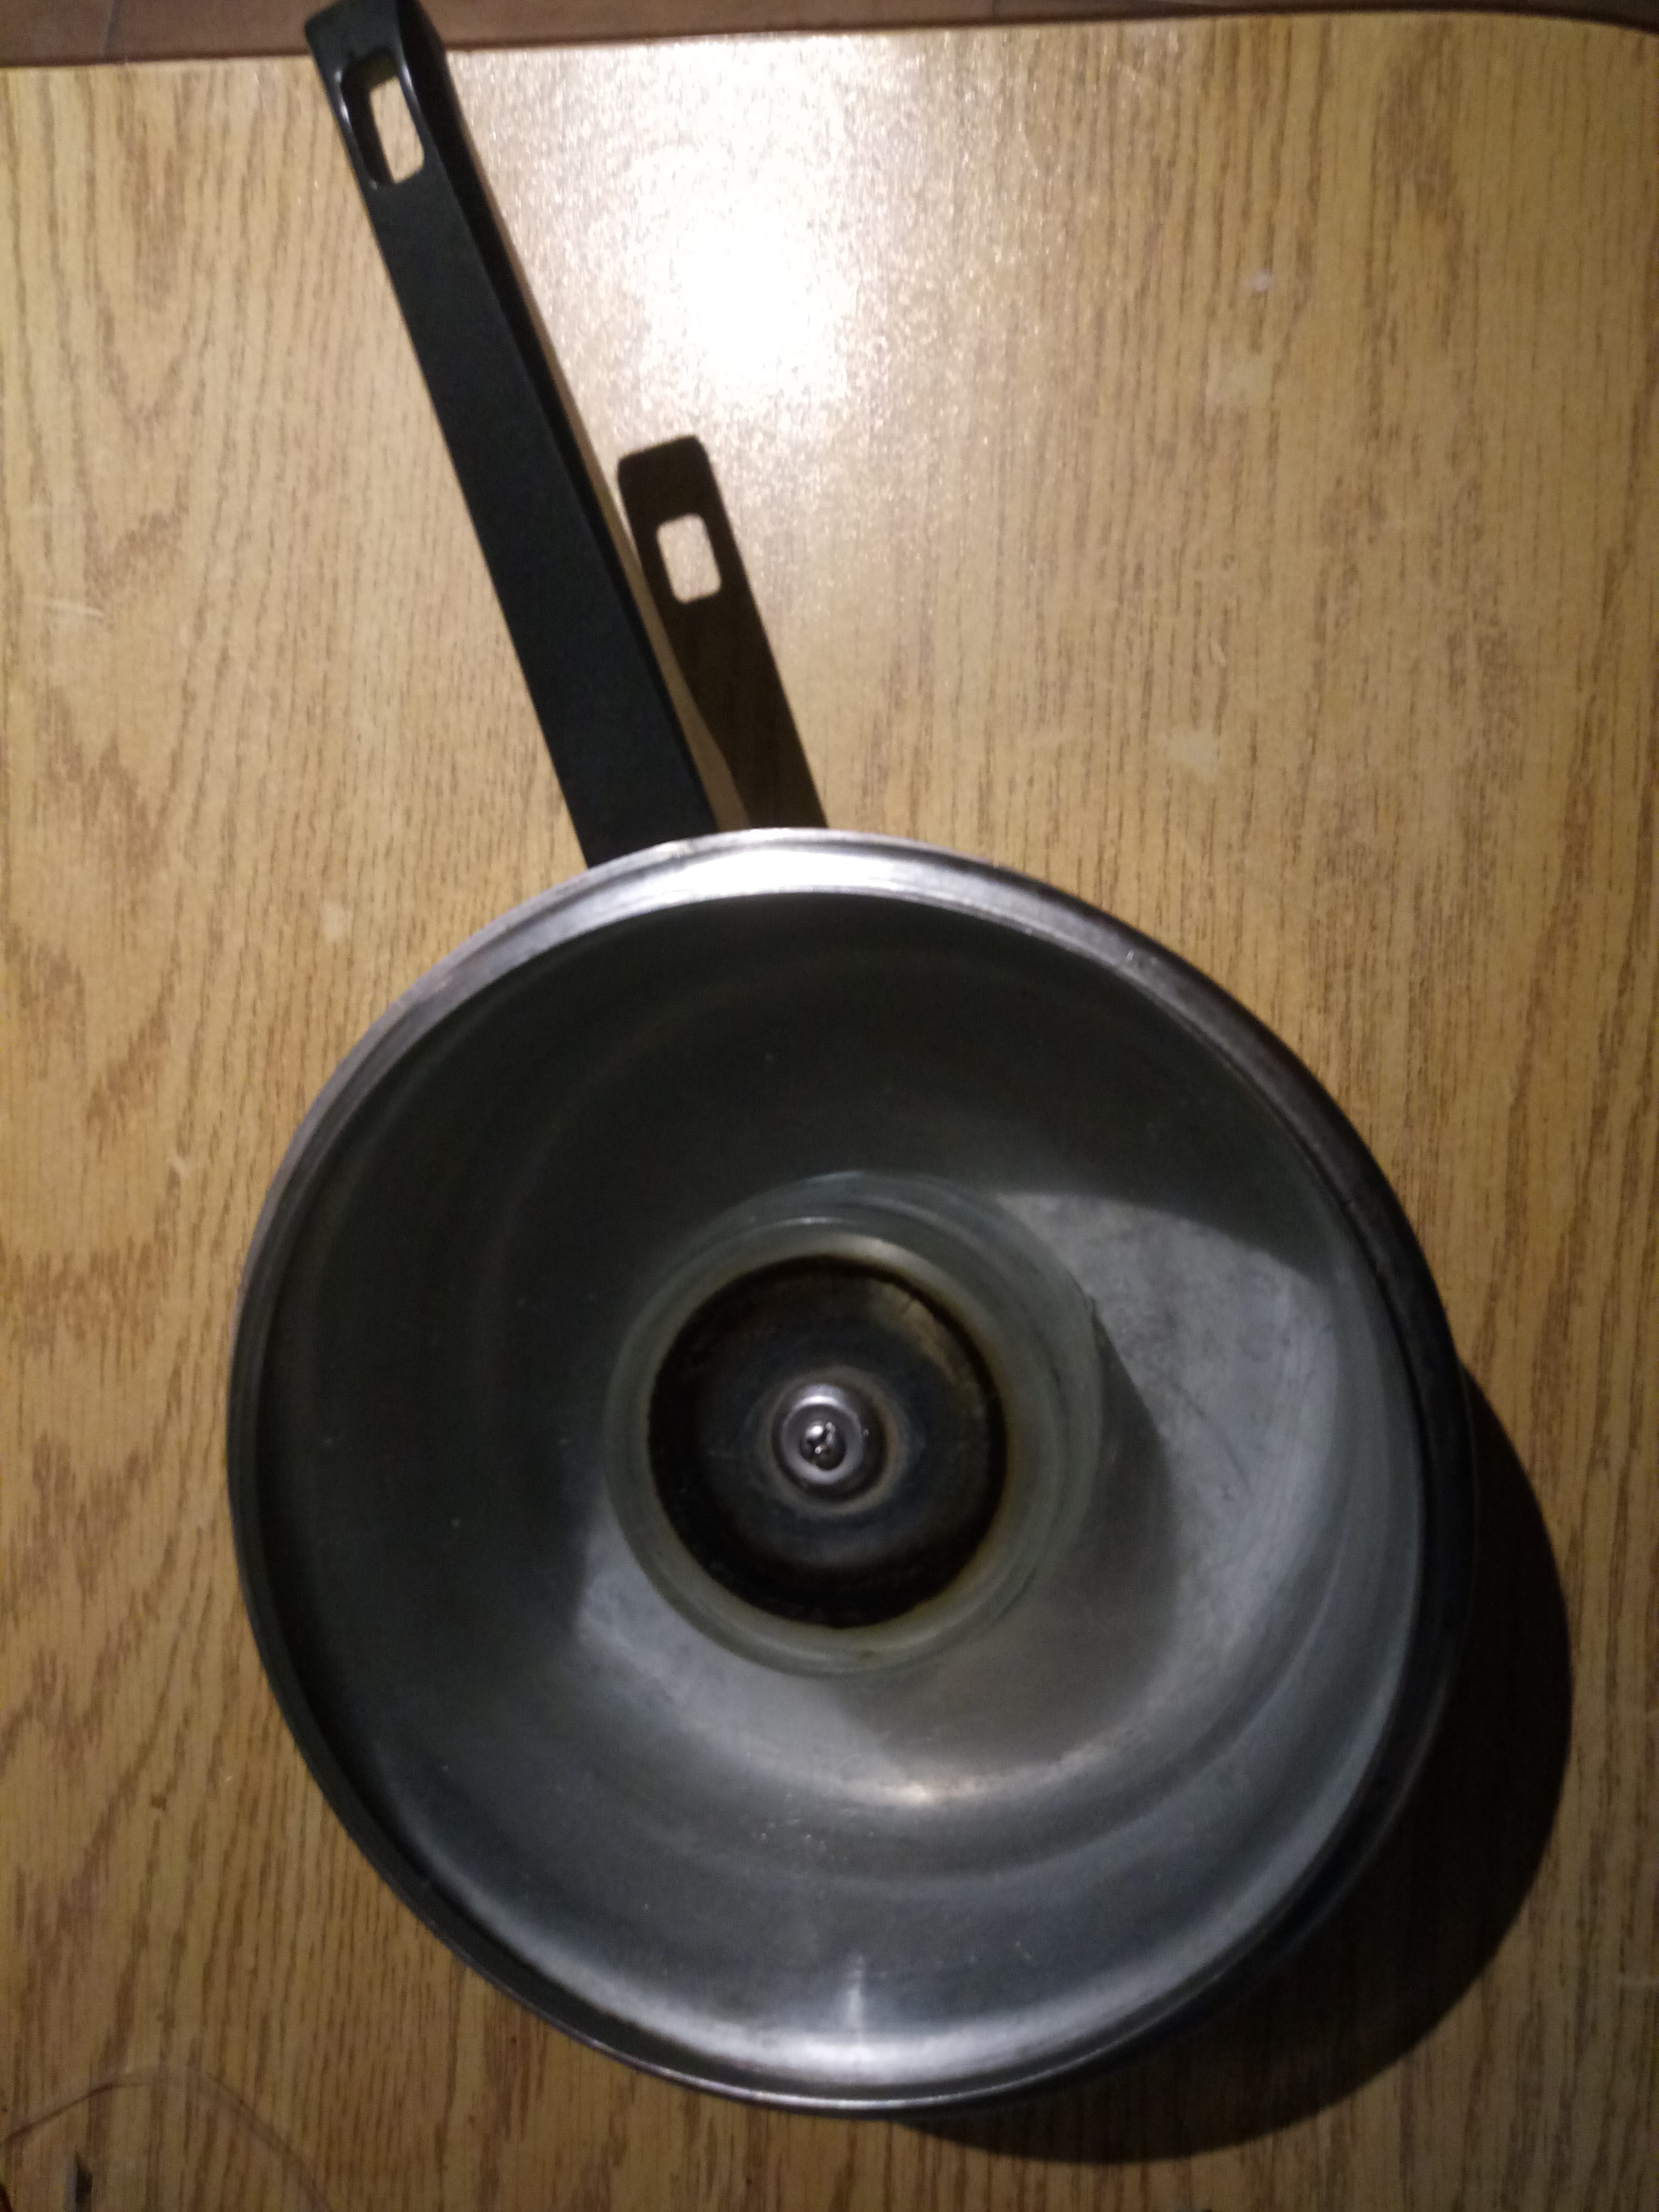
4. The distilled water's final quality and volume were measured.
5. All data was transferred to a spreadsheet. The filter was cleaned thoroughly afterwards to ensure that it will not affect the outcome of the next round.
Analysis
The quality of the water was tested using water testing strips, incorporating 16 factors. The time it took for the water to be purified was measured, as well as the final volume. Finally, the data was graphed using Google Sheets and analyzed. After the analyzation, a simple neural network (an example of machine learning) was created to predict the filter's effectiveness on other common pollutants, due to the experimenter not having access to them (being dangerous, expensive, etc.). This predicted data was also analyzed and graphed, being kept separate from the real-life data.
The raw data sheet (handy graphs further down):
| Units are in mg/L | Fluoride | Mercury | Copper | Lead | Chromium / Cr(VI) | Iron | Nitrite | Nitrate | Bromine | Free Chlorine | Total Chlorine | Hardness | Carbonate | Cyanuric Acid | pH | Total Alkalinity | Time Taken (Minutes) | Amount (mL) |
| CONTROL | 0 | 0 | 0 | 0 | 0 | 0 | 0 | 0 | 0 | 0 | 0 | 250 | 40 | 0 | 6.8 | 80 | N/A | N/A |
| S1 ('Clean' Snow) | 0 | 0 | 2.5 | 5 | 1 | 0 | 0.5 | 10 | 0 | 0 | 0 | 425 | 0 | 0 | 6.2 | 0 | N/A | 500 |
| S1 (Post-Filter) | 0 | 0 | 0 | 0 | 0 | 0 | 0.5 | 5 | 0 | 0 | 0 | 250 | 40 | 0 | 6.2 | 80 | 4.78 | 483 |
| S1 (Treated) | 0 | 0 | 0 | 0 | 0 | 0 | 0 | 0.5 | 0 | 0 | 0 | 100 | 40 | 0 | 7.2 | 80 | 15.55 | 430 |
| S2 ('Dirty' Snow) | 0 | 0 | 2.5 | 20 | 2 | 0 | 0.5 | 0 | 0 | 0 | 0 | 0 | 0 | 0 | 6.2 | 0 | N/A | 500 |
| S2 (Post-Filter) | 0 | 0 | 0 | 0 | 0 | 0 | 0 | 0 | 0 | 0 | 0 | 100 | 0 | 0 | 6.2 | 40 | 5.18 | 462 |
| S2 (Treated) | 0 | 0 | 0 | 0 | 0 | 0 | 0 | 0 | 0 | 0 | 0 | 50 | 0 | 0 | 6.8 | 40 | 15 | 427 |
| S3 (Fertilizer) | 0 | 0 | 5 | 0 | 0 | 0 | 10 | 500 | 0 | 0 | 0 | 100 | 0 | 40 | 6.2 | 40 | N/A | 500 |
| S3 (Post-Filter) | 0 | 0 | 0 | 0 | 0 | 0 | 10 | 500 | 0 | 0 | 0 | 100 | 0 | 40 | 6.2 | 40 | 4.93 | 496 |
| S3 (Treated) | 0 | 0 | 0 | 0 | 0 | 0 | 0 | 10 | 0 | 0 | 0 | 250 | 0 | 0 | 6.2 | 0 | 17.36 | 480 |
| S4 (Disinfectants) | 0 | 0 | 0 | 0 | 0 | 0 | 0 | 0 | 0 | 0 | 0 | 250 | 0 | 40 | 6.8 | 180 | N/A | 500 |
| S4 (Post-Filter) | 0 | 0 | 0 | 0 | 0 | 0 | 0 | 0 | 0 | 0 | 0 | 200 | 0 | 0 | 6.8 | 150 | 3.5 | 476 |
| S4 (Treated) | 0 | 0 | 0 | 0 | 0 | 0 | 0 | 0 | 0 | 0 | 0 | 100 | 80 | 0 | 7.2 | 80 | 14.53 | 413 |
| S5 (Fluoride) | 10 | 0 | 0 | 0 | 0 | 0 | 0 | 0 | 0 | 0 | 0 | 100 | 40 | 40 | 7.6 | 80 | N/A | 500 |
| S5 (Post-Filter) | 7 | 0 | 0 | 0 | 0 | 0 | 0 | 0 | 0 | 0 | 0 | 250 | 40 | 40 | 7.6 | 40 | 5.45 | 481 |
| S5 (Treated) | 0 | 0 | 0 | 0 | 0 | 0 | 0 | 0 | 0 | 0 | 0 | 100 | 40 | 40 | 7.2 | 40 | 16.4 | 446 |
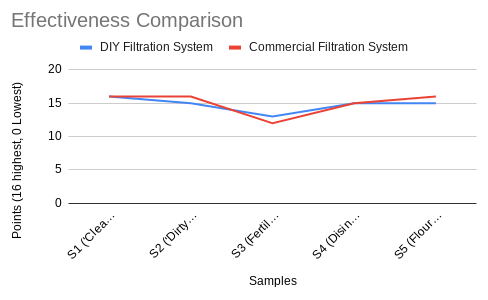
This data was analyzed and compared to the results of a commercially available water filter (shown below).
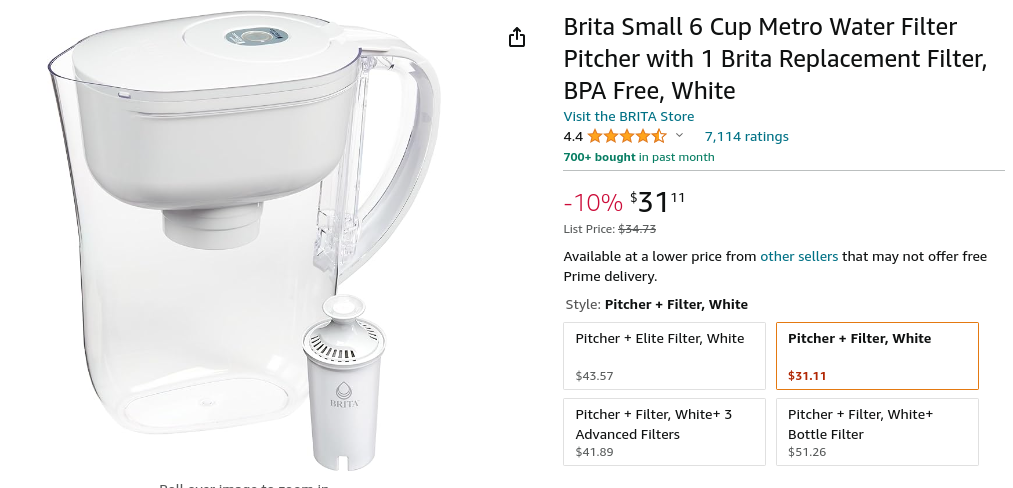
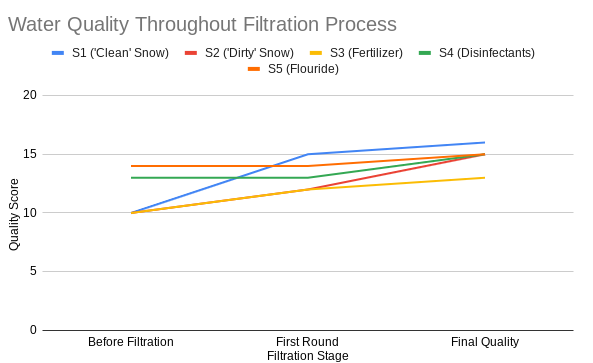
The quality score was calculated through how many of the 16 factors were in a safe drinking range, with 0 being the lowest possible and 16 being the highest. This is also the reason why the scores for the unfiltered samples (in the fourth graph) seem so high. The final purity of the water from the DIY filter was comparable to that of the commercial filter, with an average deviation of only 0.8 quality points.
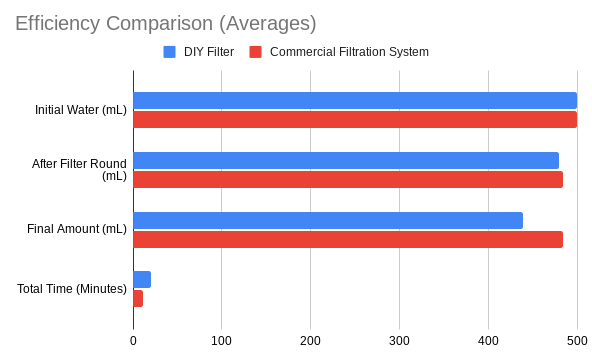
While the effectiveness was similar, there was a definite gap between the efficiency (amount of water lost in the filtration process, filtration time) between the two filters, with the commercial one being more efficient at both. However, this was expected as the filtration process for the DIY filter was in two stages and involved distillation, thus taking longer and leading to more water loss from the steam during the boiling process. On average, the time the DIY filter took to finish its purification cycle was 20.54 minutes (about 20 min 32 secs).
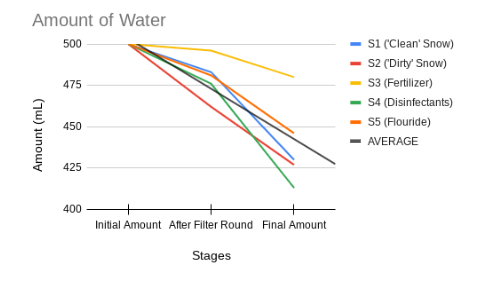
Here is a graph showing the amount of water left at the end of every stage for the DIY filter. Notice how most of the water is usually lost during the distillation process, compared to the physical filter stage.
Finally, a graph showing the quality scores of the samples throughout the filtration process. You can see how some of the scores don't change very much during certain phases, because of the type of pollutant. This is why there are two stages, as some pollutants cannot be fully taken out by simply running them through a filter (fertilizers, chemicals), and some large pollutants cannot be removed through distillation (large organics, etc.).
The filtration system was least effective at filtering solid compounds that were not easily removed after the first stage. However, when met with liquid compounds, it did quite well, much better than the solid ones, with the average quality score being approximately 1/3 of a point higher and the average time being shorter by nearly a minute. However, the samples with more solids retained more liquid, with a volume difference of 16.17 mL. On average, the final quality of the water was 14.8 points, while the average time taken was 20.536 minutes (approx 20 min 32 secs). The average amount of the water remaining was 439.2 mL.
Predicting Other Pollutants
As mentioned before, the experimenter did not have access to certain pollutants, but still wanted to test the DIY filter's efficiency on them. To do this, a neural network was created that was trained on the data of the real-life samples. This neural network was coded in Google Colab, utilizing numpy, matplotlib, and pytorch. Three major pollutants were chosen to have their results predicted: lead, chlorine, and industrial-grade oil. The main sources used for the training of the neural network to predict these (in order) were the fertilizer, disinfection chemical, and 'dirty snow' samples. The fluoride sample was set aside to be used in the testing phase.
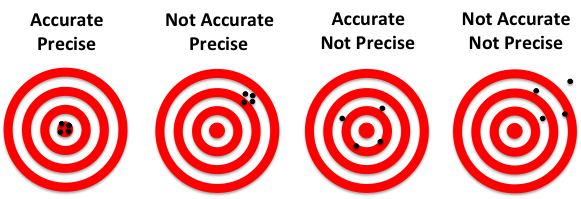
The most important part in the creation of the neural network, of course, was its accuracy and precision. The accuracy of a neural network is, well, essentially how accurate and correct the predictions are. The precision of a neural network is how similar its predictions are.
To calculate the accuracy of a neural network, we use four factors that the network outputs: the number of True Positives, False Positives, False Negatives, and True Negatives. In this project, the positives were the existing pollutant factors, while the negatives were the factors that were already in a drinkable range from the start. These four aspects were visually represented in a Confusion Matrix.
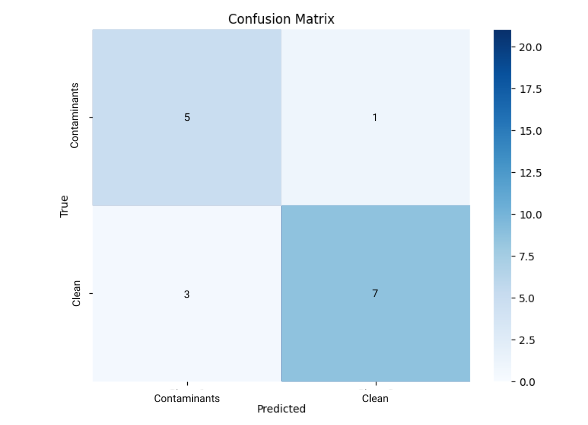
In machine learning, the accuracy formula is
TP + TN
-------------------------------------------
TP + FP + FN + TN
While the precision formula is
TP
----------------------------
TP + FP
So, in this network, the accuracy was (5 + 7) / 16, or 75%. The precision was 5 / (5 + 1), or 83.3%.
How was this tested? Well, as mentioned before, the fluoride sample was put aside to be used as the test, so its initial data could be entered and the predicted output compared to the real-life output.
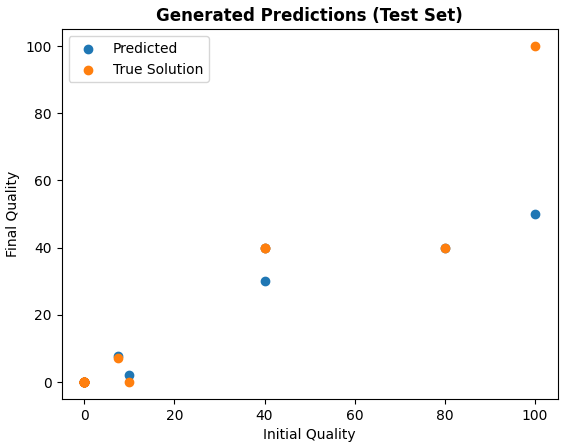
Finally, here are some graphs regarding the factors and data that the network predicted.
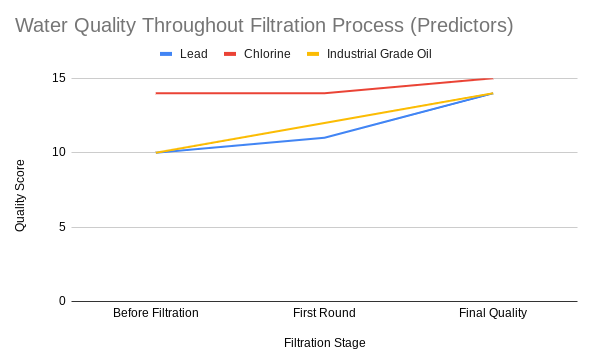
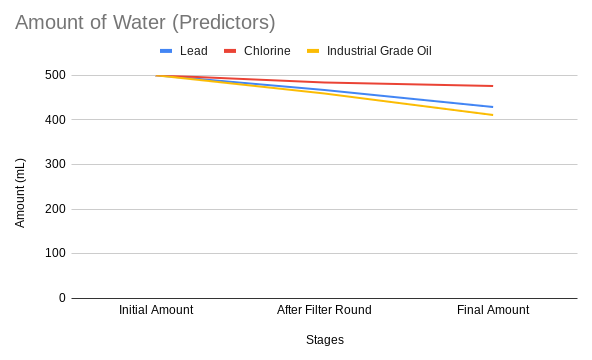
The average quality of the water was lower than with the real-life samples, being 14.3 points. The amount of water left was also lower, though just barely, at 438.67 mL. Finally, the average time taken was about 24.819 minutes (approx 24 min 49 secs).
Conclusion
Overall, this filter could be an effective, accessible option to those in disadvantaged areas with poor water quality, facing significant financial strain. It can be fully put together in about thirty minutes, and only mainly uses items usually considered waste that can be easily found in landfills. The other non-landfill specific items can be substituted for similar materials still begotten from the consumption of waste, such as creating biochar from food waste as a substitute for activated charcoal. This DIY filter is comparable to commercially available water filters, with near-equal output quality. Though the purification process does take longer, the price of the DIY filter is drastically lower. This filter also provides a use for common waste materials by recycling them into its design, which, if it were mass-produced, could have a significant impact on the waste problems of affected countries. With the aid of AI in our coming world and a little time, sustainable, effective solutions can be found to help others in underprivileged environments.
Possible sources of error for this project include the limited sample size and shortcomings for some data, as well as the experimenter not having access to more sophisticated methods to test water quality. As mentioned, the neural network was not 100% accurate, which may have led to some issues with the newly predicted data. While the research put into this project was reviewed for reliability, there is always the possibility of imprecise metrics and data. Finally, there were some flaws in the experimental process, which could be improved the next time this is done.
To expand this project, more real-world samples could have been collected to be tested on the filter, resulting in more data. This data could be applied to the neural network to create more accurate predictions. More data could also have been collected regarding the distillation system with an absence of metal materials, where the containers had to instead be substituted with plastic that was certainly meltable. A more thorough analysis of the final product, including bacteria levels and potentially microplastic ratings, would have definitely been helpful in determining true drinkability levels. On that note, the DIY filter could be modified to purify a wider range of pollutants effectively, as well as making modifications to increase its current efficiency (mainly losing less water in the distillation stage) and effectiveness.
Citations
Water Crisis
Indigenous Water Crisis
Yenilmez, S. (2022, July 26). Indigenous Safe Drinking Water Crisis in Canada- overview — The Indigenous Foundation. The Indigenous Foundation. https://www.theindigenousfoundation.org/articles/indigenous-safe-drinking-water-crisis-in-canada-overview#:~:text=Description%20of%20Issue&text=Despite%20that%2C%20618%20First%20Nations,the%20inadequate%20water%20they%20have
Yenilmez, S. (2022a, July 26). Causes of unsafe drinking water on Indigenous reserves — The Indigenous Foundation. The Indigenous Foundation. https://www.theindigenousfoundation.org/articles/causes-of-unsafe-drinking-water-on-indigenous-reserves
Carina Xue Luo, University of Windsor. (2022, July 26). The water crisis in Canada’s First Nations communities. ArcGIS StoryMaps. https://storymaps.arcgis.com/stories/52a5610cca604175b8fb35bccf165f96
Worldwide Water Crisis
The Water Crisis: Shortage, problems & solutions | Water.org. (n.d.). Water.org. https://water.org/our-impact/water-crisis/
World Health Organization: WHO. (2023, September 13). Drinking-water. https://www.who.int/news-room/fact-sheets/detail/drinking-water#:~:text=In%202022%2C%20globally%2C%20at%20least,risk%20to%20drinking%2Dwater%20safety.
Water pollution | UN World Water Development Report 2022. (2023, October 16). https://www.unesco.org/reports/wwdr/2022/en/tags/water-pollution
Pollutants
Nathanson, J. A. (2024, February 10). Water pollution | Definition, Causes, Effects, Solutions, Examples, Types, & Facts. Encyclopedia Britannica. https://www.britannica.com/science/water-pollution
Singh, S. (2024). Water pollution in rural areas: Primary sources and associated health issues. In Elsevier eBooks (pp. 29–44). https://doi.org/10.1016/b978-0-443-18778-0.00011-8
Common Waste Items
Today, D. C. U. (2018, June 27). Top 10 trash items found littering our beaches and waterways — and the weirdest. USA TODAY. https://www.usatoday.com/story/news/nation-now/2018/06/27/ocean-beach-pollution-plastic-trash/738173002/
AreyouR. (2020, October 9). Cleaning and decontamination of plastic waste. Areyour. https://www.areyour.org/en/2020/10/09/cleaning-and-decontamination-of-plastic-waste/
Filltration Methods
Pomelo. (2022, November 7). Water Purification Methods | Atlas Scientific. Atlas Scientific. https://atlas-scientific.com/blog/water-purification-methods/
Study Session 5 Water Treatment Technologies for Large-scale Water Supply: View as single page | OLCreate. (n.d.). https://www.open.edu/openlearncreate/mod/oucontent/view.php?id=80015&printable=1
Boiled Water vs. Filtered Water. (n.d.). aquasana.com. https://www.aquasana.com/info/boiled-water-vs-filtered-water-pd.html#:~:text=Boiling%20water%20can%20only%20remove,dangerous%20than%20if%20left%20alone.
What is a reverse osmosis system and how does it work? (n.d.). Fresh Water Systems. https://www.freshwatersystems.com/blogs/blog/what-is-reverse-osmosis
Water Standards
Health Canada. (2023, December 1). Guidelines for Canadian Drinking Water Quality - Summary Tables. Canada.ca. https://www.canada.ca/en/health-canada/services/environmental-workplace-health/reports-publications/water-quality/guidelines-canadian-drinking-water-quality-summary-table.html
Drinking-water quality guidelines. (n.d.). https://www.who.int/teams/environment-climate-change-and-health/water-sanitation-and-health/water-safety-and-quality/drinking-water-quality-guidelines
Python
Squash: On demand test environments for web apps and microservices. (2023, November 28). How to Work with CSV Files in Python: An Advanced Guide. Squash: On Demand Test Environments for Web Apps and Microservices. | on Demand Test Environments for Web Apps and Microservices. Save Time and Iterate Faster With Disposable Virtual Machines for Each Branch of Code. https://www.squash.io/processing-csv-files-in-python/#:~:text=Optimizing%20CSV%20Processing%20Performance%20with%20Parallelization,-To%20improve%20the&text=module%20in%20Python%20provides%20tools,them%20simultaneously%20using%20multiple%20processes.&text=%23%20Example%3A%20perform%20calculations%2C%20extract%20data%2C%20etc
Schouwenaars, F. (2023, May 18). How to Analyze data in Google Sheets with Python: A Step-By-Step Guide. https://www.datacamp.com/tutorial/how-to-analyze-data-in-google-sheets-with-python-a-step-by-step-guide
Acknowledgement
This project could not have been achieved without the support of my parents and friends, who generously looked over my project and gave me tips and moral support. Special points to my parents for procuring me materials and helping with the presentation aspects. Finally, I would also like to thank my school science fair coordinator for setting up our science fair and giving me this opportunity.

