
Detecting Exoplanets Using AI
Gayatri Sakharkar
Grade 7
Presentation
Hypothesis
If AI is used to aid in exoplanet discovery, then the efficiency and accuracy of detecting exoplanets will be improved because AI is extremely effective at identifying patterns. This is important because transit photometry, which is represented on scatter plots, has been proven to be the most successful method to discover exoplanets as about 75% of all planets were identified using this method. Instead of manually detecting dips in these scatter plots using statistical methods like fourier analysis, chi-squared tests and periodicity analysis, AI can automate the task and make it much simpler, resulting in rapid exoplanet discovery and ultimately improve the likeness of finding life outside of Earth.
Research
Research:
What are exoplanets?
An exoplanet is a planet that orbits a star outside of the solar system. Some exoplanets, known as rogue planets, do not even orbit stars. Instead, they orbit the galactic centre. We know from the Kepler space telescope that there are more exoplanets than stars in the Milky Way Galaxy.
What are some exoplanet discovery methods?
- Radial velocity
Radial velocity is also known as “wobble” this is because sometimes a star will have small movements which make it look like the star is wobbling. This happens because when a planet orbits a star, the gravity of the planet affects the star and makes it move in its own small orbit. This can be observed and help astronomers discover planets beyond the solar system.
This method can also be used to identify the mass of the planet or the mass of the planets and how many planets there are because the more there is pulling on the star, the more “wobble” there will be.
The way astronomers are able to observe the wobble of the stars is by the method, Doppler shift. All forms of energy move in waves. The waves change based on how the object producing them moves. For example when you get closer to something that is making sound, it is louder but as you get further away it gets quieter. When sound waves are stretched out it's lower in pitch. Just like that when light waves stretch out it makes the object look more red.

As the star wobbles around, the light waves change colours and the length of the waves also change which help astronomers find the planet.
- Transit photometry
What is a Transit?
The majority of the exoplanets discovered were discovered through the transit photometry method. A transit happens when a planet blocks light from the star to the observer, this dims the light very slightly to the observer. When the brightness of the star from the observer’s perspective is recorded on a scatter plot, dips can be observed easily.
For example:
Transits are not only useful for discovering the exoplanets, but they can tell us a lot about the planet itself. The size of the planet’s orbit can be determined by how long it takes for it to orbit its star while the size of the exoplanet can be determined by how much it reduces its star’s brightness. It is also possible to learn about the planet’s atmosphere by using this method. When the planet is in front of a star, if it has an atmosphere, some light will go through it. This light can later be analysed to figure out the various elements that make up the atmosphere of the planet. Some space telescopes that have and are collecting data from various stars include Kepler and the Transiting Exoplanet Survey Satellite (also known as TESS).
- Direct Imaging
Direct imaging as the name suggests, is a method which involves taking a picture of the planet directly. Due to exoplanets being located extremely far away from Earth, it is difficult to discover anything with this method.
One of the main problems with this method is that any light or heat reflected off of the planet is usually drowned out by the planet’s host star which makes it difficult to take a picture of it. One solution to this problem are shine blockers. Shine blockers share the same principle as wearing sunglasses, or blocking the sun with your hand to see things which would otherwise not be visible.
Astronomers use two main methods to block light from a star. The first one is called coronagraphy. It uses a device that blocks light from the star before it can reach the telescope's detectors. The second method uses a starshade device. This method blocks light from a star before it even enters the telescope itself.
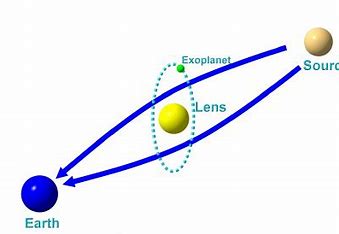
- Gravitational Microlensing
When a huge object, such as a star or planet, affects light, it distorts and changes direction. This is how Albert Einstein redefined gravity as a geometric characteristic of spacetime. This means when a star emits light the effect of gravity changes the direction of light when affected by something by the gravity of a massive object.
For example, when a celestial object passes in front of another object, it appears to look bright. What is happening here is that the object in front bends and magnifies the star further away which makes the further away object look brighter for a short period of time.
If a star passes in front of another star. From our perspective the star further away will look brighter and if the closer star is accompanied by a planet, it will cause the brightness of the star to increase a second time. This helps us figure out if a star has a planet that is travelling with it.
- Astrometry
Astrometry, like radial velocity, also observes stars’ “wobble”. But here, astronomers do not use the Doppler Shift and instead astronomers are able to see the stars' apparent position in the sky changing. This method is extremely hard to do and only 3 planets have ever been discovered using it.
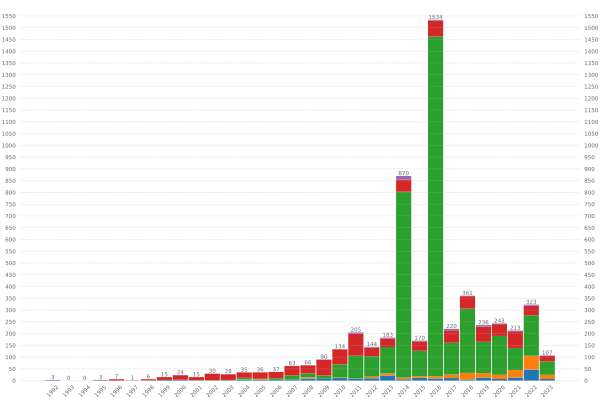
Overall, the exoplanet discovering method that has had the most success is the transit photometry method. Here is a graph representing this:

10/12/23
What is the transiting exoplanet survey satellite (TESS)?
The transiting exoplanet survey satellite also known as TESS discovers exoplanets beyond our solar system. It started as a two year mission which was supposed to end on July 4 2020. But it is continuing to discover even more exoplanets as an extended mission. During its original two year mission, it surveyed about 75%. Tess found 66 new exoplanets and 2 100 more candidates that still need to be confirmed.
What is Python and how does it work?
Python is a computer programming language and it is used for a lot of things like building websites, automating tasks, and conducting data analysis. Python is said to be beginner-friendly and easy to learn, making it one of the most used programming languages today. Like most programming languages python uses an input and output. The input in any programming language allows you to interact with the user and the output displays data.
What are scatter plots?
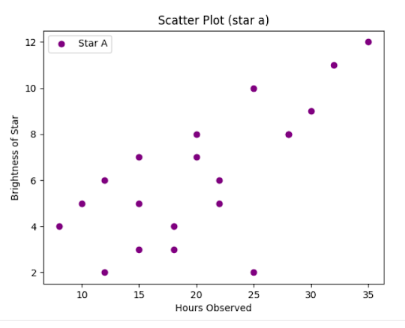
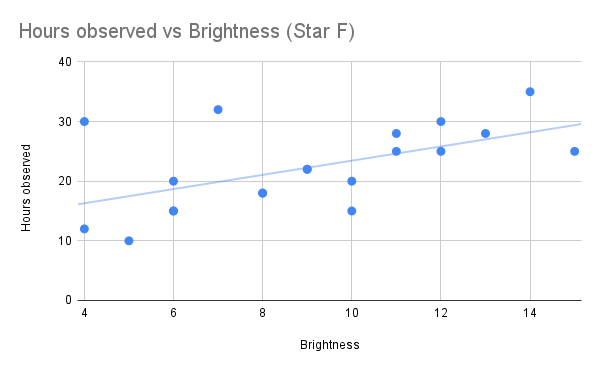
Also known as scatter charts or scatter graphs, scatterplots are graphs that use dots to represent two different quantities. The position of a dot indicates the value of a specific data point. Scatter plots are also used to observe relationships between variables.
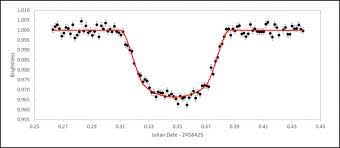
For example, in the above scatter plot, the x-axis represents time and y represents the star's brightness. The scatter plot shows the stars' brightness in relation to time.
One common problem when using scatter plots is overplotting. This happens when two or more data points share the same value. A solution to this problem is reducing the number of data points.
What is training data?
Training data is also known as a training data set. It is the initial data that is used to train machine learning models. The purpose of training data is to teach machine learning algorithms to perform a desired task or make predictions.
What is deep learning?
Deep learning is in charge of the various activities we do in our daily lives. It can, for example, translate something into another language in seconds or locate cancer cells in someone's body. Deep learning is a branch of machine learning, which is itself a branch of artificial intelligence. An artificial neural network, which is inspired by the structure of the human brain, is used in deep learning. The difference between deep learning and machine learning is that instead of being given data on how to identify something, the AI determines how to distinguish between things on its own. Neurons are responsible for information processing. Neural networks are divided into layers. The data is sent through the first layer, referred to as the input layer.
What is artificial intelligence?
Artificial intelligence can be described as a branch of computer science that involves simulating the human brain. It is implemented in tasks that require human intelligence. A few of the main functions of artificial intelligence include, problem solving, reasoning, learning, and quick decision making.
At its core, Artificial intelligence is only algorithms with a set of rules. AI systems also have the ability to learn from the repetition of tasks. This is how machine learning gets better at doing specific tasks without external interference.
What is the point of finding life outside of Earth?
The main point of discovering exoplanets is to find life outside of Earth. But, what is the point of discovering this life? By figuring out if humans are alone in the universe it is possible to figure out our place in the universe. It has the possibility to show us where we came from, how life began and where we might look to head in the future.
NASA’s exoplanet program’s aim is to find life in exoplanets. The main point of doing this is to ultimately find a planet with a habitable environment. This includes a small, rocky planet with oceans, clouds and an atmosphere that can possibly host life and answer the big question of: are we alone?
The search for life outside of Earth has been fascinating scientists for many years. Due to the field of exoplanet discovery it may finally be possible to potentially completely change the way humans live and view the universe,
What is a Supervised AI algorithm?
A supervised AI algorithm is a type of machine learning algorithm. It used data sets that are labelled to predict and classify outcomes.
Supervised learning is trained with data that already has been labelled with correct data. The algorithm then used this information to predict the correct output for new data.
For example there may be data sets of images of different fruits. One data set may be representing banna’s, the other representing oranges. The artificial intelligence or machine learning algorithm then uses this already labelled data to predict if new pictures of fruit are oranges or bananas.
Supervised learning has become a popular approach to train machine learning models because of its ability to handle a variety of problems. This includes natural language processing, image classification and speech recognition.
What is a labelled data set?
A labelled data set is essentially where all the data points are labelled. This is done to provide context and/or meaning. This is especially useful for Artificial intelligence and Machine learning because these labels help the algorithm to make predictions, analyse data and make classifications.
An example of this may be a dataset of emails where there is “spam” as one data set and “not spam” as another data set.
Labelled data sets provide the basis for supervised learning which is one approach to train machine learning models. Through utilisation of labelled data, machine learning is easily able to find patterns in inputs and outputs. This is important in systems such as voice recognition.
However, the down side of labelling data is the fact that it can be a time consuming and resource-intensive process. This is especially true for complex images. Incorrectly labelling data sets can also impact the accuracy of machine learning models.
In summary, labelled data sets are just data that is put into categories that can help machine learning algorithms make better predictions, analysis and classifications.
What is regression?
regression is a statistical process. It is used to estimate the relationship between a dependent variable and at least one independent variable. The most common form of this is linear regression. This is when one finds the line of best fit on a scatter plot. The average line is created using mathematics.
Regression is often used in machine learning to predict values of dependent variables using independent variables.
What is linear regression?
Linear regression is a mathematical tool used to understand how two things are connected. Linear regression is like drawing a straight line through a bunch of points on a graph. This line helps to see the average trend or pattern in the data. For example, if one was looking at how the amount of study time relates to test scores, linear regression helps to find the line that best shows that connection. Linear regression is a way to make predictions based on the information that is given.
How is star brightness measured?
Astronomers use many different methods in order to measure star brightness. Firstly is the magnitude scale where the lower the number used to represent the value, the higher the brightness of the star. Secondly luminosity is used. The amount of energy (light) emitted from the star’s surface is known as luminosity. Astronomers use the electromagnetic spectrum to measure the brightness in a quantity. Another method used to measure brightness is photometry, the process of measuring apparent brightness of a star. As the name suggests, photometry is used in transit photometry.
What is photometry?
Photometry is the science of measuring the brightness of various light sources using a photometer. Photometry is based upon how the human eye perceives light. Photometric measurements quantify the brightness. On the electromagnetic spectrum, photometry mostly deals with “visible light.”
In photometry different quantities are used to measure how humans perceive light. Luminous flux is the total amount of light emitted by a certain object. Luminous intensity is the amount of visible light measured in a specific direction. illuminance is the amount of light on the surface of the object. Finally luminance is the amount of visible light on the surface of the object as perceived by the observer.
In summary, photometry is the measurement of brightness based upon the human eye.
In transit photometry, what unit is the brightness of the star measured in?
Transit photometry is measured in relative flux.
12/13/2023 - 01/18/24
What are some traditional methods for discovering exoplanets?
There are many different ways people look for exoplanets. Radial Velocity is one example. This method involves looking for small observable movements in stars caused by gravity of the exoplanet orbiting it. Another method is known as transit photometry. In this method, the brightness of stars is observed and put in scatterplots, scientists then try to observe dips in brightness caused by the planet orbiting it. Direct imaging is another method. Direct imaging involves, as the name suggests, taking pictures of the planet directly.
Transit photometry is the best method for finding exoplanets. This is because 4146 have been discovered with the method. This is about 75% of all exoplanets discovered. The transit method can also be compared to other methods to understand how much this method has dominated exoplanet discovery. For example, when compared to radial velocity which has helped discover 1071 exoplanets and is the second most used method for exoplanet discovery only contributes to 19% of all known exoplanets. Here are some graphs showing this information:
Transit photometry in comparison to the radial velocity method:
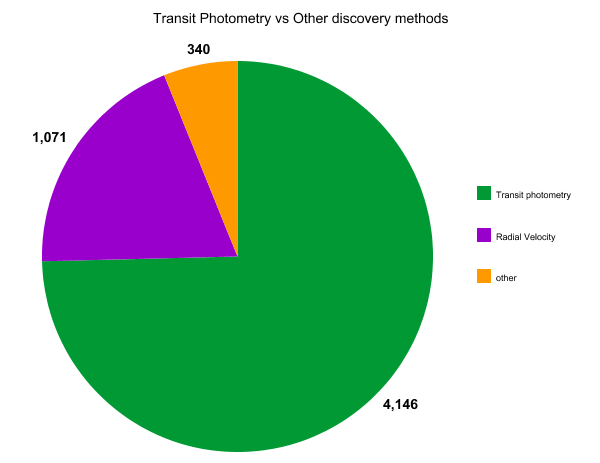
Transit photometry in comparison to all other methods:
For these reasons, transit photometry will be the main focus of this project.
12/14/23
For transit photometry, there are many traditional methods for exoplanet discovery. Most of these methods involve statistical analysis. For example, Periodicity analysis. Astronomers use this method to detect patterns in data. For example, if a scatterplot shows the brightness of a star, instead of looking solely at how the brightness changes, scientists also look for patterns in the data that repeat.
The brightness of stars does not always stay the same. Instead, it goes through a cycle of getting dimmer and brighter. This cycle happens predictably. Scientists commonly use mathematics to figure out these patterns. For example, Fourier analysis. This is a mathematical technique used in Periodicity analysis. It breaks down complicated signals into simpler parts that repeat which helps scientists see regular patterns clearly.
Another way scientists use traditional methods to discover exoplanets is by using chi-squared tests. This helps scientists determine if observed patterns are real or just caused by random fluctuations in data.
In conclusion, using statistical methods to find exoplanets can be a great way to discover new planets. Though it is crucial to note that using these methods may be complicated and time consuming. This is why AI may be useful in making exoplanet discoveries more simple and efficient.
How is AI being used to discover exoplanets?
Traditional methods that involve statistical analysis can be amazing methods to discover exoplanets. One big problem with this however, is the complexity of data collected from light curves. Analysis takes a long time. Even up to years to discover a single planet.
AI is excellent at detecting patterns, therefore AI can be used to discover dips and predict future patterns in light curves as well. This can possibly be done much more efficiently and accurately than traditional methods.
Machine learning for example, has countless applications in exoplanet detection in transit photometry data. Firstly, it can recognise patterns in transit photometry data. These algorithms are able to learn patterns and identify dips in brightness caused by planets orbiting their host stars. This can greatly reduce the time and effort required to manually analyse data.
Machine learning can also be used for signal processing. Transit photometry data can be complicated. Machine learning models may be trained to differentiate between transit signals and other variability in the light curve. This can help scientists because the process of filtering random fluctuations greatly improves the accuracy of the detection of exoplanets.
Deep learning can also be used. Deep learning is a subunit of machine learning which is inspired by the human brain. It can be used to discover exoplanets because of its ability to automatically find exoplanets by looking at light curves. This can especially be useful for large-scale surveys like TESS (the transiting exoplanet survey satellite).
In conclusion, AI can be excellent at detecting exoplanets because of its ability to automatically identify dips in scatterplots. AI has the potential not only to reduce the time it takes to detect exoplanets but also to enhance the accuracy of the process.
Glossary:
Magnitude - Size or quantity
Linear regression - In statistics, linear regression is a model in which the linear relationship between points on a scatter plot is estimated. It is essentially drawing a straight line in a scatter plot.
Kepler space telescope - The Kepler space telescope was the fist mission launched by NASA to discover exoplanets.
Light - Light is electromagnetic radiation that the human eye can perceive.
Exoplanets - An exoplanet is a planet that is found outside the solar system.
Planet - A planet is a celestial body. It must orbit a star, have enough mass to force it into a spherical shape and have enough gravity to clear away any object in its orbit.
Stars - A star is a luminous ellipsoid of plasma held together by gravity.
Plasma - Plasma is a very hot gas. It has much more energy than the other states of matter which are solid, liquid and gas. Plasma is so hot that electrons are ripped away from atoms that form an ionised gas.
Ion - A particle that has gained or lost electrons.
Gravity - Gravity is a force that attracts objects with mass toward each other.
Luminous flux - Luminous flux is the measurement of the perceived power of light. Relative flux is the measured power of light perceived from a certain perspective.
Photometry - Photometry is the science of measuring star brightness.
Data - Data is information such as facts that can be used for analysis and reference.
Artificial intelligence - Artificial intelligence or AI is the ability for computer systems to complete tasks that would otherwise require human intelligence.
Variables
Controlled:
- The age group of participants will be kept the same (ages 35-45)
- The Scatter Plots used to test human participants and the program will be kept the same
- The same program will be used throughout the experiment
- The same programming language will be used (python)
- The same python version will be used
- Data that is recorded will be kept the same
- Data that is compared will be kept the same
- Amount of time given (unlimited) will be the same for each participant as well as the program
- The information given to the participants will be the same this includes what transit photometry is and what exoplanets are
- The criteria for what points are considered dips will be kept the same throughout the project
- Human participants will not be aware of what the scatter plots will look like
- All participants will be asked for feedback and all feedback will be taken into account when analysing data and concluding the project
- All participants will be given a writing utensil and a piece of paper with the scatter plots
- Participants will not be given extra tools like calculators during the experiment
- The order in which participants will receive and analyse the graph will be kept the same
Responding:
- Accuracy
- Amount of time it takes to complete testing
Manipulated:
- How scatterplots will be analysed (AI vs Humans)
Procedure
Materials:
- Printer
- Computer with interet access
- Printed “Star A” scaatterplot (x10)
- Printed “Star B” scaatterplot (x10)
- Printed “Star C” scaatterplot (x10)
- Printed “Star D” scaatterplot (x10)
- Printed “Star E” scaatterplot (x10)
- Printed “Star F” scaatterplot (x10)
- Pen
- Stopwatch
- Calculator
Procedure:
1.Review literature
- Gather information about how traditional methods are being used to discover exoplanets
- Gather information about how AI methods are being used to discover exoplanets
- Gather information that compares AI and traditional methods
- Understand various concepts related to the project including:
- Scatterplots
- Transit photometry
- Deep learning
- Supervised ML algorithms
- Data regression
2. Finding a program
- Choose an AI algorithm that can detect dips in scatterplots
- This program must Identify dips in scatterplots (which can possibly be an exoplanet) by using a line of perfect fit to find underlying amounts (the lowest part of the line of perfect fit will determine the maximum value to be considered a dip.
- Use program found in observations to replicate this experiment
3. Create 6 different scatter plots
- Generate random data points that represent star brightness data from ChatGPT (this will be the simulated star brightness data used in the experiments)
- Apply the algorithms on the scatterplots to identify the dips
- Record all observations including difficulties, and how many dips were identified correctly.
4. Run the experiment on human test subjects
- Explain to 10 different human test subjects’ what transit photometry is and how it works
- Explain to 10 different human test subjects’ what are scatter plots
- Test subjects manually detect dips in scatterplots (the same scatter plots will be used from step 2)
- Write down what test subject is being tested on on each graph
- Have each test subject analyse each of the six scatterplots
- Record all observations including difficulties in identifying dips, how many dips were identified correctly and how much time it had taken to analyse the scatter plot
5. Run the experiment on the program
- Copy and paste star brightness data in the respective area
- Run program
- Record how many dips were identified correctly and incorrectly
- Record how many dips were not identified
6. Analyse quantitative data
- Using the following formula determine overall accuracy of the test subject or algorithm: point that are actually dips divided by total points identified as dips by test subject or algorithm
- Repeat step 7.a for every graph analysed by human test subject as well as the test subjects themselves
- Repeat step 7.a for every graph analysed by the program
- Record all data
- Use the following data to complete analysis
- Overall accuracy of program and humans
- Incorrectly identified dips
- Correctly identified dips
- Unidentified dips
- Time taken to analyse graph
- Make bar graphs with the data to show information
7. Conclude how and if AI is effective in detecting exoplanets
- Use qualitative and quantitative data
- Explain how AI is beneficial
- Discuss potential applications of AI
Observations
10/24/23 - 01/05/24
Scatterplots
The data below will be analysed by both humans and AI.
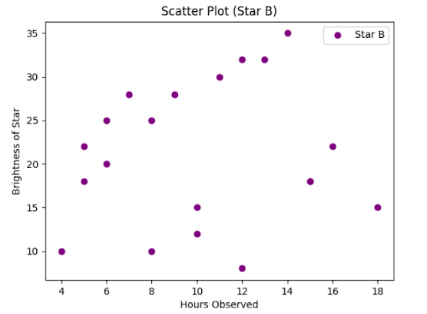
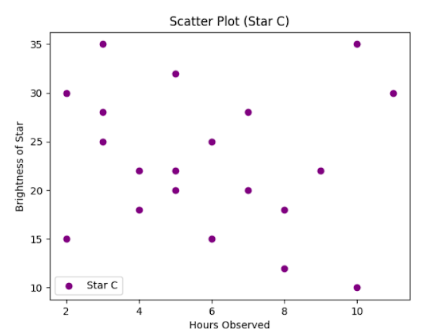
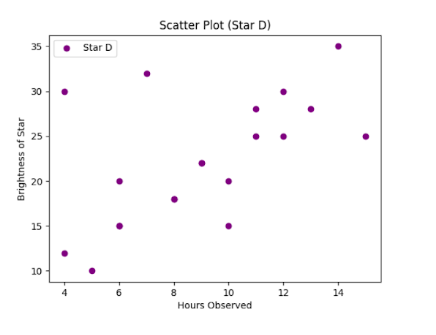
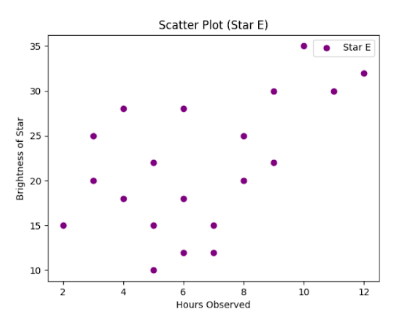
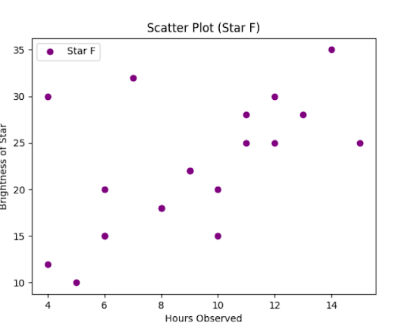
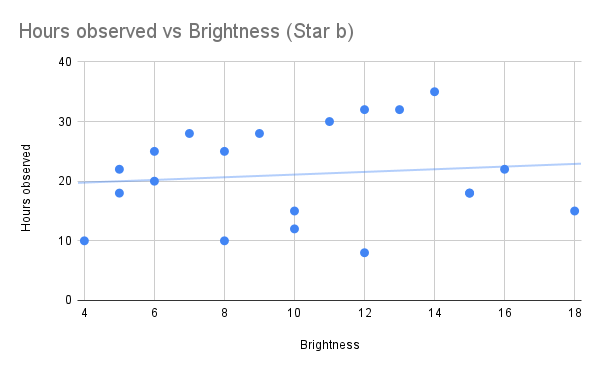
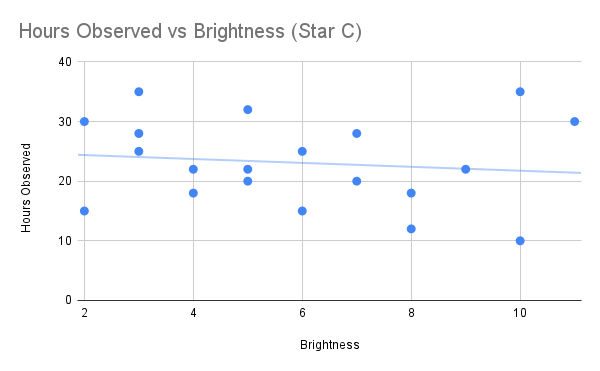
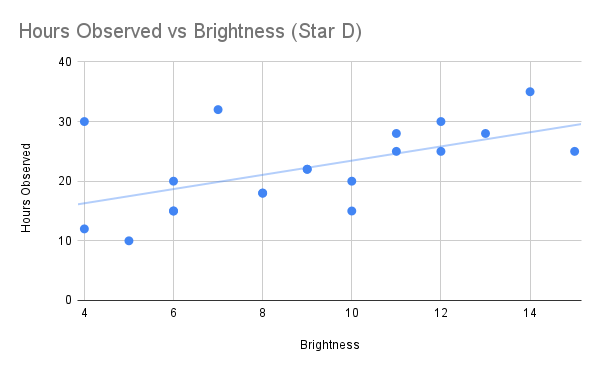
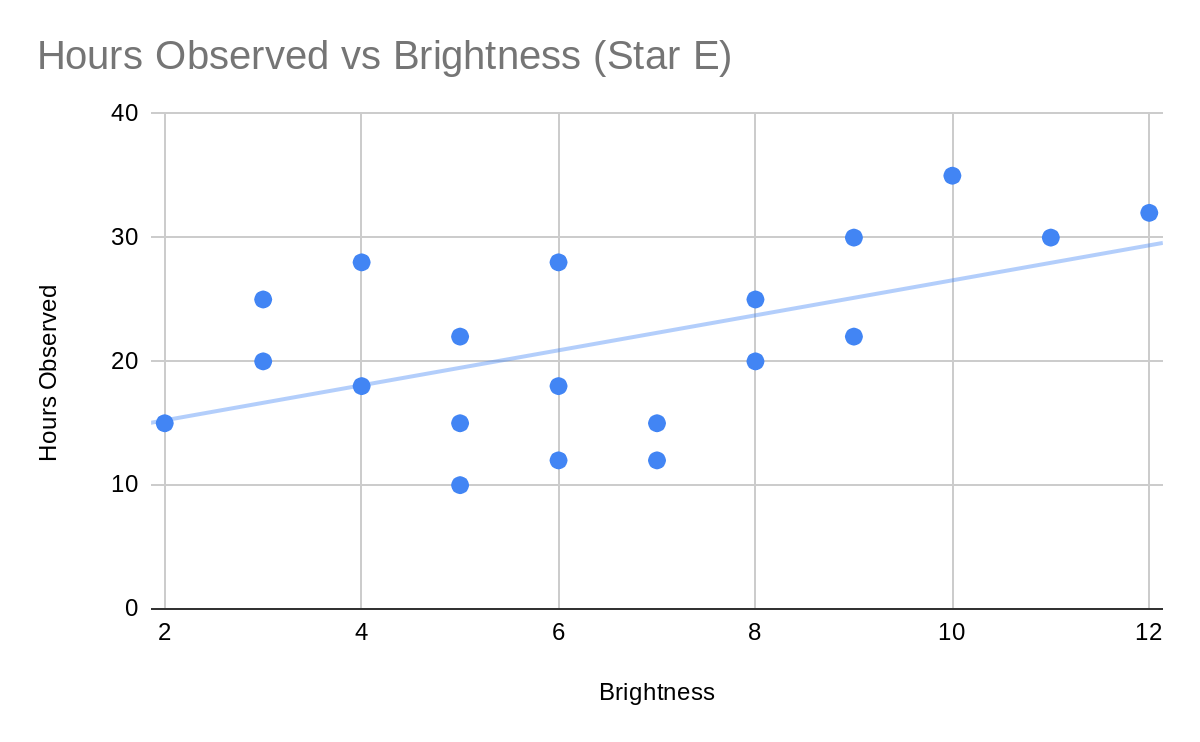
Below is simulated star data. Hours observed represents the amount of time data was collected from the star and brightness represents how bright the star is (All data points were generated randomly using ChatGPT):
|
Star A |
|
|
Star B |
|
|
Star C |
|
|
Star D |
|
|
Star E |
|
|
Star F |
|
Program to put simulated star data in scatterplots:
import matplotlib.pyplot as plt
# Simulated data gets put here!!!!!
Hours_Observed = [8, 10, 6, 12, 4, 9, 5, 11, 7, 14, 9, 6, 10, 15, 8, 12, 4, 13, 6, 11]
Brightness_of_Star = [18, 15, 20, 25, 30, 22, 10, 28, 32, 35, 22, 15, 20, 25, 18, 30, 12, 28, 15, 25]
# Where scatterplot is created
plt.scatter(Hours_Observed, Brightness_of_Star, color='purple', marker='o', label="Star F")
# labels and title
plt.xlabel('Hours Observed')
plt.ylabel('Brightness of Star')
plt.title('Scatter Plot (Star F)')
# Add a legend
plt.legend()
# Display the plot
plt.show()
Writing The Code
Initially, a program that could identify dips in scatterplots that simulated star brightness over a period of time was being looked for on the internet. programs that were suitable for the requirements of this project were not found.
Next, ChatGPT was used to write a program that would be able to identify dips in scatterplots. Because ChatGPT could not produce a program that did exactly what was required. For example:
import numpy as np
import matplotlib.pyplot as plt
# Data
hours_observed = np.array([10, 15, 8, 20, 25, 12, 18, 30, 35, 28, 22, 15, 20, 25, 18, 22, 12, 28, 15, 32])
brightness = np.array([5, 7, 4, 8, 2, 6, 3, 9, 12, 8, 5, 3, 7, 10, 4, 6, 2, 8, 5, 11])
# Calculate first derivative
first_derivative = np.diff(brightness) / np.diff(hours_observed)
# Identify points where the first derivative is negative (potential dips)
potential_dip_indices = np.where(first_derivative < 0)[0] + 1 # Adding 1 to adjust for the diff operation
# Plot the scatterplot
plt.scatter(hours_observed, brightness, label='Scatterplot')
plt.scatter(hours_observed[potential_dip_indices], brightness[potential_dip_indices], color='red', label='Potential Dips')
plt.legend()
plt.xlabel('Hours Observed')
plt.ylabel('Brightness')
plt.title('Scatterplot with Potential Dips')
plt.show()
The above program calculates the first derivative and identifies the points that could be potential dips.
import matplotlib.pyplot as plt
import numpy as np
# Generate sample data
np.random.seed(42)
x = np.linspace(0, 10, 100)
y = np.sin(x) + np.random.normal(0, 0.1, 100)
# Function to introduce dips in the data
def introduce_dips(data, dip_indices, dip_factor=0.5):
data_with_dips = data.copy()
data_with_dips[dip_indices] -= dip_factor
return data_with_dips
# Indices where dips will be introduced
dip_indices = [20, 40, 60, 80]
# Introduce dips in the y data
y_with_dips = introduce_dips(y, dip_indices)
# Plot the original scatterplot
plt.figure(figsize=(8, 6))
plt.scatter(x, y, label='Original Data')
# Plot the scatterplot with dips
plt.scatter(x, y_with_dips, label='Data with Dips', marker='x', color='red')
# Customize the plot
plt.title('Scatterplot with Dips')
plt.xlabel('X-axis')
plt.ylabel('Y-axis')
plt.legend()
# Show the plot
plt.show()
In this code one would have to manually adjust the ‘dip_factor’ to control the depth of the dip. This was not suitable for the project.
After lots of trial and error the final program that will be used for testing is the following:
import numpy as np
import matplotlib.pyplot as plt
from sklearn.linear_model import LinearRegression
# data
brightness = [18, 15, 20, 25, 30, 22, 10, 28, 32, 35, 22, 15, 20, 25, 18, 30, 12, 28, 15, 25]
hours_observed = [8, 10, 6, 12, 4, 9, 5, 11, 7, 14, 9, 6, 10, 15, 8, 12, 4, 13, 6, 11]
# creates line of best fit
model = LinearRegression()
model.fit(np.array(hours_observed).reshape(-1, 1), np.array(brightness).reshape(-1, 1))
# figures out the slope and where the line starts
slope = model.coef_[0][0]
intercept = model.intercept_[0]
# Calculate the trend line values
trend_line = slope * np.array(hours_observed) + intercept
# Find the minimum point on the trend line
min_trend_point = min(trend_line)
# Find the indices of points below or equal to the lowest point on the trend line
dip_indices = np.where(np.array(brightness) <= min_trend_point)[0]
# Plot the scatter plot
plt.scatter(hours_observed, brightness, label='Scatter Plot')
# Plot the linear trend line
plt.plot(hours_observed, trend_line, color='blue', label='Linear Trend Line')
# Highlight points below or equal to the lowest point on the trend line
plt.scatter(np.array(hours_observed)[dip_indices], np.array(brightness)[dip_indices], color='red', label='Dip Points')
# Show the scatter plot
plt.legend()
plt.xlabel('Hours Observed')
plt.ylabel('Brightness')
plt.title('Dips identified by AI (star E)')
plt.show()
Testing Observations:
|
12/15/23 |
|
|
12/16/23 |
|
|
12/17/23 |
|
|
12/19/23 |
|
|
12/22/23 |
|
|
12/23/23 |
|
|
12/24/23 |
|
|
12/25/23 |
|
Raw data:
Human participants
Time to detect All dips (seconds)
|
Star A |
Star B |
Star C |
Star D |
Star E |
Star F |
|
|
Test subject 1 |
0.29.31 |
0.26.60 |
0.25.68 |
0.18.10 |
0.18 |
0.18.61 |
|
Test subject 2 |
0.29.06 |
0.23.65 |
0.17.49 |
0.16.49 |
0.16.32 |
0.20.83 |
|
Test subject 3 |
2.27.0 |
0.29.68 |
0.21.34 |
0.23.63 |
0.29.84 |
0.46.0 |
|
Test subject 4 |
3.48.0 |
0.57.64 |
0.44.94 |
0.38.52 |
0.36.54 |
1.25.0 |
|
Test subject 5 |
0.57.66 |
0.9.8 |
0.29.5 |
0.26.9 |
0.57.4 |
0.23.2 |
|
Test subject 6 |
0.13.82 |
0.9.42 |
0.15.39 |
0.9.36 |
0.8.41 |
0.6.86 |
|
Test subject 7 |
23.87 |
13.08 |
17.10 |
18.17 |
9.02 |
10.92 |
|
Test subject 8 |
20.01 |
22.82 |
25.10 |
5.59 |
17.28 |
19.55 |
|
Test subject 9 |
1.03.48 |
0.37.50 |
0.40.30 |
0.29.52 |
0.21.05 |
0.16.48 |
|
Test subject 10 |
1.08.20 |
0.16.04 |
0.14.08 |
0.19.18 |
13 |
10.28 |
|
A |
B |
C |
D |
E |
F |
|
|
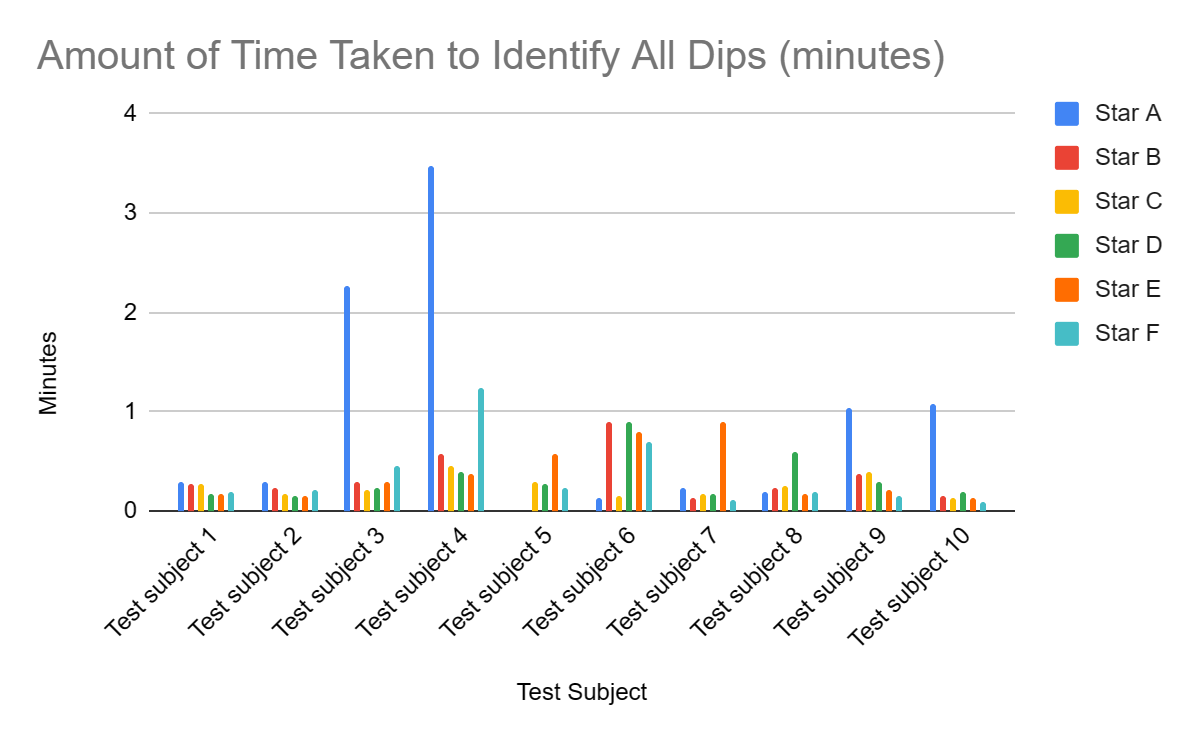
Average amount of time taken to detect all dips (minutes) |
1.002 |
0.354 |
0.251 |
0.342 |
0.379 |
0.361 |
12/15/23
What is considered a dip will be determined using a line of perfect fit. The bottom of the line of perfect fit will be the amount which is an outlier. Any dot that is under or equivalent to the unlying amount will be considered a dip.
This is an example in the scatterplot of Star A:
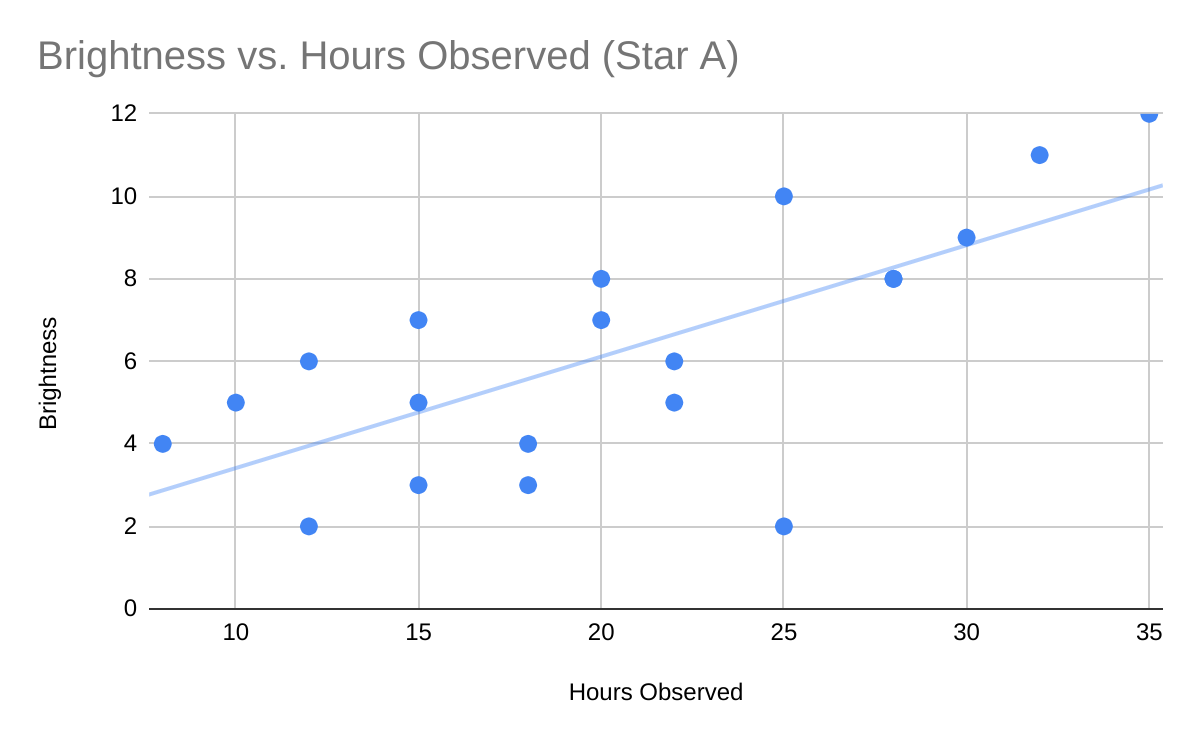
Above, it was explained how the scatter plot analysis accuracy will be measured. Below, the underlying amount will be determined for the rest of the scatterplots.
Points identified correctly
|
Star A |
Star B |
Star C |
Star D |
Star E |
Star F |
|
|
Test subject 1 |
2 |
6 |
6 |
4 |
6 |
4 |
|
Test subject 2 |
0 |
4 |
3 |
3 |
1 |
3 |
|
Test subject 3 |
2 |
6 |
4 |
2 |
5 |
2 |
|
Test subject 4 |
1 |
0 |
1 |
0 |
1 |
1 |
|
Test subject 5 |
1 |
7 |
7 |
2 |
5 |
2 |
|
Test subject 6 |
2 |
4 |
2 |
2 |
3 |
2 |
|
Test subject 7 |
2 |
4 |
3 |
2 |
2 |
2 |
|
Test subject 8 |
1 |
6 |
1 |
1 |
4 |
1 |
|
Test subject 9 |
0 |
3 |
3 |
2 |
2 |
3 |
|
Test subject 10 |
1 |
8 |
8 |
4 |
6 |
4 |
|
Star A |
Star B |
Star C |
Star D |
Star E |
Star F |
|
|
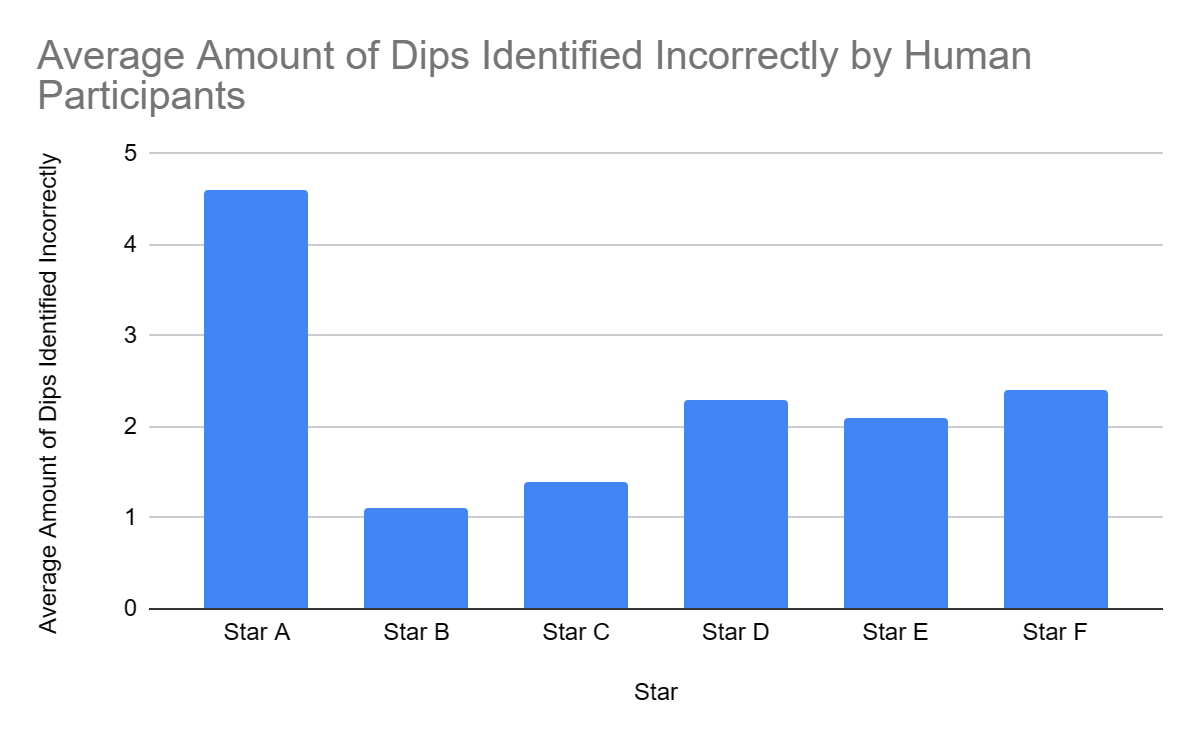
Average amount of dips unidentified by human participants |
1.2 |
4.8 |
2.2 |
3.8 |
3.5 |
2.4 |
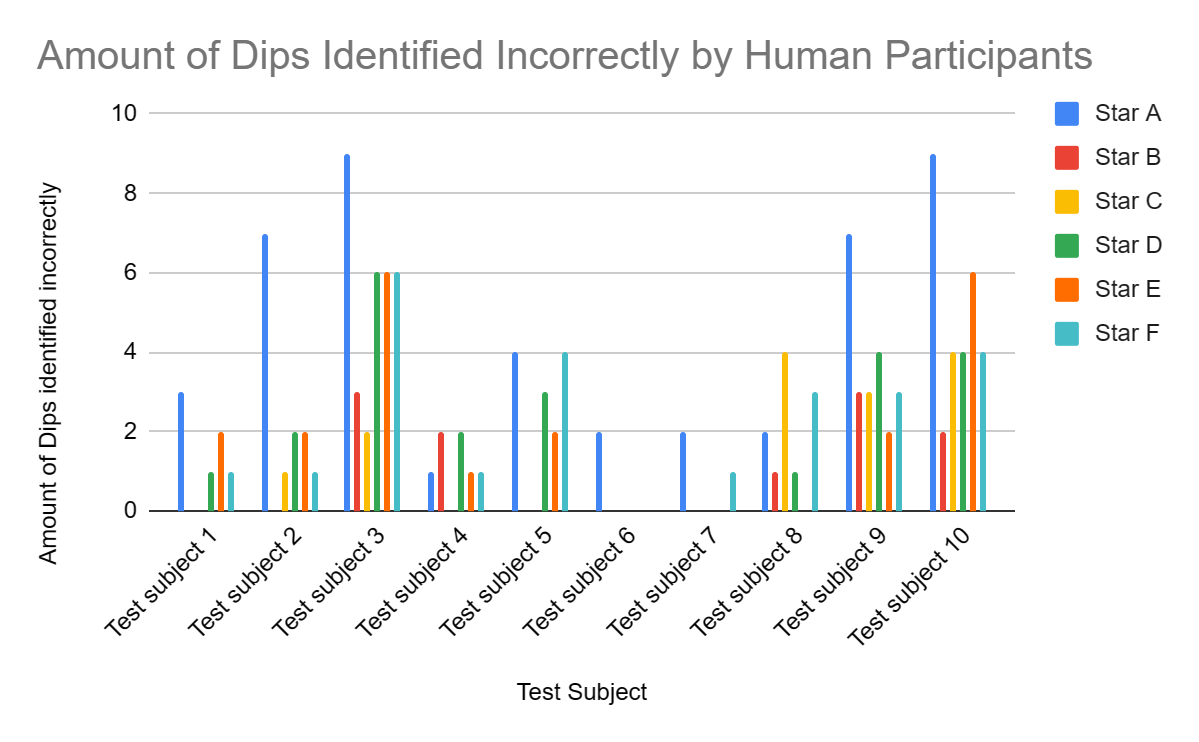
Points identified incorrectly
|
Star A |
Star B |
Star C |
Star D |
Star E |
Star F |
|
|
Test subject 1 |
3 |
0 |
0 |
1 |
2 |
1 |
|
Test subject 2 |
7 |
0 |
1 |
2 |
2 |
1 |
|
Test subject 3 |
9 |
3 |
2 |
6 |
6 |
6 |
|
Test subject 4 |
1 |
2 |
0 |
2 |
1 |
1 |
|
Test subject 5 |
4 |
0 |
0 |
3 |
2 |
4 |
|
Test subject 6 |
2 |
0 |
0 |
0 |
0 |
0 |
|
Test subject 7 |
2 |
0 |
0 |
0 |
0 |
1 |
|
Test subject 8 |
2 |
1 |
4 |
1 |
0 |
3 |
|
Test subject 9 |
7 |
3 |
3 |
4 |
2 |
3 |
|
Test subject 10 |
9 |
2 |
4 |
4 |
6 |
4 |
|
Star A |
Star B |
Star C |
Star D |
Star E |
Star F |
|
|
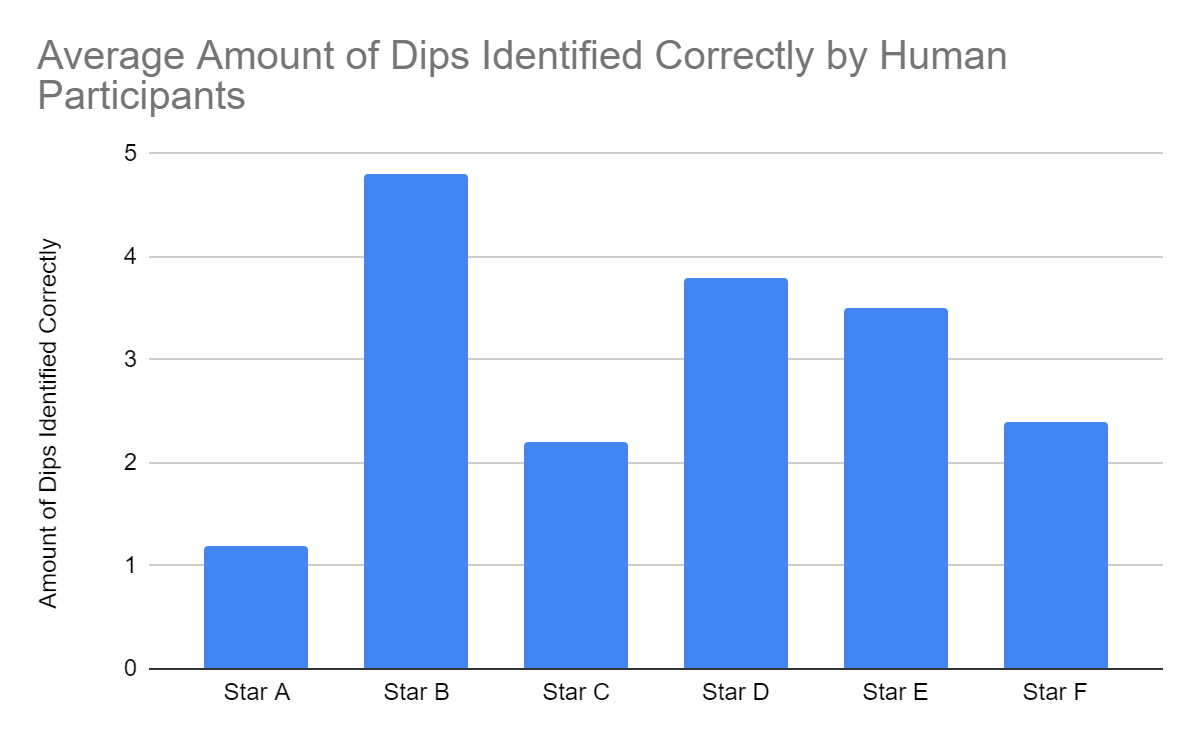
Average Amount of Dips Identified correctly by Human Participants |
4.6 |
1.1 |
1.4 |
2.3 |
2.1 |
2.4 |
Points that were unidentified
|
Star A |
Star B |
Star C |
Star D |
Star E |
Star F |
|
|
Test subject 1 |
0 |
2 |
2 |
0 |
0 |
0 |
|
Test subject 2 |
2 |
4 |
5 |
1 |
5 |
1 |
|
Test subject 3 |
0 |
2 |
3 |
2 |
1 |
2 |
|
Test subject 4 |
1 |
8 |
7 |
4 |
4 |
3 |
|
Test subject 5 |
1 |
1 |
1 |
2 |
1 |
2 |
|
Test subject 6 |
0 |
4 |
6 |
2 |
3 |
2 |
|
Test subject 7 |
0 |
4 |
5 |
2 |
4 |
2 |
|
Test subject 8 |
1 |
2 |
7 |
3 |
2 |
3 |
|
Test subject 9 |
2 |
6 |
5 |
2 |
4 |
1 |
|
Test subject 10 |
1 |
0 |
0 |
0 |
0 |
0 |
|
Star A |
Star B |
Star C |
Star D |
Star E |
Star F |
|
|
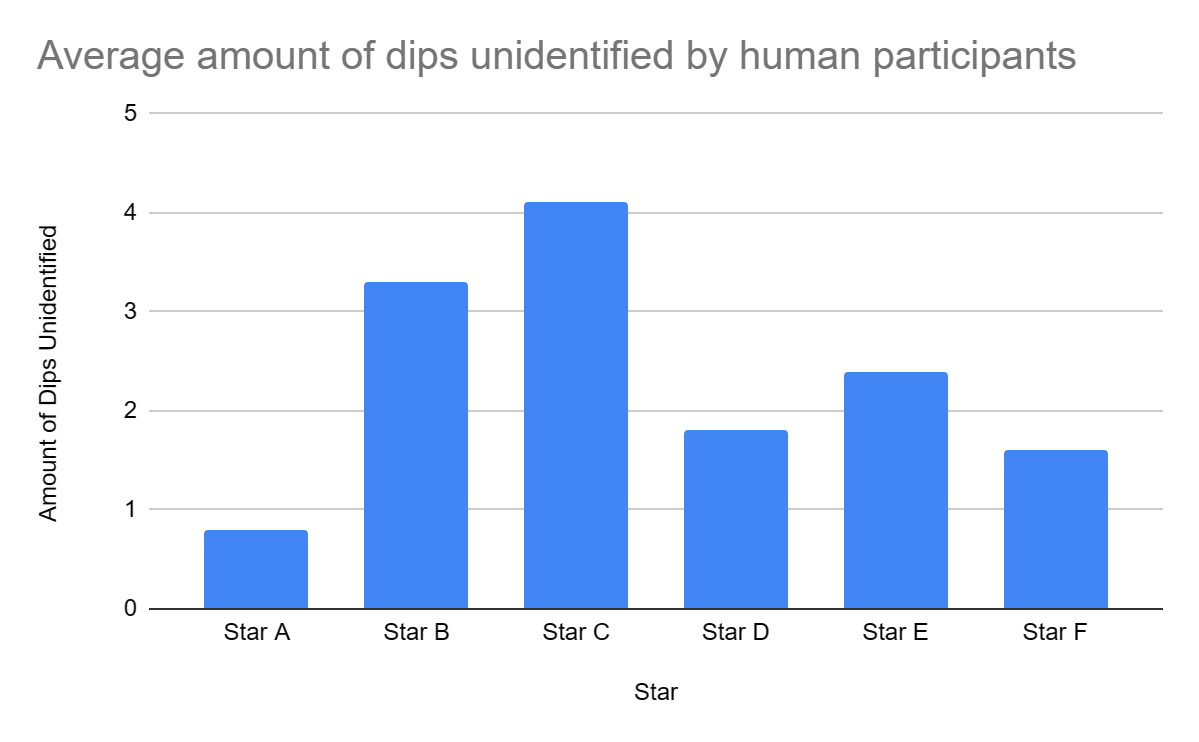
Average amount of dips unidentified by human participants |
0.8 |
3.3 |
4.1 |
1.8 |
2.4 |
1.6 |
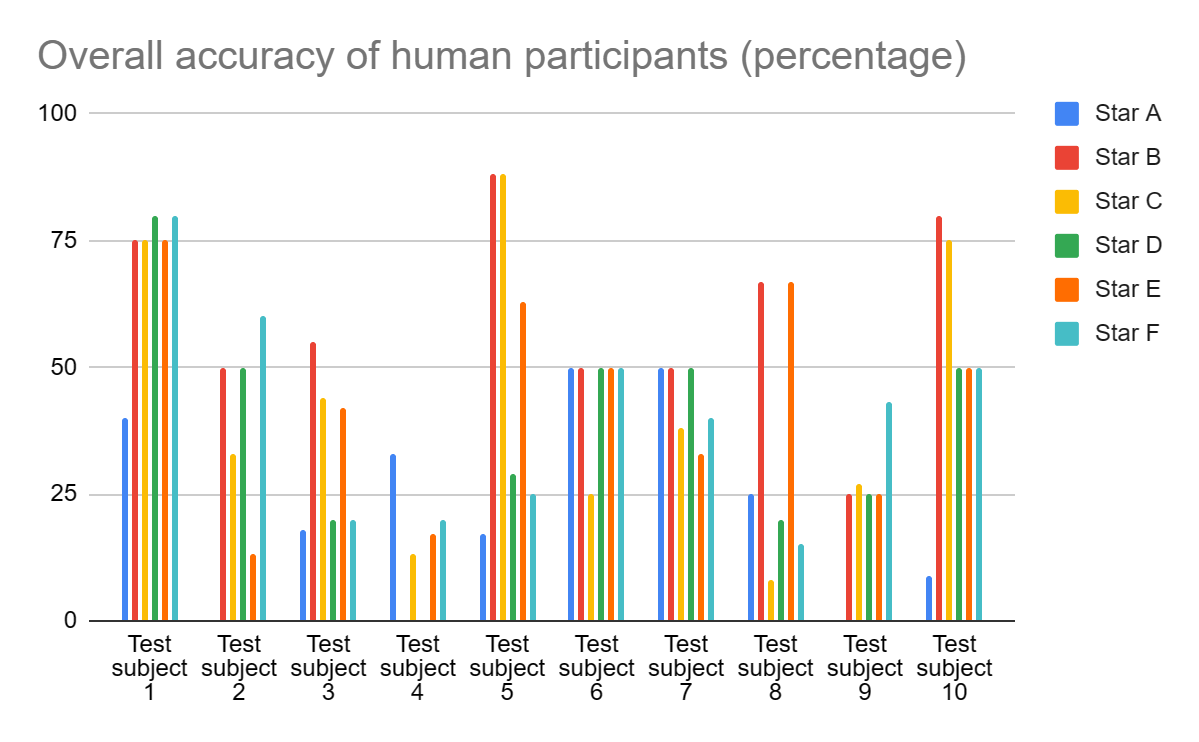
Overall accuracy (percents)
|
Star A |
Star B |
Star C |
Star D |
Star E |
Star F |
|
|
Test subject 1 |
40 |
75 |
75 |
80 |
75 |
80 |
|
Test subject 2 |
0 |
50 |
33 |
50 |
13 |
60 |
|
Test subject 3 |
18 |
55 |
44 |
20 |
42 |
20 |
|
Test subject 4 |
33 |
0 |
13 |
0 |
17 |
20 |
|
Test subject 5 |
17 |
88 |
88 |
29 |
63 |
25 |
|
Test subject 6 |
50 |
50 |
25 |
50 |
50 |
50 |
|
Test subject 7 |
50 |
50 |
38 |
50 |
33 |
40 |
|
Test subject 8 |
25 |
67 |
8 |
20 |
67 |
15 |
|
Test subject 9 |
0 |
25 |
27 |
25 |
25 |
43 |
|
Test subject 10 |
9 |
80 |
75 |
50 |
50 |
50 |
|
Star A |
Star B |
Star C |
Star D |
Star E |
Star F |
|
|
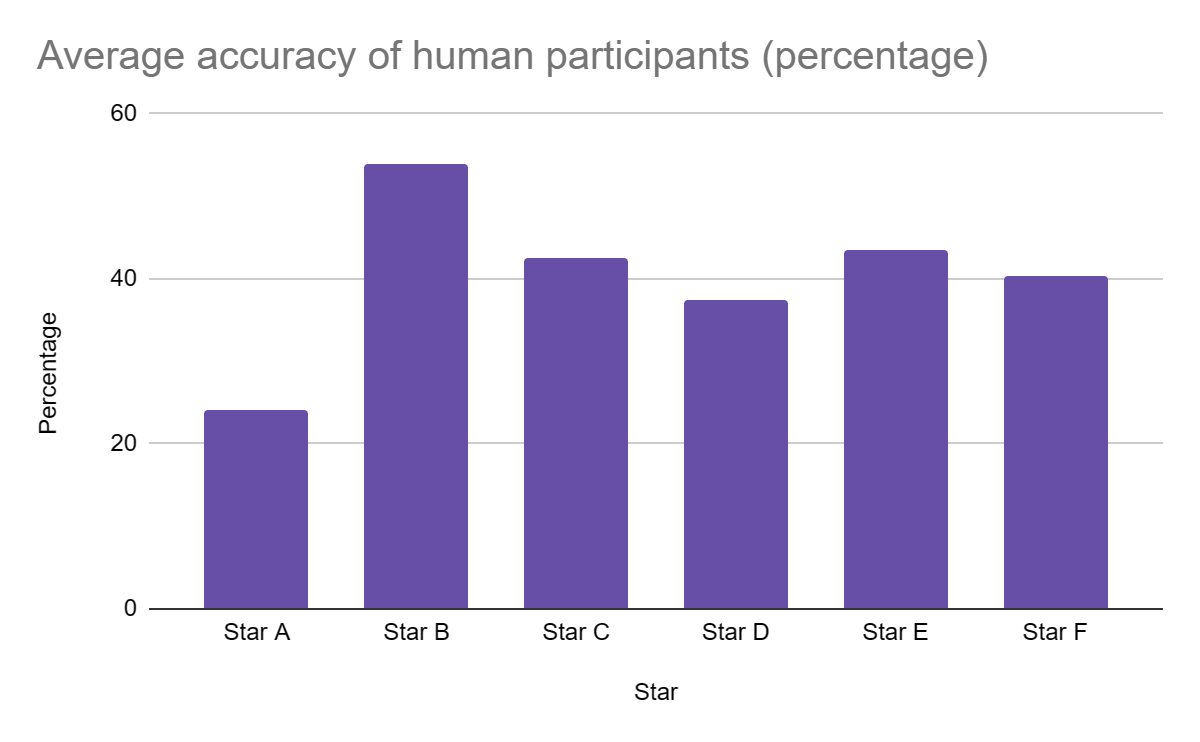
Average accuracy of human participants (percentage) |
24.2 |
54 |
42.6 |
37.4 |
43.5 |
40.3 |
AI
AI: Accuracy
The AI algorithm completes analysis within milliseconds, therefore, there is no data for how long the algorithm took to identify the dips in the scatter plots.
Points identified correctly
|
Star A |
Star B |
Star C |
Star D |
Star E |
Star F |
|
|
AI algorithm |
2 |
8 |
8 |
4 |
6 |
4 |
Points identified incorrectly
|
Star A |
Star B |
Star C |
Star D |
Star E |
Star F |
|
|
AI algorithm |
0 |
0 |
0 |
0 |
0 |
0 |
Points unidentified
|
Star A |
Star B |
Star C |
Star D |
Star E |
Star F |
|
|
AI algorithm |
0 |
0 |
0 |
0 |
0 |
0 |
Overall Accuracy (percents)
|
Star A |
Star B |
Star C |
Star D |
Star E |
Star F |
|
|
AI algorithm |
100 |
100 |
100 |
100 |
100 |
100 |
Analysis
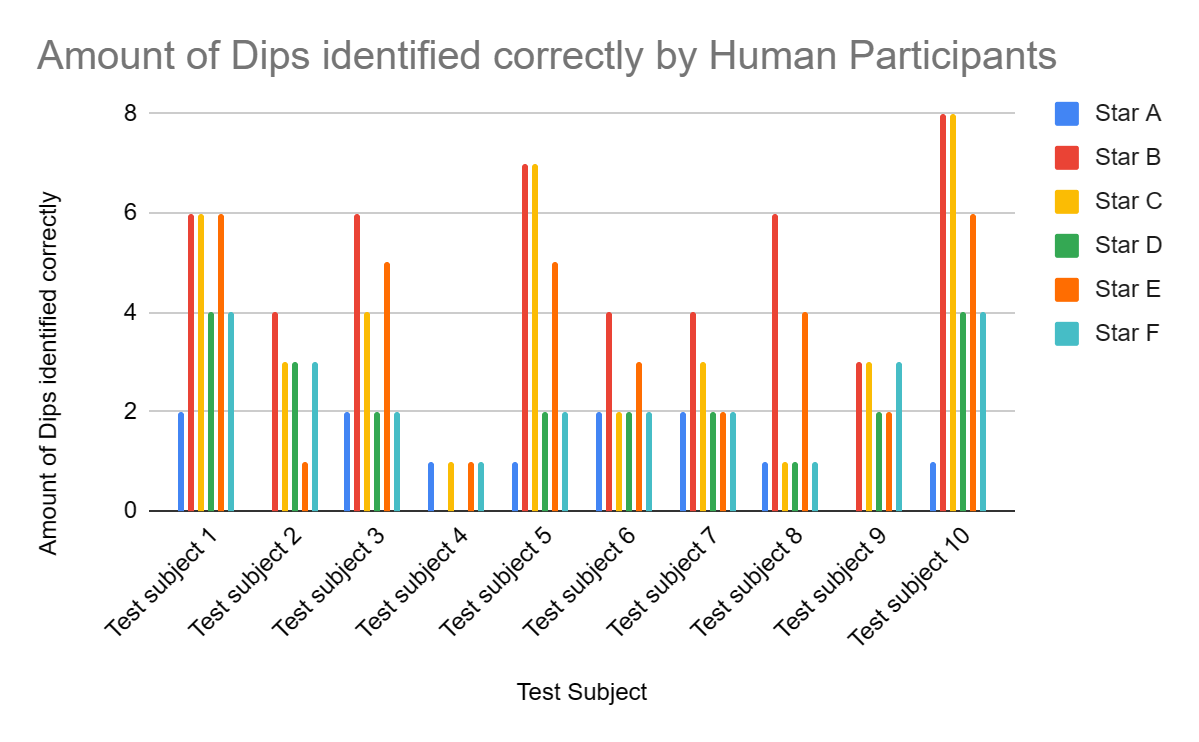
The results also show that human participants could not correctly identify as many dips as AI. This is because on star A, an average of 1.2 dips were identified correctly by human participants while the AI algorithm was able to detect all 2 dips correctly. This is about 67% more.For star B, human participants were able to identify an average of 4.8 dips correctly. The AI algorithm was able to detect 8 correctly. This is about 67% more. For star C, human participants were able to identify an average of 2.2 dips correctly. The AI algorithm was able to detect 8 correctly. This is about 264% more. For star D, human participants were able to identify an average of 3.8 dips correctly. The AI algorithm was able to detect 4 correctly. This is about 5% more. For star E, human participants were able to identify an average of 3.5 dips correctly. The AI algorithm was able to detect 4 correctly. This is about 14% more. For star F, human participants were able to identify an average of 2.4 dips correctly. The AI algorithm was able to detect 4 correctly. This is about 67% more.
The findings demonstrated that AI is far more accurate than humans in many aspects. This is because AI is not only capable of accurately detecting dips in scatter plots, but it is also capable of avoiding wrongly recognizing dips and missing any points that represent dips. This is demonstrated by the fact that in all scatter plots, it is zero in the areas that indicate how many dips were incorrectly identified and missed.
Overall accuracy was also measured. This was done in percentages by dividing the amount of correctly identified points to the sum of correctly identified points, incorrectly identified points, and missed points.
For star A, the average accuracy was 24% in comparison to AI which was 100% accurate. This is a 316% increase in accuracy. For star B, the average accuracy was 54% in comparison to AI which was 100% accurate. This is an 85% increase in accuracy. For star C, the average accuracy was 43% in comparison to AI which was 100% accurate. This is a 133% increase in accuracy. For star D, the average accuracy was 37% in comparison to AI which was 100% accurate. This is a 170% increase in accuracy. For star E, the average accuracy was 44% in comparison to AI which was 100% accurate. This is a 127% increase in accuracy. For star F, average accuracy was 40% in comparison to AI which was 100% accurate. This is a 150% increase in accuracy.
From this information it can be concluded that AI is countless times better than human participants. Below are some more graphs that represent this information:


Conclusion
In conclusion, the original hypothesis that AI can make exoplanet discovery more efficient and accurate is strongly supported by both the experimental and literature review sections.
Traditional methods involving statistical analysis, such as periodicity and Fourier analysis, were found to be time-consuming and extremely complex. However, using deep learning and machine learning models has proven to be much more effective at analysing star brightness data. Some of Artificial Intelligence’s abilities include recognition, efficiency, and the ability to analyse a large amount of data.
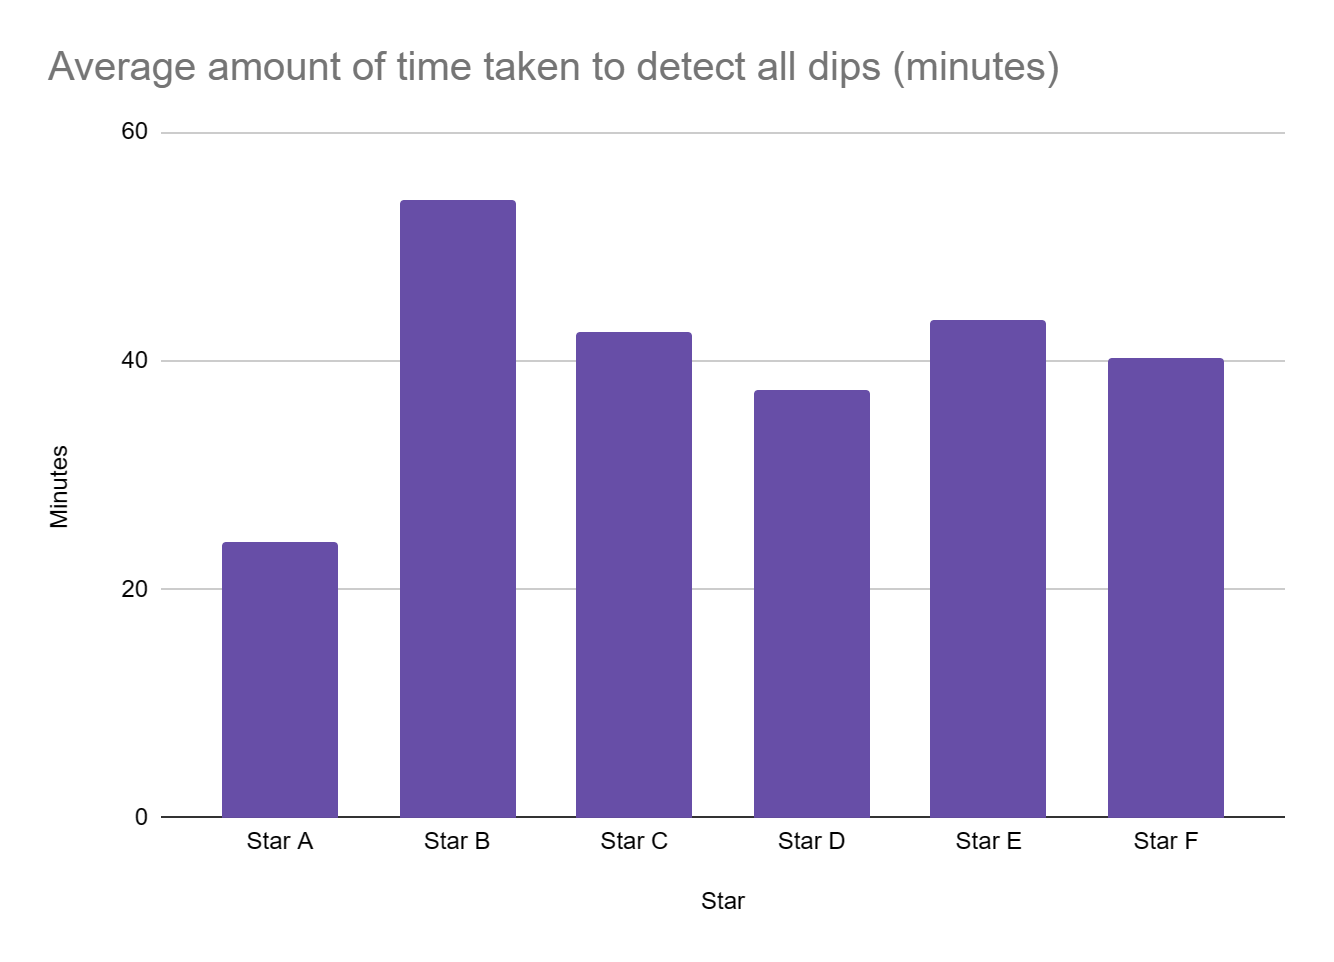
Through the experimental portion of this project, it was found that human participants faced several challenges. Many stated that they found "star A" to be the most difficult, as it was the first graph they had to analyse. Like machine learning, human accuracy consistently improved with more data, but it took a considerable amount of time to explain how to analyse the data. Another challenge was the nature of human analysis, where opinions played a significant role. For instance, a dip in a star's brightness could be attributed to various factors, not just an exoplanet. Humans also struggled with the time difference between AI and humans, taking an average of 40 seconds per graph compared to the practically instantaneous task completion by the AI algorithm.
Quantitative data further supports the superiority of AI over humans. The AI algorithm achieved an average accuracy of 100%, while human participants had an accuracy of 42.6%, taking 44% more time to detect all dips. These numbers underscore the previously mentioned points.
The practical applications of this project extend to various fields. Firstly, it demonstrates how AI significantly reduces time and effort by automating the task of identifying dips in scatterplots accurately. This project also illustrates how AI can help detect dips in scatterplots, showcasing its potential in large-scale surveys like TESS. By using AI, the efficiency of detecting exoplanets, and potentially life outside Earth, can be greatly improved.
In general, this project highlights the potential of AI in optimising resources and dealing with more complex datasets. It also indicates technological advancements, showcasing the potential applications of AI in the future.
While this project is relatively simple, accurately detecting exoplanets with AI through transit photometry data requires further development for a more accurate model.
Application
This project has countless applications. Firstly, the most clear application is the fact that we will be able to discover exoplanets. The use of Artificial Intelligence in the process will increase accuracy and reduce time. This is important to not only rapidly find exoplanets but will also reduce cost through the reduction of human error. The use of Artificial intelligence will also allow various other forms of analysis that will help in exoplanet detection including the ability to understand the conditions of the planet including facts about the size, atmosphere, climate and if it resides in the habitable zone of the star. Currently statistical methods can take up to a year in order to discover a single planet. By using AI, humans may be able to cut this time down by a great amount.
Discovering exoplanets will help humanity in many ways. One being the most prominent is finding life outside of Earth. Discovering extraterrestrial life has many benefits. For example, discovering life will drive scientific curiosity and push us to continue researching and studying space. Finding life outside of Earth will also help to gain understanding about the origin of the human race because it will help answer questions like if life arose independently or if it has a connection with us.
Discovering life outside of Earth will help to expand humanity's perspective of the world and help make advancements in technologies, because life that is not found on Earth may have made advancements that we do not know of yet. This will help advance knowledge in fields such as chemistry, biology and physics.
Another huge benefit of looking for and finding life outside of Earth is important for figuring out the future of Humanity. Will we have to colonise another planet? What will be the future of Earth? Are questions that humans have been asking, especially now that climate change has been a big issue. Finding life can help finding a solution to this problem.
This project emphasises how AI can be used to make various activities take less time and effort as well as improve accuracy of certain tasks. This information is proven in the data that proves how good AI does what it is told to do.
There are many ways AI could and is improving the lives of people. Firstly, AI’s use in the healthcare industry can improve the accuracy of diagnosing diseases by analysing medical images like x-rays and MRI’s.
AI can also revolutionise communication by translating languages. This breaks the communication barrier allowing people to communicate from all over the world.
Artificial intelligence can contribute to reducing the negative impact of humans on planet Earth. This is because it is able to identify where and how humans are able to reduce their carbon footprint. AI can also help with energy optimisation by adjusting heating, cooling, lighting, etc. based on occupancy and other factors.
Throughout the project, it was evident that Artificial Intelligence excels at identifying patterns. This prompts new questions, such as:
- Given that light takes many years to travel from distant galaxies to Earth, essentially allowing us to look back in time, can we determine if our galaxy once had a quasar using data from other galaxies? Can AI assist in this, and if so, how?
- What are the other potential applications of AI in the field of astronomy?
Sources Of Error
- Previous experience of the human participant may have impacted how accurate and how much time they take to analyse a graph. For example, someone working in the field of data analysis may have more knowledge about scatter plots than someone who works in performing arts.
- Though the information given to the participant before testing was the same, a participant may have interpreted it in a different way. For example, one participant thought to identify the points that are darker on colour rather than being lower on the Y-axis.
Because all sources of error are caused by human error, this information actually supports Artificial intelligence and continues to prove why AI should be used.
Citations
NASA. (2021, April 2). Overview. NASA. https://exoplanets.nasa.gov/what-is-an-exoplanet/overview/
NASA. (2021, April 2). Overview. NASA. https://exoplanets.nasa.gov/what-is-an-exoplanet/overview/
NASA. (2021, March 22). Transiting Exoplanet Survey Satellite (tess) - exoplanet exploration: Planets beyond our solar system. NASA. https://exoplanets.nasa.gov/tess/
Exoplanets, Worlds orbiting other stars. The Planetary Society. (n.d.). https://www.planetary.org/worlds/exoplanets#:~:text=There%20are%20lots%20of%20reasons,the%20course%20of%20human%20history.
Exoplanet and candidate statistics. Exoplanet and Candidate Statitics. (n.d.). https://exoplanetarchive.ipac.caltech.edu/docs/counts_detail.html
NASA. (2019, June 20). 5 ways to find a planet. NASA. https://exoplanets.nasa.gov/alien-worlds/ways-to-find-a-planet/
What is Periodicity analysis? (n.d.). Www.tutorialspoint.com. Retrieved December 14, 2023, from https://www.tutorialspoint.com/what-is-periodicity-analysis
Das, T. (2023, July 8). What is Artificial Intelligence (AI)? Tech4Fresher. https://tech4fresher.com/what-is-artificial-intelligence-ai/
Morris, K. R. (2023, September 26). Finding Life Beyond Earth is Within Reach - NASA. NASA. https://www.nasa.gov/missions/webb/finding-life-beyond-earth-is-within-reach/
<p> </p, P. G. H. E. P. (2019, April 8). With next-generation telescopes, tiny space probes, and more, scientists aim to search for life beyond our solar system—and make contact. National Geographic. https://www.nationalgeographic.co.uk/2019/03/life-probably-exists-beyond-earth-so-how-do-we-find-it
Why We Search | The Search For Life – Exoplanet Exploration: Planets Beyond our Solar System. (n.d.). Exoplanet Exploration: Planets Beyond Our Solar System. https://exoplanets.nasa.gov/search-for-life/why-we-search/
Wikipedia contributors. (2023, October 3). Labeled data. Wikipedia. https://en.wikipedia.org/wiki/Labeled_data
Awan, A. A. (2023, July 3). What is Labeled Data? https://www.datacamp.com/blog/what-is-labeled-data
Supervised Learning. (n.d.). Google for Developers. https://developers.google.com/machine-learning/intro-to-ml/supervised
What is Supervised Learning? | IBM. (n.d.). https://www.ibm.com/topics/supervised-learning
Taylor, S. (2023, December 19). Regression Analysis. Corporate Finance Institute. https://corporatefinanceinstitute.com/resources/data-science/regression-analysis/
Beers, B. (2023, April 1). What is Regression? Definition, Calculation, and Example. Investopedia. https://www.investopedia.com/terms/r/regression.asp
Regression analysis. (2024, January 5). Wikipedia. https://en.wikipedia.org/wiki/Regression_analysis
COSMOS for the Detection and Characterization of Exoplanets | Teledyne Princeton Instruments. (2021, October 25). Teledyne Princeton Instruments. https://www.princetoninstruments.com/products/cosmos-family/cosmos/app-notes/detecting-and-characterizing-exoplanets
Transit Method - NASA Science. (n.d.). https://science.nasa.gov/mission/roman-space-telescope/transit-method/
Khan, I. (2023, September 2). ChatGPT Glossary: 42 AI Terms That Everyone Should Know. CNET. https://www.cnet.com/tech/computing/chatgpt-glossary-42-ai-terms-that-everyone-should-know/#google_vignette
AI is here. This is how it can benefit everyone. (2020, September 9). World Economic Forum. https://www.weforum.org/agenda/2020/09/ai-is-here-this-is-how-it-can-benefit-everyone/
Enhancing Everyday Life: How AI is Revolutionizing Your Daily Experience. (n.d.). https://www.morgan.edu/ceamls/news/enhancing-everyday-life-how-ai-is-revolutionizing-your-daily-experience
McFadden, C. (2023, February 16). From chatbots to facial recognition, here’s how AI impacts your daily life. https://interestingengineering.com/lists/how-ai-impacts-your-life
Gerber, S. (2017, March 3). 13 ways AI will change your life. TNW | Artificial-Intelligence. https://thenextweb.com/news/13-ways-ai-will-change-life
Stokel-Walker, C. (2023, July 27). How to use AI to make your life simpler, cheaper and more productive. New Scientist. https://www.newscientist.com/article/2384092-how-to-use-ai-to-make-your-life-simpler-cheaper-and-more-productive/
Joby, A. (2021, July 30). What Is Training Data? How It’s Used in Machine Learning. https://learn.g2.com/training-data
Yi, M. (2019, October 16). A Complete Guide to Scatter Plots. Chartio. https://chartio.com/learn/charts/what-is-a-scatter-plot/
What is Python? Executive Summary. (n.d.). Python.org. https://www.python.org/doc/essays/blurb/
Photometry (optics). (2024, February 10). Wikipedia. https://en.wikipedia.org/wiki/Photometry_(optics)
Oxford Languages | The Home of Language Data. (2022, August 26). https://languages.oup.com/
Howell, E. (2017, October 11). Luminosity and magnitude explained. Space.com. https://www.space.com/21640-star-luminosity-and-magnitude.html
W. (2022, March 22). Measuring the Brightness of Stars | AstroCamp Science Camp. AstroCamp. https://astrocamp.org/blog/brightness-of-stars/
Fraknoi, A. (2016, October 13). 17.1 The Brightness of Stars - Astronomy | OpenStax. https://openstax.org/books/astronomy/pages/17-1-the-brightness-of-stars
Society, P. (2020, July 18). Down in Front!: The Transit Photometry Method. The Planetary Society. https://www.planetary.org/articles/down-in-front-the-transit-photometry-method
Williams, M. (2020, September 2). What is the Transit Method? - Universe Today. Universe Today. https://www.universetoday.com/137480/what-is-the-transit-method/
McKee, A. (2023, August 11). A Data Scientist’s Guide to Signal Processing. https://www.datacamp.com/tutorial/a-data-scientists-guide-to-signal-processing
Staff, C. (2024, February 9). What Is Machine Learning? Definition, Types, and Examples. Coursera. https://www.coursera.org/articles/what-is-machine-learning
Machine learning. (2024, February 11). Wikipedia. https://en.wikipedia.org/wiki/Machine_learning
Chi-squared test. (2024, February 5). Wikipedia. https://en.wikipedia.org/wiki/Chi-squared_test
Fourier analysis. (2023, December 9). Wikipedia. https://en.wikipedia.org/wiki/Fourier_analysis
What is Periodicity analysis? (n.d.). https://www.tutorialspoint.com/what-is-periodicity-analysis
Linear regression. (2024, February 13). Wikipedia. https://en.wikipedia.org/wiki/Linear_regression
Kepler / K2 - NASA Science. (n.d.). https://science.nasa.gov/mission/kepler/
Light. (2023, December 4). Wikipedia. https://en.wikipedia.org/wiki/Light
What is a Planet? - NASA Science. (n.d.). https://science.nasa.gov/solar-system/planets/what-is-a-planet/
Star - Wikipedia. (2024, February 19). https://en.wikipedia.org/wiki/Star
What is Plasma? - MIT Plasma Science and Fusion Center. (n.d.). Retrieved February 19, 2024, from https://www.psfc.mit.edu/vision/what_is_plasma#:~:text=Plasma%20is%20superheated%20matter%20%E2%80%93%20so,the%20north%20and%20south%20poles.
NCI Dictionary of Cancer Terms. (n.d.). National Cancer Institute. https://www.cancer.gov/publications/dictionaries/cancer-terms/def/ion
Data - Definition, Meaning & Synonyms. (n.d.). Vocabulary.com. https://www.vocabulary.com/dictionary/data#:~:text=%2F%CB%88d%C3%A6t%C9%99%2F,be%20processed%20by%20a%20computer.
Luminous flux. (2024, February 4). Wikipedia. https://en.wikipedia.org/wiki/Luminous_flux
Acknowledgement
I would like to thank all participants that allowed me to test on them. This allowed me to collect quantitative data that supported the conclusion of this project.
I would like to thank my parents and teachers for their support in improving my project.