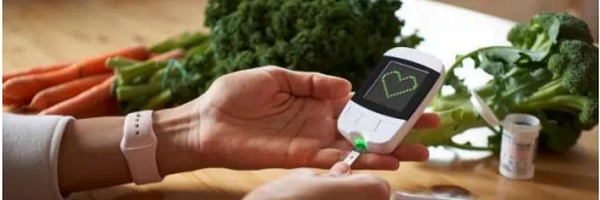
How Sweet is it? Measuring Glucose in Your Foods!
Grade 6
Presentation
Hypothesis
Hypothesis:
Our hypothesis is if a food contains preservatives, it will have a greater glucose concentration.
Information on Hypothesis:
Preservatives, such as sodium benzoate or potassium sorbate, are often added to extend the shelf life products by preventing spoilage and inhibiting microbial growth. However, this preservation process can lead to an increase in the overall sugar content, as these substances can alter the natural breakdown of carbohydrates in the food. Additionally many processed foods that require preservatives are often high in sugars and other refined carbohydrates to enhance flavour and appeal, thereby contributing to a higher glucose concentration. Consequently, individuals seeking to manage their blood glucose levels or adhere to a balanced diet should be mindful of the presence of preservatives in their food choices, as these additives may inadvertently lead to an increase in glucose levels in the body and potentially impacting overall health and well-being.
Research
Diabetes:
Diabetes is a chronic illness that affects how the body handles glucose (sugar), the primary source of energy for cells. When someone without diabetes consumes food, particularly carbohydrates, blood glucose levels increase, and insulin is signaled from the pancreas to be released, which helps glucose in the bloodstream enter the cells of our organs. However, when insulin is deficient or defective, this cannot happen. As a result, glucose in the bloodstream builds up to unhealthy levels. Proper management is vital for avoiding complications such as hyperglycemia (high blood sugar) and hypoglycemia. There are two possible scenarios where this could happen. Type 1 diabetes is caused by an autoimmune reaction, in which the immune system targets insulin-producing beta cells in the pancreas. People with type 1 diabetes do not make insulin, therefore they must rely on insulin injections or an insulin pump to regulate their blood sugar. This is generally diagnosed in children, adolescents, or young adults. Type 2 diabetes can be caused by insulin resistance, where the body does not respond properly to insulin, leading to elevated blood sugar levels. Over time, the pancreas can no longer produce enough insulin to meet the body's demands. While insulin is produced in this type, the body’s cells do not respond effectively. This kind of diabetes has normally been found in adults but is increasingly diagnosed in children due to rising obesity rates. Insulin is a hormone produced by the pancreas that helps cells absorb glucose from the bloodstream.
Why Eating Foods with Low Glucose or Low GI Help People with Diabetes:
Consuming foods with a low glycemic index (GI) can be beneficial for managing diabetes for the several reasons stated below:
1. Better Blood Sugar Control:
- Slow Release of Glucose: Foods with a low GI are digested and absorbed more slowly, leading to a gradual rise in blood sugar. This helps prevent the blood sugar spikes that can occur with high-GI foods.
- Avoiding Hyperglycemia: Reducing the frequency and magnitude of blood sugar spikes lowers the risk of hyperglycemia (high blood sugar), which can contribute to long-term complications like cardiovascular disease, nerve damage, and kidney failure.
2. Improved Insulin Sensitivity:
- Lower Insulin Demand: Low-GI foods require less insulin to metabolize, which is particularly helpful for people with type 2 diabetes, where insulin resistance is an issue. Over time, a diet based on low-GI foods may improve the body’s insulin sensitivity.
- Reduced Insulin Resistance: Eating low-GI foods helps reduce the body's need for insulin, which may lower the likelihood of developing insulin resistance.
3. Weight Management:
- Promotes Satiety: Low-GI foods tend to be more filling and can help people feel full for longer periods, making it easier to control hunger and prevent overeating.
- Weight Loss Benefits: Managing weight is key in diabetes management, especially for those with type 2 diabetes. Low-GI foods help reduce hunger, lower overall calorie intake, and contribute to weight loss and better blood sugar control.
4. Prevention of Future Complications:
- Reduced Risk of Cardiovascular Disease: High blood sugar levels, especially when they fluctuate rapidly, can damage blood vessels and increase the risk of cardiovascular diseases, including stroke and heart attack. A low-GI diet helps minimize these risks by stabilizing blood sugar levels.
- Better Long-Term Health Outcomes: A consistent intake of low-GI foods has been shown to improve long-term blood sugar control and reduce the risk of complications associated with diabetes.
Glycemic Index (GI) and Glycemic Load (GL):
The Glycemic Index (GI) is a scale that measures how quickly carbohydrates in a food raise blood glucose levels. Foods are ranked on a scale from 0 to 100:
-
Low GI (55 or less): These foods cause a slower, more gradual increase in blood sugar. Examples include whole grains, legumes, non-starchy vegetables, and some fruits.
-
Medium GI (56-69): Foods with a moderate effect on blood sugar. Examples include brown rice, sweet potatoes, and some fruits.
-
High GI (70 or higher): These foods cause a rapid spike in blood sugar levels. Examples include white bread, sugary cereals, and processed foods.
Glycemic Load (GL) takes both the quality (GI) and quantity (carbohydrate content) of a food into account. It provides a more practical measure of how food affects blood sugar.
-
Low GL: ≤ 10
-
Medium GL: 11-19
-
High GL: ≥ 20
Foods with a low GI and GL are generally recommended for people with diabetes because they help maintain stable blood sugar levels.
Examples of Low-GI Foods:
People with diabetes can manage their blood sugar levels more effectively by focusing on low glycemic index (GI) foods. These include whole grains like barley, quinoa, oats, whole wheat pasta, and brown rice, as well as legumes such as lentils, chickpeas, kidney beans, and black beans. Non-starchy vegetables like leafy greens, broccoli, spinach, cauliflower, and peppers are also beneficial, along with fruits like apples, pears, berries, cherries, and grapefruit. Nuts and seeds, including almonds, walnuts, chia seeds, and flaxseeds, can provide healthy fats and fiber, while dairy options like low-fat or full-fat milk, unsweetened yogurt, and cheese in moderation offer additional nutrients. Examples of low-GI meals include a breakfast of steel-cut oats topped with berries and nuts, a quinoa salad with chickpeas, spinach, cucumbers, and olive oil for lunch, and a dinner of grilled salmon with steamed broccoli and brown rice. These meal choices help maintain stable blood sugar levels while providing a balanced and nutritious diet.
Foods to Avoid for Diabetes Management:
People with diabetes should limit or avoid foods that have a high glycemic index or high glycemic load, as they can cause rapid blood sugar spikes, raise blood sugar quickly and may cause other severe health issues. Some examples of these foods are:
-
Refined Carbohydrates: White bread, white rice, pastries, and sugary breakfast cereals.
-
Sugary Drinks: Soda, sweetened teas, and energy drinks.
-
Processed Snacks: Potato chips, candy bars, and other highly processed, sugar-laden foods.
-
Fried Foods: French fries and deep-fried snacks can contribute to insulin resistance and increase fat accumulation.
Experiment Information:
To determine which food type contains the highest amount of glucose, we will test thirteen different foods. Six of which will be natural, and seven of which will be processed. For our juices we will be using the Minute Maid brand. We will also make controls by diluting cups of water with different glucose concentrations so that we can refrence to them once we test each one. The glucose levels in each food will be noted and revised before being finalized and put into our project. DIastix glucose test strips work by producing a color-change reaction that scales linearly with the concentration of glucose in the foods once pressed against the surface of a food for thirty seconds. We selected these particular foods because they are listed as some of the most often consumed meal worldwide on the websites genemco.com, healthline.com, and atlas.com. We were sure that this would guarantee a greater impact on more people worldwide.
Information about Foods that will be Tested:
The information below explain the description, uses and nutrition of each of the foods that we will be testing.
1. Lemon Juice
- Description: Lemon juice is the sour, tangy liquid extracted from fresh lemons. It is rich in vitamin C and is commonly used in beverages, cooking, and as a garnish.
- Uses: Adds acidity and flavor to dishes, drinks (like lemonade), salad dressings, marinades, and desserts. Often used to balance sweetness or enhance the flavors of savory foods.
- Nutrition: Low in calories, high in vitamin C, and contains antioxidants.
2. Minute Maid Apple Juice
- Description: Apple juice is a sweet beverage made from pressed apples. It can be consumed as-is or used in cooking and baking.
- Uses: Drink on its own, used in smoothies, baked goods, and sauces. Sometimes served chilled or as a base for fruit punches and cocktails.
- Nutrition: Contains natural sugars, small amounts of vitamins (notably vitamin C), and fiber (if unfiltered).
3. Minute Maid Orange Juice
- Description: A popular citrus juice made by squeezing fresh oranges. It is often consumed for breakfast or as a refreshing drink throughout the day.
- Uses: Primarily as a beverage, but also in marinades, salad dressings, and desserts. Can be used as a component in cocktails.
- Nutrition: High in vitamin C, potassium, and folate. Contains natural sugars but is relatively low in calories when unsweetened.
4. Apples
- Description: Apples are a kind of round fruit that come in hundreds of different colours. They are eaten as healthy snacks, usually everyday.
- Uses: Eaten plain or can be juiced. Added to salads and pies. Used in many deserts.
- Nutrition: High in dietary fiber, and natural sugars. Low in calories and a good source of Vitamin C.
5. Oranges
- Description: Oranges are a sphere shaped, citrus fruit. They have a tangy flavour and are usually sweet.
- Uses: Eaten raw, made into juice and added to many citrus desserts and different kinds of cakes.
- Nutrition: Very high in Vitamin C and natural sugars. Also consists of Vitamin B6 and Calcium.
6. Grapes
- Description: Grapes are small, round fruits that come in a variety of colors (green, red, purple, black). They can be eaten fresh, dried (raisins), or juiced.
- Uses: Eaten raw, made into juice or wine, added to salads, or dried as raisins. Sometimes used in savory dishes or desserts.
- Nutrition: High in antioxidants (such as resveratrol), vitamin C, and natural sugars. Low in calories and a good source of hydration.
7. Banana
- Description: Bananas are long, curved fruits with smooth, yellow, and sometimes slightly green skin. They are yellow when ripe and are a healthy snack with a sweet flavour.
- Uses: Bananas are eaten raw or cooked in recipes varying from curries to banana chips, fritters, fruit preserves, or simply baked or steamed.
- Nutrition: Bananas are a healthy source of fiber, potassium, vitamin B6, vitamin C, and various antioxidants and phytonutrients.
8. Cucumber
- Description: Cucumbers are refreshing, crunchy vegetables with a high water content, typically green in color. They have a mild, slightly sweet flavor.
- Uses: Commonly used in salads, sandwiches, or pickled. Can be eaten raw or cooked (though often consumed raw).
- Nutrition: Low in calories, contains vitamin K, and high in water (about 95% water content). It also provides small amounts of vitamin C and potassium.
9. Tomato
- Description: A red or yellow fruit (botanically speaking) commonly used as a vegetable in savory dishes. Tomatoes are juicy, slightly tangy, and versatile.
- Uses: Used in salads, sauces, soups, and as a topping for sandwiches and burgers. Can be eaten raw or cooked.
- Nutrition: High in vitamin C, potassium, and lycopene (an antioxidant). Low in calories and a good source of hydration.
10. Salad Dressing
- Description: A condiment typically made from oils (olive oil, vegetable oil), vinegars (such as balsamic, red wine, or apple cider), and various seasonings. Sometimes includes dairy (like buttermilk or cream) or emulsifiers (like mustard or egg yolk).
- Uses: Used to dress salads, drizzle over roasted vegetables, or as a marinade for meats and tofu.
- Nutrition: Can be high in fats (from oils) and calories, especially creamy dressings. Some varieties are rich in vitamins A and E, depending on the oils used.
11. Melted Vanilla Ice Cream
- Description: Vanilla ice cream, when melted, turns into a creamy, liquid form. It is typically made from milk, cream, sugar, and vanilla flavoring.
- Uses: Melted ice cream can be consumed as a drink, used in milkshakes, poured over desserts, or as a base for custards and sauces.
- Nutrition: High in sugar, fats, and calories. Provides small amounts of calcium and protein.
12. Peanut Butter
- Description: A spread made from ground peanuts, often with added salt, sugar, and oil. It can be smooth or chunky.
- Uses: Used on sandwiches, in baking, smoothies, or as a dip for fruits and vegetables. It is also a key ingredient in many sauces and dressings (e.g., satay sauce).
- Nutrition: High in healthy fats (monounsaturated and polyunsaturated), protein, and fiber. Rich in vitamins and minerals, particularly vitamin E, magnesium, and potassium.
13. Honey
- Description: A natural sweetener produced by bees from the nectar of flowers. Honey has a distinct sweetness and can vary in color and flavor depending on its floral source.
- Uses: Used as a sweetener in tea, desserts, or spreads. It is also used in cooking and baking or as a glaze for meats.
- Nutrition: High in natural sugars (fructose and glucose), with trace amounts of vitamins, minerals, and antioxidants. Contains small amounts of antibacterial properties.
14. Natural Milk
- Description: A white liquid produced by the mammary glands of female mammals for feeding their young beginning immediately after birth.
- Uses: Commonly used in tea, coffee, or just drank plain. Can also be used in baking or as a base for making cheese.
- Nutrition: Rich in high-quality protein but also an excellent source of vitamins and minerals, such as calcium, vitamin B12, and riboflavin.
Conclusion:
Managing blood glucose levels is central to the treatment of diabetes. A diet focused on low-GI foods can help control blood sugar spikes, reduce insulin resistance, aid in weight management, and minimize the risk of complications. In addition to choosing the right foods, it is also important for people with diabetes to engage in regular physical activity, monitor their blood sugar, and work with healthcare professionals to develop an individualized management plan.
By understanding the relationship between food and blood sugar, individuals with diabetes can make informed dietary choices that support long-term health and improve quality of life.
Variables
These are the following variables in the study:
Manipulated Variables:
Types of foods that will be tested:
- Lemon Juice
- Apple Juice
- Orange Juice
- Apples
- Oranges
- Grapes
- Banana
- Cucumber
- Tomato
- Salad Dressing (Diluted)
- Melted Vanilla Ice Cream (Diluted)
- Peanut Butter (Diluted)
- Honey (DIluted)
- Natural Milk
Controlled Variables:
- Day of the experiment
- The amount of water in each cup/glass
- The amount of each snack
- The amount of glucose in each cup/glass
- The temperature of the water and each food (20 - 25°C)
- The type of cup/glass
- The time that the experiment starts
- Type and amount of glucose test strips used per trial
- Number of trials
- People testing glucose
Responding Variables:
- The amount of glucose that is found in each food
Procedure
Materials:
Measuring Glucose Concentration:
- Disposable cups, at least 8 oz. (8 plus one for each food or juice you want to test)
- Graduated cylinder, 100 mL (1)
- Scale, must be able to accurately measure 4 g.
- Urinalysis test strips that measure glucose (8 plus three for each food or juice you want to test)
- Graduated transfer pipettes, 3 mL (4)
- Thermometer
- Tap Water
Positive and Negative Controls:
- Optional: Knife and spoon
- Permanent marker
- Optional: Food coloring (color does not matter)
- Room-temperature tap water
- Glucose powder (30 g) (1)
- Thermometer
Foods and Juices to Test. Categorize as Fresh or Processed.
- Lemon Juice
- Apple Juice
- Orange Juice
- Apple
- Orange
- Grapes
- Cucumber
- Tomato
- Salad Dressing
- Melted Vanilla Ice Cream
- Peanut Butter
- Honey
- Sugar Water (Used for sweetening tea)
Procedure:
1) Gather all the food items and beverages that are scheduled for testing.
Making the Positive and Negative Controls:
2) To establish positive controls, utilize water and glucose powder. Begin by preparing a dilution series through sequential twofold dilutions, which will yield the following concentrations: 2%, 1%, 0.5%, 0.25%, and 0.125%.
3) Label five cups: 2%, 1%, 0.5%, 0.25% and 0.125%.
4) Add 4 grams (g) of glucose to 200 mL of water in the cup labeled 2% and stir until the glucose dissolves completely. If necessary you may add more glucose. Make sure to keep track of how much glucose is used in each dilution if more is added. Below is an image of the glucose being transferred from the paper towel to the 2% solution.

5) Optional: Incorporate 2 to 5 drops of food coloring into the 2% glucose solution. The specific color is not important. This addition will assist in monitoring the dilution levels, as the intensity of the color will diminish with each dilution. Importantly, it will not affect the glucose measurements.
6) Pour 100 mL of water into each of the remaining four cups.
7) Using a graduated cylinder, measure out 100 mL of the 2% solution and combine it with the 100 mL of water in the cup marked 1% to create a total of 200 mL of a 1% solution.
8) Mix thoroughly with a spoon.
9) Take 100 mL of the 1% solution and add it to the 100 mL of water in the cup labeled 0.5% to produce 200 mL of a 0.5% solution. Stir well. After each dilution, ensure to rinse the graduated cylinder or the container used for transferring the 100 mL amounts and shake off any excess water. Additionally, always use a clean stirrer.
10) To complete the procedure, continue applying the same method for the other dilutions. Once you finish, each cup will contain 100 mL of liquid, with the exception of the 0.125% solution, which will hold 200 mL.
11) Fill an extra cup with 100 mL water. Do not measure any glucose into it. Label it 0%. This will be a negative control.
12) Make sure to check the temperature of the control water to make sure it is in the range of 20 - 25°C.
Testing Positive and Negative Controls:
11) Dip a test strip into the solution in the cup labeled 2%. After 1–2 seconds, remove the test strips from the solution.
12) Tap the test strip on the rim of the cup to remove excess solution and watch it for 60 seconds.
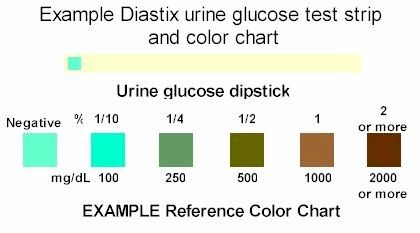
13) Then, match the color of the glucose marker on the test strip to the color on the glucose test strip bottle. For high glucose concentrations, it might take up to 90 seconds until the color matches the actual concentration.
14) Visit Extra Information on Reading Glucose Test Strips for guidance on matching the color of the glucose test strips to the color on the bottle.
15) If the color changes to the maximum range (2%) before 60 seconds, list it as greater than 2% (">2%").
16) Repeat step 4 for each of the five other cups.
17) If there is not a clear color change for any of the positive control solutions with a concentration greater than 0.125, repeat the procedure. If the second time it is still problematic, re-read the procedure steps 3-10 to make sure that the dilutions have been made properly. Below is an image of the controls that have been tested and made with certain amounts of glucose in them.

Testing the Foods for Glucose Concentration:
18) Pour 50mL of the liquid that you plan to test into a cup.
19) Get ready to start the stopwatch after you dip the test strip.
20) Dip the test strip into the liquid.
21) For the fresh fruits and vegetables, press the test strip against a freshly cut slice until the test strip is thoroughly wet.
22) When dealing with liquids that have very high glucose content, such as honey or regular soft drinks, as well as thick substances like peanut butter, molasses, or baby food, it is important to dilute these samples in water before conducting any tests. This process is outlined in the extra information at the end of this procedure. For instance, if you take 2.5 mL (which is equivalent to 0.5 teaspoon) of honey and mix it with 22.5 mL (or 4.5 teaspoons) of water, you create a dilution ratio of 1 to 10. To find the glucose concentration in the original sample, simply multiply the glucose concentration found in the diluted solution by 10. Additionally, ensure that the temperature of the water used for dilution is maintained between 20 and 25°C.
23) After 1–2 seconds, remove the test strip from the liquid or food, tap it on the rim of the cup to remove excess liquid, and immediately start the stopwatch.
24) Wait for the amount of time specified on the test strip directions, usually 60 seconds, or the reaction time you established while testing the positive controls.
25) Compare the color on the test strip with the color on the side of the container to determine the glucose concentration.
26) If the color changes to the maximum range (2%) before 60 seconds, list it as greater than 2% (">2%").
27) Repeat steps 1–6, of this section, for all foods and juices. Below is an image of the honey that had been tested for three trials (three test strips) and is diluted in a container with water due to the fact that it is a more viscous substance.

28) Throughout the procedure make sure to have a helper writing down all of the observations and surprises that might occur while testing the foods.
29) Complete these steps once again for the next trials.
Extra Information:
Reading Glucose Test Strips:
When matching the color of a glucose test strip to a color on the bottle, keep in mind these helpful tips:
- The colors on the bottle will not exactly correspond to the percent glucose solutions you made. Some test strip colors may fall between two of the colors on the bottle, for example between 0.5% and 1%. If this happens, write down the two numbers in your lab notebook and calculate their average.
- If the color changes to the maximum range (2%) before 60 seconds, list it as greater than 2% (">2%"). If this happens in the Experimental Procedure, you may need to then perform a dilution and re-test the sample. You will get more accurate results if you start diluting your samples once the glucose concentration is getting close to 1%.

Dilutions
When testing solutions, you might need to dilute your sample to get a more accurate reading.
Use a 1:10 dilution when you expect the sample to have a very high glucose concentration (e.g. non-diet soft drinks) or are viscous (e.g., peanut butter, honey, or molasses).
- There is one way in which you may perform a 1:10 dilution stated below.
- Mix 1/2 teaspoon (tsp.) (2.5 mL) of the sample with 22.5 mL water to make a 1:10 dilution.
Remember that if the 1:10 dilution reading reports 1% glucose, then the glucose in the sample is 10%, because it was diluted tenfold.
Observations
Observations:
Our experiment began at 1:00pm and was completed by 6:00pm.
The temperatures of each control is stated below in degrees celsius.
2% control = 23.6°C
1% control = 23.4°C
0.5% control = 23.4°C
0.25 control + 23.6°C
0.125% control = 23.6°C
0% control = 23.6°C
0%. 0.125%. 0.25%. 0.5%. 1%. 2%
The temperatures of each liquid as well as the dilution liquids tested in the experiment are recorded below.
Peanut Butter Diluted - Water Trial 1 - 23.6℃ - 22.5mL of water
Peanut Butter Diluted - Water Trail 2 - 23.6℃ - 22.5mL of water
Peanut Butter Diluted - Water Trial 3 - 23.9℃ - 22.5mL of water
Honey - Water Trial 1 - 23.5°C - 22.5mL of water
Honey - Water Trial 2 - 23.5°C - 22.5mL of water
Honey - Water Trial 3 - 23.5°C - 22.5mL of water
Ranch- Water Trial 1- 23.1°C - 22.5mL of water
Ranch- Water Trial 2- 23.1°C - 22.5mL of water
Ranch- Water Trial 3 - 23.1°C - 22.5mL of water
Melted Ice Cream- Water Trial- 23.0°C - 22.5mL of water
Melted Ice Cream- Water Trial- 23.7°C - 22.5mL of water
Melted Ice Cream- Water Trial- 23.7°C - 22.5mL of water
Natural Milk - Trial 1 - 21.3°C - 50mL
Natural Milk - Trial 2 - 21.3°C - 50mL
Natural Milk - Trial 3 - 21.3°C - 50mL
Lemon Juice - Trial 1 - 20.6°C - 50 mL
Lemon Juice - Trial 2 - 20.6°C -50 mL
Lemon Juice - Trial 3 - 20.6°C -50 mL
Orange Juice - Trial 1 - 23.1°C - 50 mL
Orange Juice - Trial 2 - 23.1°C - 50 mL
Orange Juice - Trial 3 - 23.1°C - 50 mL
Apple Juice - Trial 1 - 24°C - 50mL
Apple Juice - Trial 2 - 24.1°C - 50mL
Apple Juice - Trial 3 - 24.1°C - 50mL
Below we have recorded the results of all the processed foods compared to the natural foods. After we studied our results we came to the conclusion of pracessed foods have more glucose than the natural foods due to added sugars and preservatives. Note that the percentages below are the averages of all the processed or natural foods in a trial.
Trial 1 Processed Foods: 4.1464%
Trial 1 Natural foods: 1.6875%
Trial 2 Processed Foods: 3.4821%
Trial 2 Natural Foods: 1.8393%
Trial 3 Processed Foods: 3.875%
Trial 3 Natural Foods: 1.6875%
The following are the results obtained from the experiment. For our diluted foods, once we had them tested we multiplied the concentration found by ten as we had created a 1:10 ratio dilution. (Glucose Concentration x 10)
Note that results are in terms of percentages.
Trial 1
|
Type of Food: |
Glucose Concentration: Predicted |
Glucose Concentration: Experimental |
Observations: |
|
Jif Peanut Butter (Diluted) |
High |
% 0.625 |
Diluted 1:10 Ratio Had less glucose than expected |
|
Beemaid Honey (Diluted) |
High |
%8 |
Diluted 1:10 Ratio Had more glucose than expected |
|
Real Dairy Melted Vanilla Ice Cream (Diluted) |
High |
% 5.25 |
Diluted 1:10 Ratio Less glucose than expected |
|
Little House Ranch Salad Dressing (Diluted) |
Low |
% 7.5 |
Diluted 1:10 Ratio Had more glucose than expected |
|
Cucumber (Thin Slice) |
Low |
% 2.5 |
Had more glucose than expected |
|
Tomato (Thin Slice) |
Low |
% 2 |
Had expected amount of glucose Very Juicy |
|
Grape (Thin Slice) |
High |
% 2 |
Had expected amount of glucose |
|
Apple (Thin Slice) |
High |
% 1.5 |
Had expected amount of glucose Less glucose than apple juice |
|
Orange (Thin Slice) |
High |
% 2 |
Had expected amount of glucose Less glucose than orange juice |
|
Banana (Thin Slice) |
Low |
% 1.75 |
Had expected amount of glucose Not juicy, dry |
|
Minute Maid Apple Juice |
High |
% 3 |
Had expected amount of glucose More glucose than apple |
|
Minute Maid Orange Juice |
Low |
% 4 |
Had expected amount of glucose More glucose than orange |
|
RealLemon Lemon Juice |
Low |
% 0.65 |
Had expected amount of glucose Citric Acid played a factor in concentration |
|
Beatrice Natural Milk 1% |
Low |
% 0.0625 |
Had lower amount of glucose than expected |
Trial 2
|
Type of Food: |
Glucose Concentration: Predicted |
Glucose Concentration: Experimental |
Observations: |
|
Jif Peanut Butter (Diluted) |
High |
% 0.625 |
Diluted 1:10 Ratio Had less glucose than expected |
|
Beemaid Honey (Diluted) |
High |
% 8 |
Diluted 1:10 Ratio Had more glucose than expected |
|
Real Dairy Melted Vanilla Ice Cream (Diluted) |
High |
% 3.25 |
Diluted 1:10 Ratio Had less glucose than expected |
|
Little House Ranch Salad Dressing (Diluted) |
Low |
% 3.75 |
Diluted 1:10 Ratio Had more glucose than expected |
|
Cucumber (Thin Slice) |
Low |
% 3 |
Had more glucose than expected |
|
Tomato (Thin Slice) |
Low |
% 2 |
Had expected amount of glucose Very Juicy |
|
Grape (Thin Slice) |
High |
% 2 |
Had expected amount of glucose |
|
Apple (Thin Slice) |
High |
% 1.25 |
Had expected amount of glucose Less glucose than apple juice |
|
Orange (Thin Slice) |
High |
% 2 |
Had expected amount of glucose Less glucose than orange juice |
|
Banana (Thin Slice) |
Low |
%2 |
Had expected amount of glucose Not juicy, dry |
|
Minute Maid Apple Juice |
High |
% 3 |
Had expected amount of glucose More glucose than apple |
|
Minute Maid Orange Juice |
Low |
% 4 |
Had expected amount of glucose More glucose than orange |
|
RealLemon Lemon Juice |
Low |
% 0.75 |
Had expected amount of glucose Citric Acid played a factor in concentration |
|
Beatrice Natural Milk 1% |
Low |
% 0.0625 |
Had less glucose than expected |
Trial 3
|
Type of Food: |
Glucose Concentration: Predicted |
Glucose Concentration: Experimental |
Observations: |
|
Peanut Butter (Diluted) |
High |
% 0.625 |
Diluted 1:10 Ratio Had less glucose than expected |
|
Honey (Diluted) |
High |
% 8% |
Diluted 1:10 Ratio Had more glucose than expected |
|
Melted Vanilla Ice Cream (Diluted) |
High |
% 3.5 |
Diluted 1:10 Ratio Had less glucose than expected |
|
Little House Ranch Salad Dressing (Diluted) |
Low |
% 8.75 |
Diluted 1:10 Ratio Had more glucose than expected |
|
Cucumber (Thin Slice) |
Low |
% 2.5 |
Had more glucose than expected |
|
Tomato (Thin Slice) |
Low |
% 2 |
Had expected amount of glucose Very Juicy |
|
Grape (Thin Slice) |
High |
% 2 |
Had expected amount of glucose |
|
Apple (Thin Slice) |
High |
% 1.25 |
Had expected amount of glucose Less glucose than apple juice |
|
Orange (Thin Slice) |
High |
% 2 |
Had expected amount of glucose Less glucose than orange juice |
|
Banana (Thin Slice) |
Low |
% 2 |
Had expected amount of glucose Not juicy, dry |
|
Minute Maid Apple Juice |
High |
% 1.5 |
Had expected amount of glucose More glucose than apple |
|
Minute Maid Orange Juice |
Low |
% 4 |
Had expected amount of glucose More glucose than orange |
|
RealLemon Lemon Juice |
Low |
% 0.75 |
Had expected amount of glucose Citric Acid played a factor in concentration |
|
Beatrice Natural Milk 1% |
Low |
% 0.0625 |
Had less glucose than expected |
Analysis
Data Analysis:
Our scientific question was “What Has the Highest Glucose Concentration: Processed Foods or Natural Foods (fruits, vegetables)? and How does this Relate to Diabetes Management?” For this question we created an experiment that would test different foods worldwide to see their glucose concentration using diastix glucose test strips.
In order to find our results we dipped or pressed the test strips against the food or drink and waited 90 seconds to be able to observe the colour of the test strip. Next we compared the colour to the colours of the controls to receive our results and recorded them in our graphs and tables.
The results from trial one showed that the food with the highest glucose concentration was the Beemaid honey which was processed with a concentration of 8 percent. The food with the lowest glucose concentration was natural milk with a glucose concentration of 0.0625 percent.
The outcomes from trial two presented Beemaid Honey to hold the greatest glucose contents with a total of 8 percent once again. The food containing the lowest glucose concentration was Natural Milk. Its glucose percentage was 0.0625 percent.
The aftermath of the third trial showed that the food with the highest glucose concentration was the Little House Ranch Salad Dressing, which had a glucose concentration of 8.75 percent. The food with the lowest glucose concentration was Beatrice Natural Milk with a percentage of 0.0625 percent.
Finally the average results demonstrate that Beemaid Honey had the overall greatest sugar content with a total average of 8 percent. Once again the average of the food containing the lowest glucose concentration was the Beatrice Natural Milk with a concentration of 0.0625%.
In conclusion our hypothesis was supported by our results from the processed foods, which showed higher glucose concentrations than the natural foods.

Conclusion
Conclusion:
Our scientific question was “What Has the Highest Glucose Concentration: Processed Foods or Natural Foods (fruits, vegetables)? and How does this Relate to Diabetes Management?” The inquiry into this matter arose from our personal experiences, as both of our families have members who have encountered the difficulties associated with diabetes, a condition that affects numerous individuals around the world. In reviewing the existing research, we generated our hypothesis which we stated as: “If a food contains preservatives, it will have a greater glucose concentration.”
Based on our experiments, we found evidence to support our hypothesis.The results of our experiment indicated that upon thorough analysis (3 glucose readings for each food item) and averaging the data, processed foods indeed demonstrated a higher glucose concentration compared to natural foods. Specifically, the total glucose concentration average percentage for processed foods was found to be 3.8345%, while for natural foods, it was 1.7381%. Notably, honey emerged as the food with the highest overall glucose concentration, whereas natural milk was recorded as the food with the lowest glucose concentration.
We learned from our background research that preservatives, such as sodium benzoate or potassium sorbate are often added to extend the shelf life of products by preventing spoilage and inhibiting microbial growth. Furthermore, such preservatives contain high levels of glucose which is why we thought we received the results that we did. We created our hypothesis based on that information. Throughout our experiment there were a few unexpected outcomes such as the results for the natural milk and the ice cream. During the ice cream trial, we expected that this food item would have the highest glucose concentration however, it yielded a surprising average of 4%.
Our hypothesis was supported by our results from the processed foods, which showed higher glucose concentrations than the natural foods. This helps to educate people living with diabetes because although processed foods may taste better, natural foods can help you stay healthy and live a long life because they have lower glucose levels.
Application
Real Life Applications
This study is significant because it highlights the importance of awareness in managing diabetes. Diabetes is a serious illness that affects millions of people globally. Yet, many individuals do not take the necessary steps to manage their health effectively. Understanding diabetes is essential. Knowing what it is, what causes it, and recognizing the factors that increase the risk of developing the disease can lead to better prevention strategies. This project aims to educate people about the foods that promote better health and well-being over their lifetime. Proper nutrition plays a vital role for those affected by diabetes. Learning about healthy food choices can help individuals manage their condition more effectively. When people understand what food supports their health, they can make informed decisions. Education about diabetes and nutrition is empowering. By providing individuals with the knowledge they need, they can take control of their health. This understanding can lead to better choices, improved management of diabetes, and a healthier lifestyle.
Sources Of Error
Sources of Error:
There could have been various sources of errors in this study. Some of these are:
- Diluting the viscous samples tenfold to create a sample with a glucose concentration that can be measured with the glucose test strips allows you to measure higher concentrations. Unfortunately, these measurements can be less accurate. This is because the measured concentration from the diluted sample gets multiplied by 10 to obtain the concentration of the original sample, any inaccuracy in the measurement will also be multiplied by 10.
- Although we measured the water temperature in the controls, dilutions and liquids that were tested, the air temperature could have also altered our results due to the room temperature changing constantly.
- Another possible error is that our diastix test strips are usually used to measure urine. As we tested foods with higher glucose levels the results we recorded could possibly be a bit inaccurate.
Further Questions/Projects
Throughout our experiment, we came across several “further questions” that we would consider if we repeated my experiment. Here is some further experimentation that could possibly be done in the future.
- One possible further experiment is to repeat this experiment while comparing foods from the U.S.A. to the foods from Canada. This could ensure interesting results on which country adds more preservatives with glucose in their foods.
- A second possible experiment is comparing different snacks that state that they have no sugar or added preservatives and see if their glucose concentrations are higher or lower.
- A final project that could be created is comparing different brands of juices and see what brand could be the most healthy for those who suffer with diabetes.
Citations
Science Fair Works Cited
- Cleveland Clinic. “Blood Glucose Test: Levels & What They Mean.” Cleveland Clinic, 2022, my.clevelandclinic.org/health/diagnostics/12363-blood-glucose-test. Accessed 17 Jan. 2025.
- Cleveland Clinic. “Diabetes.” Cleveland Clinic, 17 Feb. 2023, my.clevelandclinic.org/health/diseases/7104-diabetes. Accessed 15 Jan. 2025.
- Delahanty, Linda. “Patient Education: Type 2 Diabetes and Diet (beyond the Basics).” Www.uptodate.com, 19 Jan. 2023, www.uptodate.com/contents/type-2-diabetes-and-diet-beyond-the-basics/print. Accessed 28 Dec. 2024.
- “Diabetes.” World Health Organization, 14 Nov. 2024, www.who.int/news-room/fact-sheets/detail/diabetes. Accessed 15 Jan. 2025
- Diabetes Canada. “About Diabetes.” DiabetesCanadaWebsite, 2024, www.diabetes.ca/about-diabetes. Accessed 28 Dec. 2024.
- “Diabetes 2024 Statistics Infographic.” American Heart Association, newsroom.heart.org/file/diabetes-2024-statistics-infographic?action=. Accessed 8 Jan. 2025.
- Garone, Sarah. “11 Ultra-Processed Foods to Avoid and 22 Healthier Swaps You Can Make.” Healthline, 18 Oct. 2018, www.healthline.com/health/food-nutrition/ultra-processed-foods. Accessed 8 Jan. 2025.
- Government of Canada. “Canada’s Food Guide.” Government of Canada, 2025, food-guide.canada.ca/en/. Accessed 3 Jan. 2025.
- International Diabetes Federation. “Mortality Attributable to Diabetes (20-79 Y): Deaths Attributable to Diabetes.” https://diabetesatlas.org/data/en/indicators/7/. Accessed 9 Jan. 2025.
- Mala, Alisa. “The Most Popular Fruit in the World.” WorldAtlas, 18 Aug. 2020, www.worldatlas.com/articles/the-most-popular-fruit-in-the-world.html. Accessed 8 Jan. 2025.
- Mayo Clinic. “Gestational Diabetes.” Mayo Clinic, 9 Apr. 2022, www.mayoclinic.org/diseases-conditions/gestational-diabetes/symptoms-causes/syc-20355339. Accessed 15 Jan. 2025
- MedlinePlus. “Glycemic Index and Diabetes: MedlinePlus Medical Encyclopedia.” Medlineplus.gov, 3 Nov. 2022, medlineplus.gov/ency/patientinstructions/000941.htm. Accessed 28 Dec. 2024.
- MyBib Contributors. “MLA Citation Generator – Easy & Free – (8th Edition, 2019).” MyBib, 26 May 2019, www.mybib.com/tools/mla-citation-generator. Accessed 16 Jan. 2025 and 3 Mar. 2025.
- National Library of Medicine. “PubMed .” PubMed Labs, 2025, pubmed.ncbi.nlm.nih.gov/. Accessed 6 Jan. 2025.
- “Nutrition.” South-East Asia Regional Office, 4 Dec. 2018, www.searo.who.int/entity/nutrition/en/. Accessed 11 Jan. 2025.
- Remmell, Michelle. “The Most Popular Juices across Continents.” Genemco, 3 Apr. 2024, genemco.com/blogs/news/the-most-popular-juices-across-continents. Accessed 8 Jan. 2025.
- Richards, Louisa. “What Are High Glycemic Index Foods and How to Avoid Them.” Www.medicalnewstoday.com, 8 Feb. 2021, www.medicalnewstoday.com/articles/high-glycemic-index-foods. Accessed 28 Dec. 2025.
- Science Buddies Staff. "Science Projects" Science Buddies, 7 Mar. 2023, https://www.sciencebuddies.org/science-fair-projects/project-ideas/. Accessed 25 Oct. 2024.
19. “What’s in Food | Nutrition.gov.” www.nutrition.gov, www.nutrition.gov/topics/whats-food. Accessed 9 Jan. 2025.
Acknowledgement
Acknowledgements:
We would like to extend our gratitude firstly to our wonderful school, Webber Academy for providing this amazing opportunity to practice the scientific method. Furthermore, we would like to show our appreciation to our science teacher, Mr. Jason Baillie for helping us every step of our process and always finding time to explain if we had a question. Another thank you goes to the CYSF community for their contribution such as approving our project and taking time to look at our idea. Lastly, this project could not have been done without the support of our parents, family and friends.