Using the SUIT Toolbox in SPM12 to Analyze the Effects of Methylphenidate Use, Dosage, and Duration on Cerebellar Structures and Volume
Robert Lin
Grade 11
Presentation
Problem
Abstract
Impacting up to 8.4% of children worldwide, attention deficit hyperactivity disorder (ADHD) is among the most common neurodevelopmental disorders in the world. Methylphenidate is currently the most prescribed treatment for ADHD, acting as a reuptake inhibitor for dopamine and norepinephrine. In response to inconsistent reports on the effects of methylphenidate (MPH) on the cerebellar structure of individuals with ADHD, this present study aims to combine detailed medical histories of patients with the SUIT toolbox to definitively correlate MPH dosages and usage duration with changes in localized cerebellar volume. From the various statistics and analytical tools used, the following results were obtained: (1) a statistically significant decrease (p=0.02) in cerebellar volume localized the left lobule IV and left IX regions can be found between neurotypical individuals and MPH-using ADHD individuals; (2) a statistically significant decrease (p=0.02) in cerebellar volume localized the right fastigial region can be found between MPH-using individuals with ADHD and drug-naive individuals with ADHD; (3) the median total cerebellar volume is lower in individuals who use MPH and highest in neurotypical individuals; (4) a strong positive correlation exists between medication dosage and the volume of the right fastigial nucleus (r=0.77), (5) a moderate positive correlation exists between medication intensity and regional volume in the Left I_IV region (r=0.58); and (6) a moderate correlation exists between medication duration and total cerebellar volume (r=0.67). Further analysis should focus on: (1) expanding the sample size of the study; (2) examining apoptotic and inflammatory factors in the most affected regions; (3) comparing the effect of MPH and amphetamines to see if the latter provides a suitable alternative.
Introduction
Attention deficit hyperactivity disorder (ADHD) is a neurodevelopmental disorder classified by differences in executive functioning and motivation, with estimates suggesting the condition affects up to 8.4% of children and 2.5% of adults (Harpin, 2005). From a neuroimaging standpoint, ADHD is classified by changes in overall brain volume, although these changes can be partially localized to some regions. Methylphenidate (MPH), a psychostimulant, is the most commonly used medication prescribed for ADHD treatment, oftentime under brand names such as Ritalin. As a reuptake inhibitor, MPH increases the concentration of dopamine in the synapse, which has dramatic effects on the dopaminergic pathway in the mesolimbic system. Despite the many benefits of MPH as a medication, existing literature demonstrates that particular doses and usage durations of MPH can have a variety of effects on brain structure and composition, many of which are still not fully understood. In particular, some existing works highlight the effects of MPH on the cerebellar structures, especially in the context of apoptosis pathways, cortical thickness, and increased disease risk (Raoofi et. al, 2020; Bahcelioglu et al. 2009; 2017; Reus et al., 2014; Quansah et al., 2018; Curtin et al., 2018; Mackey et al., 2013). The effects of MPH also appear to extend to the prefrontal cortex, hippocampus, and striatum (Motaghinejad et al., 2016; Schmitz et al., 2012; Lizanne et al., 2012). Much of this existing literature, however, is still contradictory and little consistency exists in the results from one study to another. Given the prevalence of MPH use in children with ADHD, as well as the continued gaps in scientific knowledge, these findings are cause for concern. As such, this project aims to examine the correlation between methylphenidate dosage and usage duration by performing volumetric analyses on T1 weighted MR images. To differentiate itself from the inconsistency existing in existing literature, results from the volumetric analysis will be coupled with detailed medication history to eliminate confounding variables. Ultimately, this project aims to (1) elucidate the structural changes that occur in the cerebellum; (2) identify how dosage and duration impact these structural changes, and (3) illuminate the possible mechanisms for harmful effects as a result of cerebellar degeneration.
Method
Overview
T1 weighted images from individuals between the ages of 5 and 18 were gathered or repurposed from two sources: a neuromelanin study and the TAGIT demographics study. Using the SUIT toolbox developed by Diedrichsen Lab for MATLAB, the volumes of the various regions of the cerebellum were extracted and analyzed.
Data Collection
Table 1: Demographic information for population sample used in MRI study
|
ADHD |
NT |
Both |
|
|
Number |
12 |
5 |
17 |
|
Age |
10.43 |
10.96 |
10.56 |
|
Sex (Female/Male) |
6/6 |
2/3 |
8/9 |
|
Medication (Yes/No) |
9/3 |
0/5 |
9/8 |
|
Past medication (Yes/No) |
8/4 |
0/5 |
8/9 |
|
Other Diagnoses (Yes/No) |
6/6 |
0/5 |
6/11 |
Phase I: Pilot Study
To gain a better insight into the correlation between methylphenidate use and duration with cerebellar structure changes, a pilot study using eight T1 MR images was first conducted. These eight images were originally collected for a separate study at BrainKids Lab, but was reused given it: (1) contains structural image data of children with ADHD, (2) includes children who both use and do not use methylphenidate, (3) comes with detailed patient information including duration and dose of the drug, and (4) was reliably collected and reused with the consent of the subjects. All eight of the images did not contain defects that prevented the data from being usable. It should be noted that subject number four had a metal retainer in their mouth during the MRI scan, but the distortion in the image mostly applies to the areas under the frontal lobes and does not disturb the cerebellum or brainstem. As such, this scan was not excluded.
Phase II: TAG-IT Demographics Data
Table 1.1: Exclusion criteria information used, organized by reason and category
|
Reason |
Number |
Category |
|
Previous concussions |
1 |
ADHD |
|
1 |
NT |
|
|
Previous head injuries |
2 |
ADHD |
|
0 |
NT |
|
|
Other diagnoses |
5 |
ADHD |
|
0 |
NT |
|
|
Unrecorded medication start date |
3 |
ADHD |
|
0 |
NT |
|
|
Unrecorded medication dose |
1 |
ADHD |
|
0 |
NT |
|
|
Incorrect medication type (eg. amphetamines) |
8 |
ADHD |
|
1 |
NT |
|
|
Total |
22 |
n/a |
In order to conduct many inferential statistics tests in an accurate manner, as well as to mitigate the effects of outliers, a larger sample size is required. In total, the TAG-IT study provided forty anatomical images. However, certain exclusion criteria must be applied to the scans in order when gathering data on methylphenidate-using individuals: (1) no artifacts or distortions may be present in the cerebellum in any of the three dimensions, (2) subject must currently be taking a methylphenidate stimulant medication for ADHD, (3) subject must include dose and duration of their current medication. Other exclusion factors may be implemented on a case-by-case basis, and will be noted if such a circumstance occurs (Table 2). A similar exclusion criteria must be applied when selecting data for the non-methylphenidate-using subjects: (1) no artifacts or distortions may be present in the cerebellum in any of the three dimensions, (2) subject must not be currently taking a methylphenidate stimulant medication for ADHD, or have taken the medication for an extended period of time in the past, (3) subject must not be on any additional psychostimulant medication, including amphetamines, (4) must explicitly state no prior medication history. Lastly, the TAG-IT demographics also includes data from non-ADHD patients which can be used as a negative control when interpreting results. Exclusion criteria for this group include: (1) no artifacts or distortions may be present in the cerebellum in any of the three dimensions, (2) subject must not be currently taking a methylphenidate stimulant medication for ADHD, or have taken the medication for an extended period of time in the past, (3) subject must not be on any additional psychostimulant medication, including amphetamines, (4) must not have a diagnosis for ADHD or any other neurocognitive disability (must be neurotypical).
Data Extraction
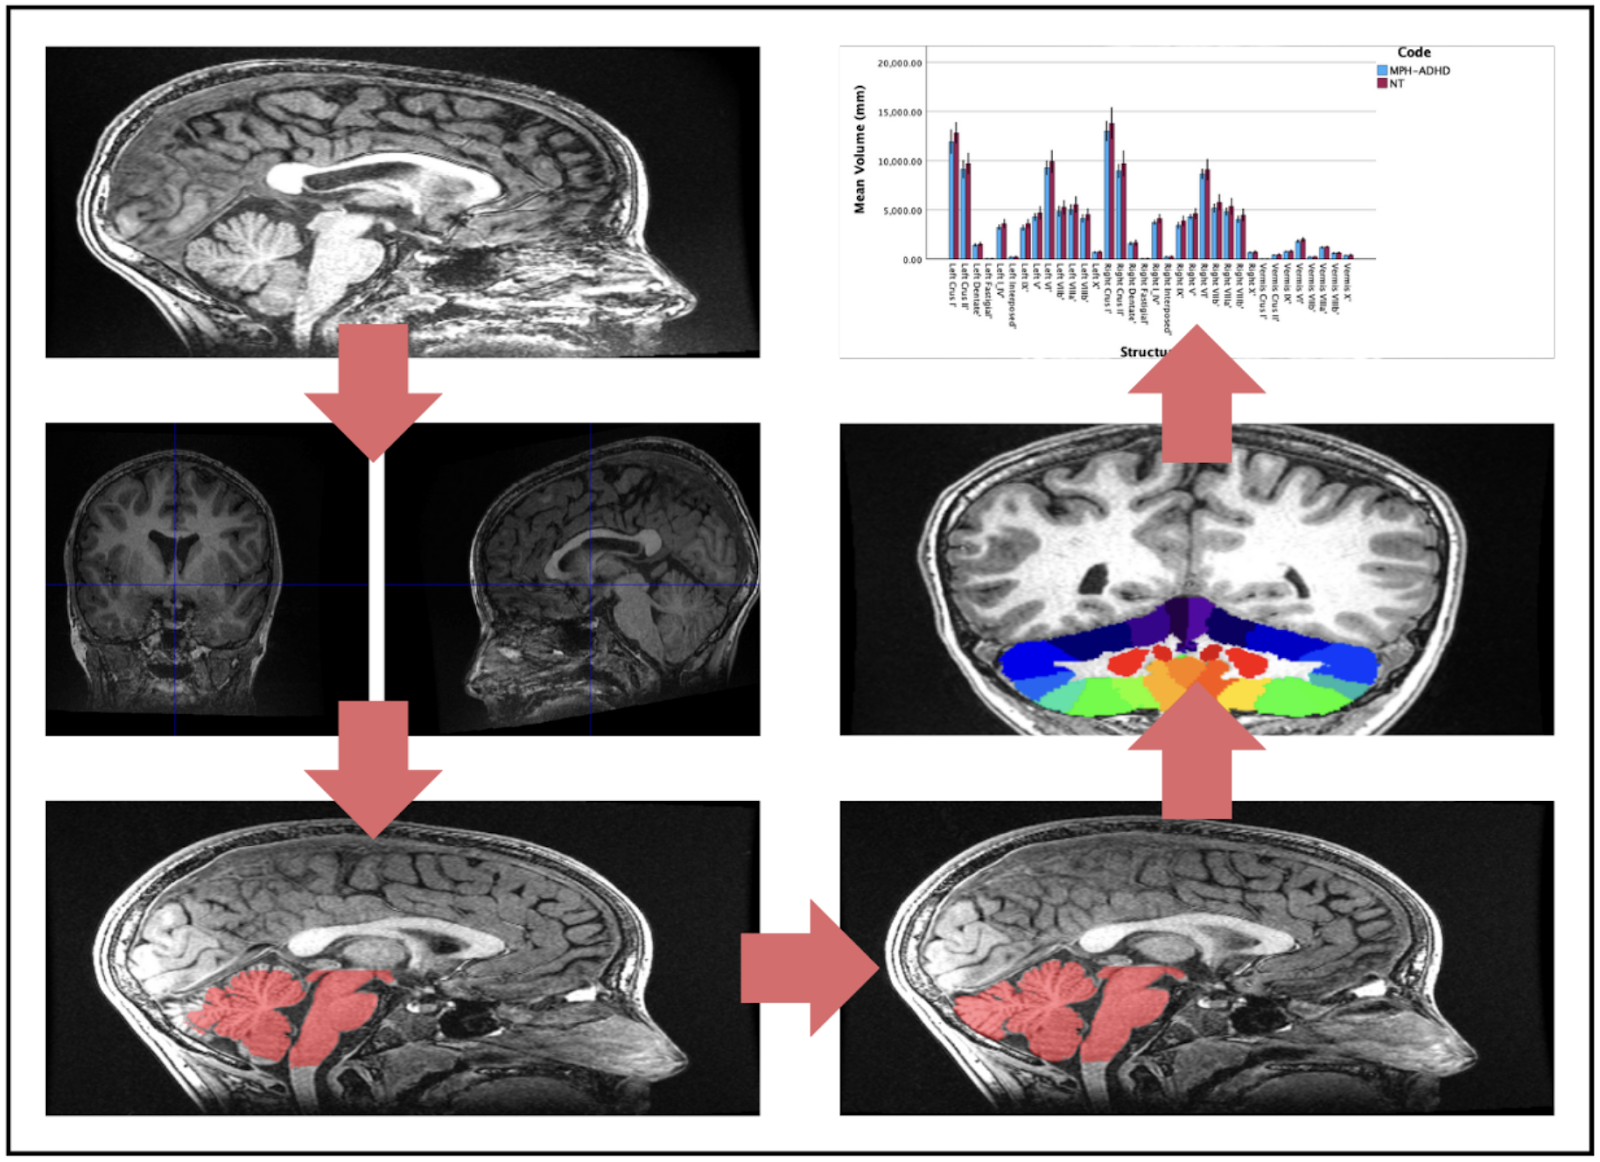
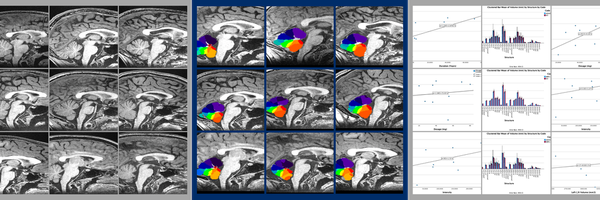
Fig. 1: Summary of SUIT Toolbox Processes. MRI anatomical images (Panel 1) are reoriented by setting the origin to the anterior commissure in SPM (Panel 2). The cerebellum is isolated from the rest of the brain using SUIT (Panel 3), and the cerebellar mask is edited by hand to correct for program errors in MRIcron (Panel 4). The cerebellum is normalized to the atlas and resliced into native space with different regions identified (Panel 5). SUIT provides volume measurements for each region, which are then graphed in SPSS 29 (Panel 6).
Choosing a software
SUIT is a specialized program developed by Diedrichsen Lab using voxel-based morphometry to analyze the cerebellum from one individual to another. Specialized cerebellar atlases are provided as part of the SUIT MATLAB toolbox, focused on the human cerebellum and brainstem. The brainstem is important as this is where the cerebellar peduncles link to the rest of the brain. SUIT was chosen as the software for analysis because it can: (1) Automatically isolate cerebellar structures from the cerebrum in an anatomical image; (2) Achieve accurate normalization of the cerebellum into the atlas space using the Dartel algorithm; (3) Display data on a surface-based flatmap representation; (4) Use VBM to determine patterns of growth or shrinkage; and (5) Uses atlas to assign probable locations to the different cerebellar lobules and nuclei. The most commonly used atlas template for brain imaging is the ICBM152 template, which was created by averaging 152 brains after affine normalization (corrections to size, translation, rotation, etc.). This regular template does not show any clear differentiation for the cerebellum making analysis of specific regions of the cerebellum difficult to impossible. In addition, the normalization of the template leads to large spatial spread of cerebellar folia, whereas the SUIT template places the folia much closer together and in a manner that is accurate. In order to do this, Diedrichsen lab developed a new atlas based on the average anatomy of twenty healthy individuals aged 22-45. Certain characteristics about this template enable it to be specialized to the cerebellum, such as how it: (1) is specifically based on brainstem and cerebellum, (2) preserves the anatomical accuracy of the cerebellum to a far greater extent than the ICBM152 template, and (3) reduces spatial variance and improves overlap of deep cerebellar nuclei.
Using the SUIT Program
Prior to using the SUIT program, all images must be reoriented so the origin is set to the anterior commissure. This process can be done in SPM 12 and ensures proper normalization. To use the suit program, the first function used is “suit_isolate_seg”. This function takes the original T1 weighted image and produces gray and white matter probability maps, representing the distribution of white and gray matter in the subject, as well as a cerebellar mask. In most cases, this cerebellar mask must be edited in MRIcron. The isolation function is performed in the native space of the original image, meaning that the image needs to be normalized to the cerebellar atlas in order to compare between various images. As such, the Normalization function “suit_normalize_dartel” deforms the image from the native space to suit space, changing location but not size. The Dartel algorithm uses the tissue segmentation maps -- in this case white matter and gray matter maps -- to find the nonlinear deformation in the form of a three-dimensional mathematical model known as a flowfield. The normalization function may encounter the common error message stating the image is stated too far apart, in which the origin of the original T1 weighted image must be reset to a bundle of white matter in the brain known as the anterior commissure. This normalization function produces an affine matrix and non-linear flowfield. It is important to note that the normalization feature does not reslice the image into the atlas space, but only calculates the changes that would be necessary to make such a change. The next step in the process is to reslice the image into SUIT space using the “suit_reslice_dartel_inv”. This function uses the products from the normalization function, as well as the SUIT cerebellar atlases and the original T1 weighted image, to reslice the image. This, in turn, produces a file that has split the cerebellum up into its specific volumes. Using the product of the reslice function as the input for the “suit_vol” function, the program generates the following information: number of voxels per region, volume in mm3 per region, and volume of one voxel. The key information here is the volume in mm3 per region, which should be recorded in a separate data table. Once both groups have been analyzed, a surface-based representation of the cerebellum can be created, which will allow for the display and comparison of volume-averaged cerebellar data between groups.
Editing Masks in MRIcron
Oftentimes, the cerebellar mask created during the isolation function is inaccurate, failing to account for the many fissures and contours of the cerebellum. As such, to ensure proper results, the cerebellar mask must be properly edited in a MRI viewing software. In this case, MRIcron was used. To edit masks in MRIcron, they must first be opened as a VOI under the drawings section. A regular T1 image has around 350 slices within the image, all of which must be edited. For the most accurate editing, it is recommended that the sagittal image be used for the drawing of new masks, while the axial and coronal views be used as a reference point to ensure accuracy.
Data Analysis
Finding Significant Regions of Interest
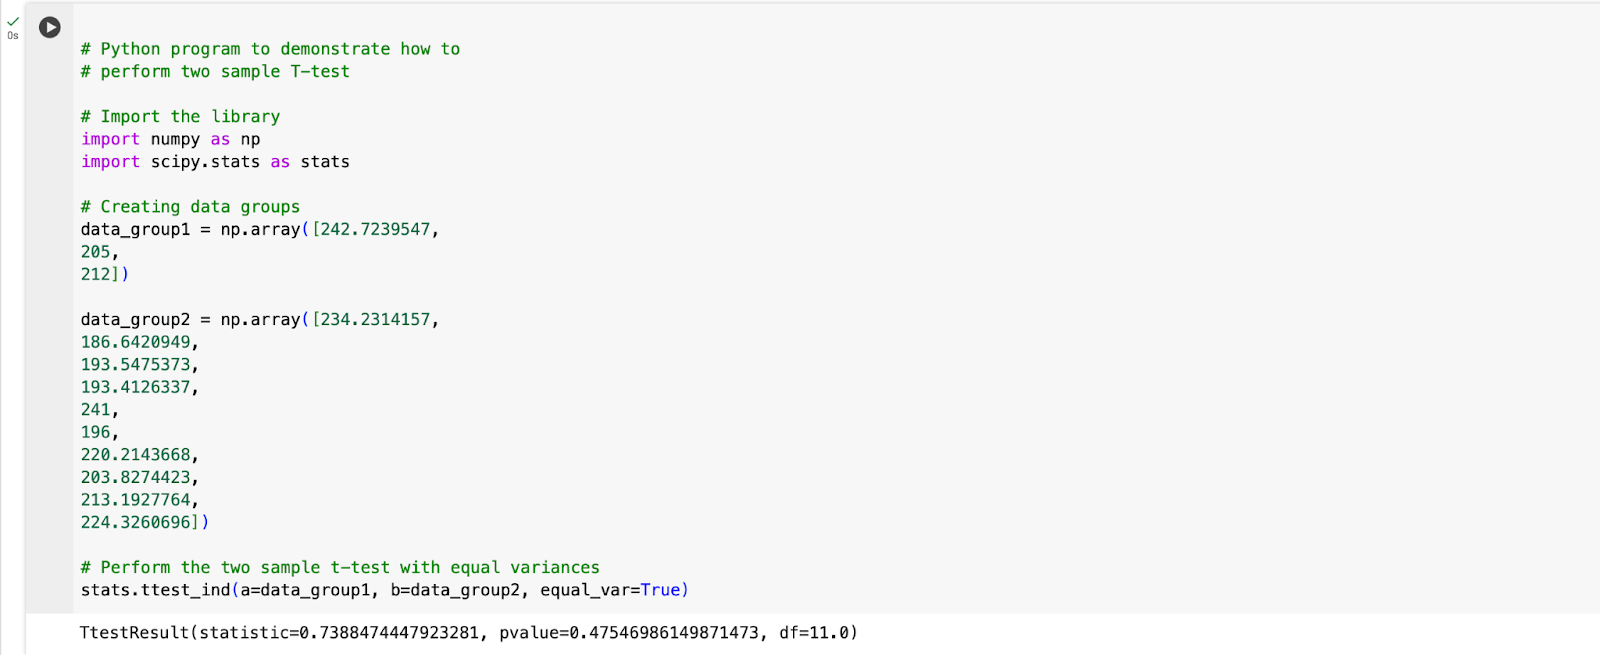
Fig. 1.1: Code for conducting a two-sample t-test performed in Google Colaboratory
After preliminary graphical analysis of the data, structures from each comparison group were identified as having the greatest change from methylphenidate-using individuals to psychostimulant-negative individuals with ADHD, assuming change has occurred. Graphical analysis was completed in SPSS 29, where the volumes of each cerebellar region were plotted against its respective structure in a clustered bar graph. Three bar graphs were plotted to compare: (1) ADHD and medication-free vs. MPH-using individuals with ADHD; (2) ADHD vs. neurotypical individuals; and (3) MPH-using individuals with ADHD vs. neurotypical individuals. In order to determine likely statistical significance within each structure, error bars representing a 95% confidence interval were used. Overlap between these error bars could be subsequently analyzed, with lower overlap corresponding to higher levels of significance. Statistical significance was further confirmed or refuted using a two-sample t-test with an alpha level of 0.05.
Analysis of Medication Dosage and Duration
Each region with statistically significant differences were represented visually using three graphs. The first scatterplot compared medication dosage (mg) against regional volume (mm3). The second scatter plot compared methylphenidate medication duration (years) against regional volume (mm3). The third graph involved a coding system, in which letters correspond to medication dosage and numbers correspond to medication duration. For the letter system, code A refers to no medication, code B refers to <30mg, code C refers to >30mg and <60mg, and code D refers to >60mg. For the number system, number 1 refers to <2 years, number refers to >2 years and <4 years, and number 3 refers to >4 years. Each letter and number will be uniquely paired, forming ten medication and dosage categories in total (A, B1, B2, B3, C1, C2, C3, D1, D2, D3). The average volume of the region of interest for all subjects meeting the criteria for each distinct category were then plotted as a bar graph with the aim of elucidating which combination of dosage and medication period have the greatest effect on cerebellar structure. A least-squares regression line was created for each scatterplot, allowing for the Pearson’s correlation coefficient (r value) and the R2 value, revealing the nature and strength of the correlation.
Analysis of Whole-Cerebellar Volume
Total cerebellar volume was calculated by using the sum tool in Excel. These values were used to create a boxplot for each group (ADHD, MPH-ADHD, NT) in SPSS with the goal of displaying distribution skews and potential outliers, as well as variability.
Research
Attention Deficit Hyperactivity Disorder (ADHD)
Attention deficit hyperactivity disorder (ADHD) is a chronic and debilitating disorder that affects individuals in areas such as academic and professional achievements, interpersonal relationships, and daily functioning (Harpin, 2005). Estimates suggest that 8.4% of children have ADHD, while a lower proportion, 2.5% of adults have the condition. In particular, the disorder leads to decreases in executive function and changes motivation patterns. While some theories postulate the genetic basis for the condition, the true cause remains unknown. With the exclusion of Parent-Child Interaction Therapy (PCIT) for preschool-aged children, the most commonly prescribed medications for ADHD are psychostimulants, usually amphetamines and methylphenidates. Twin studies show heritability estimates of 0.6 to 0.9, with the most studied genetic variations being those occurring in the dopamine D4 receptor and dopamine transporter (DAT1). A literature review from 1991 to 2004 show the four most associated genes are the dopamine D4 and D5 receptors, and the dopamine and serotonin transporters, although new findings suggest the role of COMT, an enzyme that is involved in metabolizing catecholamine neurotransmitter, val 158/108 met variant in influencing conduct problems. The most consistent finding between individuals with the condition is an overall reduction in total brain size that continues into adolescence, as well as reduced dimensions of specific brain regions, including: the caudate nucleus, prefrontal cortex white matter, corpus callosum and the cerebellar vermis. The structures with decreased size are most commonly those with a high density of dopamine receptors, such as the caudate nucleus. In addition, decreased blood flow to the striatum and changes in its affinity for dopamine has also been observed. A regional decrease in cortical thickness has been associated with the DRD4-7 repeat allele, which is commonly associated with the diagnosis of ADHD.
Dopamine Reward Pathway
The mesolimbic system, or reward system, is composed of brain structures responsible for mediating the physiological and cognitive processing of rewards. Usually, rewards result in an adjustment of an individual’s behavior so that they search for a particular stimulus. Though the mesolimbic system requires the coordinated release of many heterogeneous neurotransmitters, dopamine plays a key role in the reward value of food, drink, sex, social interaction, and substance abuse. As such, the mesolimbic system primarily refers to the dopaminergic pathway, which is formed by projections of midbrain dopamine neurons of the ventral tegmental area (VTA) to the striatum, prefrontal cortex, amygdala, hippocampus, and many structures of the limbic system. When a reward is obtained, the dopamine neurons will release dopamine to the desired target nuclei. The striatum is a key area of the dopaminergic pathway. The ventral striatum, which includes the nucleus accumbens (NAcc), a structure known for its role in evaluation and incentive based learning. Similarly, the dorsal striatum is critically involved in action selection and habitual behavior. Virtually all outputs from the striatum are medium spiny neurons (MSNs), which produce γ-aminobutyric acid (GABA). The striatum gives rise to two main pathways: the direct pathways is formed by dopamine D1 receptor (D1R) expressed in medium spiny neurons (dMSNs), while the indirect pathway is formed by dopamine D2 receptor (D2R) expressed in medium spiny neurons (iMSNs). The coordinated dopamine signaling to dMSNs and iMSNs within the striatum helps with integrating and responding to rewards. The remaining neurons in the striatum are interneurons, which regulate MSN activity. Majority of these interneurons are inhibitory GABAergic interneurons, which control reward by signaling to MSNs and expressing a variety of modulatory peptides. 1-2% of the neurons in the striatum are formed by tonically active cholinergic interneurons, which are critical in regulating MSNs despite their low abundance
Some abnormalities exist in the mesolimbic system for individuals with ADHD. Usually, the repetition of a positive stimulus means the time of the reward (dopamine release) transfers to earlier and earlier predictors of the reward. If the reward is silenced in some trials, dopamine cells stop firing to the point where an expected reward is no longer developed. The dopamine transfer deficit theory suggests that the transfer of the cell’s response to dopamine fails to predict the reinforcement that will occur in children with ADHD. Some genetic basis exists for this change, but these differences do not appear major enough to result in the behavior of children with ADHD. The free diffusion of dopamine from synaptic cleft into surrounding extracellular tissue is the main mechanism by which dopamine acts on cells. Dopamine transporters (DATs) are responsible for terminating the dopamine signal. In many diagnosed with ADHD, the dopamine transporter 1 (DAT1) gene varies in length due to a variable number tandem repeat (VNTR) of a 40 base pair repeat. A VNTR is a location in DNA where a short nucleotide sequence is organized as a tandem repeat, or a sequence of DNA bases that are repeated numerous times in a head-to-tail manner on a chromosome, with variations in length between individuals. The alleles with 10 copies (10R) have been associated with ADHD. In vitro, it was found that DAT binding site density for the 10R polymorphism was elevated 50% over that of the 9R allele. In addition, individuals homozygous for the 10R allele showed significantly hypoactivation in the left dorsal anterior cingulate cortex (dACC), a structure found in the cerebral cortex associated with executive function, compared to 9R carriers. Hypoactivation was also shown in the left cerebellar vermis and right lateral prefrontal cortex.
Five dopamine receptors have been identified and classified into D1-like and D2-like groups, with the former group containing D1 and D5 receptors, and the latter group containing D2, D3, and D4 receptors. It is important to note that dopamine receptors are GCPRs, and each have different biochemical properties, as well as selective agonists and antagonists. D1 and D2 receptors are more or less uniformly expressed throughout the striatum at high levels, and can be found in lower levels in the prefrontal cortex. Polymorphisms, or the presence of two or more variant forms of a specific DNA sequence that can occur among different individuals or populations, of D4 and D5 are associated with ADHD. D4 is expressed at very low levels in the striatum but at moderate levels in the prefrontal cortex. D4 is expressed presynaptically in the terminals of the corticostriatal afferents, giving it regulatory powers over both the presynaptic and postsynaptic neuron. This receptor is associated with the rapid translocation of the Ca2þ/calmodulin-dependent protein kinase II (CaMKII) from the cytosol to postsynaptic sites in prefrontal cortex neurons, which activates synaptic proteins responsible for developing plasticity. In contrast, D5 receptors are expressed in cortex, hippocampus, and striatum. Coupled to adenylyl cyclase, D5 receptors will result in increased cyclic AMP levels upon activation. This process is key for the development of plasticity for the dopamine pathway, as well as the development of long term potentiation between the cerebral cortex and striatum.
Methylphenidate
Methylphenidate is FDA approved for treating ADHD in children (>6 years of age) and adults (Verghese & Abdijadid). The basic mechanism blocks the reuptake of norepinephrine (NE) and dopamine (DA) is presynaptic neurons, increasing the concentration of DA and NE in the synaptic cleft cleft, thereby increasing the effect of both neurotransmitters on the next firing. Methylphenidate chemically derives from phenethylamine and benzylpiperazine, and undergoes metabolism by the liver to form ritalinic acid through de-esterification via carboxylesterase CES1A1. In addition, methylphenidate is a weak agonist at the 5HT1A receptor, which helps contribute to higher dopamine levels. Amphetamines (AMP) and Methylphenidates (MPH) seem to have comparable efficacy, though some studies state AMP has slightly greater effect. In preclinical studies, it was found that direct effects of the drug included inhibition of NET and DAT, affinity for agonist activity at 5-HT1A receptor, and redistribution of VMAT-2. The cumulative effect of these changes is elevated extracellular DA and NE levels. Activation of a2 adrenergic receptors was also observed, leading to stimulation in cortical excitability. In neuroimaging studies, MPH increases activation of the parietal and prefrontal cortices and increases deactivation of the insula and posterior cingulate cortex during visual attention and working memory tasks. When study participants were placed in an uncertain environment, MPH resulted in increased activation in left and right parahippocampal regions and cerebellar regions. In addition, it was found MPH resulted in increased regional CBF in the prefrontal cortex and increased CBF in the thalamus and precentral gyrus. MPH-associated improvements in working memory tasks corresponded with decreased oxy-hemoglobin levels in the right lateral prefrontal cortex, again indicating lower neural activation.
Cerebellum Anatomy

Fig. 2: Cerebellar anatomy
The cerebellum has no direct connections to lower motor neurons, but instead exerts influence through connections with the motor cortex and brainstem. As the largest structure in posterior fossa, the cerebellum is attached to dorsal pons and rostral medulla by three peduncles: the superior, middle, and inferior peduncles. The superior cerebellar peduncle carries output from the cerebellum, and decussates in the midbrain. In contrast, the inferior and middle peduncle carry inputs. The cerebellum consists of the midline vermis situated in between two larger cerebellar hemispheres, which are in turn divided into anterior and posterior lobes by the primary fissure, as well as the flocculonodular lobe by the posterolateral fissure.
There are three functional regions of the cerebellum. The vermis and flocculonodular lobes are respectively important in proximal and trunk muscle control and in vestibulo-ocular control. The intermediate part of the cerebellar hemisphere is involved in control of distal appendicular muscles in arms and legs, while the lateral part of the cerebellar hemisphere controls motor planning. All outputs of the cerebellum pass through the four deep cerebellar nuclei, starting from most lateral to most medial: dentate, emboliform, globose, and fastigial. The dentate nucleus is the largest of the cerebellar nuclei, and receives projections from the lateral hemispheres. The interposed nuclei consists of the emboliform and globose nucleus, which receive input from the intermediate parts of the cerebellum. Lastly the fastigial nucleus receives input from the vermis, as well as a lesser input from the flocculonodular lobe.
Cerebellar Circuitry
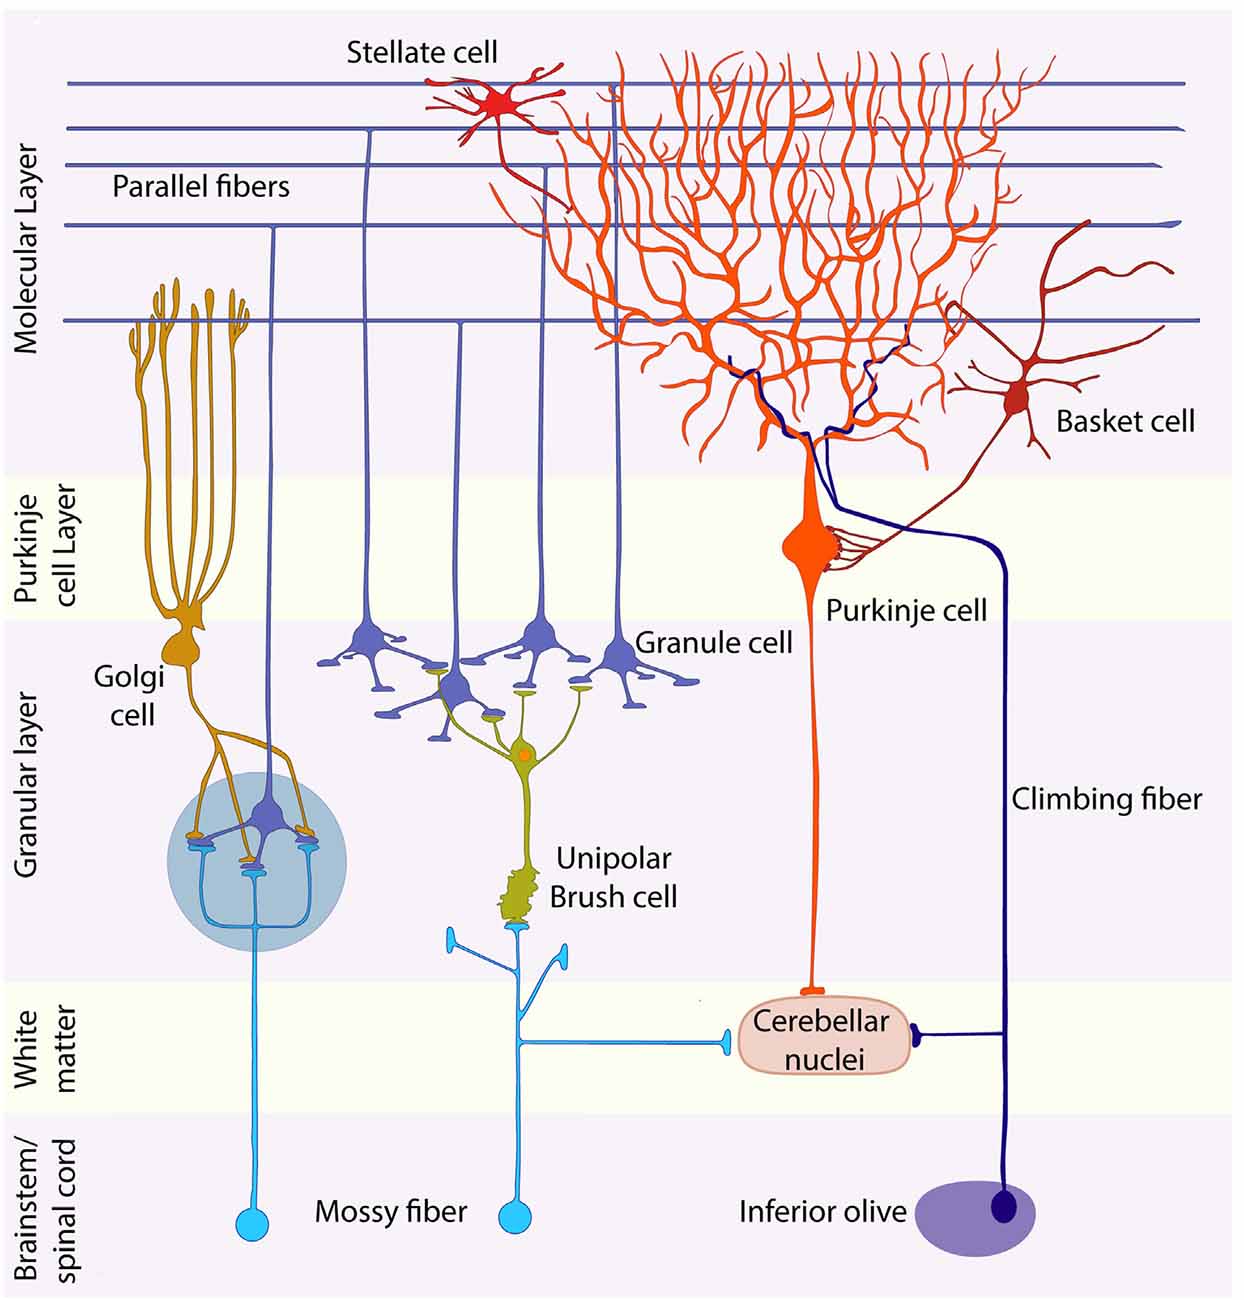
Fig. 2.1: Layers of the cerebellum and their constituent cells.
The cerebellar cortex has three layers. Starting from the innermost layer, the granule cell layer is tightly packed with small granule cells so numerous that they rival the total number of cells in the nervous system. Above the granule layer is the purkinje layer, which, as the name suggests, contains flask-shaped purkinje cells. Lastly is the molecular layer, which contains the unmyelinated axons of granule cells, dendrites of purkinje cells, as well as several types of interneurons. There are two types of synaptic inputs to the cerebellum, mossy fibers and climbing fibers. Mossy fibers ascend from various regions and pass through cerebellar white matter to form excitatory synapses with dendrites of granule cells. In turn, granule cells send axons into the molecular layer, which bifurcate, forming parallel fibers that run perpendicular to the dendrites of the purkinje cells. These fibers form many excitatory synapses with the purkinje cells they pass.
All outputs from cerebellar cortex carried by axons of purkinje fibers into the cerebellar white matter. Purkinje cells form inhibitory synapses with deep cerebellar and vestibular nuclei, which convey information from the cerebellum to other regions through excitatory synapses, regulating information exiting so as to avoid overstimulation. The other kind of input to cerebellum is climbing fibers, which arise exclusively from neurons in the contralateral inferior olivary nucleus. Climbing fibers wrap around the cell body and proximal dendritic tree of purkinje fibers, forming excitatory synapses. These cells have a strong modulatory effect on purkinje, and can cause significant decline in response to parallel fiber stimulation. Basket cells and stellate cells are located in the molecular layer, and are excited by synaptic input from granule cell parallel fibers. Signals then travel in the rostral-caudal direction, perpendicular to the parallel fibers, where they cause inhibition of adjacent purkinje cells. Golgi cells can be found at the granule cell layer. These cells receive excitatory signals from the parallel fibers, providing feedback inhibition on granule cell dendrites. The result of golgi cell’s inhibitory property is regulation of the temporal domain of signals, leading to enhanced signal resolution. Similarly, the result of stellate and basket cell inhibitory property is regulation of the spatial domain of signals, also leading to enhanced signal resolution. Complex synaptic interactions occur in the granule cell layer in a specialized region called the cerebellar glomerulus. Two types of inputs (large mossy fiber axon terminals and golgi cell axon terminals), which form synapses onto one type of postsynaptic cell (granule cell dendrites), which in turn excite inhibitory purkinje cells.
Table 2: Summary of Cerebellum Circuitry terms
|
Name |
Acts on |
Effect |
Originates |
|
Mossy Fibers |
Granule cells |
Excitatory |
White matter |
|
Granule cells |
Purkinje as parallel fibers in molecular layer |
Excitatory (on purkinje cells) |
Granule layer |
|
Purkinje cells |
Deep Cerebellar and Vestibular Nuclei |
Inhibitory |
Dendrites in molecular layer |
|
Climbing fibers |
Molecular layer (purkinje dendrites) |
Inhibitory |
contralateral inferior olivary nucleus |
|
Basket & Stellate Cells |
Purkinje fibers (cell body and dendrites respectively) |
Inhibitory |
Molecular layer Result = enhanced signal transmission on spatial plane |
|
Golgi cells |
Granule cell dendrites |
Inhibitory |
Granule layer Result = increased signal transmission on temporal plane |
|
Cerebellar glomerulus |
n/a |
Site of where mossy fiber, granule cell, purkinje cell interactions take place |
n/a |
Cerebellar Output Pathways
Cerebellum is ipsilaterally controlled, not contralateral, because it is double crossed. The first cross occurs when the superior peduncle decussates, while the second cross occurs as rubrospinal and corticospinal tracts descend to the spinal cord. Input to cerebellum is also ipsilateral for the same reason. The lateral cerebellar hemisphere projects to dentate nucleus, which in turn projects to the superior peduncle. The superior peduncle decussates in the midbrain, and reaches its contralateral (compared to source) ventral lateral nucleus (VL) of the thalamus. The outputs from basal ganglia terminate in anterior VL, while cerebellar outputs terminate in the posterior VL. The VL in turn projects to the motor cortex and premotor cortex, supplementary motor area, and parietal lobe to influence motor planning in the corticospinal systems. Some evidence indicates that outputs from lateral cerebellum are also projected to the prefrontal association cortex, suggesting a role in cognitive function. Some fibers from the dentate nucleus also terminate in the parvocellular division of the red nucleus. The interposed nuclei project to superior peduncle which projects to the contralateral VL, which projects to motor cortex and premotor cortex, supplementary motor area to influence the lateral corticospinal tract. The cerebellar vermis and flocculonodular lobes influence proximal trunk muscles through connections to medial motor pathways (anterior corticospinal, reticulospinal, vestibulospinal, tectospinal tracts). The outputs from the fastigial nucleus are to a small extent carried by superior peduncle, but mainly carried by fiber pathways called the uncinate fasciculus and juxtarestiform body, which lies on the lateral wall of the fourth ventricle, just medial to the inferior peduncle.
Cerebellar Input Pathways
Inputs reach cerebellum from: Virtually all regions of cerebral cortex; Multiple sensory modalities; Brainstem nuclei; and the spinal cord. The input pathways have a rough somatotopic organization, with the general ipsilateral body being represented in both anterior and posterior lobes. The corticopontine fibers are the major input from frontal, temporal, parietal, and occipital lobes. These fibers travel to the ipsilateral pons and synapse in the pontine nuclei. Pontocerebellar fibers then cross the midline to enter the contralateral middle cerebellar peduncle and give rise to mossy fibers. Another major input are the spinocerebellar fibers. These fibers travel in four tracts: dorsal and ventral spinocerebellar tracts for lower extremities, as well as cuneocerebellar and rostral spinocerebellar tracts for upper extremities and neck. Afferent information about limb movement is conveyed to the cerebellum by the dorsal spinocerebellar tract for lower extremities and by the cuneocerebellar tract for upper extremities. The dorsal spinocerebellar tract ascends in the dorsolateral funiculus, near the surface of the spinal cord, lateral to the corticospinal tract. Meanwhile myelinated axons of sensory neurons carrying proprioceptive, touch, and pressure sensation from lower extremities ascend the gracile fasciculus. Some of these fibers form synapses with the nucleus dorsalis of Clark, which is a long column of cells that run in the dorsomedial spinal cord gray matter intermediate zone, from C8 to L2. Fibers arising from the nucleus dorsalis of Clark ascend ipsilaterally in the dorsal spinocerebellar tract, and give rise to mossy fibers that travel to the ipsilateral cerebellar cortex via the inferior peduncle. Fibers from upper extremities enter the cuneate fasciculus and ascend ipsilaterally to synapse in the external cuneate nucleus in the medulla. From the external cuneate nucleus, cuneocerebellar fibers ascend in the inferior cerebellar peduncle to the ipsilateral cerebellum. The inferior olivary complex gives rise to olivocerebellar fibers that cross the medulla to enter the contralateral cerebellum. These fibers form a major portion of the inferior peduncle and terminate as climbing fibers. Additionally, connections between vestibular system and cerebellum are important in balance and equilibrium, as well as optical reflexes. To be more specific, the flocculus also receives visual inputs related to retinal slip (disparity between target and perceived images) that are important for smooth pursuit eye movement.
MRI Physics
MRI provides images of body tissues and their chemical compositions with exceptional clarity and little risk to the patient. MRI was originally known as nuclear magnetic resonance imaging because it is a form of nuclear magnetic resonance spectroscopy. When a magnetized species exists, it can absorb the energy from a magnetic field of equal strength. NMR exploits the fact that different protons placed in a uniform magnetic field will feel slightly different levels of magnetism based on their location relative to the source, in a phenomenon called shielding. Some protons feel less of the applied magnetic field because they are in an environment rich with electrons, and their attraction to electrons override the applied magnetic field. The varying strengths of a magnetic field can reveal structural information, with absorption of low frequency suggesting heavily shielded species, and absorption of high frequency suggesting lightly shielded species. NMR is often calculated in relation to a specific compound, such as tetramethylsilane (TMS), which is highly shielded and the frequency of radiation it absorbs is often set to 0 on NMR instruments. Since frequency absorbed is proportional to the applied field, the shift or difference between the two values is recorded, and not the exact frequency. Protons in close proximity to electron donating groups (generally higher concentration of electrons) will be more shielded and vice versa.
The nucleus has a net positive charge, with each proton and neutron in the nucleus having its own spin. Net spin is represented by the spin number, I, which describes the angular momentum of the spinning charge. If the mass or atomic number is odd, I has a non-zero value. In contrast, if the mass and atomic number are both even, then the spin of the neutrons and protons will cancel out, resulting in zero net spin. A nucleus must possess overall spin to respond to NMR. The isotopes H-1 and C-13 both meet these criteria, but C-12 and O-16 do not. H-1 is found in macromolecules all over the body, which allows for NMR to be used for imaging of human bodies. The allowed spins for a given value are represented by 2I+1. When I=0, there is only one spin state. In contrast, H-1 has an I value of ½, meaning it was two possible spin states.
Charged particles such as nuclei exhibit electric fields, which includes magnetic fields. An I value greater than one means that the magnetic moments can take on more than one orientation. In the absence of external forces, these varying spin states are of equal energy. When atomic nuclei are exposed to a magnetic field they will tend to orient themselves with the field to maximize stability and minimize energy use. When the magnetic field is applied, many of the protons (which are not aligned with the magnetic field) will want to flip orientation from high energy to low energy. Due to the law of conservation of energy, when these protons flip from high energy to low energy, energy must be released. This change in energy will be equal to the energy difference between high and low states. If a second magnetic field is applied perpendicular to the original magnetic field, and the second magnetic field rotates around the Z axis at the same rate as the protons precess about their z axis, the protons will feel as if the orientation of the second magnetic field is constant. Protons will still precess around the perpendicular magnetic field as well, though the degree to which the protons do so is determined by the strength of the magnetic field. As a result, when B1 (second magnetic field) is applied, the cone of magnetization is flipped and rotated. When B1 is removed, the protons will return to their lower energy configuration oriented along the z axis, releasing energy as they do so. This energy, or relaxation, is what MRI measures.
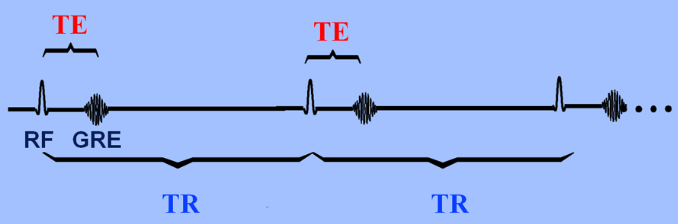
Fig. 2.2: Time to Echo (TE) versus Time to Repitition (TR)
In T1 MRIs, the applied magnetic field B1 that causes the flipping is in the radiofrequency range, known as an RF pulse. The T1 value is dependent on the material’s characteristics and calculated as the time to reach 63% longitudinal magnetization. Since MR signals are those created when precessing protons that have been exposed to an RF pulse releases energy during relaxation, these MR signals require energy to be exchanged as the protons move from high to low energy (spin lattice relaxation). Different molecules have different T1 values, and the T1 value depends on how tightly bound the H is bound to molecules. For example, water has a longer T1 relaxation time, and thus appears as dark on a T1 weighted image, while fat has a short T1 value and appears as bright spots. T2 is the time it takes for only 37% of the transverse magnetization vector to remain. Inhomogeneity in tissue causes the proton's spin to be influenced by small magnetic fields created by the spin from a nearby proton - the result of which is a longer T2 value. Time to echo (TE) is the difference between the peak of the 90 degree RF pulse and the peak of the echo formed, while TR is time to run a pulse sequence at one time. Images created predominantly using differences between T1 times is known as a T1-weighted image. A short TR ensures that not all tissues have the chance to return to full relaxation, meaning the tissues that have returned to this point will have released more energy than the ones who haven’t (released a greater echo). When T1 effects are minimized by having a long TE and TR, T2 weighted images are produced.
Data
RAW DATA
Table 3: Sample of raw data for one participant, organized to be input into SPSS 29. Complete raw data in logbook.
|
Participant |
Code |
Structure |
Volume (mm) |
|
1 |
NT |
Left I_IV' |
3510.79035 |
|
1 |
NT |
Right I_IV' |
4094.3919 |
|
1 |
NT |
Left V' |
4481.38088 |
|
1 |
NT |
Right V' |
4385.23993 |
|
1 |
NT |
Left VI' |
9497.34009 |
|
1 |
NT |
Vermis VI' |
2033.16457 |
|
1 |
NT |
Right VI' |
8786.93642 |
|
1 |
NT |
Left Crus I' |
12297.3803 |
|
1 |
NT |
Vermis Crus I' |
13.3384742 |
|
1 |
NT |
Right Crus I' |
13758.3763 |
|
1 |
NT |
Left Crus II' |
9380.23868 |
|
1 |
NT |
Vermis Crus II' |
461.823016 |
|
1 |
NT |
Right Crus II' |
9440.52165 |
|
1 |
NT |
Left VIIb' |
5114.87179 |
|
1 |
NT |
Vermis VIIb' |
228.832785 |
|
1 |
NT |
Right VIIb' |
5590.03328 |
|
1 |
NT |
Left VIIIa' |
5440.53843 |
|
1 |
NT |
Vermis VIIIa' |
1199.07686 |
|
1 |
NT |
Right VIIIa' |
5118.50956 |
|
1 |
NT |
Left VIIIb' |
4522.95535 |
|
1 |
NT |
Vermis VIIIb' |
620.325664 |
|
1 |
NT |
Right VIIIb' |
4539.93159 |
|
1 |
NT |
Left IX' |
3565.18361 |
|
1 |
NT |
Vermis IX' |
821.268912 |
|
1 |
NT |
Right IX' |
3825.89015 |
|
1 |
NT |
Left X' |
716.639842 |
|
1 |
NT |
Vermis X' |
358.06008 |
|
1 |
NT |
Right X' |
742.277428 |
|
1 |
NT |
Left Dentate' |
1528.72773 |
|
1 |
NT |
Right Dentate' |
1679.26194 |
|
1 |
NT |
Left Interposed' |
208.73846 |
|
1 |
NT |
Right Interposed' |
219.305303 |
|
1 |
NT |
Left Fastigial' |
40.3618765 |
|
1 |
NT |
Right Fastigial' |
38.976061 |
ANALYSIS
Analysis of Cerebellar Structures
Fig .3: Clustered bar graph of mean volumes of cerebellar structures (mm3), organized by subjects with ADHD and using methylphenidate (MPH-ADHD), and subjects with ADHD and not using any medication; 95% confidence intervals used for error bars.
Fig. 3 displays the mean volume of each cerebellar structure for the treatment groups of individuals with ADHD and individuals who use MPH and have ADHD. The 95% confidence interval shown in the error bars represents the range in which there is 95% confidence to state the parameter exists in this range. In other words, the true value for each volume value is represented almost entirely by the error bars. In all structures, some overlap exists between the error bars. Medium to minimal overlap in the error bars were identified in the following structures through visual analysis: Left crus II, Left L_IV, Left IX, Left V, Left VI, Left VIIIa, Left VIIIb, Right crus II, Right I_IV, Right IX, Right V, Right VIIb, Right VIIIa, and Right VIIIb. A notable feature of this graph is the large range encompassed by the 95% confidence intervals for ADHD treatments. In general, such an occurrence brings into question the validity and reliability of the data, possibly suggesting a need for a larger sample size.
Fig. 3.1: Clustered bar graph of mean volumes of cerebellar structures (mm3), organized by subjects with ADHD and using methylphenidate (MPH-ADHD), and neurotypical subjects (NT); 95% confidence intervals used for error bars.
Fig. 3.1 displays the mean volume of each cerebellar structure for the treatment groups of neurotypical individuals and individuals who use MPH and have ADHD. In most structures, some overlap exists between the error bars. Medium to no overlap in the error bars were identified in the following structures through visual analysis: Left crus II, Left L_IV, Left IX, Left V, Left VI, Left VIIIa, Left VIIIb, Right crus II, Right I_IV, Right IX, Right V, Right VIIb, Right VIIIaRight VIIIb. In comparison to Fig. 3, the error bars shown in this graph are smaller, which may be a product of the treatments in question having larger sample sizes. Overall, results taken from this comparison may have a comparably higher accuracy.
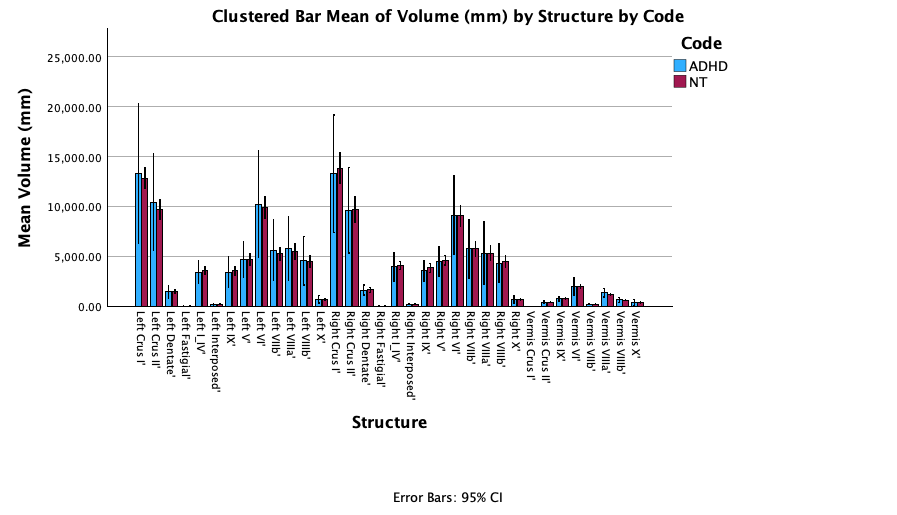
Fig. 3.2: Clustered bar graph of mean volumes of cerebellar structures, organized by subjects with ADHD and not using any medication (ADHD), and neurotypical subjects (NT); 95% confidence intervals used for error bars.
Fig. 3.2 displays the mean volume of each cerebellar structure for the treatment groups of neurotypical individuals and individuals who are medication-free and have ADHD. In most structures, some overlap exists between the error bars. Medium to no overlap in the error bars were identified in the following structures through visual analysis: Vermis VIIIa, Vermis VIIIb, Left crus II, Left VIIb, Right VIIIb. Similar to Fig. 3, error bars shown in this graph are substantial, with the ADHD treatment group again yielding an irregularly large range for the 95% confidence interval.
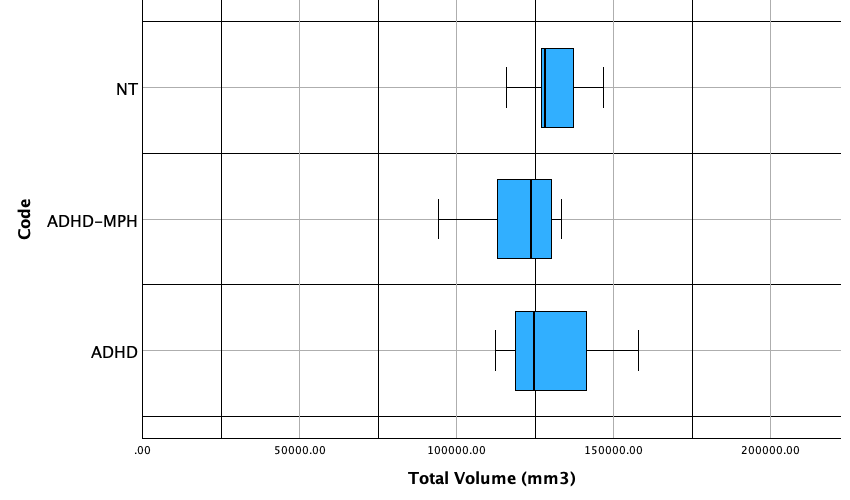
Fig. 3.3: Boxplot of total mean cerebellar volume, organized by subjects who: (1) have ADHD and do not use medication, (2) have ADHD and use methylphenidate, and (3) do not have ADHD and do not use medication.
Table 3.1: Summary statistics for overall cerebellar volume for each treatment group
|
Code |
n |
mean |
SD |
min |
Q1 |
med |
Q3 |
max |
|
NT |
5 |
131079.636 |
11627.971 |
115885.151 |
121516.859 |
128260.689 |
142051.887 |
146836.556 |
|
ADHD |
3 |
131759.201 |
23547.348 |
112524 |
112524 |
124734 |
158019.604 |
158019.604 |
|
MPH-ADHD |
10 |
120988.576 |
12360.127 |
94190.305 |
112954.727 |
123593.658 |
130126.747 |
133498.84 |
For neurotypical treatment, the distribution is approximately normal. No outliers were identified according to the 1.5 IQR rule. The distribution has an interquartile range (IQR) of 20535.028 and a standard deviation of 23547.348, indicating the data has a large spread. It should be noted that the software used for summary statistics, Stapplets, creates a boxplot differently from SPSS, leading to inconsistencies between the IQR in the summary statistics and the IQR in the box plot. For the ADHD-MPH treatment, the distribution is skewed to the left, with a large difference between the first quartile and minimum in comparison to the difference between the third quartile and maximum value. With additional samples, it is possible that the minimum value of 94190.305 could be considered an outlier. In the current distribution, however, no outliers exist. Based on the summary statistics, this group has an IQR of 17172.02, which is less than the spread of the first NT group. The medication-naive ADHD group has a right skewed distribution. No outliers are present in this dataset. The has an IQR of 45495.604 and a standard deviation of 23547.348. Both of these values are significantly higher than the other groups, indicating that values are more dispersed.
Due to the skewed distribution found in both ADHD and MPH-ADHD, median is a more accurate representation of center. Based on the median, overall cerebellar volume was highest in neurotypical individuals, then in individuals with ADHD, and lowest in MPH-using individuals.
Table 3.2: Structures with potential significant differences, observed visually from error bars in Fig. 3, Fig. 3.1, and Fig. 3.2
|
ADHD vs. NT |
MPH-ADHD vs. NT |
ADHD vs. MPH-ADHD |
|
|
(a) Confirmation |
Vermis VIIIa Vermis VIIIb Left crus II Left VIIb |
Left crus II Left L_IV Left IX Left V Left VI Left VIIIa Left VIIIb Right crus II Right I_IV Right IX Right V Right VIIb Right VIIIa Right VIIIb |
Left crus I Left crus II Left I_IV Left VI Left VIIb Left VIIIa Left VIIIb Right VI Right VIIb Vermis X |
|
(b) Not assessed |
Left fastigial Left interposed Right fastigial Right interposed Vermis crus I Vermis VIIb |
Left fastigial Left interposed Right fastigial Right interposed Vermis crus I Vermis VIIb |
Left fastigial Left interposed Right fastigial Right interposed Vermis crus I Vermis VIIb |
Through visual analysis of error bars, structural volume differences with potential significance were identified in Table 3.2a. Some structures could not be analyzed visually through the graph, and were analyzed on a case-by-case basis. Structures with potentially significant differences were chosen and further evaluated using a two-sample T-test, with the results shown in Table 3.3, 3.4, and 3.5.
Table 3.3: Two sample T-test values for relevant ADHD vs. NT structures (α=0.05)
|
Structure |
T-statistic |
p-value |
Significance (α=0.05) |
|
Vermis VIIIa |
-1.75 |
0.13 |
No |
|
Vermis VIIIb |
-0.714 |
0.50 |
No |
|
Left crus II |
-0.745 |
0.48 |
No |
|
Left VIIb |
-0.64 |
0.54 |
No |
Table 3.4: Two sample T-test values for relevant MPH-ADHD vs. NT structures (α=0.05)
|
Structure |
T-statistic |
p-value |
Significance (α=0.05) |
|
Left crus II |
0.95 |
0.36 |
No |
|
Left L_IV |
2.23 |
0.04 |
Yes |
|
Left IX |
2.20 |
0.047 |
Yes |
|
Left V |
1.59 |
0.14 |
No |
|
Left VI |
1.27 |
0.23 |
No |
|
Left VIIIa |
1.42 |
0.18 |
No |
|
Left VIIIb |
1.47 |
0.16 |
No |
|
Right crus II |
1.13 |
0.27 |
No |
|
Right I_IV |
1.11 |
0.29 |
No |
|
Right IX |
1.97 |
0.07 |
No |
|
Right V |
1.74 |
0.10 |
No |
|
Right VIIb |
1.86 |
0.08 |
No |
|
Right VIIIa |
1.82 |
0.09 |
No |
|
Right VIIIb |
1.77 |
0.10 |
No |
Table 3.5: Two sample T-test values for relevant MPH-ADHD vs. ADHD structures (α=0.05)
|
Structure |
T-statistic |
p-value |
Significance (α=0.05) |
|
Left crus I |
1.06 |
0.31 |
No |
|
Left crus II |
1.41 |
0.18 |
No |
|
Left I_IV |
0.99 |
0.34 |
No |
|
Left VI |
1.18 |
0.26 |
No |
|
Left VIIb |
1.48 |
0.16 |
No |
|
Left VIIIa |
1.44 |
0.17 |
No |
|
Left VIIIb |
1.12 |
0.29 |
No |
|
Right VI |
0.78 |
0.45 |
No |
|
Right VIIb |
1.25 |
0.24 |
No |
|
Vermis X |
0.60 |
0.55 |
No |
|
Right Fastigial |
2.14 |
0.05 |
Yes |
From performing a two-sample t-test at an alpha level of 0.05, it was found that a significant difference exists between MPH-using individuals with ADHD and neurotypical individuals in the regions encompassed within the fields of Left L_IV and Left IX. When comparing medication free individuals with ADHD and MPH-using individuals, a significant difference was found in the right fastigial nucleus. It should be noted that near-significant differences exist between individuals coded MPH-ADHD and NT in the following regions: Right IX, Right VIIb, and Right VIIIa.
Table 3.6: Results from further two sample t-tests on structures identified as many statistical significance, µ1>µ2
|
Comparison |
Structure |
T-statistic |
p-value |
Significance (α=0.05) |
|
MPH vs. ADHD |
Right Fastigial |
2.10 |
0.027 |
Yes |
|
MPH vs NT |
Left IX |
2.19 |
0.023 |
Yes |
|
MPH vs NT |
Left I_IV |
2.23 |
0.021 |
Yes |
Further testing was conducted on the structures showing significant differences. In this new analysis, a two sample t-test was conducted under the assumption that µ1, or the mean from the neurotypical sample, is greater than µ2, the mean from the MPH sample. It should be noted that µ1 was set as ADHD for analyzing the right fastigial nucleus. These results indicate that methylphenidate is associated with a decrease in the three structures above.
Analysis of Medication Duration and Dosage
Based on the results gathered from analyzing cerebellar structure, the three regions with statistical significance were plotted for MPH-ADHD individuals in context of dosage, duration, as well as dosage and duration working conjunction. This last factor is described as medication intensity, or the product of dosage and medication. Prior to creating the graphs, no outliers were identified according to the 1.5 IQR rule.
Looking at the right fastigial nucleus to begin with (Fig. 3.7a, 3.7b, 3.7c), there appears to be no correlation between medication duration and volume of the right fastigial nucleus. Examining Fig. 3.7a, there appears to be a strong positive correlation between medication dosage and the volume of the right fastigial nucleus, with an r-value of 0.77, indicating a strong positive correlation. Similarly, the R2 value of 0.596, suggesting 60% of the variation in volume of the right fastigial nucleus can be explained by medication dosage. When taking both medication duration and dosage into consideration, there appears to be a weak positive correlation, with an r-value of 0.32.
Looking at the Left IX region (Fig. 3.7d, 3.7e, 3.7f), there appears to be no correlation between medication dosage and regional volume, with an r-value of 0.08. A weak positive correlation may exist in medication duration and regional volume, with an r-value of 0.30. A stronger positive correlation can be found between medication intensity and regional volume, with an r-value of 0.38.
Lastly, looking at the Left I_IV region (Fig. 3.7g, 3.7h, 3.7i), a weak positive correlation exists between dosage and regional volume, as well as duration and regional volume, each respectively providing an r-value of 0.10 and 0.28. A stronger correlation exists between intensity and regional volume, providing an r-value of 0.58. To summarize, the right fastigial nucleus may be heavily influenced by medication dosage. The Left I_IV region may also be influenced by medication intensity, though to a lesser extent.
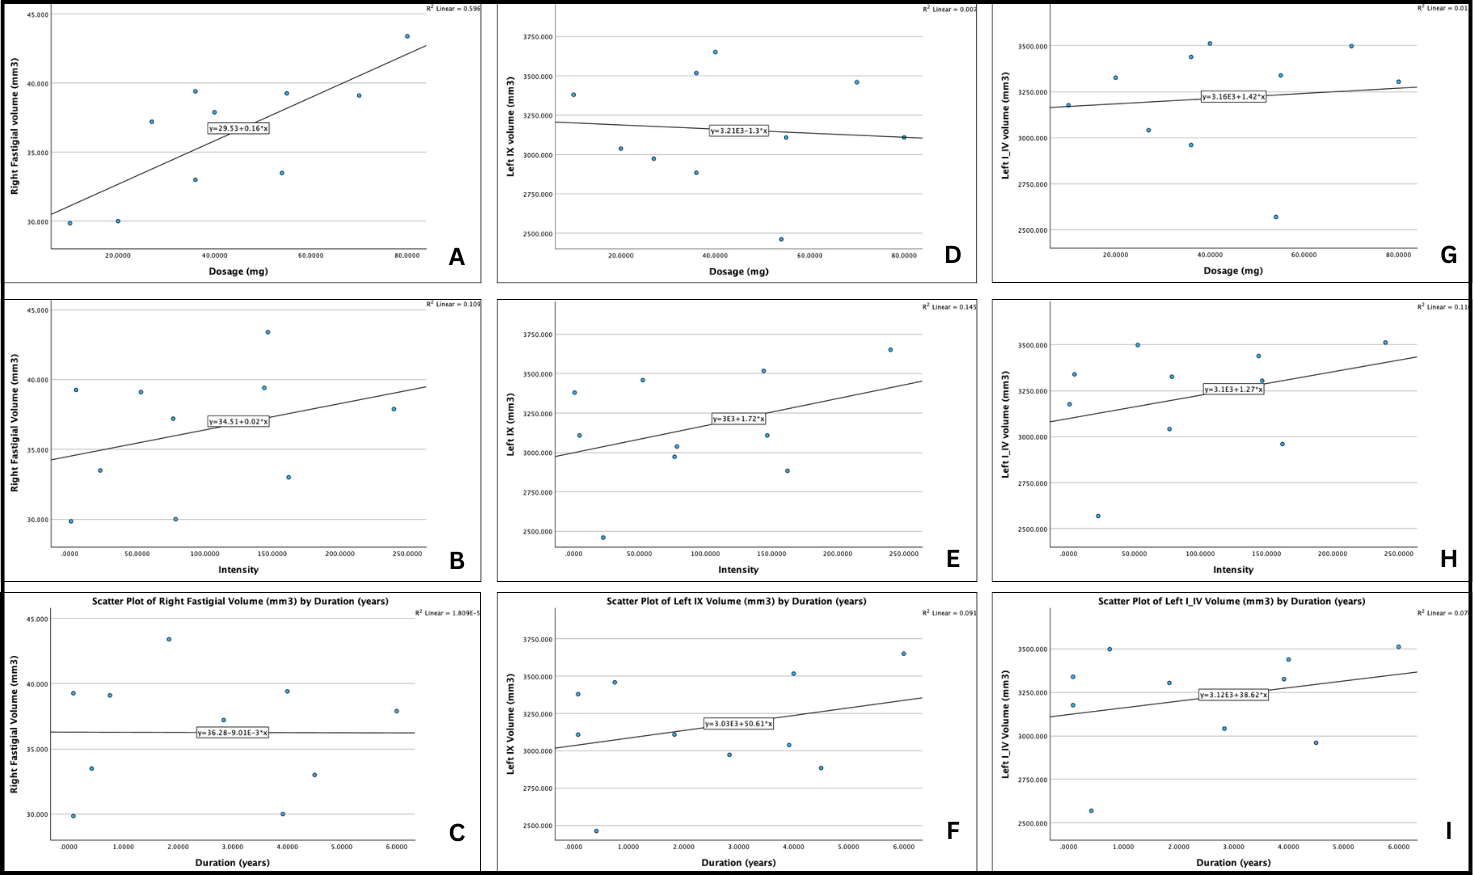
Fig. 3.7: Graphical comparisons of duration, dosage, and intensity against three regional brain volumes. For the right fastigial nucleus, the following graphs are produced (a) dosage (mg) vs. regional volume (mm3), (b) intensity vs. regional volume (mm3), and (c) duration (years) vs. regional volume (mm3). For the Left IX region, the following graphs are produced: (d) dosage (mg) vs. regional volume (mm3), (e) intensity vs. regional volume (mm3), and (f), duration (years) vs. regional volume (mm3). For the Left I_IV region, the following graphs are produced: (g) dosage (mg) vs. regional volume (mm3), (h) intensity vs. regional volume (mm3), and (i), duration (years) vs. regional volume (mm3).
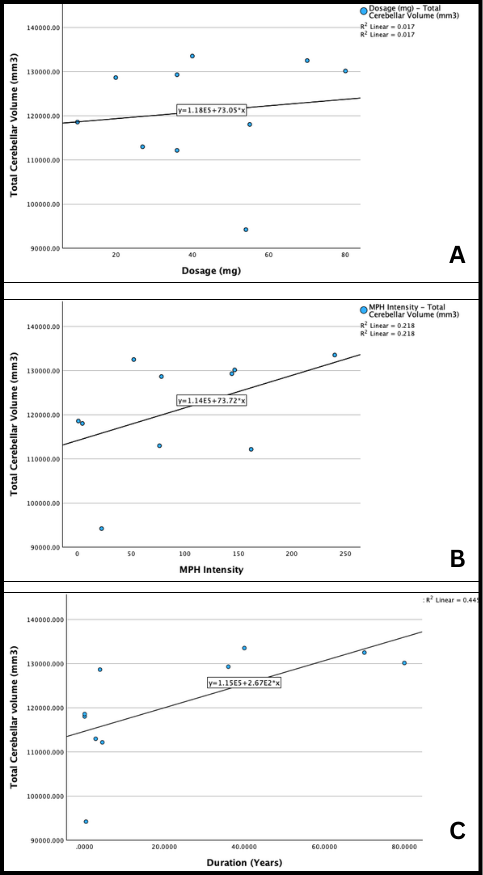
Fig. 3.8: Scatterplots of (a) total cerebellar volume (mm3) versus dosage (mg), (b) total cerebellar volume (mm3) versus intensity, and (c) total cerebellar volume (mm3) versus duration (years).
Based on correlation coefficient values, there appears to be a medium to strong positive correlation between medication duration and total cerebellar volume (r=0.67). A weaker positive correlation exists between medication intensity and total cerebellar volume (r=0.467), while an extremely weak positive correlation exists between medication dosage and cerebellar volume (r=0.13).
Overall, medication characteristics either have no correlation to total and regional cerebellar volume or have a positive correlation. This suggests that as dosage, duration, and intensity increase, so does cerebellar volume.
Summary
From the various statistics and analytical tools used, the following information was obtained: (1) a statistically significant decrease (p=0.02) in cerebellar volume localized the Left I_IV and Left IX regions can be found between neurotypical individuals and MPH-using ADHD individuals; (2) a statistically significant decrease (p=0.02) in cerebellar volume localized the right fastigial region can be found between MPH-using individuals with ADHD and drug-naive individuals with ADHD; (3) the median total cerebellar volume is lower in individuals who use MPH and highest in neurotypical individuals; (4) a strong positive correlation exists between medication dosage and the volume of the right fastigial nucleus (r=0.77), (5) a moderate positive correlation exists between medication intensity and regional volume in the Left I_IV region (r=0.58); and (6) a moderate correlation exists between medication duration and total cerebellar volume (r=0.67).
DISCUSSION
Structural Differences
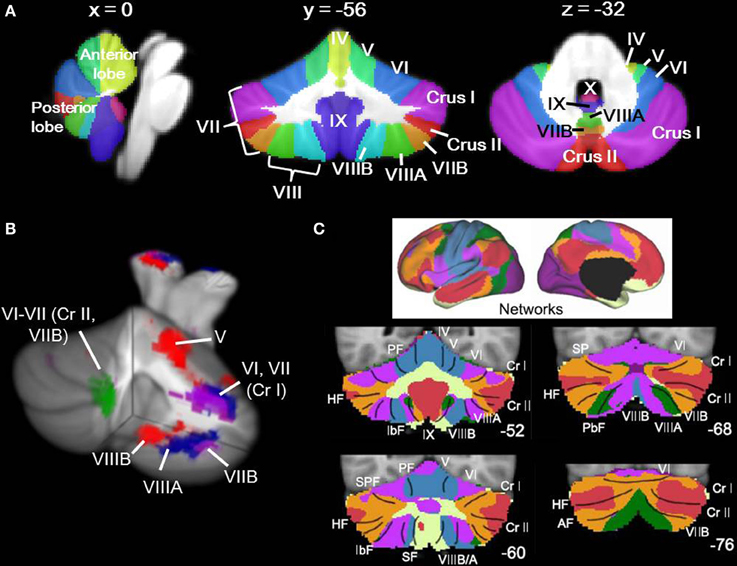
Fig. 4: Locations of Cerebellar Regions (Stoodly, 2014)
To begin, a statistically significant decrease was observed in the right fastigial nucleus from MPH-using individuals with ADHD in relation to medication-free individuals with ADHD. The reason for this change is unclear, as the fastigial nucleus is mainly responsible for carrying inputs from the vermis to the superior cerebellar peduncle, as well as the uncinate fasciculus and juxtarestiform body. The current understanding of MPH focuses on its effects on the dopamine reward system, which has sparse connections with the fastigial nuclei. A decrease in the volume in the right fastigial nucleus may have unpredictable effects on the vestibulocerebellum and spinocerebellar pathways, with the fastigial nucleus being responsible for carrying vestibular, proximal somatosensory, auditory, and visual information. This information is essential for its influence on proximal trunk muscles through connections to medial motor pathways (anterior corticospinal, reticulospinal, vestibulospinal, tectospinal tracts). In the literature review conducted, no prior study has noted differences in the volume of the fastigial nucleus. This deviation may be expected, as previous studies relied on the use of VBM or Freesurfer, which cannot map the 30-40 mm3 fastigial nucleus. That being said, results from the SUIT toolbox on an area with such a small volume should be used cautiously, as inaccuracies as small as a few millimeters in the program can be mistaken for statistical significance. As such, it is recommended further, hypothesis-driven analysis of anatomical images with a larger sample size be conducted. Moreover, it may also be pertinent to investigate other indicators of neurodegeneration, such as specific enzymes in the area.
The region Left I_IV corresponds to the left anterolateral area of the cerebellum (Jadavid, 2022). More specifically, lobule IV of the cerebellum is part of the anterior lobe of the cerebellar hemisphere. From a functional perspective, lobule IV is a major receiver of spinocerebellum afferents. While the fastigial nucleus receives input from the vermis and flocculonodular lobe, the importance of both the fastigial nucleus and lobule IV to the spinocerebellar system may indicate a connection between MPH and the aforementioned pathway. The positioning of lobule IV as an intermediate section of the cerebellar hemispheres may also indicate differences in control of distal appendicular muscles in MPH users. Further study of this area is again recommended, with a focus on improving sample size. Clinical representations of MPH use can be evaluated, such as decrease in distal limb control. Such differences may be able to explain certain side effects associated with MPH, such as uncontrolled movement of a specific body part.
Lobule IX, the final region with a statistically significant difference, is more commonly referred to as the cerebellar tonsils (Jadavid, 2022a). The cerebellar tonsils are considered to be part of the posterior lobe, which in turn can influence the initiation, planning, and coordination of movement, as well as the strength and scope of movement (Liu et al, 2020). From a clinical perspective, chiari malformations (CM) have been associated with ADHD (DuBow et al., 2020). CM is characterized by cerebellar herniation through the foramen magnum. This herniation typically begins with the cerebellar tonsils. In an existing case study, a 28-year old woman who had been taking long-acting MPH since the age of 12 but stopped at an unknown time suffered from CM with no other relevant medical history. As such, the changes in lobule IX may be reflective of larger changes in neural networks. The change in lobule IX only is present between MPH-users and neurotypical users, and not between medication-free individuals with ADHD and neurotypical individuals. From the data, it appears MPH has an association with CM rather than ADHD, though a significant amount of further study is required to solidify this relationship.
Overall, comparisons with existing literature are difficult to examine. No existing studies utilized the SUIT Toolbox to analyze the cerebellum, leading to results stating general decreases in cerebellar volume or cortical thickness. As such, the changes in lobule IV, lobule IX, and the right fastigial nucleus cannot be confirmed through research. The lower median total cerebellar volume in individuals with ADHD does align with existing literature, which notes individuals with ADHD typically have an overall reduction in brain size (Pliszka, 2007; Tripp & Wickens, 2009). Notably, the median total cerebellar volume of MPH-using individuals was even lower than that of their medication-free counterparts, possibly indicating wide-ranging and minor structural changes. In other words, structural changes from MPH may be not only localized to the listed areas, and may minorly impact a wide range of cerebellar structures. This study does deviate from existing literature, however, which associated decreased volume of the cerebellar vermis with ADHD (Pliszka, 2007). This may indicate inaccuracies in existing literature or in the methodology used for this study, and is an area for further study.
Sources of Error
Multiple sources of errors exist in each step of the method used. To begin with data collection, the study did not account for varied MPH doses and durations. More specifically, some of the study participants used different doses of MPH over time, or would take different doses at different times in a day. Similarly, some participants took breaks from their medications, leading to gaps in duration. The possibility of misreporting, for both duration and dosage, is high, as start dates for taking a medication are usually not explicitly remembered. In addition, some study participants had other neurological diagnoses that may have served as confounding variables. A larger population size may mitigate the effects of misreporting, and the development of a better classifying system for medication dosage and duration should be developed. From a sample size perspective, eighteen participants is not enough for conducting statistical analyses. The distribution for individuals coded ADHD and MPH-ADHD both were skewed, meaning the distribution failed one of the requirements for a two sample t-test. Skewed data can still be used so long as the sample size is greater than thirty. In order to fulfill this criteria, however, ninety participants (30 for each treatment) would have to be recruited. A study of that magnitude would require approval by the University of Calgary’s IRB, as well as a large amount of funding for incentivizing the participants and MRI use. As such, it is unlikely this source of error can be completely eliminated. It may be possible to loosen the exclusion criteria implemented for this study and use covariate analysis to control for confounding variables, allowing for the study to use a greater number of anatomical scans from the TAG-IT demographics project.
In the data processing phase using the SUIT toolbox, multiple sources of error also existed. While SUIT has been used by multiple peer-reviewed studies, it is not as established as VBM. Understanding how the SUIT program works and potentially making improvements to the open-access code may reduce errors in the results. The most significant source of error lies in the hand-editing portion of analyzing the SUIT images. The cerebellum mask created by the SUIT segregation function consistently does not encompass the entire cerebellum and must be edited by hand to do so, The editing process is time consuming and tiring, leading to errors in the new cerebellum mask. In addition, the sagittal, coronal, and axial views are not smooth post-editing, with each individual slice not directly leading into the next. Errors increase for the TAG-IT demographics data, which uses lower resolution MRI images. In multiple scans, the contrast between the cerebellum and the rest of the brain has errors, displaying a completely white mass with no border. Obtaining higher resolution MRI images could rectify this error, as could cross-checking with edited masks with another researcher.
In the data analysis phase of the project, the distributions sometime did not fulfill all the requirements to ensure accurate inferential statistics, The three requirements for a two-sample t-test are: (1) the distribution is normally distributed, (2) the distribution is independent, and (3) random sampling took place. Out of the three treatments, only neurotypical individuals had normally distributed data. It was assumed that the population cerebellar volume for individuals coded ADHD and MPH-ADHD were normally distributed. A greater sample size would nullify the requirement for normally distributed data. All three distributions were independent of each other, with the cerebellar volume of one individual having no impact on that of the next. All studies which actively recruit participants are by nature not performing random sampling as a result of participant bias. In other words, certain demographics of people may be more willing to volunteer as study participants. It could be possible to reduce the impacts of bias by taking a significantly larger sample, and then randomly selecting participant anatomical images to analyze. The funding and scale required for such a project, however, does not make it a plausible option for this study. To summarize, the distributions used did not fulfill the requirements for a t-test, which may have led to inaccurate results.
Improvements
There are two main improvements that can be made to this project: sample size and covariate analysis. The sample size of each treatment group did not exceed ten for this current study, which exacerbates the power of outliers in skewing the distribution. In particular, the ADHD treatment used only three participants, one of which had a drastically higher overall cerebellar volume than the other two. The inappropriate size of this sample is reflected in the large error bars for the graphs comparing ADHD, possibly explaining why more significant differences were found in comparisons not involving participants coded with ADHD. It is, however, difficult to recruit medication-free individuals with ADHD, as the condition is often associated with other neurological disorders that also are treated with medication. Another reason for only three structures showing statistical significant differences is that confounding variables are changing the results. Through covariate analysis tools, such as ANCOVA, hierarchical linear modeling, and regression analysis, major confounding variables such as age, sex, ethnicity, overall cranial capacity, and ADHD type can be accounted for.
Implications
Taking into account both the prevalence of ADHD and MPH in treating ADHD, understanding the potential risks of using the drug is essential. The mechanism of MPH is still not understood and the changes the drug causes to brain structure could be expressed phenotypically given sufficient duration and dosage. By localizing the structures most impacted by MPH, as well as the general nature of these impacts, this study lays the groundwork for future research on MPH. Current literature fails to localize the effects of MPH, but the well-documented neurodegeneration is a source for concern. With MPH in the hands of so many, especially children, this study has the potential to shape treatment approaches to ADHD
Conclusion
Through the analysis of T1 weighted MRI scans, significant (p<0.05) decreases in the volume of the left lobule IV and left cerebellar tonsils were found in MPH-using individuals compared to neurotypical individuals. Similarly, a significant decrease in the right fastigial nucleus was observed in individuals using MPH relative to individuals with ADHD and not taking MPH. Further analysis revealed a strong positive correlation exists between medication dosage and the volume of the right fastigial nucleus (r=0.77). Moreover, a moderate positive correlation exists between medication intensity and regional volume in the Left I_IV region (r=0.58), as well as between medication duration and total cerebellar volume (r=0.67). These results introduce new and specific structures for where MPH has the greatest impacts, laying the groundwork for future hypothesis-driven studies. Further analysis should focus on: (1) expanding the sample size of the study; (2) examining apoptotic and inflammatory factors in the most affected regions; (3) comparing the effect of MPH and amphetamines to see if the latter provides a suitable alternative.
Citations
Bahcelioglu, M., Gozil, R., Take, G., Elmas, C., Oktem, H., Kadioglu, D., ... Senol, S. (2009). Dose-related immunohistochemical and ultrastructural changes after oral methylphenidate administration in cerebrum and cerebellum of the rat. *World Journal of Biological Psychiatry, 10*(4 Pt 2), 531-543. https://doi.org/10.1080/15622970903176683
Bantick, R. A., De Vries, M. H., & Grasby, P. M. (2005). The effect of a 5-HT1A receptor agonist on striatal dopamine release. *Synapse (New York, N.Y.), 57*(2), 67-75. https://doi.org/10.1002/syn.20156
Blumenfeld, H. (2010). *Neuroanatomy Through Clinical Cases with Ebook*. Oxford University Press, Incorporated.
Brown, A. B., Biederman, J., Valera, E. M., Doyle, A. E., Bush, G., Spencer, T., ... Seidman, L. J. (2010). Effect of dopamine transporter gene (SLC6A3) variation on dorsal anterior cingulate function in attention-deficit/hyperactivity disorder. *American Journal of Medical Genetics. Part B, Neuropsychiatric Genetics, 153B*(2), 365-375. https://doi.org/10.1002/ajmg.b.31022
Curtin, K., Fleckenstein, A. E., Keeshin, B. R., Yurgelun-Todd, D. A., Renshaw, P. F., Smith, K. R., & Hanson, G. R. (2018). Increased risk of diseases of the basal ganglia and cerebellum in patients with a history of attention-deficit/hyperactivity disorder. *Neuropsychopharmacology, 43*(13), 2548-2555. https://doi.org/10.1038/s41386-018-0207-5
Diedrichsen, J. (2006). A spatially unbiased atlas template of the human cerebellum. Neuroimage, 33, 1, p. 127-138.
Diedrichsen, J., Balsters, J. H., Flavell, J., Cussans, E., & Ramnani, N. (2009). A probabilistic atlas of the human cerebellum. Neuroimage.
Diedrichsen, J., Maderwald, S., Kuper, M., Thurling, M., Rabe, K., Gizewski, E. R., et al. (2011). Imaging the deep cerebellar nuclei: A probabilistic atlas and normalization procedure. Neuroimage.
Diedrichsen, J. & Zotow, E. (2015). Surface-based display of volume-averaged cerebellar data. PLoS One, 7, e0133402.
DuBow, A., Mourot, A., & Tourjman, S. V. (2020). Chiari Malformation and Attention Deficit Hyperactivity Disorder. Case reports in medicine, 2020, 2694956. https://doi.org/10.1155/2020/2694956
Faraone, S. V. (2018). The pharmacology of amphetamine and methylphenidate: Relevance to the neurobiology of attention-deficit/hyperactivity disorder and other psychiatric comorbidities. *Neuroscience and Biobehavioral Reviews, 87*, 255-270. https://doi.org/10.1016/j.neubiorev.2018.02.001
Faraone, S. V., Larsson, H. (2019). Genetics of attention deficit hyperactivity disorder. *Molecular Psychiatry, 24*, 562-575. https://doi.org/10.1038/s41380-018-0070-0
Harpin, V. A. (2005). The effect of ADHD on the life of an individual, their family, and community from preschool to adult life. *Archives of Disease in Childhood, 90 Suppl 1*(Suppl 1), i2-i7.
Harpin, V., Mazzone, L., Raynaud, J. P., Kahle, J., Hodgkins, P. (2013). Long-Term Outcomes of ADHD: A Systematic Review of Self-Esteem and Social Function. *Journal of Attention Disorders, 20*(4), 295-305.
Javaid, M. A. (2022). Lobule IV of cerebellar hemisphere - e-Anatomy. IMAIOS. Retrieved March 14, 2024, from https://www.imaios.com/en/e-anatomy/anatomical-structure/lobule-iv-of-cerebellar-hemisphere-1553803868
Javaid, M. A. (2022a). Tonsil of cerebellum - e-Anatomy. IMAIOS. Retrieved March 14, 2024, from https://www.imaios.com/en/e-anatomy/anatomical-structure/tonsil-of-cerebellum-1553804124?from=2
Jimsheleishvili, S., Dididze, M. (2023). Neuroanatomy, Cerebellum. In: *StatPearls*. Available from: https://www.ncbi.nlm.nih.gov/books/NBK538167/
Lewis, R. G., Florio, E., Punzo, D., & Borrelli, E. (2021). The Brain's Reward System in Health and Disease. *Advances in Experimental Medicine and Biology, 1344*, 57–69. https://doi.org/10.1007/978-3-030-81147-1_4
Liu, W. F., Shu, Y. Q., Zhu, P. W., Li, B., Shi, W. Q., Lin, Q., Liu, Y. X., Zhang, M. Y., Min, Y. L., Yuan, Q., & Shao, Y. (2019). The Cerebellum Posterior Lobe Associates with the Exophthalmos of Primary Hyperthyroidism: A Resting-State fMRI Study. International journal of endocrinology, 2019, 8135671. https://doi.org/10.1155/2019/8135671
Loureiro-Vieira, S., Costa, V. M., Duarte, J. A., Duarte-Araújo, M., Gonçalves-Monteiro, S., Maria de Lourdes B., ... Capela, J. P. (2018). Methylphenidate clinically oral doses improved brain and heart glutathione redox status and evoked renal and cardiac tissue injury in rats. *Biomedicine & Pharmacotherapy, 100*, 551-563. https://doi.org/10.1016/j.biopha.2018.02.017
Mackey, S., Stewart, J. L., Connolly, C. G., Tapert, S. F., Paulus, M. P. (2014). A voxel-based morphometry study of young occasional users of amphetamine-type stimulants and cocaine. *Drug and Alcohol Dependence, 135*, 104-111. https://doi.org/10.1016/j.drugalcdep.2013.11.018
Mahmud, A. (2023, November 6). *T1 weighted image | Radiology Reference Article*. Radiopaedia. Retrieved February 9, 2024, from https://radiopaedia.org/articles/t1-weighted-image
Mahoud, A. (2023). T1 weighted image | Radiology Reference Article. *Radiopaedia*. Retrieved February 9, 2024, from https://radiopaedia.org/articles/t1-weighted-image
Motaghinejad, M., Motevalian, M., Shabab, B. (2016). Effects of chronic treatment with methylphenidate on oxidative stress and inflammation in hippocampus of adult rats. *Neuroscience Letters, 619*, 106-113. https://doi.org/10.1016/j.neulet.2015.12.015
Motaghinejad, M., Motevalian, M., Shabab, B. (2017). Effects of acute doses of methylphenidate on inflammation and oxidative stress in isolated hippocampus and cerebral cortex of adult rats. *Journal of Neural Transmission, 124*(1), 121-131. https://doi.org/10.1007/s00702-016-1623-5
Pai, A., Shetty, R., Hodis, B., et al. (2023 Apr 2). *Magnetic Resonance Imaging Physics*. In: *StatPearls*. Available from: https://www.ncbi.nlm.nih.gov/books/NBK564320/
Pliszka, S.; AACAP Work Group on Quality Issues. (2007). Practice parameter for the assessment and treatment of children and adolescents with attention-deficit/hyperactivity disorder. *Journal of the American Academy of Child and Adolescent Psychiatry, 46*(7), 894-921.
Quansah, E., Ruiz-Rodado, V., Groot
veld, M., & Zetterström, T. S. C. (2018). Methylphenidate alters monoaminergic and metabolic pathways in the cerebellum of adolescent rats. *European Neuropsychopharmacology, 28*(4), 513-528. https://doi.org/10.1016/j.euroneuro.2018.02.002
Raoofi, A., Aliaghaei, A., Abdollahifar, M. A., Eskandarian Boroujeni, M., Javadinia, S. S., Atabati, H., & Abouhamzeh, B. (2020). Long-term administration of high-dose methylphenidate-induced cerebellar morphology and function damage in adult rats. *Journal of Chemical Neuroanatomy, 103*, 101712. https://doi.org/10.1016/j.jchemneu.2019.101712
Réus, G. Z., Scaini, G., Jeremias, G. C., Furlanetto, C. B., Morais, M. O., Mello-Santos, L. M., ... Streck, E. L. (2014). Brain apoptosis signaling pathways are regulated by methylphenidate treatment in young and adult rats. *Brain Research, 1583*, 269-276. https://doi.org/10.1016/j.brainres.2014.08.010
Schmitz, F., Scherer, E. B., Machado, F. R., da Cunha, A. A., Tagliari, B., Netto, C. A., & Wyse, A. T. (2012). Methylphenidate induces lipid and protein damage in prefrontal cortex, but not in cerebellum, striatum and hippocampus of juvenile rats. *Metabolic Brain Disease, 27*(4), 605-612. https://doi.org/10.1007/s11011-012-9335-5
Schweren, L. J., de Zeeuw, P., & Durston, S. (2013). MR imaging of the effects of methylphenidate on brain structure and function in attention-deficit/hyperactivity disorder. *European Neuropsychopharmacology, 23*(10), 1151-1164. https://doi.org/10.1016/j.euroneuro.2012.10.014
Stoodley C. J. (2014). Distinct regions of the cerebellum show gray matter decreases in autism, ADHD, and developmental dyslexia. Frontiers in systems neuroscience, 8, 92. https://doi.org/10.3389/fnsys.2014.00092
Tripp, G., & Wickens, J. R. (2009). Neurobiology of ADHD. *Neuropharmacology, 57*(7-8), 579-589. https://doi.org/10.1016/j.neuropharm.2009.07.026
Tripp, G., Wickens, J. R. (2009 Dec). Neurobiology of ADHD. *Neuropharmacology, 57*(7-8), 579-589. https://doi.org/10.1016/j.neuropharm.2009.07.026
Urry, L. A., Cain, M. L., Wasserman, S. A., Minorsky, P. V., & Orr, R. B. (2020). *Campbell Biology*. Pearson.
Verghese, C., Abdijadid, S. (2023 Jan 2). *Methylphenidate*. In: *StatPearls*. Available from: https://www.ncbi.nlm.nih.gov/books/NBK482451/
Weseley, A. J., & McEntarffer, R. (2023). *AP Psychology Premium, 2024: Comprehensive Review With 6 Practice Tests + an Online Timed Test Option*. Barrons Educational Services.
Acknowledgement
I would like to thank Dr. Kara Murias at the University of Calgary for her guidance and advice throughout this entire project. I would also like to thank all the members of BrainKids Lab, especially Ryan Verbitsky, who guided and advised me on the logistics of my project. All data was gathered by BrainKids Lab.