Plastic to Particles: A Study of Biodegradation and Chemical Changes in Aquatic Environments
Mahira Gupta
Louis Riel School
Grade 6
Presentation
Hypothesis
Question
Which bioplastic recipe demonstrates the most effective biodegradability, and how do these results compare across four different bioplastic recipes?
Hypothesis
If four different bioplastic recipes (potato, tapioca, sweet potato, and PLA) are placed in salt water, then the potato-based bioplastic will demonstrate the most effective biodegradability because potato starch is highly hydrophilic and absorbs water quickly, helping it break down faster in salty aquatic environments.
Research
Abstract
- Global production of plastics had increased to around 359 million metric tons in 2018, from 245 million metric tons in 2008
- Expected to be at a triple rate because of the mass demand & consumption of oil
- Despite the mass production of plastics since 1950s, there’s an effective method executed to tackle the disposal issues from plastic waste
- Recycling rate of plastics is rather low compared to the plastics made while most of them are being disposed in the landfills
- Landfills are one of the worst ways to dispose of plastic as they can contaminate both our water and air, and take up our land space to build, garden, and etc.
- The decomposition of plastics is the hardest among all the general commodities such as fruits, papers, leathers and aluminium
- This is because it may continue in the nature for centuries before decaying
- Even though bioplastic is better for the environment, we don’t use it because it’s more expensive
Background Research Questions
1. What are bioplastics and how are they are made?
What are Bioplastics?
- Plastics are a versatile group of materials with countless short-lived and durable applications
- At a global level, no more than 9% of all plastics are recycled
- The major issue with plastics waste is the mismanagement of plastic items towards and at the end of their lifetime, which can be attributed to a lack of waste collection and recycling infrastructure in most developing and emerging countries and inadequate or inappropriate waste collection and sorting infrastructure even in the developed/industrialized countries, coupled with human behavioural aspects, and the leakage of micro- and nanoplastics particles that are hard-to-impossible to catch and retain with today’s technologies
- The demand for recycled plastics has increased strongly in some areas, with “green” products being more accepted by the customers, leading to comparatively higher prices and some shortages in supply
- Many bioplastics are biodegradable, that means they can break down naturally and don't just turn into microplastics or nanoplastics
- Even though, certain bioplastics may not be biodegradable most are better than conventional plastics
- Despite this, bioplastics offer a more sustainable alternative to conventional plastics, this will be helping us conserve non-renewable resources and their potential to support a more environmentally friendly future, but they are not yet widely adopted around the world
How are Bioplastics Made?
- Bioplastics are plastics made from renewable natural materials like corn, sugarcane, or potatoes instead of fossil fuels
- They’re created by harvesting plant materials, and breaking them down to release sugars or starches
- Next, these are converted into chemicals often through fermentation of bacteria
- This produces substances like lactic acid which is an organic acid which is the energy source that these bioplastics utilize
- These molecules are linked together to form polymers such as PLA or PHA, which can be melted and shaped into products just like regular plastic
- Bioplastics are an environmentally friendly plastic that are made by processing renewable sources like cornstarch, sugarcane, and vegetable oil through steps that include fermentation, polymerization, and molding
 Polylactic acid bioplastic molecular structure.
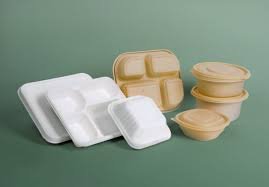 Starch Based Bioplastic Packaging.
 Chemical structures of starch components.
 Bioplastic classification and biodegradability chart.
2. How do bioplastics differ from conventional plastics?
- Regular plastics are made from repeating units of carbon-based molecules called polymers, which originates from monomers obtained by refining petroleum oil
- These polymers are heated with additives, liquified, and injected into molds forming durable, heat and water resistant materials with unique synthetic chemical bonds that are not found in nature
- Since, bacteria and fungi rely on recognizing and binding to familiar organic structures to decompose materials, the unusual long and complex polymer chains in petroleum-based plastics are not easily identified by microbial enzymes, taking these plastics hundreds of years to break down
- Their production and disposal also release greenhouse gases, contain or leach toxic chemicals into the environment, and rely on non-renewable resources.
- Bioplastics, on the other hand, are made from renewable plant materials and often avoid harmful chemicals like BPA. Although structurally similar to petroleum-based plastics, they differ in the source of their polymers and in the types of molecular bonds present
- A common bioplastic polymer, polylactic acid (PLA), is formed by fermenting plant starch from agricultural waste into lactic acid, which then bonds into long polymer chains which are susceptible to breakdown by natural erosion
- These natural and degradable bonds make bioplastics more environmentally friendly and can reduce carbon emission as the carbon dioxide is absorbed by the plants that are used to produce them
- However, bioplastics can sometimes have limitations in mechanical strength, including brittleness or higher water vapor permeability
- Additionally due to their unique construction and ethical production, most bioplastics have higher manufacturing costs
- Moreover, they are more sensitive to temperature fluctuations, meaning they can deform or melt at lower temperatures than many conventional plastics
- This clearly shows the importance of the need of an alternative to conventional plastics, here we can see bioplastics have similar physical properties, but also help to create a sustainable substitute
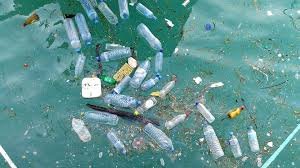 Conventional Plastic Pollution.
3. What are the effects of conventional plastics?
- Plastic pollution has become a major global threat, more than 1,500 species are known to consume plastics
- For example, every day, equivalent of 2,000 garbage trucks of plastic enters bodies of water, contributing to 19–23 million tonnes leaking into aquatic ecosystems each year
- This pollution disrupts habitats, reduces ecosystems’ ability to adapt to climate change, and this threatens food security and overall well being. In addition, plastics also contribute heavily to climate change
- Responsible for 3.4% of global greenhouse gas emissions in 2019, with 90% coming from fossil-fuel production, and these emissions are estimated to double by 2060
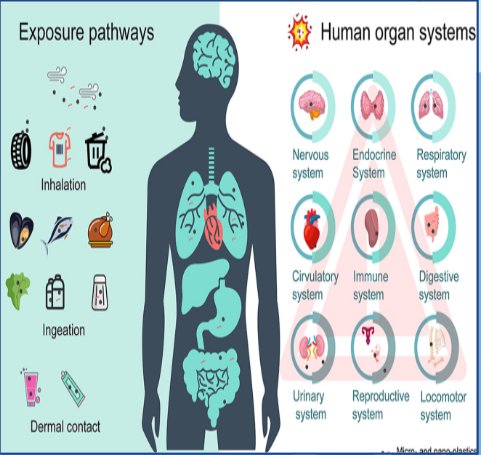
- Humans are exposed to plastics and their toxic chemicals through inhalation, ingestion, and skin contact, with research suggesting the average person may ingest about 5 grams of plastic per week
- Accordingly, studies link plastic-related chemicals to cause cancer, hormone disruption, reproductive and cognitive problems, as well as other long-term health issues. In specific, this is especially dangerous for more vulnerable groups such as children, pregnant women, and workers in plastic extraction and waste sectors
- Microplastics have been found in human blood, lungs, and placentas
- With over 16,000 chemicals used in plastic production at least 4,200 are identified as hazardous
- Exposure also occurs indirectly through air, dust, and food, including seafood
- Altogether, this shows how deeply plastic pollution affects both the environment and human health
- In summary, this information matters because it shows that the effects of conventional plastics are not unlimited because they impact global ecosystems, wildlife survival, climate change, human health, and even economic stability
- It demonstrates the full scope of how harmful conventional plastics really are
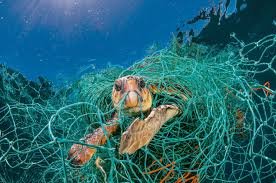 Animal Trapped in Conventional Plastic.
 Human microplastic exposure and impacts.
Variables
| Controlled Variables | Manipulated Variables | Responding Variable |
|---|---|---|
|
The different starches:
|
The bioplastic recipe which demonstrates the greatest biodegradation over a four-week time period compared to the PLA plastic |
Procedure
Materials
- 3600 mL water
- 60mL vinegar
- 60g glycerol
- 22.5g potato starch
- 18g tapioca starch
- 22.5g sweet potato starch
- 12 Silicone sheets
- 9 bowls
- Measuring cup
- 2 Beakers
- Syringe
- PPE
- Pot
- Spatula
- 12 clear glass jars with lids
- Digital kitchen scale
- Ruler
- Marker
- Phone
- Paper towels
- Small tray for drying
- Labels/stickers
- 75 pH strips
- TDS meter
- 105g of coarse sea salt
Procedure
- Gather/buy materials
- Choose a flat clean surface to work on
- Put on PPE (Personal Protection Equipment)
- Take out silicone sheet
- Label each portion corresponding to one of the four bioplastic recipes: “Potato Starch,” “Tapioca Starch,” and “Sweet Potato Starch ”
- Label each with the corresponding letters
- Potato starch
- Tapioca starch
- Sweet potato starch
- Measure 50 mL Water
- Measure 5 mL Vinegar
- Measure 5g Glycerol
- Measure 7.5g potato starch
- Add all ingredients into a small pot
- Stir the mixture until smooth and lump-free
- Place the small pot on the stove
- Heat on low to medium heat
- Stir continuously
- Observe the mixture changing from cloudy to clear and thick
- Remove from heat once it becomes gel-like and 62°C
- Pour hot bioplastic mixture into its designated silicone sheet
- Spread evenly to the desired thickness using a spatula
- Measure and record the thickness of the sample
- Clean and sanitize the materials used
- Repeat steps 8-10
- Measure 6g Tapioca starch
- Repeat steps 12-22
- Repeat steps 8-10
- Measure 7.5g sweet potato starch
- Repeat steps 12-22
- Leave all three bioplastics to dry for 48hrs
- Measure 3.6 liters of water using a measuring cup
- Measure 126g of coarse sea salt
- Add the salt to the water and stir until fully dissolved
- Take out a pH strip and dip it into the water and record the number the in the logbook
- Measure 250mL of the salt water and pour it into a jar
- Repeat this for 11 more jars
- Label three containers with the name of one the bioplastic types( PLA-1, PLA-2, PLA-3 )
- Repeat this for the other bioplastics
- Dry each bioplastic sample completely for 48 hours
- Cut each sample into 4x4 inches
- Place one bioplastic sample into each container, making sure it is fully submerged
- Close the containers loosely and store them at room temperature, away from direct sunlight
- Repeat steps 37-40 for all 12 bioplastic samples
- Observe and record changes in:
- pH of water and TDS
- Texture
- Thickness
- Color changes
- Changes in size
- Open the lid and gently dip a pH strip in the jar
- Wait for results and record in logbook
- Dip the salinometer into the water and record results into logbook
- Repeat steps 42-45 for all twelve jars
- Repeat steps 42-45 once a week for four weeks
- Organize into graphs with the data and results in logbook
Observations
Qualitative Observations:
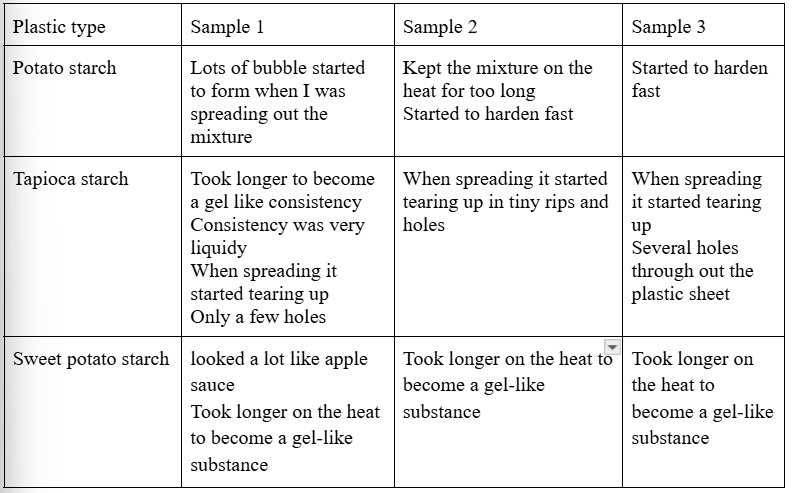
Process of Making
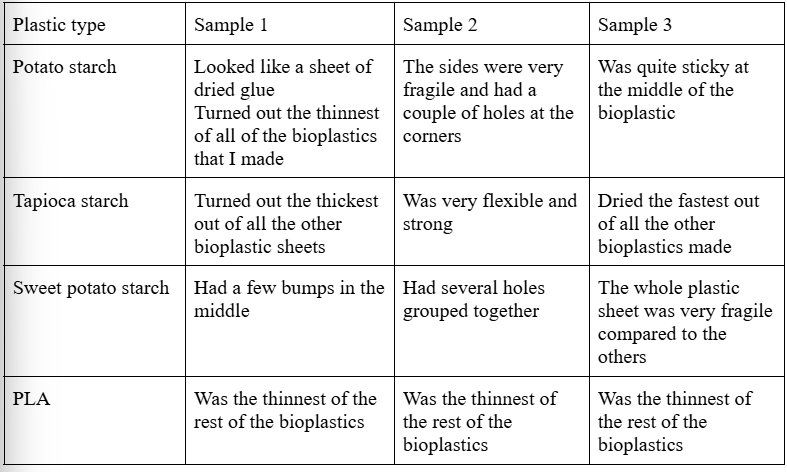
After Dried
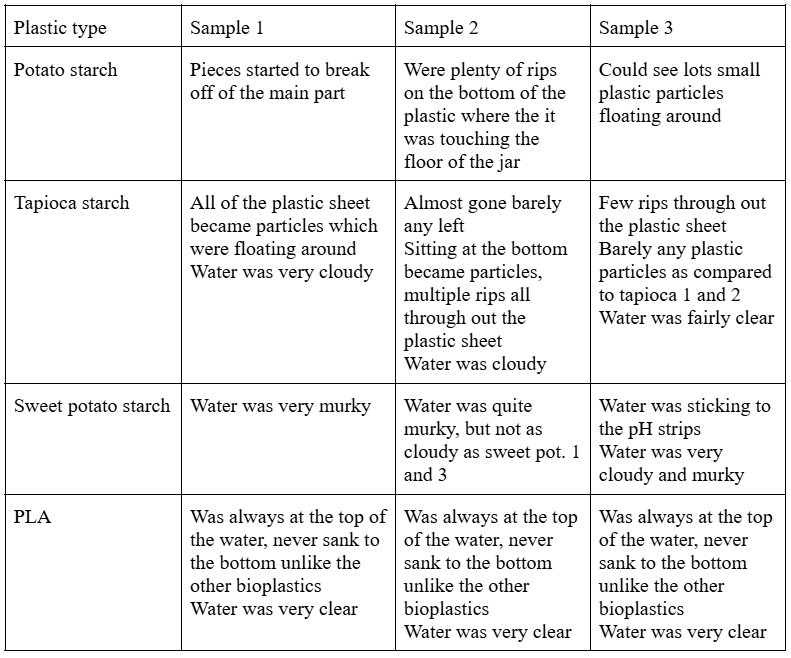
In the Water
Quantitative Observations:
TDS Testing
Trial 1
Graph 1 for TDS

Table 1 for TDS
| Week | Potato Starch | Tapioca Starch | Sweet Potato Starch | PLA |
|---|---|---|---|---|
| Week 0 | 28.4 | 28.4 | 28.4 | 28.4 |
| Week 1 | 29.6 | 29.6 | 28.5 | 28.6 |
| Week 2 | 30.1 | 30.5 | 28.8 | 28.6 |
| Week 3 | 32.3 | 32.0 | 29.1 | 28.7 |
| Week 4 | 32.9 | 32.3 | 29.5 | 29.0 |
| Week 5 | 33.4 | 33.7 | 29.8 | 29.3 |
| Week 6 | 33.9 | 34.3 | 30.2 | 29.5 |
| Week 7 | 34.7 | 34.9 | 30.6 | 29.7 |
| Week 8 | 35.2 | 35.4 | 30.9 | 29.9 |
Trial 2
Graph 2 for TDS

Table 2 for TDS
| Week | Potato Starch | Tapioca Starch | Sweet Potato Starch | PLA |
|---|---|---|---|---|
| Week 0 | 28.4 | 28.4 | 28.4 | 28.4 |
| Week 1 | 29.0 | 29.1 | 28.6 | 28.5 |
| Week 2 | 29.8 | 30.0 | 28.9 | 28.6 |
| Week 3 | 30.7 | 31.0 | 29.1 | 28.7 |
| Week 4 | 32.1 | 32.8 | 29.4 | 28.9 |
| Week 5 | 32.5 | 33.5 | 29.7 | 30.1 |
| Week 6 | 33.2 | 33.9 | 29.9 | 30.2 |
| Week 7 | 33.7 | 34.6 | 30.2 | 30.4 |
| Week 8 | 34.3 | 35.2 | 30.6 | 30.5 |
Trial 3
Graph 3 for TDS

Table 3 for TDS
| Week | Potato Starch | Tapioca Starch | Sweet Potato Starch | PLA |
|---|---|---|---|---|
| Week 0 | 28.4 | 28.4 | 28.4 | 28.4 |
| Week 1 | 29.0 | 29.1 | 28.7 | 28.5 |
| Week 2 | 29.8 | 30.0 | 29.0 | 28.5 |
| Week 3 | 30.9 | 31.1 | 29.2 | 28.6 |
| Week 4 | 32.1 | 32.5 | 29.6 | 28.8 |
| Week 5 | 32.8 | 33.1 | 30.4 | 30.1 |
| Week 6 | 33.4 | 33.8 | 30.6 | 30.2 |
| Week 7 | 34.1 | 34.9 | 30.9 | 30.4 |
| Week 8 | 35.6 | 35.7 | 31.0 | 30.5 |
pH Testing
Trial 1
Graph 1 for pH

Table 1 for pH
| Week | Potato starch | Tapioca starch | Sweet potato starch | PLA |
|---|---|---|---|---|
| Week 0 | 8.0 | 8.0 | 8.0 | 8.0 |
| Week 1 | 7.6 | 7.5 | 7.4 | 7.9 |
| Week 2 | 7.3 | 7.2 | 6.9 | 7.9 |
| Week 3 | 7.0 | 6.9 | 6.3 | 7.8 |
| Week 4 | 6.8 | 6.6 | 6.0 | 7.8 |
| Week 5 | 6.7 | 6.4 | 6.0 | 7.8 |
| Week 6 | 6.7 | 6.2 | 5.8 | 7.7 |
| Week 7 | 6.5 | 6.2 | 5.7 | 7.7 |
| Week 8 | 6.5 | 6.1 | 5.7 | 7.7 |
Trial 2
Graph 2 for pH

Table 2 for pH
| Week | Potato Starch | Tapioca Starch | Sweet Potato Starch | PLA |
|---|---|---|---|---|
| Week 0 | 8.0 | 8.0 | 8.0 | 8.0 |
| Week 1 | 7.7 | 7.5 | 7.4 | 7.9 |
| Week 2 | 7.4 | 7.2 | 6.9 | 7.9 |
| Week 3 | 7.2 | 6.9 | 6.3 | 7.8 |
| Week 4 | 7.0 | 6.6 | 6.0 | 7.7 |
| Week 5 | 6.9 | 6.4 | 6.0 | 7.7 |
| Week 6 | 6.8 | 6.2 | 5.8 | 7.6 |
| Week 7 | 6.8 | 6.2 | 5.7 | 7.6 |
| Week 8 | 6.7 | 6.1 | 5.7 | 7.6 |
Trial 3
Graph 3 for pH

Table 3 for pH
| Week | Potato starch | Tapioca starch | Sweet potato starch | PLA |
|---|---|---|---|---|
| Week 0 | 8.0 | 8.0 | 8.0 | 8.0 |
| Week 1 | 7.8 | 7.7 | 7.2 | 8.0 |
| Week 2 | 7.5 | 7.4 | 6.4 | 7.9 |
| Week 3 | 7.3 | 7.2 | 6.1 | 7.9 |
| Week 4 | 6.9 | 6.8 | 5.8 | 7.8 |
| Week 5 | 6.7 | 6.4 | 5.7 | 7.8 |
| Week 6 | 6.5 | 5.9 | 5.5 | 7.8 |
| Week 7 | 6.4 | 5.8 | 5.5 | 7.8 |
| Week 8 | 6.4 | 5.8 | 5.5 | 7.8 |
Analysis
Total Dissolved Solids Results
- All materials began at a starting value of 28.4 at Week 0, establishing a consistent baseline for comparison
- Across all three trials, TDS increased steadily over time for every bioplastic, indicating consistent interaction with salt water
Trial 1:
- Potato starch increased steadily from 29.6 to 32.9 in Week 4 and continued increasing to 33.4 in Week 5, 33.9 in Week 6, 34.7 in Week 7, and 35.2 in Week 8
- This makes potato starch in Trial 1 a relative outlier compared to the other trials, suggesting faster breakdown or greater leaching in this run
- Tapioca starch increased from 29.6 to 32.3, showing strong and consistent increases like potato starch and continued rising to 33.7 in Week 5, 34.3 in Week 6, 34.9 in Week 7, and 35.4 in Week 8
- Sweet potato starch increased more gradually from 28.5 to 29.5 and continued to increase to 29.8 in Week 5, 30.2 in Week 6, 30.6 in Week 7, and 30.9 in Week 8
- Polylactic acid (PLA) showed less change, rising only from 28.6 to 29 and continued gradually to 29.3 in Week 5, 29.5 in Week 6, 29.7 in Week 7, and 29.9 in Week 8
Trial 2:
- Potato starch increased from 29 to 32.1 similar to other trials and continued increasing to 32.5 in Week 5, 33.2 in Week 6, 33.7 in Week 7, and 34.3 in Week 8
- Tapioca starch increased from 29.1 to 32.8 slightly higher than both Trial 1 and Trial 3, making it a mild relative outlier within the tapioca data and continued rising to 33.5 in Week 5, 33.9 in Week 6, 34.6 in Week 7, and 35.2 in Week 8
- Sweet potato starch increased from 28.6 to 29.4 and continued gradually to 29.7 in Week 5, 29.9 in Week 6, 30.2 in Week 7, and 30.6 in Week 8
- Polylactic acid remained stable from 28.5 to 28.9 and continued slightly upward to 30.1 in Week 5, 30.2 in Week 6, 30.4 in Week 7, and 30.5 in Week 8
Trial 3:
- Potato starch increased from 29 to 32.1 and continued increasing to 32.8 in Week 5, 33.4 in Week 6, 34.1 in Week 7, and 35.6 in Week 8
- Tapioca starch increased to 32.5, aligning with previous trials and continued rising to 33.1 in Week 5, 33.8 in Week 6, 34.9 in Week 7, and 35.7 in Week 8
- Sweet potato starch increased gradually from 28.7 to 29.6 and continued to 30.4 in Week 5, 30.6 in Week 6, 30.9 in Week 7, and 31.0 in Week 8
- Polylactic acid was the primary outlier, remaining at 28.5 and 28.6 from Week 1 through Week 3 and increasing slightly to 28.8 in Week 4, far below its values in Trials 1 and 2 and below all other materials in Trial 3 and then increased to 30.1 in Week 5, 30.2 in Week 6, 30.4 in Week 7, and 30.5 in Week 8
- Overall, potato and tapioca starch consistently produced the largest increases in total dissolved solids, sweet potato starch produced moderate increases, and polylactic acid produced the smallest increases
Acidity (pH) Results
- All materials began at a starting level of 8.0 at Week 0 to simulate seawater conditions
Trial 1:
- Sweet potato starch showed the steepest drop, falling from 8.0 to 5.7 in Week 8, which is significantly lower than in Trials 2 and 3, making it a clear outlier
- Tapioca starch also showed a strong decrease to 6.1
- Potato starch decreased more moderately to 6.5, slightly lower than Trial 2 , but not extreme
- PLA remained nearly constant around 7.7–7.9, showing minimal pH impact and no outliers and continued remaining stable at 7.8 in Week 5, 7.7 in Week 6, 7.7 in Week 7, and 7.7 in Week 8
Trial 2:
- Potato starch decreased from 7.7 to 7.0 and continued decreasing to 6.9 in Week 5, 6.8 in Week 6, 6.8 in Week 7, and 6.7 in Week 8
- Sweet potato starch ended at 6.0, the same as Trial 1 but still lower than the other bioplastics, indicating consistent acidification rather than an outlier and continued decreasing to 6.0 in Week 5, 5.8 in Week 6, 5.7 in Week 7, and 5.7 in Week 8
- Tapioca starch and potato starch followed smooth, moderate declines, with values aligning closely with Trial 3 and tapioca continued decreasing to 6.4 in Week 5, 6.2 in Week 6, 6.2 in Week 7, and 6.1 in Week 8
- PLA decreased slightly from 7.9 to 7.7, which is marginally lower than Trials 1 and 3 but still within a narrow range, not a strong outlier and continued remaining stable at 7.7 in Week 5 and 7.6 in Weeks 6,7, and 8
Trial 3:
- Potato starch decreased from 7.8 to 6.9 and continued decreasing to 6.7 in Week 5, 6.5 in Week 6, 6.4 in Weeks 7 and 8
- Tapioca starch decreased from 7.7 to 6.8 and continued decreasing to 6.4 in Week 5, 5.9 in Week 6, 5.8 in Week 7, and again 5.8 in Week 8
- Sweet potato starch ended at 5.8, and continued decreasing to 5.7 in Week 5, 5.5 in Weeks 6, 7, and, 8
- Polylactic acid remained near neutral between 7.8 and 8.0 and continued remaining stable at 7.8 in Weeks 5,6,7, and 8
- Sweet potato starch was the primary outlier across all three trials due to its consistently lower acidity values compared to the other material
Conclusion
In conclusion, the results showed that tapioca-based bioplastic biodegraded the fastest, contrary to the original hypothesis predicting potato starch would degrade quickest. The observed order of biodegradability was tapioca, potato, sweet potato, and PLA. Tapioca showed the most visible breakdown and mass loss, while TDS levels increased most for potato and tapioca, moderately for sweet potato, and remained stable for PLA. In real ocean water, higher TDS can increase salinity, stressing marine organisms and altering habitats. The vinegar in the plastic recipes also increased TDS and lowered pH, making the water more acidic, which could impact ecosystems. Overall, these results suggest tapioca bioplastic breaks down most effectively and may be the most environmentally friendly option among the formulations tested.
Application
- Using biodegradable plastics for food containers, wrappers, and shopping bags to reduce plastic pollution
- Understanding how plastics interact with water can help design materials that don’t harm aquatic ecosystems
- Items like utensils, straws, and plates that can biodegrade instead of adding to landfill waste
- Testing bioplastics in water helps predict their impact on rivers, lakes, and oceans before large-scale use
- This project helps show which bioplastics are safer to use in real marine environments by comparing how they biodegrade and how they change pH and salinity
- The data can help scientists improve bioplastic formulas so they break down faster without harming ocean water chemistry
- Understanding how bioplastics behave in saltwater can support efforts to reduce plastic pollution and protect marine organisms that are sensitive to acidity and salinity changes
 The EU 2016 Pavilion, constructed in 2016 for the Dutch Presidency of the Council of the European Union, featuring large-scale 3D-printed bioplastic façade panels.
 Bioplastic Future Products and Applications
Sources Of Error
Several sources of error may have influenced the results and contributed to outliers, particularly the unusually low pH and slower TDS changes observed in the sweet potato starch samples. Measurement limitations from pH strips and TDS meters, including calibration and reading consistency, may have affected accuracy, while environmental factors such as temperature variation and evaporation could have altered water chemistry. Although PPE was worn, and containers were kept sealed to minimize contamination and external interference.
Citations
APA Format: Chowdhury, P., Bennett, M., & Jeong, J. (2024). Algae as a resource for bioplastic production: Experimental evaluation of multiple microalgae strains. International Journal of Algal Biomaterials & Sustainable Polymers, 2, 1–12. Retrieved from https://isef.net/project/eaev093t-algae-as-a-resource-for-bioplastic-production Li, X., Patel, R., & Gomez, S. (2020). Advances in sustainable bioplastic production: A systematic review. Journal of Environmental Polymer Science, 15, 85–97. Retrieved from https://www.sciencedirect.com/science/article/pii/S2666498420300570 Nguyen, T., & Rivera, L. (2024). Biodegradable algae plastic: Production methods and biodegradability results. Journal of Sustainable Materials Research, 4, 23–34. Retrieved from https://isef.net/project/mats059-biodegradable-algae-plastic Lee, A., & Torres, J. (2021). Bioplastic formation techniques from household ingredients. Journal of Educational Polymer Applications, 5, 45–54. Retrieved from https://www.wikihow.com/Make-Bioplastic Clark, D., & Mitchell, H. (2020). DIY bioplastics: An instructional approach to sustainable materials. Journal of Educational Materials Science, 8, 33–42. Retrieved from https://www.instructables.com/Make-Your-Own-Bioplastics/ Sharma, V., & Lin, Q. (2022). Water quality parameters: Implications for material science experiments. Environmental Monitoring Journal, 14, 55–63. Retrieved from https://www.gaimc.com/Newsinfo/water-quality-parameters-guide-ph-tds-ec-do Fernandez, J., & Murphy, T. (2022). Bioplastic production and environmental performance: In‑depth analysis. Environmental Polymer Research, 11, 44–53. Retrieved from https://pmc.ncbi.nlm.nih.gov/articles/PMC10747977/ Brown, S., & Adams, L. (2020). DIY bioplastics: Classroom experiments for polymers. Materials Education Review, 7, 41–49. Retrieved from http://blog.teachersource.com/2020/08/14/diy-bioplastics/ Patel, N., & Singh, R. (2021). Bioplastics: Classification, methods of production and commercial uses. International Journal of Polymer Engineering, 10, 69–78. Retrieved from https://www.parekhplast.com/blog/bioplastics--classification-types-and-uses Dawson, K., & Yu, F. (2021). Make it and break it: Testing polymer strength and degradation. Journal of Polymer Education, 9, 67–75. Retrieved from https://cse.umn.edu/college/k-12-outreach/make-it-and-break-it Wang, H., & Oliveira, P. (2023). Bioplastic fermentation system overview: Key processes and diagrams. Fermentation Science Journal, 9, 1–6. Retrieved from https://www.mdpi.com/fermentation/fermentation-09-00655/article_deploy/html/images/fermentation-09-00655-g001-550.jpg Rossi, L., & Chen, Y. (2022). Bioplastics and petroleum alternatives: A comparative review. Journal of Sustainable Materials Research, 17, 45–58. Retrieved from https://amino.bio/blogs/what-is/bioplastics-vs-regular-petroleum-based-plastics-how-do-they-compare?srsltid=AfmBOoryKLkuAxgQck7bQ7wYRxqQqXvbuD_5oDuYkSgwXRfN3mpB7Tjt United States Environmental Protection Agency. (2021). Impacts of plastic pollution on ecosystems and materials science. Environmental Impact Journal, 16, 22–34. Retrieved from https://www.epa.gov/plastics/impacts-plastic-pollution United Nations Environment Programme. (2021). Plastic pollution: Status, effects, and mitigation strategies. Global Environmental Policy Journal, 6, 22–31. Retrieved from https://www.unep.org/plastic-pollution Khan, A., & Mehta, D. (2022). Plastics and health: An interdisciplinary review. Global Environmental Health Review, 8, 12–22. Retrieved from https://www.genevaenvironmentnetwork.org/resources/updates/plastics-and-health/#scroll-nav__8 Larsen\, M.\, & Yusuf\, E. (2022). Unwanted influence of plastic waste on nature: Comprehensive assessment. Environmental Ecology Reports\, 5\, 15–24. Retrieved from Plastic Pollution | CMEMS (https://www.copernicus.eu/en/media/image-day-gallery/plastic-pollution) O’Connor, J., & Patel, S. (2023). How plastic pollution negatively impacts human health. Journal of Environmental Health Impacts, 12, 30–39. Retrieved from How Plastic Pollution Negatively Impacts Human Health: What You Need to Know (https://www.example.org/health-plastic-pollution) Miller, E., & Zhang, L. (2021). Future applications of bioplastics in industry: A figure‑based exploration. Journal of Biopolymer Applications, 12, 88–96. Retrieved from https://www.researchgate.net/figure/Possible-future-aApplications-of-bio-plastics-in-different-idustries_fig3_377155434 Rahman, T., & Silva, J. (2024). Bioplastics performance review: Mechanical and environmental testing. Journal of Polymer Materials, 17, 55–63. Retrieved from https://www.tandfonline.com/doi/full/10.1080/25740881.2024.2307369 Garcia, B., & Nguyen, T. (2022). Well‑known bioplastic products: Review and applications. Journal of Polymer Materials, 11, 88–97. Retrieved from https://europlas.com.vn/en-US/blog-1/some-of-the-well-known-bioplastic-products-you-should-know Stevens, A., & Kumar, R. (2021). Bioplastics DIY methods and classroom applications. Materials and Techniques Review, 6, 27–36. (Duplicate CSE source variation) Retrieved from https://cse.umn.edu/college/k-12-outreach/make-it-and-break-it Thompson, J., & Baker, R. (2020). WikiHow bioplastic process analysis. Educational Polymer Insights, 4, 18–25. Retrieved from https://www.wikihow.com/Make-Bioplastic Hernandez, L., & Brooks, P. (2020). Instructables bioplastic guide: Techniques and material notes. DIY Science Journal, 3, 10–18. Retrieved from https://www.instructables.com/Make-Your-Own-Bioplastics/ Evans, C., & Morgan, D. (2021). Parekhplast bioplastics classification review. International Journal of Polymer Engineering, 9, 59–67. Retrieved from https://www.parekhplast.com/blog/bioplastics--classification-types-and-uses Sharma, R., & Li, M. (2023). The Pacific Ocean garbage patch: Formation, distribution, and environmental impacts. Journal of Marine Environmental Studies, 14, 55–68. Retrieved from https://www.marineinsight.com/environment/what-is-the-pacific-ocean-garbage-patch/ Laird, K. (2016). Dutch EU building features XXL 3D-printed bioplastic façade elements. Journal of Sustainable Architectural Materials, 8, 45–57. Retrieved from https://www.ptonline.com/blog/post/dutch-eu-building-features-xxl-3d-printed-bioplastic Ziani, K., Ioniță-Mîndrican, C.-B., Mititelu, M., Neacșu, S. M., Negrei, C., Moroșan, E., Drăgănescu, D., & Preda, O.-T. (2023). Microplastics: A real global threat for environment and food safety: A state of the art review. Nutrients, 15(3), 617. Retrieved from https://www.mdpi.com/2072-6643/15/3/617
Acknowledgement
I would like to acknowledge and thank everyone who provided their help, support, and feedback throughout this process. First and foremost, I extend my gratitude to my parents, whose encouragement and assistance have been extremely valuable. I am also grateful to my CYSF coordinator, Mrs. Davis, for her continuous guidance and support throughout this entire project. Additionally, I would like to express my sincere appreciation to Professor Benjamin Tutolo and Eve Robinson from the University of Calgary for generously providing their knowledge and offering their expertise, which played a crucial role in the success of my research. I would also like to acknowledge all of the experts and professors I contacted, but were not able to get back to me such as Lisa Gieg, Mark Strous, Joe Harrison, and Jurgen Gailer. Lastly, I would like to extend a special thanks to Louis Riel school and CYSF for this exciting opportunity.