
The Effects of the Raw 16S Reads of Genera in the Gut Microbiome on the Mental Health of Humans
Ivan Raizada, Matthew Sun
Webber Academy
Grade 9
Presentation
Problem
Major Depressive Disorder (MDD) is a chronic and serious mental health condition that affects mood, cognition, behaviour, and overall functioning. It is characterized by persistent feelings of sadness, low energy, difficulty concentrating, sleep disturbances, appetite changes, and, in more severe cases, psychomotor impairment and suicide. Although depression is often discussed in adult populations, adolescence represents one of the most vulnerable periods for the onset of MDD. During this tumultuous stage of life, individuals undergo rapid neurological, hormonal, and psychosocial development, all of which may interact with environmental stressors to increase susceptibility to mental illness. Despite this heightened vulnerability, the biological mechanisms underlying adolescent depression remain incompletely understood, and objective diagnostic tools remain limited.
At present, diagnosis of MDD relies primarily on clinical interviews and self-reported symptom scales such as the Hamilton Depression Rating Scale (HAM-D). While valuable, these tools are inherently subjective and detect illness only after symptoms have already manifested. Unlike many other areas of medicine, psychiatry lacks widely accepted biological markers that can assist with early detection, risk assessment, or monitoring of disease progression. This limitation has driven increasing interest in identifying measurable physiological indicators associated with depressive disorders.
One emerging area of investigation is the human gut microbiome—the diverse ecosystem of microorganisms residing primarily in the gastrointestinal tract. Beyond its established roles in digestion and metabolism, the microbiome interacts extensively with the central nervous system through the gut–brain axis (GBA), a bidirectional communication network involving neural, endocrine, immune, and metabolic signaling pathways. Through mechanisms such as vagal signaling, regulation of the hypothalamic–pituitary–adrenal (HPA) axis, and the production of microbial metabolites including short-chain fatty acids (SCFAs), gut bacteria may influence inflammation, neurotransmitter activity, stress responses, and neuroplasticity—processes closely linked to depression.
In adult populations, several studies have reported associations between depressive disorders and altered abundances of bacterial genera such as Faecalibacterium, Bifidobacterium, and Roseburia, organisms known to contribute to anti-inflammatory activity and metabolic homeostasis. However, findings remain variable, and causal relationships are still under investigation. More importantly, the vast majority of microbiome–depression research has focused on adults, leaving adolescents significantly underrepresented despite being a critical and vulnerable group for understanding early disease development.
This gap is substantial because the adolescent microbiome differs structurally and functionally from that of adults. Ongoing maturation of the gut microbial community, combined with developmental changes in brain structure, immune regulation, and endocrine signaling, suggests that microbiome–brain interactions may not mirror those observed later in life. As a result, conclusions drawn from adult studies cannot be assumed to apply directly to adolescents, creating a need for age-specific investigation.
Another limitation in current research is the difficulty of translating observed microbial differences into practical analytical frameworks. Many studies identify statistical associations but do not evaluate whether microbial patterns can be used predictively. Machine learning approaches provide an opportunity to address this challenge by analyzing complex, high-dimensional microbiome datasets to determine whether combinations of bacterial features can distinguish between health states. Support Vector Machine (SVM) models, in particular, are well-suited for microbiome data due to their ability to manage nonlinear relationships and multivariate structure.
Publicly available sequencing repositories now allow independent reanalysis of raw microbiome datasets, supporting reproducibility and enabling new analytical approaches beyond those performed in the original studies. One such dataset includes 16S rRNA sequencing data from adolescents aged 13–18, consisting of 99 newly diagnosed MDD patients and 106 age- and gender-matched healthy controls. While the original investigators reported compositional differences, only raw sequencing reads were released, requiring independent quality control, bioinformatic processing, and expanded statistical and computational analysis.
Therefore, the central problem addressed in this study is twofold: first, there is a limited understanding of how gut microbiota differ between adolescents with MDD and healthy peers; and second, there is insufficient work translating microbiome data into predictive models that evaluate whether these differences contain meaningful diagnostic information.
This project seeks to address this gap by reanalyzing publicly available sequencing data using a transparent bioinformatic pipeline to identify microbial differences associated with adolescent MDD and by applying machine learning to evaluate whether microbial profiles can distinguish affected individuals from controls. Demonstrating such associations would support the hypothesis that the gut microbiome reflects measurable biological changes linked to adolescent depression and may serve as a complementary biomarker for future research, while recognizing that further validation would be required before any clinical application.
Method
2. Methodology
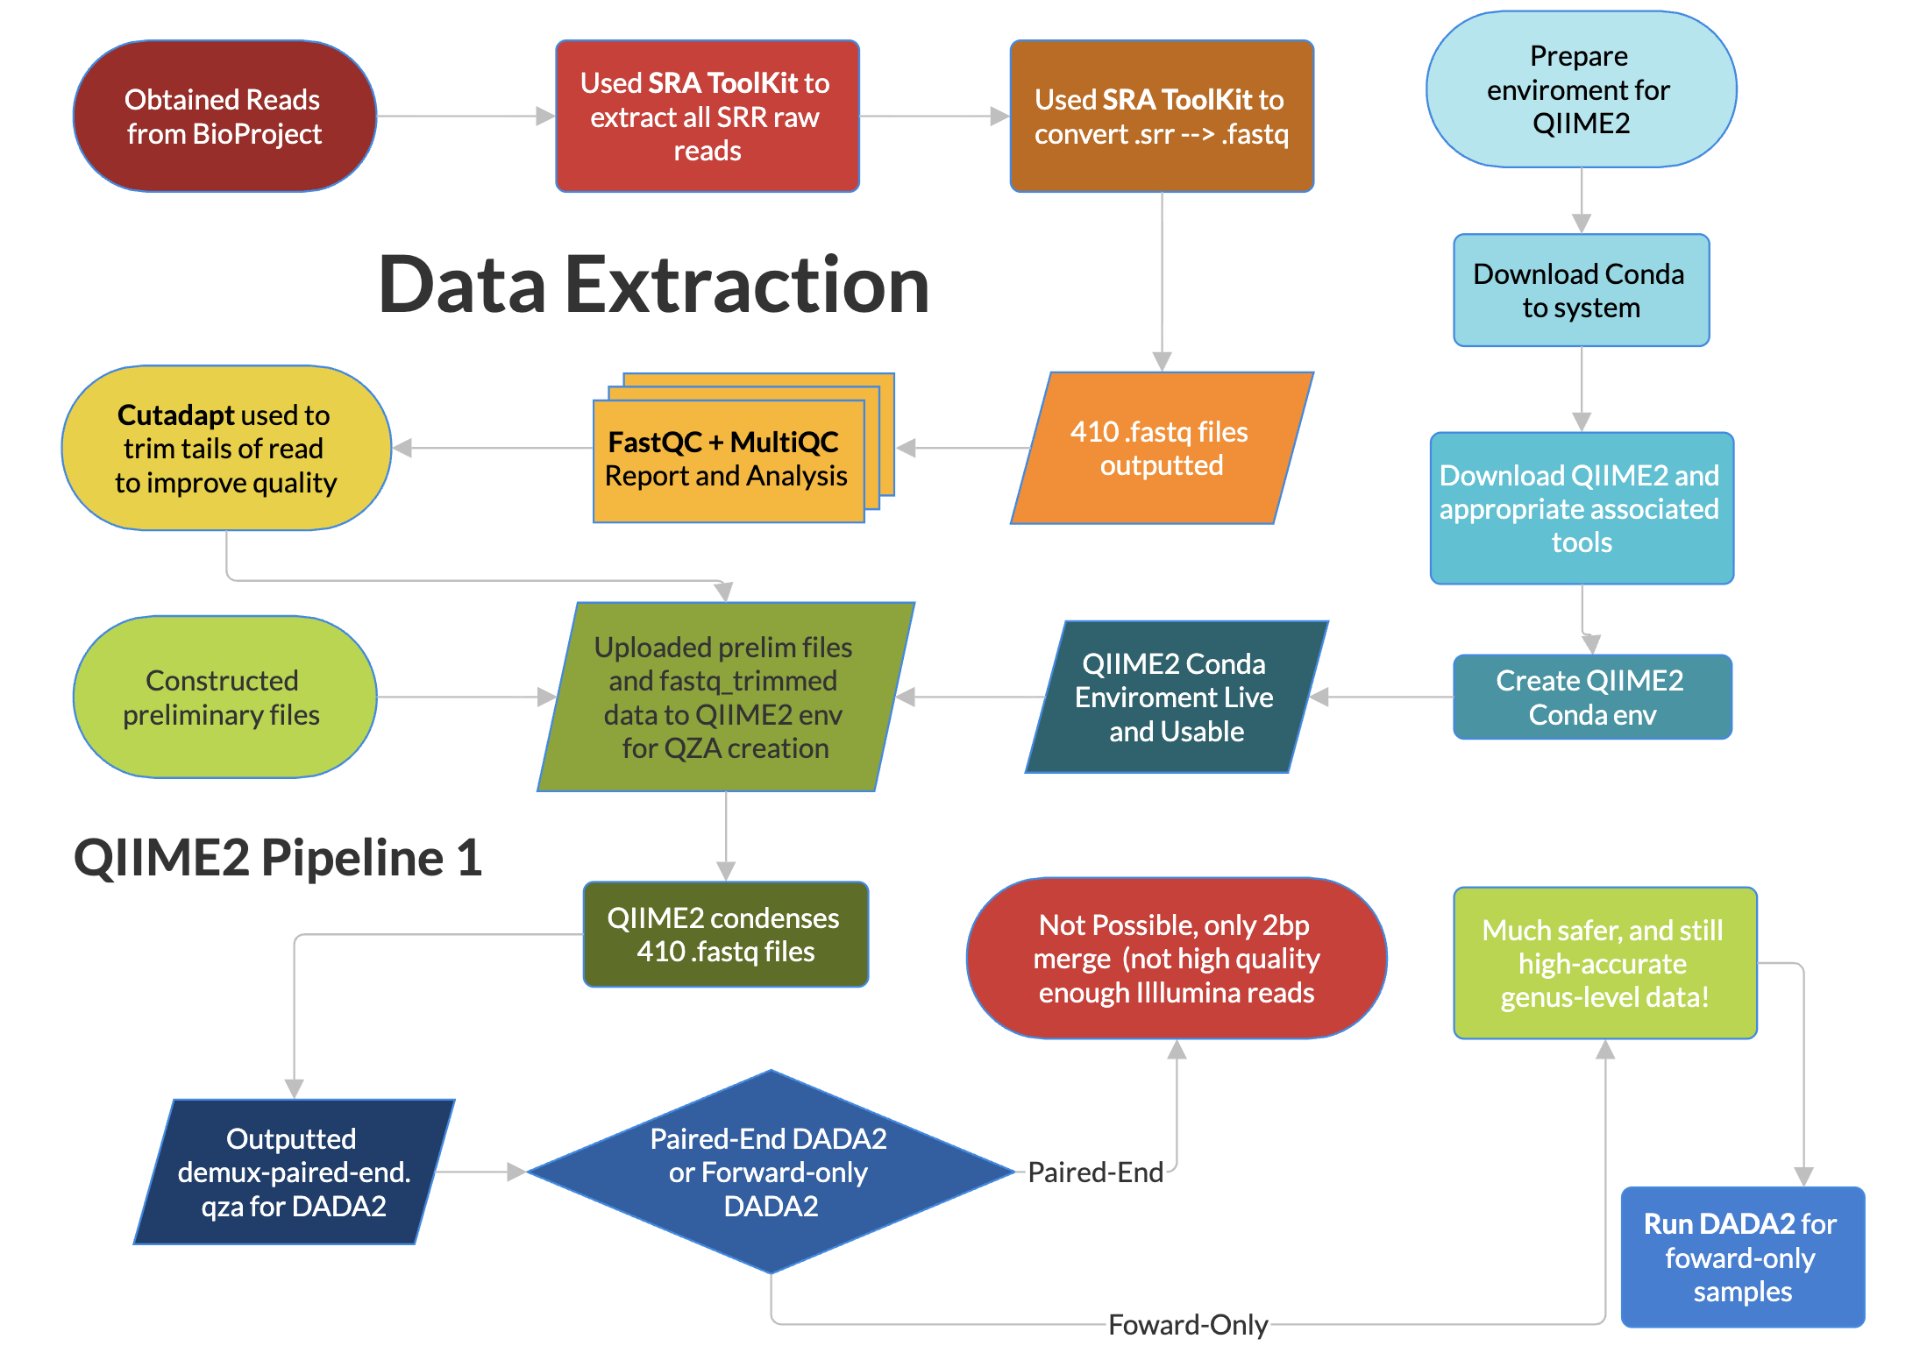
2.1. Dataset Extraction
In this part study and part experimental project, 16S raw reads for a variety of targeted bacteria were used from the study “Alterations in fecal microbiota composition and cytokine expression profiles in adolescents with depression: a case-control study” published by Yiwen Cheng et al. The data was taken from patients with major depressive disorder (or MDD) and healthy controls. Through quality control (QC) and statistical normalization methods, we aimed to evaluate the correlation and regulation of various bacteria between MDD and healthy states. Bacteria such as Bifidobacterium, Faecalibacterium, and Roseburia have been studied as they are known to have meaningful links to mental health in the adult population. This work gives meaningful insight into the new area of research on how the gut-brain axis (GBA) and the hypothalamic-pituitary-adrenal axis (HPA) interact. These findings will then be compiled into an SVM model and web tool for future researchers to be able to classify a given RPM for a given bacterium as MDD. In the study from which the data were obtained, 99 newly diagnosed patients with MDD were matched by age and gender to 106 healthy controls. Both groups fall within the predefined age range for adolescents, defined here as 13-18-year-olds. These adolescents came from Quzhou Third People’s Hospital, China. The study diagnosed MDD using the Hamilton Depression Scale (HAM-D). An HAM-D score greater than 20 was associated with a score greater than 28, no autism or bipolar disorder, no administration of probiotics, antibiotics, or synbiotics in the past month, among others. From these patients, 2g of fecal waste was collected, and the bacterial genomic 16S genes were extracted using QIAamp DNA Stool Mini Kit, and the sequencing was done using Illumina NovaSeq™ 6000 system (Illumina). The study then published only the raw reads as a BioProject for other researchers to use. The study then performed multiple methods of QC using Quantitative Insights Into Microbial Ecology 2 (QIIME2) and its tools (like Cutadapt and VSEARCH) to get finalized amplicon data, free of fragmented sequences and chimera sequences. They then graphed this data and used other statistical methods (such as White’s nonparametric t-test, independent t-test, or Mann-Whitney U-test) to determine the strength of correlation in order to build conclusions. In our study, we aim to take this one step further.
Yiwen Cheng et al. did not publish the finalized data with all the QC completed. Rather, they only published the raw 16S reads in the GenBank Sequence Read Archive with id PRJNA1137557. From here, we head to replicate the QC and conversion steps undertaken, and to accomplish this task, we first indirectly downloaded all 205 patients using the SRA Toolkit’s fastq-dump and prefetch, and these files were subsequently stored on our system. We converted these files to .fastq files, as this format can more easily be run through further methods of QC. Each person’s data was also split into 2 files, as they were paired-end reads (one forward and one reverse). We were then ready to undergo preliminary QC and QC.
2.2. Statistical Analyses and QC
Once all the files had been converted to .fastq, it was in the correct format for us to assess the quality of the files. This was done using the modules FastQC and MultiQC. FastQC was used to identify the quality of a single fastq file, while MultiQC was able to summarize all the FastQC outputs into one file. From this, we were able to determine if the PCR primers were still present (as this could skew the data), and we noticed that the ends of the reads were very weak and variable, and since the original paper cut them off to preserve quality for further QC, we decided to do that as well, also with Cutadapt. After analyzing the MultiQC output and performing rudimentary trimming based on the above output, we downloaded the latest version of QIIME2 at the time and were ready to upload the trimmed data to QIIME2 (using a Conda environment).
We constructed a manifest.csv and .tsv file according to the documentation to give QIIME2 the information to classify the runs as from an MDD patient and from a Control patient. This data was difficult to obtain ourselves, and had to be obtained not from the Bioproject, but was available in the SRA Run selector. This then had to be put into the correct format before being usable. The manifest file also points to the location of each forward and reverse fastq file alongside its SampleID to QIIME2. This is the requirement for the QIIME2 format “PairedEndFastqManifestPhred33”, used. This first step of QIIME2 synthesizes and condenses all the data from all 410 files into a more downstream-friendly QIIME artifact (demux-paired-end.qza). Once done, QIIME2 creates a .qsv summary as well as the data’s quality. This allows us to determine at which point quality drops, and the data can be cut at that point (within reason). We opened and analyzed the .qsv file in order to analyze the quality of the data once more and compared that to the MultiQC report. Quality scores remained high (median Phred score = 37). Optimal quality was preserved for 233 bp in forward reads and 229 in reverse reads. As such, using Cutadapt with this new information, the reads were trimmed to these figures (only 1-2bp trimmed).
The next step in the QIIME2 pipeline was denoising with a tool in QIIME2, the Divisive Amplicon Denoising Algorithm 2 (DADA2). This was not paired-end denoising, which would have been ideal. Paired-end denoising using both ends of the DNA (for a total of >460bp of data rather than only 233). This allows for fewer ‘unclassified’ results, higher accuracy species-level data, and lower false-positives and false-negatives through correction and comparison between the paired ends. Instead, however, forward-only denoising had to be done as DADA2 requires a combined merged read of at least 472bp, with the ideal maximum being 500bp. We only had 462bp, unfortunately, due to how the Illumina processing was carried out by the researchers. During Illumina processing, each subsequent cycle gives 1bp of the raw reads. However, for the 500 cycles undertaken, cycles near the end have more noise and less signal intensity due to cumulative error and the age and instability of the DNA after so many cycles. This limitation was expected, with an existing threshold of losing 27bpbeings the system baseline to account for this. However, unfortunately, the researcher’s Illumina was only able to produce a total of 462bp, and lost too much, a common quality error for public datasets. This is not enough for DADA2 to run paired-end denoising, and only one end had to be used. While and unfortunate setback, it allows for meaningful diversity metrics, statistical abundance and tests, and accurate genus-level taxonomic results. High-accuracy species-level taxonomic results would not be statistically viable, however.
The forward-only reads were of higher quality than the reverse reads (for the same cumulative error and degradation with age reasons above), and thus they were the end chosen for subsequent DADA2. We then used DADA2 in order to denoise, remove chimeras, remove overrepresented primers, and finally get clear amplicon sequences. Following DADA2, it was concluded that the data were of remarkable and consistent quality. It was enough for any genus-level downstream analysis, statistical tests, and eventual ML. The following steps in the QIIME2 pathway use built-in commands to calculate statistical metrics, tabulate, and graph the results.
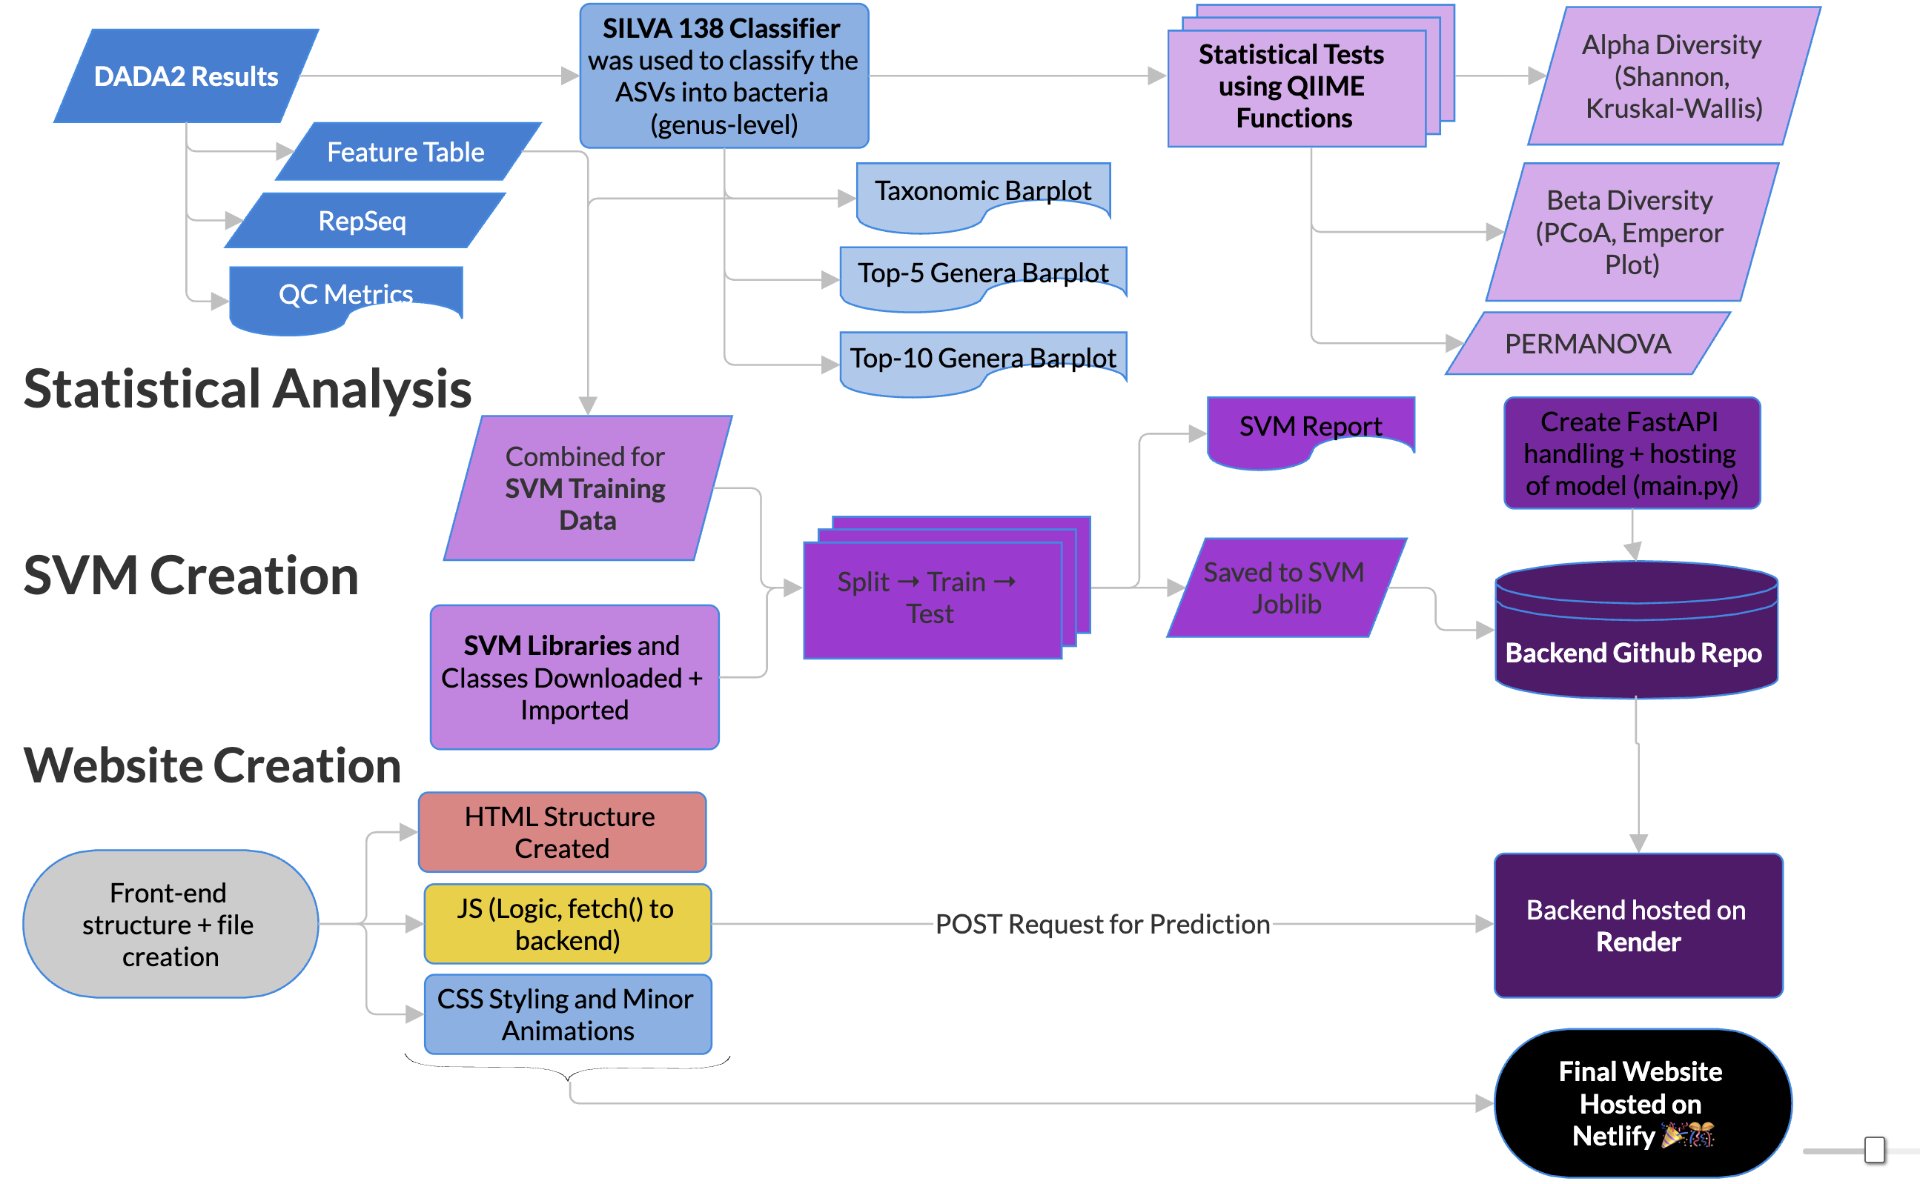
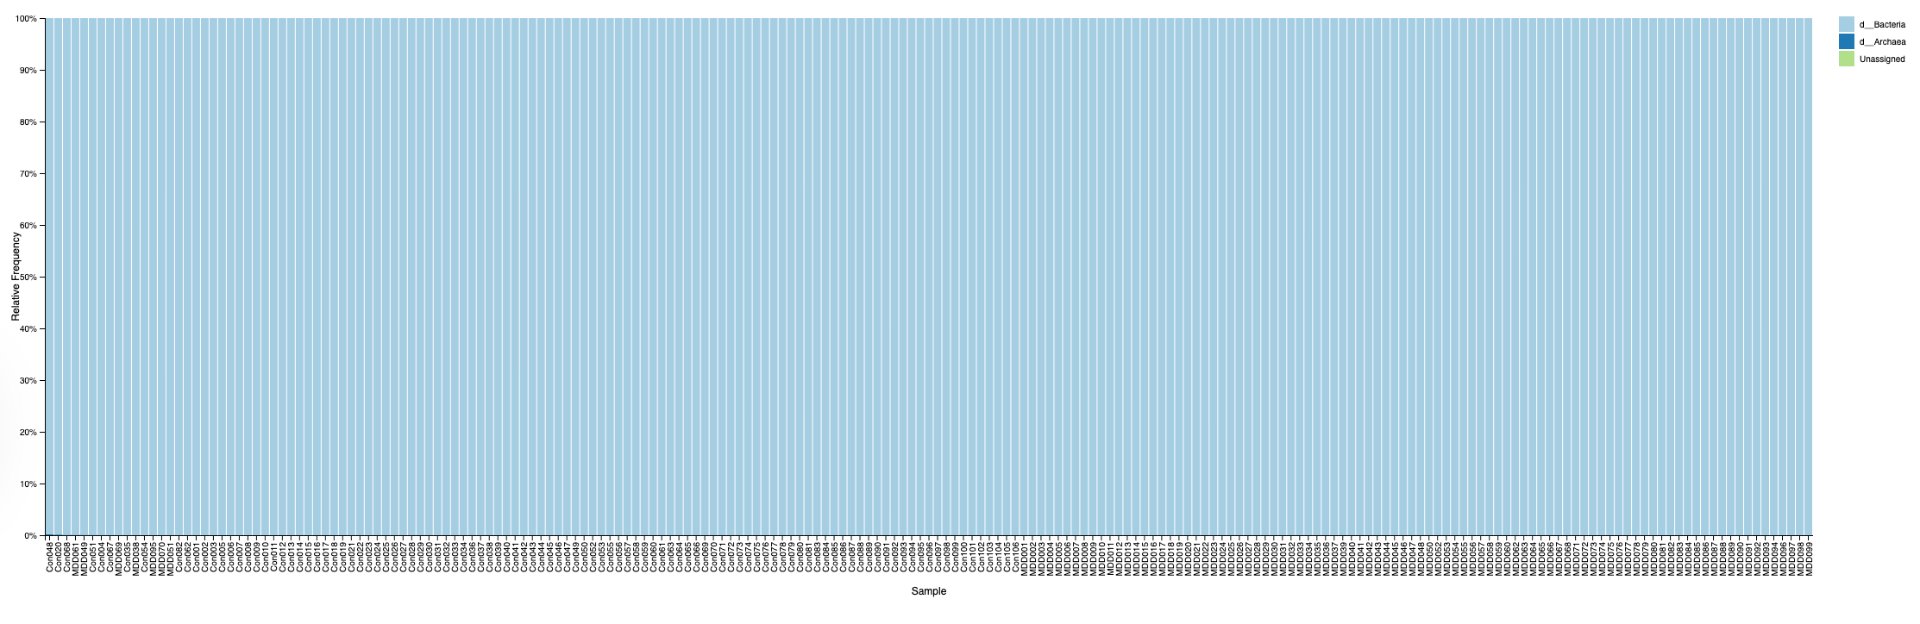
In order to determine correlations and compare the regulation of different bacteria between MDD and healthy adolescents, the reads had to be classified for bacteria up to the genus level. This was undertaken using a pretrained classifier, like SILVA 138 99%, we are able to classify different bacteria from the 16S amplicon data(in the format .asv) in order to build correlations and have meaningful taxonomic graphs for the general public. We can also create taxonomy plots using built-in QIIME2 functions in order to better understand the resultant finalized data. We can also create a rooted phylogenetic tree and compute different biodiversity metrics (Shannon index for Alpha Diversity, compared using Kruskal-Wallis, PCoA, and Emperor Plots on Bray-Curtis distance matrices for Beta Diversity). We reached conclusions such as how the gut bacteria were less diverse in MDD adolescents with major statistical significance. PERMANOVA determined that the two communities were indeed fundamentally different. The PCoA emperor plot showed partial distinction (expected in microbiome studies). Further study can also compare the biodiversity metrics to adults and see if they match other studies of the same topic.
2.3 Machine Learning and Webtool Creation
In order to create the web tool and the machine learning model, using QIIME2’s csv export function, the data was exported and formatted so it could be processed by the SVM. Using scikit-learn (sklearn)’s built-in SVC class, the data was split 75- 25 into training and testing data for the class. The SVM model was set up with an RBF kernel, with the C-factor set to ‘1’ and the gamma to be ‘scaled’. Once trained, the SVM model was found to have a highly defendable and solid accuracy of 0.79 and ROC-AUC of 0.85, for a noisy microbiome set, with only parameters being MDD and Control.
From these positive results, we aimed to publicly display our model and relevant information to the world. Using HTML, CSS, and JavaScript directly in VSCode, the frontend of the website was manually created. It has a homepage, pages on the limitations, a brief methodology, and a page on the results and statistics of the model. Lastly, there is an interactive interface where users can interact with the SVM model. The model was saved as a joblib before the main.py FastAPI backend was created. This was hosted on GitHub as a repository (along with a separate repository for the frontend), and the backend repo was connected and hosted live on Render. JavaScript was used to create a ‘POST’ request to the render URL using fetch(). This was then displayed using JavaScript on the website itself. The entire frontend system was hosted for free on Netlify, using this link (svm-mdd.netlify.app). Through linking all the web services together, a final cohesive live product was obtained. These results that we gained will solidify our understanding of the gut-brain axis and how it differs between teens who have MDD and those who are comparably healthy. It will help and contribute to the scientific literature by offering an aesthetically pleasing method for experimenting with bacteria’s relation to MDD in teens.
Research
3. Background Research
3.1. Mental Health Disorder Prevalence
From 1990 to 2017, the number of major depressive disorder (MDD) global cases has increased by a total of 49.86%, with about 258 million documented cases in 2017 from an estimate of 172 million in 1990 [1]. Part of this increase is reflected in overall population growth, for the global population has increased by over three billion people in the time period [2].
However, an increase is still reflected in the distribution of depressive disorders, which is concentrated around adolescents aged 12–19, with 19.2% of all adolescents in this age group having some form of depression, which is significantly higher than the other age groups [3]. This discrepancy is especially prevalent in females, where ages 12–19 have a rate of 26.5% compared to the overall average of only 16.0%. In males, the 12–19 age group does not have the highest rate among all age groups, yet it still has a significantly higher proportion than the overall average [3]. However, regardless of its prevalence by age or sex, MDD is ranked third as the leading cause of disability worldwide and is projected to be ranked first by as early as 2030 [4].
To combat this rising issue of depression, many advancements in treatment and diagnosis have been made or are currently in development. A key research focus here is the role of the GBA, which could provide insight into the role of diet and bacteria in causing MDD, or the effects of MDD on the microbiome [31, 32].
3.2. The Microbiome
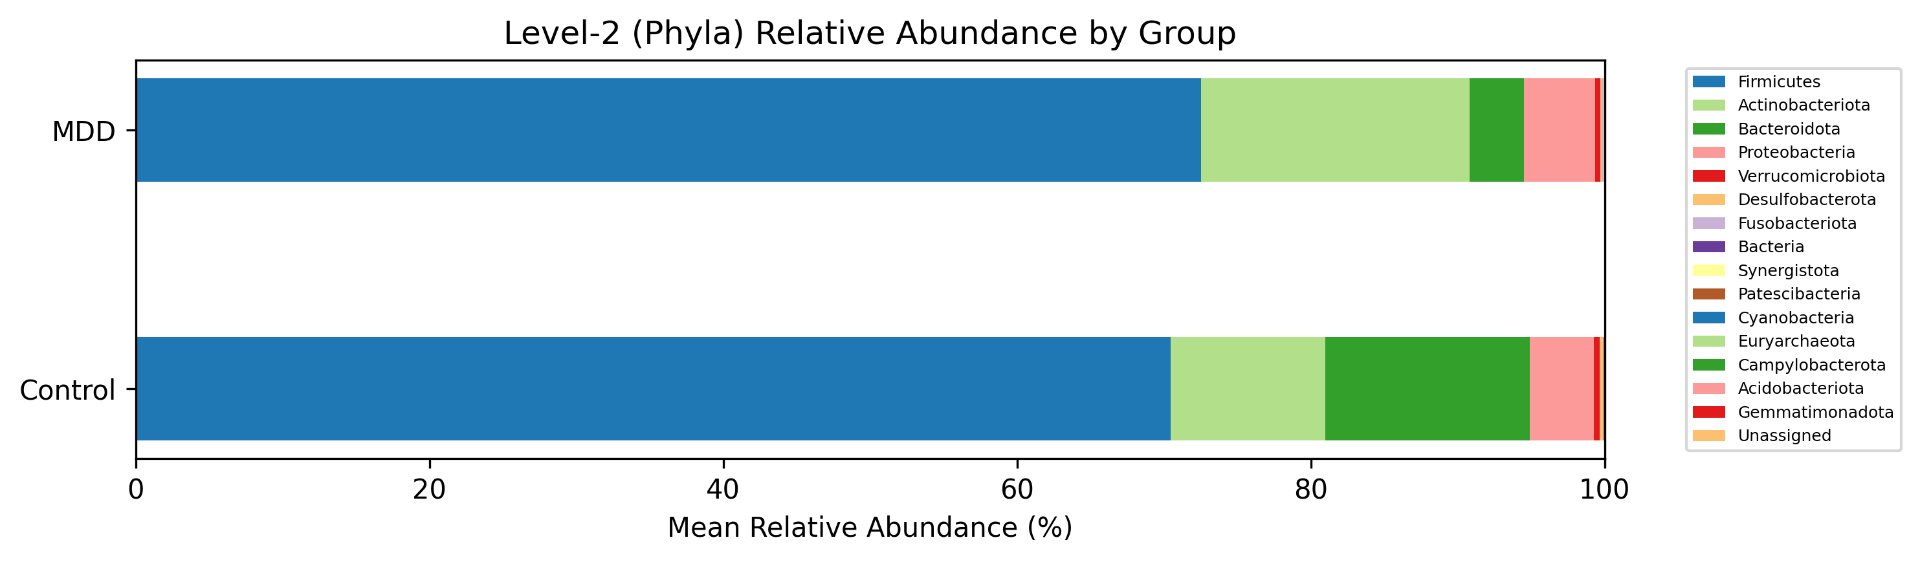
The human microbiome is a collection of many unique species of commensal bacteria, with most being from the four phyla of Firmicutes, Bacteroidetes, Actinobacteria, and Proteobacteria [28]. It serves many roles, including managing the immune system via training and downregulation, protection against harmful bacteria, digesting food, synthesizing short-chain fatty acids (SCFAs) and vitamins, as well as influencing the gut-brain axis using hormones, immune signals, and neural pathways [28].
The main method in which the microbiome influences the immune system is the production of metabolites. These molecules can bind to the receptors of many different immune cells in the intestinal tract as a sort of messenger to the immune system [31]. The production of certain SCFAs is essential for intestinal homeostasis. Furthermore, certain G-protein coupled receptors, specifically GPR43, GPR41, GPR109A, and OLFR78/OR51E2, are responsible for detecting SCFAs in the intestines and improving immune responses. However, SCFAs are not the only metabolites produced by gut microbiota that affect the immune system. Others include indole, which maintains intestinal homeostasis and the intestinal barrier via aryl hydrocarbon receptor signalling, histamines stimulating antigen-presenting capacity and cytokine production, and many more.
3.3. Role of the Gut-Brain Axis
The gut-brain axis (GBA) is the name for the bidirectional network between the brain and central nervous system (CNS) functions and the microbiota in the gut region [5]. The microbiome in the gut plays a key role in managing stress responses, mood, cognition, and disease risks [5].
A major effect that the microbiome plays on the GBA is its influence on tryptophan metabolism. Tryptophan is an essential amino acid derived from the diet that is the sole precursor for the biosynthesis of serotonin and kynurenine metabolites in the liver [6, 7]. The latter can be further metabolized into kynurenic acid (KYNA) or 3-hydroxykynurenine (3-HK), and into quinolinic acid (QUIN), which is neurotoxic [9]. This is controlled by the enzyme indoleamine 2,3-dioxygenase (IDO), where expression catalyzes the breakdown of tryptophan along the kynurenine pathway. Under normal conditions, most kynurenine in the brain is processed into KYNA. However, high levels of cytokines can cause higher levels of kynurenines to be metabolized into 3-HK and hence QUIN [9]. Higher levels of QUIN have been associated with many depressive disorders, such as MDD, as well as neurodegenerative diseases such as Alzheimer’s [10].
Many taxa in the microbiome regulate the metabolism of tryptophan. Most tryptophan is absorbed through the small intestine; however, some reaches the large intestine, where bacteria break it down into tryptamine. Tryptamine is a monoamine that is similar to serotonin [6]. An important effect of tryptamine is its ability to activate serotonin (5-hydroxytryptamine) receptors, mimicking serotonin’s effects [11].
Furthermore, bacterial colonization in the intestines can affect the intestinal immune response. Because the immune system affects tryptophan metabolism, mice raised in a sterile environment show reduced amounts of kynurenine and more tryptophan available in the blood. However, these levels are normalized after bacteria are introduced post-weaning [6].
This reduction of tryptophan metabolized into kynurenine has been associated with depression. In a study involving post-mortem tissue, prefrontal cortex tissue taken from depressed individuals showed that their bodies converted significantly less tryptophan to kynurenine than healthy controls. The kynurenine:tryptophan ratio was 0.038 for depressed individuals compared to 0.045 for controls [12].
3.4. Link Between Taxa and MDD
While every human has a unique gut microbiome, its composition remains significant in gut health and preventing disorders both within and outside of the intestinal tract [13]. The microbiome is affected by many aspects, such as diet and lifestyle, that change the levels of expression of different bacterial taxa, where altered amounts have been correlated with certain disorders [13].
One such example is Firmicutes, a phylum of bacteria able to break down complex polysaccharides into butyrate and other SCFAs, the main three being acetate, propionate, and butyrate [14, 15]. Butyrate is especially powerful in modulating the kynurenine pathway, as it acts as an inhibitor of histone deacetylase [16]. This, in turn, downregulates the effects of IDO and can help control activation of the kynurenine pathway, preventing inflammation-induced depression [6, 16]. This is reflected in individuals with MDD, who have much lower levels of Firmicutes compared to healthy controls [15].
The extent of SCFAs in the GBA extends further and plays a vital role in maintaining the blood-brain barrier (BBB). SCFAs are unique in that they can cross the BBB to directly communicate with the CNS and regulate nutrient delivery necessary to maintain barrier integrity. This helps prevent depressive effects associated with chronic cerebral hypoperfusion, a major contributor to degenerative CNS processes. Limited SCFA-producing flora results in reduced hippocampal SCFA levels in rats with bilateral common carotid artery occlusion, which show depressive symptoms and reduced cognitive function. When these rats were orally supplemented with additional SCFAs, many of their symptoms improved [17].
In depressed humans, similar findings are observed. In one study, Firmicutes had an average relative abundance of 43.46% in healthy stool samples, whereas samples taken from people with MDD had an average of only 28.72% [18]. This is not limited to Firmicutes, as many butyrate-producing bacteria, such as Roseburia or Faecalibacterium, exhibited similar patterns [18].
Data
| Genus | U_stat | p-value |
|---|---|---|
| g__Bacteroides | 8723 | 9.07 * 10^-14 |
| g__[Eubacterium]_ventriosum_group | 8268 | 2.48 * 10^-10 |
| g__Lachnospira | 8246 | 2.68 * 10^-10 |
| g__Halomonas | 2424 | 1.01 * 10^-8 |
| g__Parabacteroides | 7903 | 1.30 * 10^-7 |
| g__Faecalibacterium | 7901 | 1.39 * 10^-7 |
| f__Anaerovoracaceae; g__Family_XIII_UCG-001 | 7521 | 1.23 * 10^-6 |
| g__Lachnospiraceae_ND3007_group | 7685.5 | 2.23 * 10^-6 |
| g__Lachnospiraceae_UCG-010 | 7484 | 9.64 * 10^-6 |
| g__Blautia | 2902 | 1.14 * 10^-5 |
| sample_id | Blautia | Bifidobacterium | Faecalibacterium |
|---|---|---|---|
| Con001 | 0.038 | 0.005 | 0.061 |
| Con002 | 0.018 | 0.004 | 0.041 |
| Con003 | 0.149 | 0.04 | 0.205 |
| Con004 | 0.07 | 0.029 | 0.037 |
| Con005 | 0.267 | 0.096 | 0.085 |
| Con006 | 0.04 | 0.034 | 0.102 |
| Con007 | 0.124 | <0.001 | 0.124 |
| Con008 | 0.075 | 0.111 | 0.109 |
| Con009 | 0.13 | 0.039 | 0.293 |
| Con010 | 0.354 | 0.037 | 0.104 |
| precision | recall | f1-score | support | |
|---|---|---|---|---|
| Control | 0.83 | 0.74 | 0.78 | 27 |
| MDD | 0.75 | 0.84 | 0.79 | 25 |
| accuracy | 0.79 | 52 |
| Predicted (-) | Predicted (+) | |
|---|---|---|
| Actual (-) | 20 | 7 |
| Actual (+) | 4 | 21 |
Conclusion
5. Conclusions
5.1 Pre- and Post-DADA2
The conclusions drawn from FastQC and MultiQC analysis on the raw reads show overall excellent read quality, with the majority of base pairs carrying a Phred Quality Score above 30, or in the high 20s — publication quality, corresponding to a 1 in 1000 chance of sequencing error. The only issue identified was a sharp, acute drop in quality near the final 1–2 base pairs of the reads, down to a score of 10. This pointed to high overall raw read quality, with the sole concern being the tails of the reads. These were trimmed using Cutadapt to prevent any downstream errors. Following DADA2 processing, the resulting metrics confirmed that forward-only analysis produced high-quality reads. 95% of the original data passed the denoising filter, and 72% was non-chimeric — both figures sitting at the higher end of the generally accepted 70–90% range for 16S rRNA sequencing data. This gives strong confidence in the accuracy of downstream statistical analysis. Beyond quality, the quantity of reads per sample was equally strong, averaging approximately 63,000 reads per sample, firmly within the 50,000–100,000 range established as publication quality for 16S rRNA studies. Together, these two factors confirm that the dataset was reliable and relatively error-free, providing a solid foundation for all subsequent analysis.
5.2 Statistical Analysis
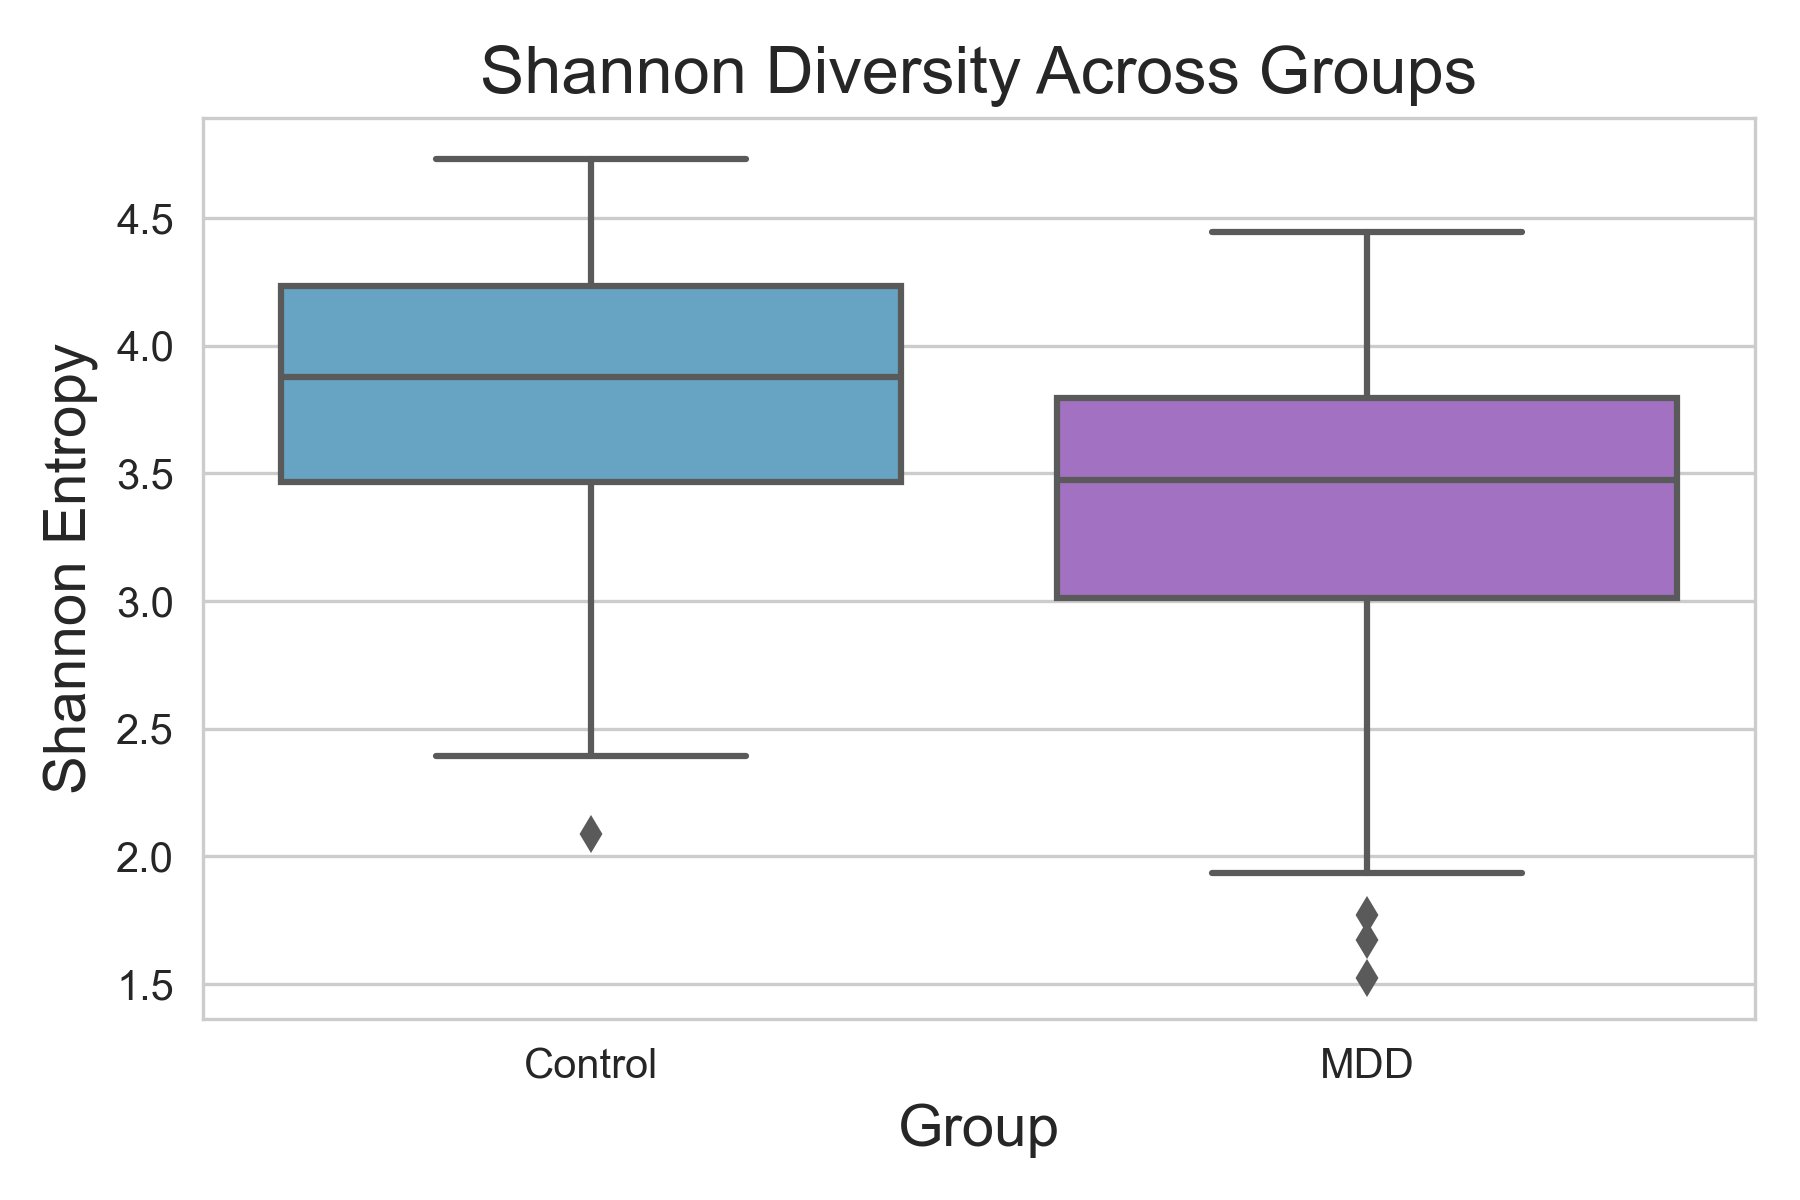
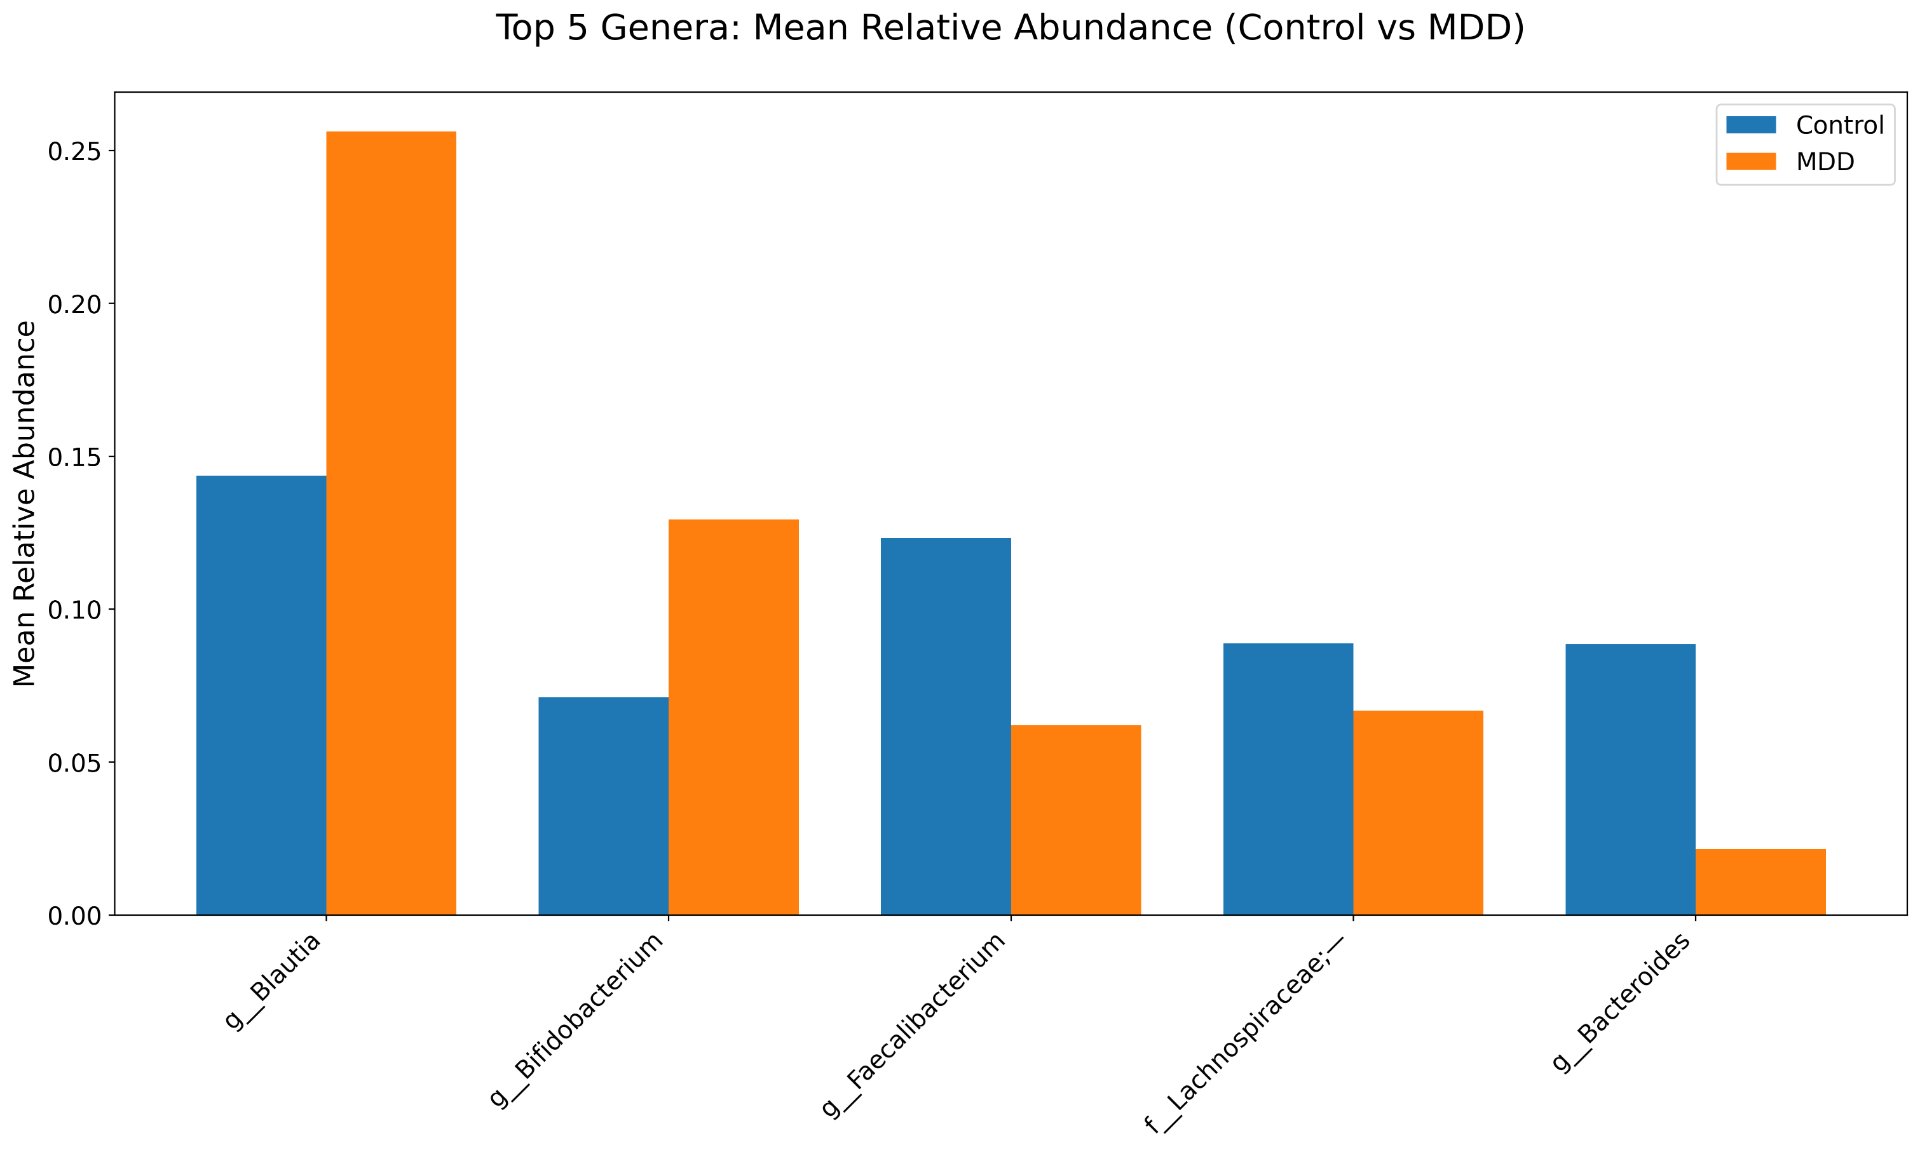
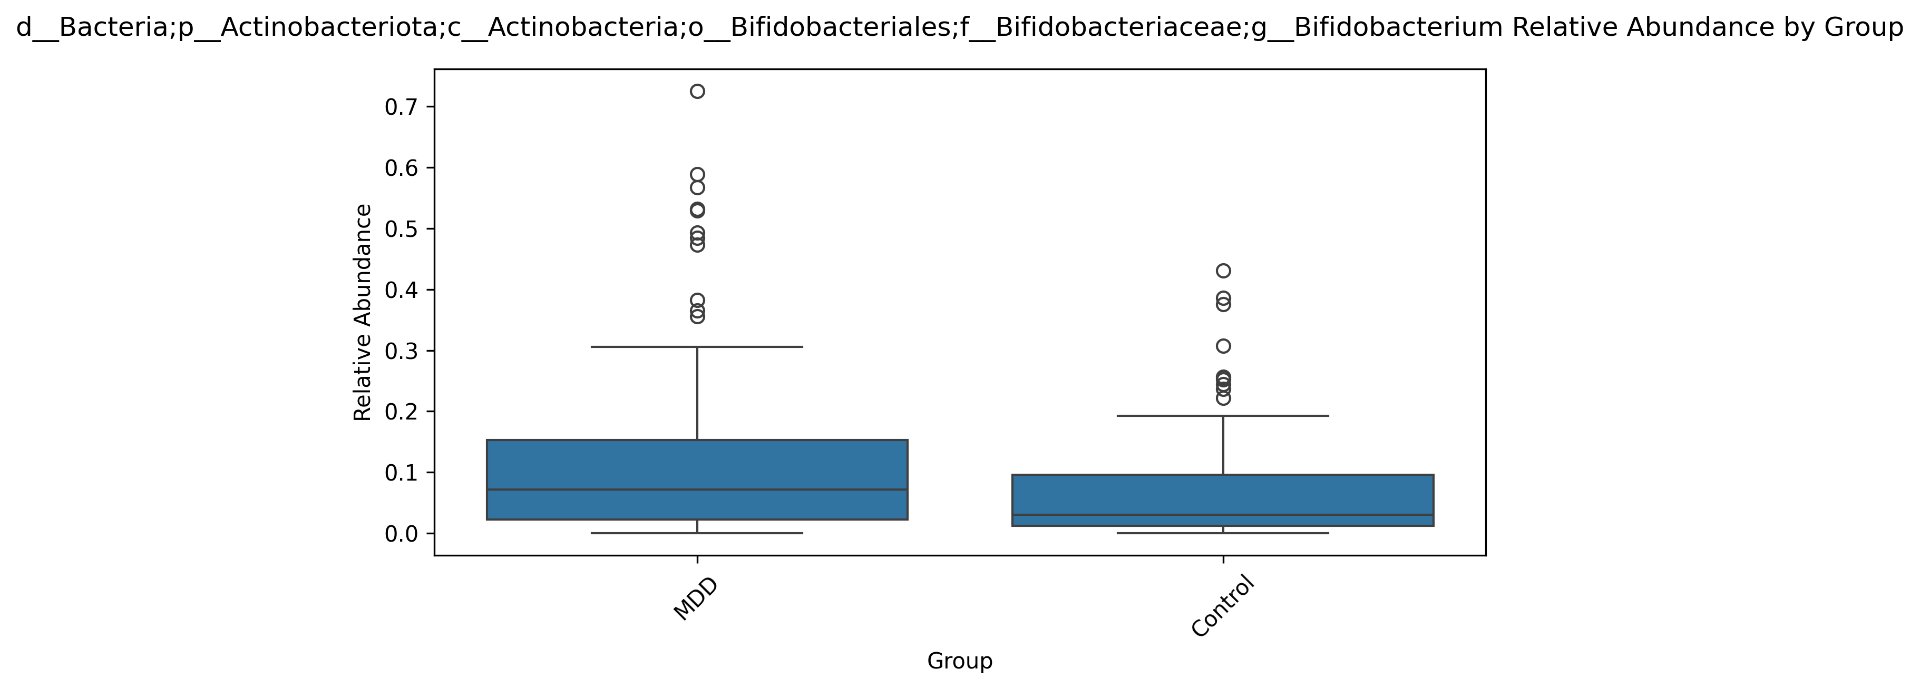
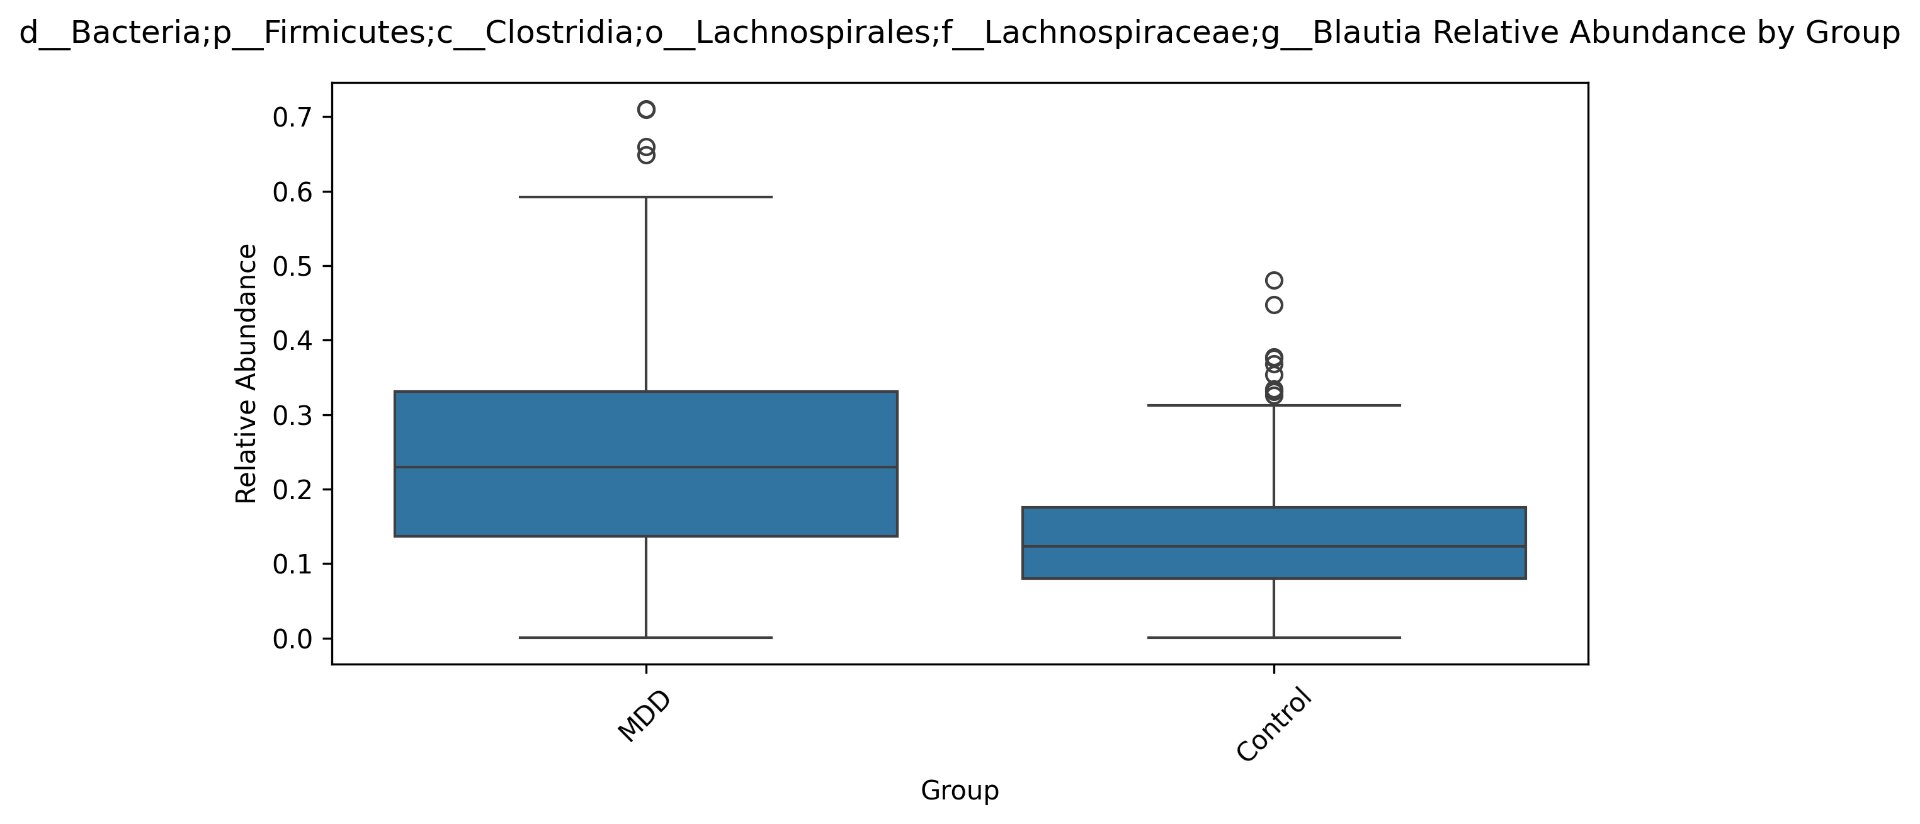
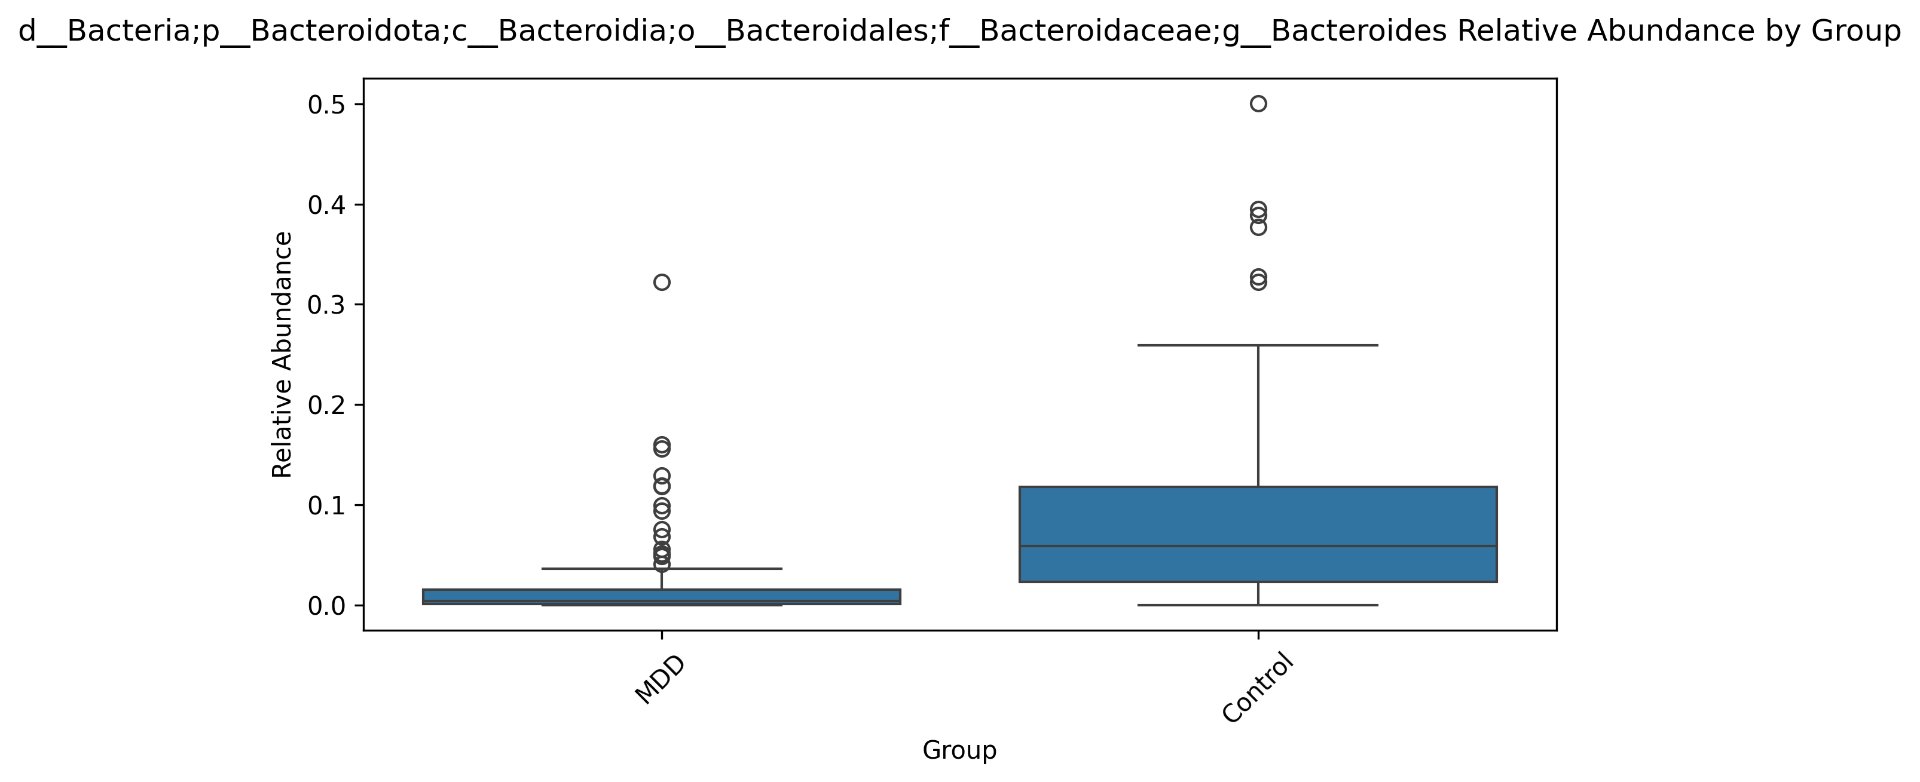
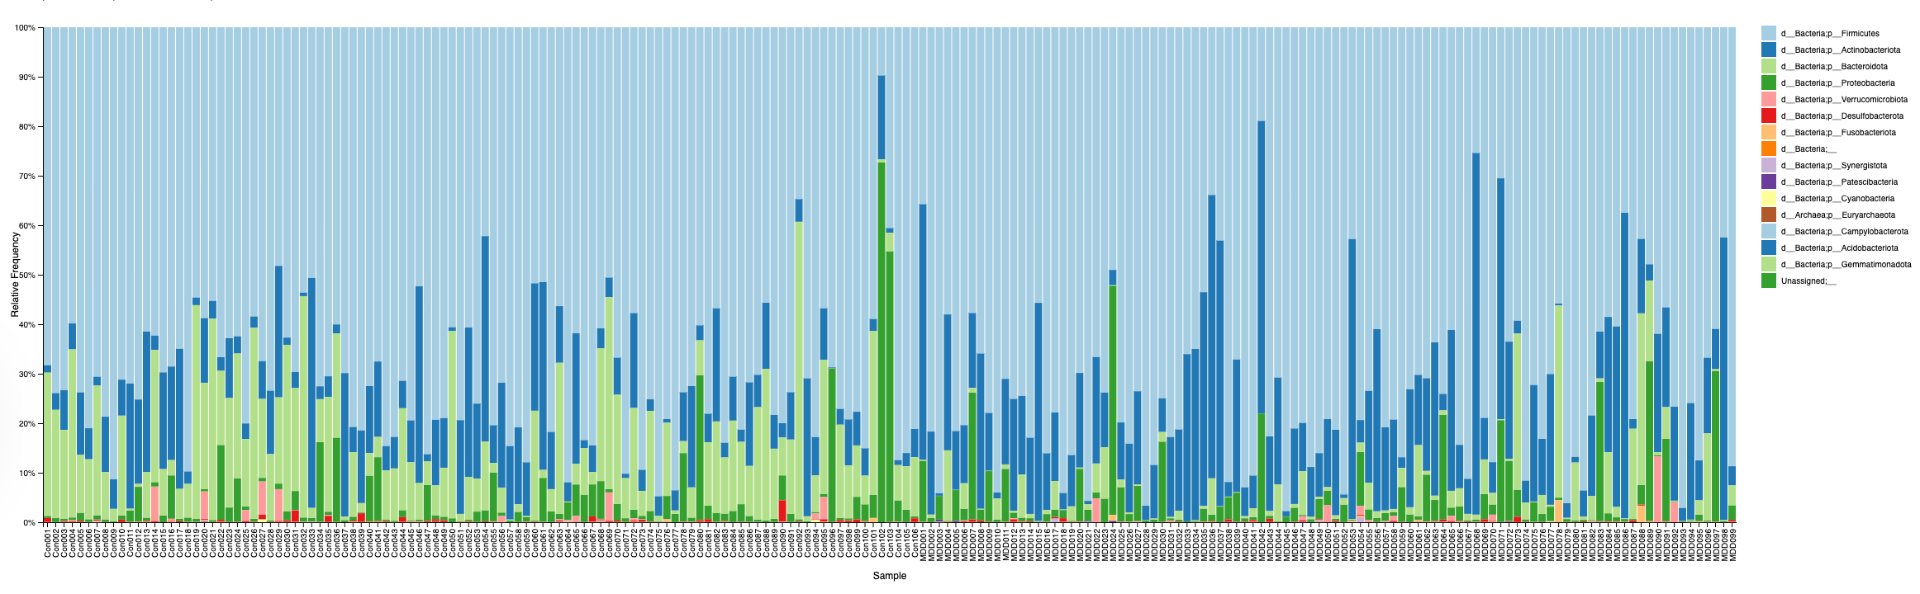
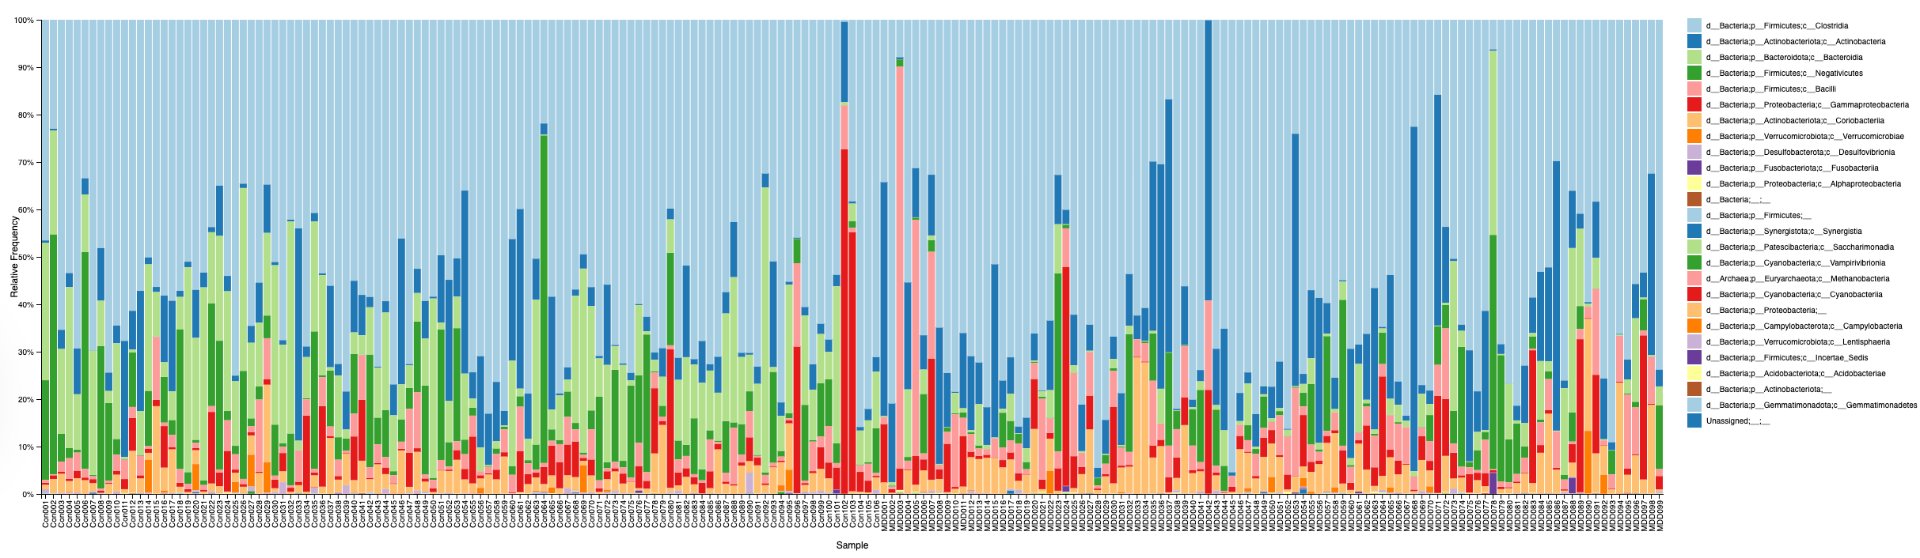
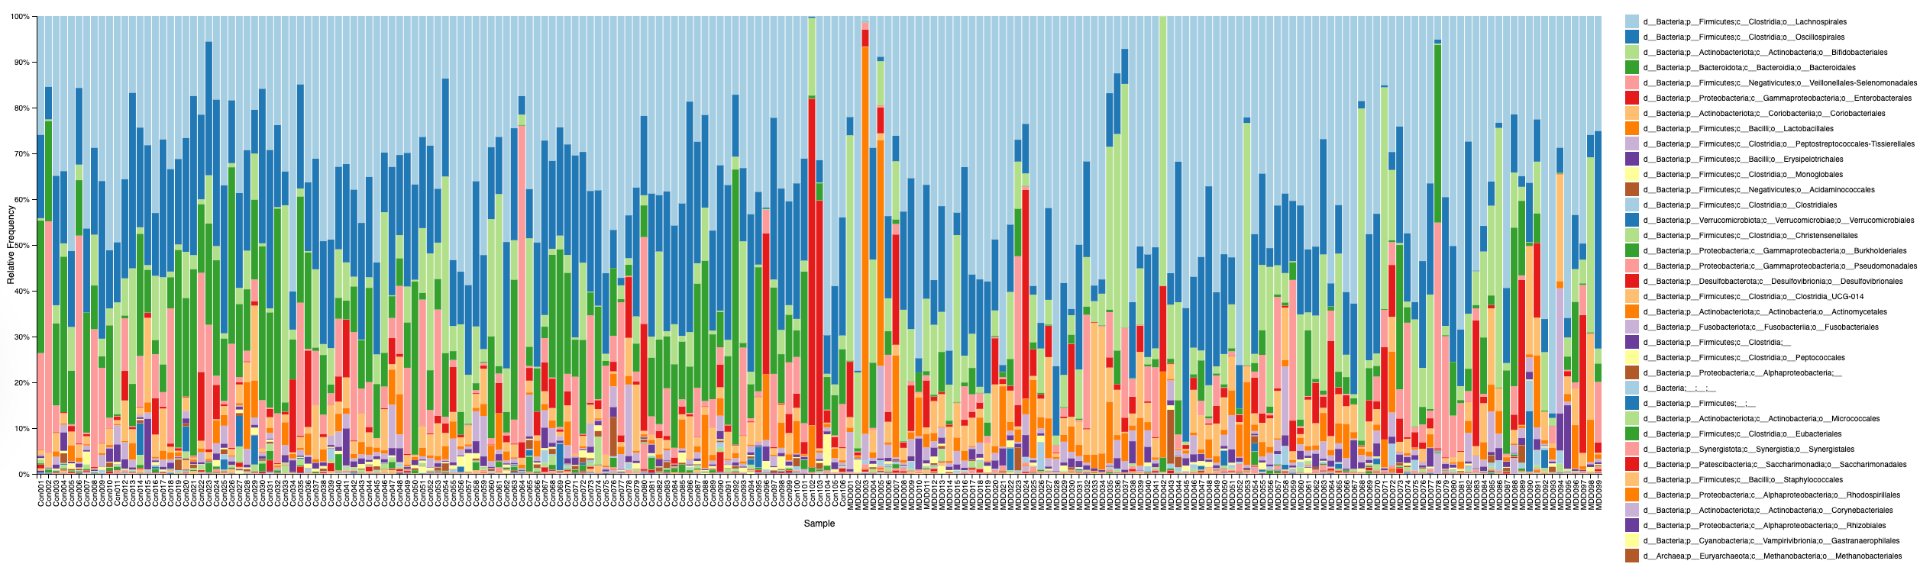
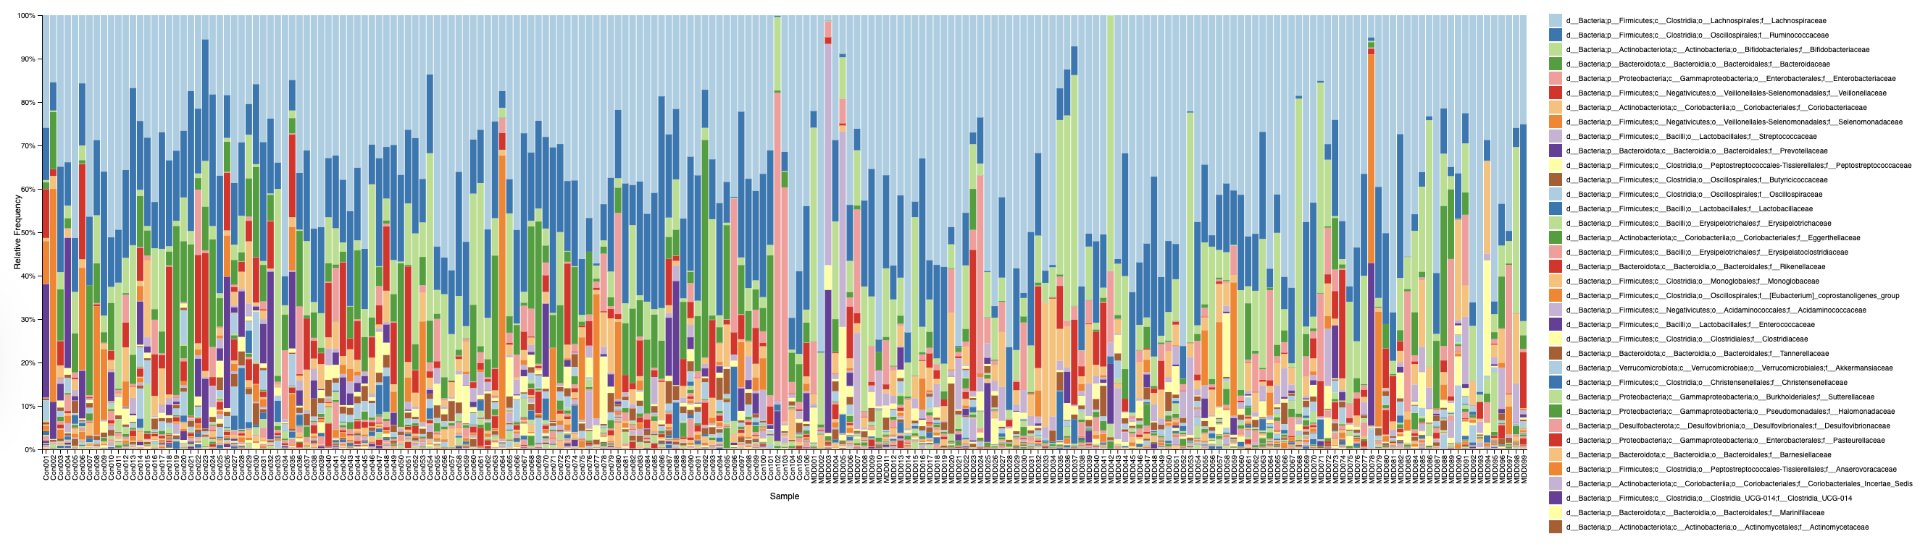
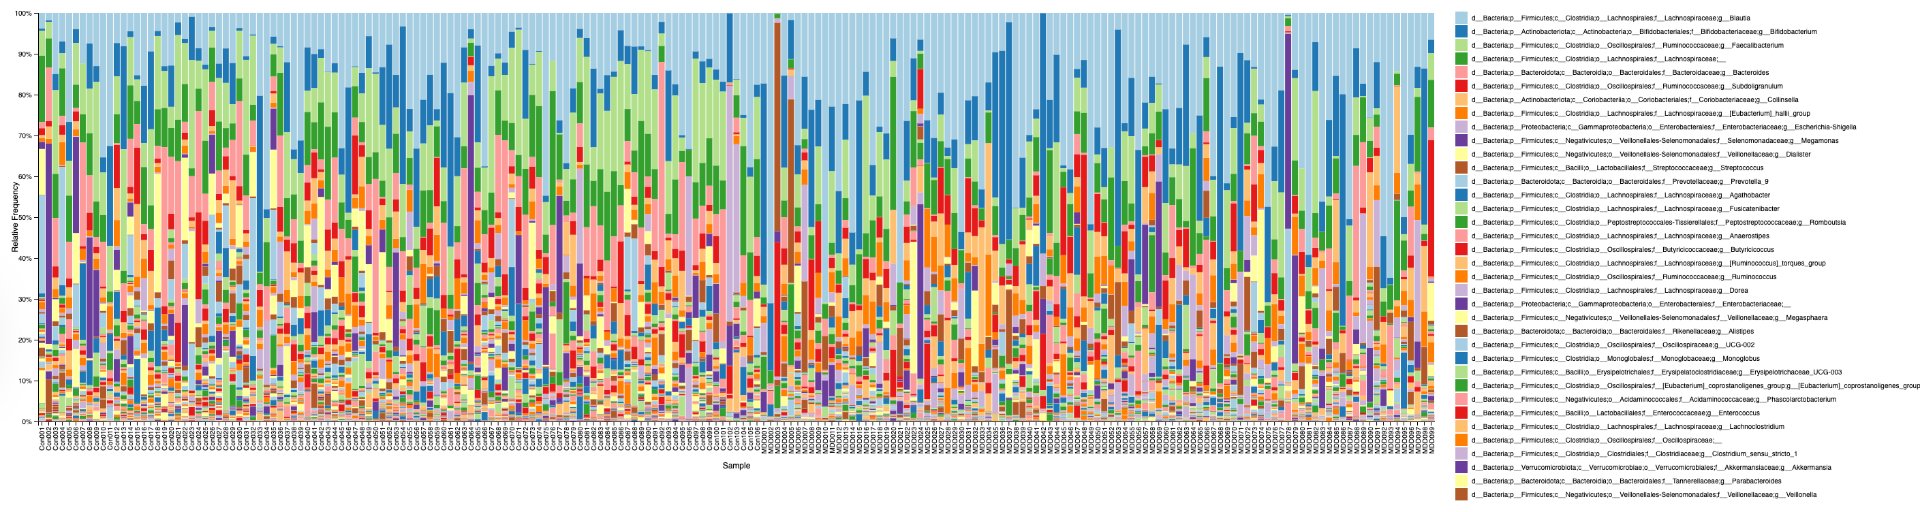
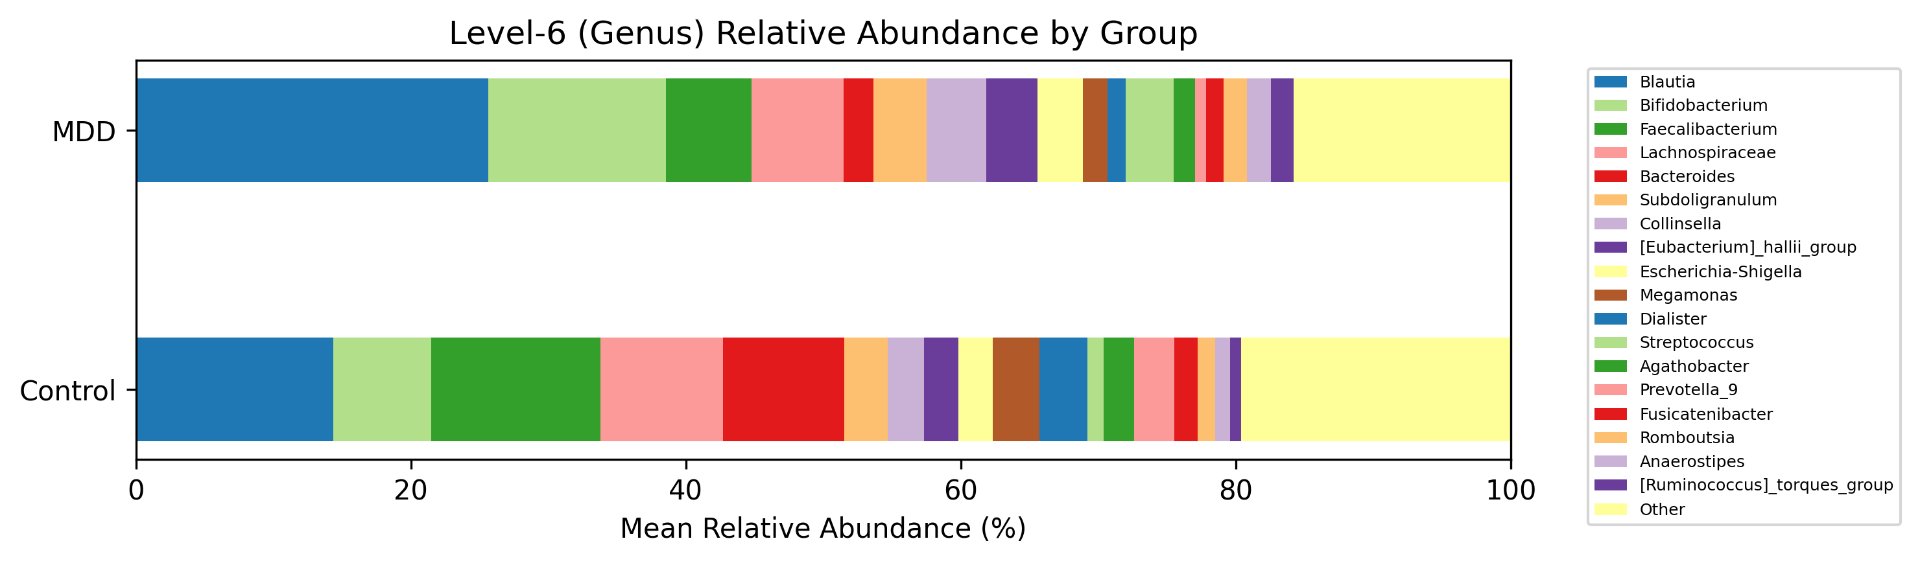
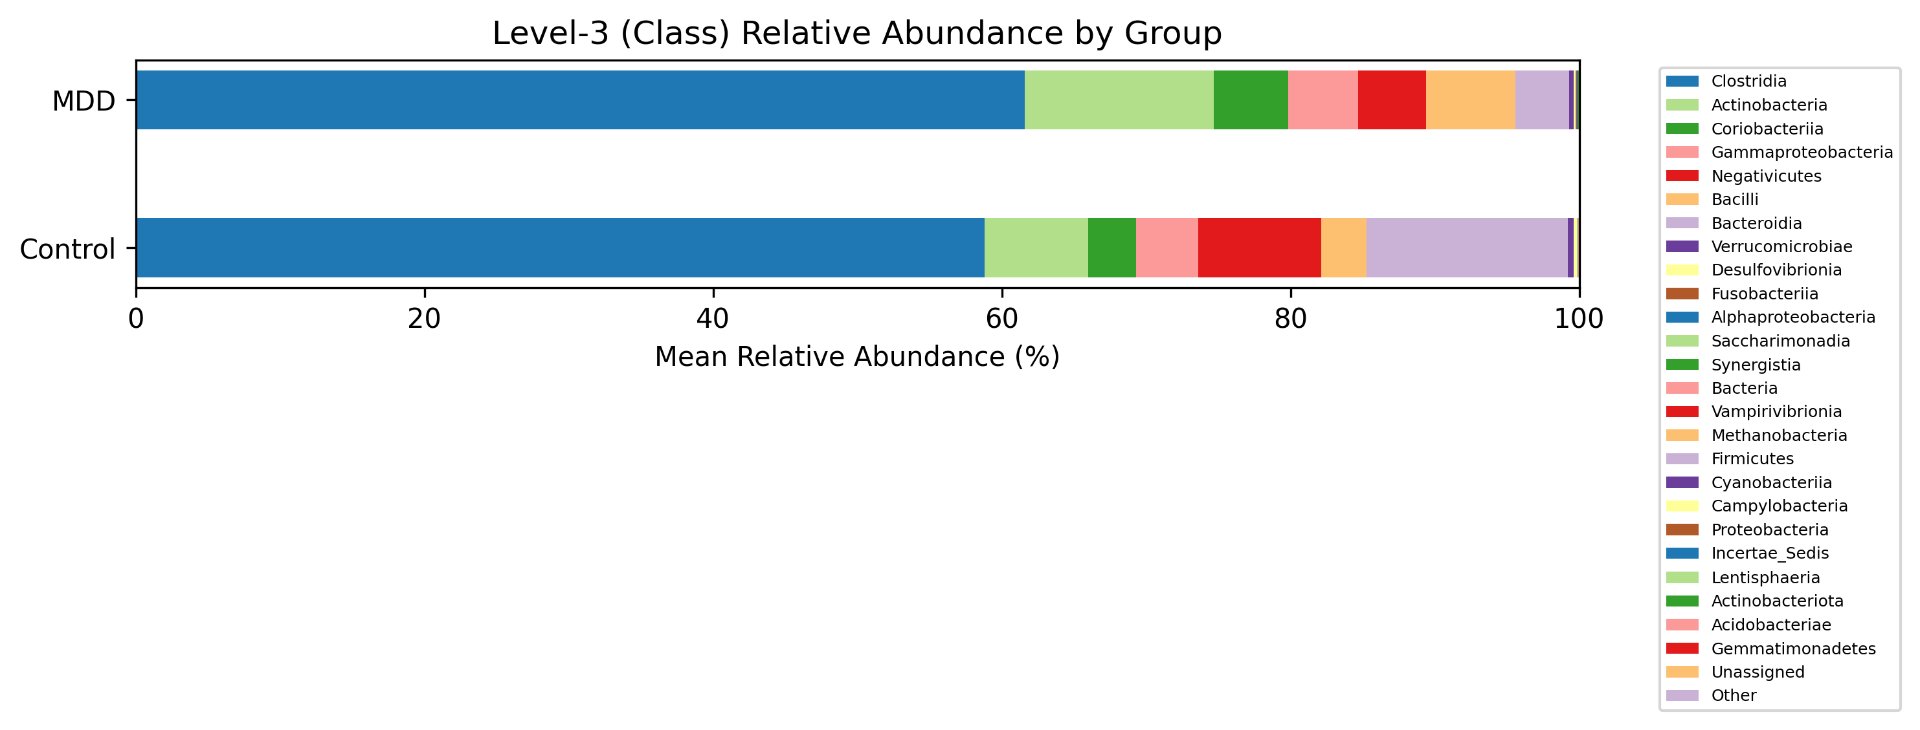
Alpha diversity was calculated using the Shannon Index, the standard metric for microbiome data, chosen for its greater weighting of rare species — of which both microbiomes had plenty. Controls consistently outcompeted MDD patients across every taxonomic level, with a higher Shannon Index indicating greater gut microbial biodiversity in healthy adolescents. The whiskers on the resulting box-and-whisker plot were also noticeably larger in MDD, suggesting — though not conclusively proving — greater variability in diversity within that group, a finding that would further support what has already been established in adult research. The difference between the two Shannon indices, approximately 0.5, deserves careful interpretation. On the surface this sounds modest, but given that the Shannon Index operates on a logarithmic scale of base e, this difference corresponds to a 65% increase in effective diversity in controls over MDD patients — a magnitude considered biologically significant by microbiome researchers. The Kruskal-Wallis test confirmed statistical significance with a p-value far below 0.001, reinforcing this conclusion analytically. Taken together, these results suggest that adolescents follow the same general trend observed in adults: individuals with depression show lower gut microbial biodiversity, with a handful of bacteria dominating rather than a more even distribution. This raises the possibility that low diversity is not merely a correlatory feature of MDD, but potentially a defining or even causal one — though establishing causality would require dedicated longitudinal research. Beta diversity, calculated using Bray-Curtis distance matrices and visualized with PCoA, produced results consistent with alpha diversity. Control samples clustered more tightly, while MDD samples were more spread apart, forming partially distinct regions in the emperor plot. This pattern suggests greater variability in the bacterial composition of MDD patients compared to the more standardly regulated microbiome of healthy controls — a conclusion supported by the wider whiskers observed in the Shannon index plots. The partial separation and interwoven nature of the two groups was expected; microbiome datasets are inherently variable, and completely distinct PCoA clusters are rare in human studies. What matters is that the distinction was statistically confirmed by PERMANOVA, again returning a p-value below 0.001, corroborating the alpha diversity findings and strengthening the overall conclusion that the gut microbiomes of MDD adolescents and healthy controls are meaningfully and significantly different. Following ASV classification using the SILVA 138 classifier, an additional quality check was performed. At the genus level, just over 16% of the 343 genera tested were imperfect — either unclassified at the genus level, uncultured, or unclassified at multiple taxonomic ranks. This sits within the accepted publication range of 15–30% for 16S rRNA data from the V3–V4 region, reflecting both the inherent limitations of current taxonomic databases and the natural complexity of the microbiome. Remaining within this range confirms the data's suitability for downstream research. Genus-level bar graphs revealed that the top three genera by relative abundance were the same in both groups: Blautia, Bifidobacterium, and Faecalibacterium. Upregulation was observed in Bifidobacterium and Blautia, while Faecalibacterium was downregulated in MDD. These directions were largely consistent with adult findings, with one notable exception. Bifidobacterium's regulation in adults remains contested across studies, with different research reporting opposing directions. Our data initially appeared to show meaningful upregulation in MDD adolescents — however, the p-value for this result was close to 1, and the variance across samples was high. This points to aggregation bias rather than a true biological signal, and it is important to state plainly: according to our research, Bifidobacterium does not show differential regulation in adolescent MDD. The apparent change is a statistical artifact, not a finding. A further supporting observation from the genus-level graphs was that the "Other" category — representing the aggregate of less dominant genera — was larger in controls than in MDD patients. This reflects a more even distribution of genera in healthy adolescents compared to the dominance of a few taxa in MDD, reinforcing the alpha and beta diversity conclusions and presenting this finding in a more accessible and visual way. The Mann-Whitney U test with Benjamini-Hochberg correction was applied to assess genus-level significance. Cross-referencing the most significantly regulated genera with the most abundant ones produced three candidates in common: Faecalibacterium, Blautia, and Bacteroides — all with p-values far below 0.01 and high relative abundance in both groups. Given their statistical significance, biological grounding, and ease of detection, these three genera represent strong candidates for single-bacteria biomarkers of MDD. Further research is needed to determine which of the three offers the greatest diagnostic specificity, but in identifying them as candidates in an adolescent population, this study makes a meaningful contribution to the scientific literature.
5.3 SVM Model
The SVM model achieved an accuracy of 0.79, a ROC-AUC of 0.85, and an F1 score of 0.79 for both classes — all at the higher end of what comparable whole-microbiome SVM studies report, where typical values fall in the 0.70–0.75 range. This is particularly noteworthy given the inherent noisiness of microbiome data and the relative limitations of SVM compared to more advanced machine learning architectures. Training the model on the full bacterial feature vector, rather than a curated subset, naturally introduces more noise and a higher-dimensional classification problem — yet the model performed above expectation. This reinforces the hypothesis that gut microbiota carry a genuine and detectable biological signal for MDD, and points toward even stronger performance with more targeted feature selection or more advanced algorithms in future work.
5.4 Limitations and Final Conclusions
5.4.1 Limitations
Several limitations must be acknowledged honestly. The cohort of 205 participants provided sufficient statistical power to detect the differences reported here, but larger sample sizes — ideally exceeding 500 — would reduce the risk of Type II error and strengthen generalizability across populations. Sequencing constraints from the Illumina NovaSeq platform produced reads slightly shorter than the threshold required for paired-end merging, necessitating forward-only DADA2 processing. This approach is well validated for genus-level analysis and machine learning, but it sacrifices species-level resolution and one layer of error correction. Future studies recovering longer reads could both refine taxonomic precision and serve as an independent check on the conclusions drawn here. Finally, the dataset is exclusively adolescent, drawn from a single hospital in Quzhou, China. While this is a strength in the context of an adolescent-specific research gap, it limits extrapolation to other demographics and dietary contexts. As Bifidobacterium's divergent behaviour between adolescents and adults already demonstrates, findings from this age group cannot be reliably generalized to adult populations — nor should they be presented as such.
5.4.2 Final Conclusions
Despite these limitations, it can be stated with confidence that the gut microbiomes of MDD adolescents and healthy controls are highly and statistically significantly different — both in diversity and in the regulation of specific genera. Three genera, Faecalibacterium, Blautia, and Bacteroides, emerge as strong candidates for taxonomic biomarkers of MDD. The whole-microbiome SVM classifier further demonstrates that these biological differences are not only real but computationally predictive, reinforcing the diagnostic potential of gut bacteria in adolescent MDD. In conclusion, this project demonstrates that integrating microbiome sequencing with machine learning offers a viable path toward earlier and more precise detection of depressive disorders in adolescents. Rather than serving as a standalone diagnostic, microbiome-based models are best understood as a complementary tool — one that could support risk assessment, inform prevention strategies, and enable more personalized approaches to mental health care. By combining bioinformatics, statistical ecology, and artificial intelligence, this study contributes both evidence of association and a reproducible analytical framework for future investigation into the gut-brain axis.
Citations
- 1. Liu Q\, He H\, Yang J\, Zhao F\, Lyu J. Changes in the global burden of depression from 1990 to 2017: Findings from the Global Burden of Disease study. ScienceDirect. June 22\, 2019. Accessed January 2\, 2026. https://www.sciencedirect.com/science/article/pii/S0022395619307381.
- United Nations Department of Economic and Social Affairs, Population Division. World Population Prospects 2024: Summary of Results. United Nations; 2024. Accessed March 2, 2026. https://population.un.org/wpp/
- 2. Brody D\, Hughes J. Depression Prevalence in Adolescents and Adults: United States\, August 2021–August 2023. CDC. April 2025. Accessed January 2\, 2026. https://www.cdc.gov/nchs/products/databriefs/db527.htm.
- Chu A, Wadhwa R. Selective Serotonin Reuptake Inhibitors. In: StatPearls. StatPearls Publishing; 2024. Accessed March 2, 2026. https://www.ncbi.nlm.nih.gov/books/NBK559078/
- Ghaisas S, Maher J, Kanthasamy A. Gut microbiome in health and disease: linking the microbiome-gut-brain axis and environmental factors in the pathogenesis of systemic and neurodegenerative diseases. Pharmacol Ther. 2016;158:52-62. doi:10.1016/j.pharmthera.2015.11.012
- Adak A, Khan MR. An insight into gut microbiota and its functionalities. Cell Mol Life Sci. 2019;76(3):473-493. doi:10.1007/s00109-018-1710-3
- Nikolova VL, Smith ARB, Hall LJ, et al. Perturbations in gut microbiota composition in psychiatric disorders: a review and meta-analysis. JAMA Psychiatry. 2021;78(12):1343-1354. doi:10.1001/jamapsychiatry.2021.2573
- Dash S, Clarke G, Enck P, et al. The gut microbiome and diet in psychiatry: focus on depression. Curr Opin Psychiatry. 2015;28(1):1-6. doi:10.1097/YCO.0000000000000117
- Kennedy PJ, Cryan JF, Dinan TG, et al. Kynurenine pathway metabolism and the microbiota-gut-brain axis. Neuropharmacology. 2017;112(Pt B):399-412. doi:10.1016/j.neuropharm.2016.07.015
- Savitz J. The kynurenine pathway: a finger in every pie. Mol Psychiatry. 2020;25(1):131-147. doi:10.1038/s41380-019-0414-4
- Zhang X, Pan Z, Chu M, et al. Microbiome-gut-brain axis and mental health. Front Nutr. 2023;10:1111624. doi:10.3389/fnut.2023.1111624
- Vuong HE, Yano JM, Pronovost GN, et al. Interactions between the microbiota and the immune system in the brain. Annu Rev Psychol. 2017;68:401-429. doi:10.1146/annurev-psych-010416-044031
- Zheng P, Zeng B, Zhou C, et al. Gut microbiome remodeling induces depressive-like behaviors through a pathway mediated by the host’s metabolism. Mol Psychiatry. 2016;21(6):786-796. doi:10.1038/mp.2016.44
- Di Vito A, Lorusso S, Cerulo G, et al. Gut microbiota and brain-derived neurotrophic factor: a key approach for mental health. Nutrients. 2023;15(10):2371. doi:10.3390/nu15102371
- Sfera A, Cummings M, Osorio C, et al. Kynurenines, neuroinflammation, and oxidative stress in depression. Neurosci Biobehav Rev. 2023;148:105128. doi:10.1016/j.neubiorev.2023.105128
- Schirmer M, Smeekens SP, Vlamakis H, et al. Linking the human gut microbiome to inflammatory cytokine production capacity. Cell. 2016;167(4):1125-1136.e8. doi:10.1016/j.cell.2016.10.020
- Yang Z, Li J, Gui X, et al. Updated review of probiotics in the treatment of anxiety and depression. Front Microbiol. 2024;15:1330084. doi:10.3389/fmicb.2024.1330084
- Cryan JF, O'Riordan KJ, Cowan CSM, et al. The microbiota-gut-brain axis. Physiol Rev. 2019;99(4):1877-2013. doi:10.1152/physrev.00018.2018
- Noe S, Heiss CN, Schaupp A, et al. The kynurenine pathway in depression. Int J Mol Sci. 2023;24(9):8392. doi:10.3390/ijms24098392
- Valles-Colomer M, Falony G, Darzi Y, et al. The neuroactive potential of the human gut microbiota in quality of life and depression. Nat Microbiol. 2019;4(4):623-632. doi:10.1038/s41564-018-0337-x
- Cryan JF, Dinan TG. Mind-altering microorganisms: the impact of the gut microbiota on brain and behaviour. Nat Rev Neurosci. 2012;13(10):701-712. doi:10.1038/nrn3346
- Caspani G, Kennedy S, Foster JA, et al. Gut microbial metabolites in depression: understanding the biochemical mechanisms. Microb Cell. 2019;6(10):454-481. doi:10.15698/mic2019.10.693
- Kelly JR, Borre Y, O'Brien C, et al. Transferring the blues: depression-associated gut microbiota induces behavioural changes in the rat. J Psychiatr Res. 2016;82:109-118. doi:10.1016/j.jpsychires.2016.07.019
- Ogawa S, Inui A, Katsumi A, et al. The gut microbiota as a target for therapeutics in depressive disorders. Allergol Int. 2024;73(2):163-171. doi:10.1016/j.alit.2023.11.006
- Zhang JM, An J. Cytokines, Inflammation, and Pain. In: StatPearls. StatPearls Publishing; 2024. Accessed March 2, 2026. https://www.ncbi.nlm.nih.gov/books/NBK518966/
- Martin-Gallausiaux, C., Larraufie, P., Jarry, A., Béguet-Crespel, F., Marinelli, L., Ledue, F., Reimann, F., Blottière, H. M., & Lapaque, N. (2025a, January 2). Butyrate produced by commensal bacteria down-regulates indolamine 2,3-dioxygenase 1 (ido-1) expression via a dual mechanism in human intestinal epithelial cells. Frontiers. https://www.frontiersin.org/journals/immunology/articles/10.3389/fimmu.2018.02838/full
- Dantzer, R. (1970a, January 1). Role of the kynurenine metabolism pathway in inflammation-induced depression: Preclinical approaches. SpringerLink. https://link.springer.com/chapter/10.1007/7854_2016_6
- Belizário, J. E., & Napolitano, M. (2015, October 5). Human microbiomes and their roles in dysbiosis, common diseases, and novel therapeutic approaches. Frontiers. https://www.frontiersin.org/journals/microbiology/articles/10.3389/fmicb.2015.01050/full
- Gilbert, J. A., Blaser, M. J., Caporaso, J. G., Jansson, J. K., Lynch, S. V., & Knight, R. (2018, April 1). Current understanding of the human microbiome. Nature News. https://www.nature.com/articles/nm.4517
- Amon, P., & Sanderson, I. (n.d.). What is the microbiome?. BMJ Journals. https://ep.bmj.com/content/edpract/102/5/257.full.pdf
- Kim, S., Ndwandwe, C., Devotta, H., Kareem, L., Yao, L., & O’Mahony, L. (2024, October 31). Role of the microbiome in regulation of the immune system. Allergology International. https://www.sciencedirect.com/science/article/pii/S1323893024001631
- Rehman, S. (2023, July 30). Biochemistry, G protein-coupled receptors. StatPearls [Internet]. https://www.ncbi.nlm.nih.gov/books/NBK518966/
- Cheng Y, Zhu Z, Yang Z, et al. Alterations in fecal microbiota composition and cytokine expression profiles in adolescents with depression: a case-control study. Sci Rep. 2025;15:12177. doi:10.1038/s41598-025-97369-6
- Kumar A, Pramanik J, Goyal N, et al. Gut microbiota in anxiety and depression: unveiling the relationships and management options. Pharmaceuticals (Basel). 2023;16(4):565. doi:10.3390/ph16040565
- Martin M. Cutadapt removes adapter sequences from high-throughput sequencing reads. EMBnet J. 2011;17(1):10-12. doi:10.14806/ej.17.1.200
- Callahan BJ, McMurdie PJ, Rosen MJ, et al. DADA2: high-resolution sample inference from Illumina amplicon data. Nat Methods. 2016;13(7):581-583. doi:10.1038/nmeth.3869
- Bolyen E, Rideout JR, Dillon MR, et al. Reproducible, interactive, scalable and extensible microbiome data science using QIIME 2. Nat Biotechnol. 2019;37(8):852-857. doi:10.1038/s41587-019-0209-9
- Quast C, Pruesse E, Yilmaz P, et al. The SILVA ribosomal RNA gene database project: improved data processing and web-based tools. Nucleic Acids Res. 2013;41(Database issue):D590-D596. doi:10.1093/nar/gks1219
- Babraham Bioinformatics. FastQC: a quality control tool for high throughput sequence data. Published January 3, 2023. Accessed March 2, 2026. https://www.bioinformatics.babraham.ac.uk/projects/fastqc/
- Ewels P, Magnusson M, Lundin S, et al. MultiQC: summarize analysis results for multiple tools and samples in a single report. Bioinformatics. 2016;32(19):3047-3048. doi:10.1093/bioinformatics/btw354
Acknowledgement
We want to first express our gratitude to Cole for always offering advice and suggestions and for lending his deep experience to improve this project. Without his critique, tips, and guidance, our project would not be what it is today. We would also like to thank Dr. Garcia and Mrs. Madhavi Kale for giving us this oppurtunity to explore our passions and present it to the world. Without them, we would not even be here today. I would also like to acknowledge Yiwen Cheng et al. for releasing his data publicly, allowing for us explore, research, and innovate. Lastly, we would also like to thank our parents for helping to fund this project and providing the necessary materials for its completion.