Denaturing Allergenic Pet Dander Proteins Using Eco-Friendly Household Treatments
Katie Warcimaga, Kiana Warcimaga
Jenelle Weisgarber
Grade 11
Presentation
No video provided
Hypothesis
Testable Question: Do eco-friendly household treatments (steam heat, mild detergent, and vinegar) reduce the amount of extractable protein on pet fur compared to distilled-water?
Hypothesis: Eco-friendly treatments (steam heat, mild detergent, and vinegar) will reduce extractable protein on pet fur compared to distilled water. Steam heat is expected to produce the greatest reduction because high temperature and moisture cause irreversible protein denaturation making proteins less structurally stable and easier to remove. Detergent will also perform strongly by solubilizing proteins through disruption of hydrophobic interactions. Vinegar is expected to have a smaller measurable reduction due to partial pH-driven denaturation.
Graph 1: Hypothesized Extractable Protein Reduction (%)
- Represents the predicted relative effectiveness of treatments prior to data collection.

Research
BACKGROUND INFORMATION & RESEARCH:
Problem / Purpose
Pet allergies are a significant contributor to allergic rhinitis and asthma (American Lung Association, 2023; National Institute of Environmental Health Sciences, n.d.). The primary cat allergen, Felis domesticus allergen 1 (Fel d 1), and the primary dog allergen, Canis familiaris allergen 1 (Can f 1), are low-molecular-weight proteins produced in saliva and skin glands that adhere to fur and become airborne (Bonnet et al., 2018; Thermo Fisher Scientific, n.d.). With approximately 60% of Canadian households owning at least one dog or cat and nearly 77% owning some type of pet, allergen exposure is a widespread health concern (Canadian Animal Health Institute, 2022; Made in CA, 2024). Many existing solutions are costly or chemical-based. This project evaluates simple, low-cost, eco-friendly household treatments to reduce allergenic proteins at the source.
Note: After this point, Fel d 1 and Can f 1 are collectively referred to as pet allergen proteins.
Scientific Basis
Pet allergen proteins are stabilized by hydrogen bonds, ionic interactions, and hydrophobic forces. Denaturation occurs when these interactions are disrupted, altering protein structure and increasing removability (LibreTexts Chemistry, 2025; McDonnell & Russell, 1999). Treatments chosen for this experiment are inexpensive, widely available, and environmentally responsible (U.S. Environmental Protection Agency, n.d.).
- Steam heat (\~100 °C) causes irreversible protein denaturation by changing protein shape, making proteins less stable and easier to remove from fur (CDC, 2024).
- Detergent (0.5%) solubilizes proteins by disrupting hydrophobic interactions (LibreTexts Chemistry, 2025), and
- Acidic conditions such as Vinegar (1%) lower pH, partially disrupting ionic and hydrogen bonds in proteins (LibreTexts Chemistry, 2025).
Measurement Method
Specific allergen tests, such as ELISA, were initially considered for this experiment but ultimately excluded due to cost and the need for specialized equipment. Instead, total extractable protein was used as a proxy for allergen load, as allergenic proteins make up a significant portion of the proteins found on pet fur (Rabin et al., 2024; Allergen Bureau, 2022). Protein concentration was determined using the Biuret assay, which detects peptide bonds through a copper-complex color change (LibreTexts, 2025; Thermo Fisher Scientific, n.d.).
Gelatin was chosen as the protein standard because it is inexpensive, food-grade, and readily available, making the experiment easy to replicate in school laboratory settings while still providing reliable peptide bonds for Biuret calibration. To ensure accessibility and cost-effectiveness, protein quantification was performed using a free smartphone colorimetry app. This method is also accurate and practical for educational and experimental purposes. While gelatin is not compositionally identical to pet allergen proteins, it provides consistent peptide bonds for relative quantification using Biuret chemistry. Smartphone colorimetry was chosen because previous studies have shown it can produce consistent and reliable measurements for protein assays when lighting and measurement conditions are kept constant (Gee et al, 2017). Triplicate measurements and standardized lighting conditions were employed to improve precision.
Variables
Variables:
Manipulated (Independent) Variables:
- Treatment type (steam heat, detergent, vinegar, distilled water)
- Fur type (short-haired cat, long-haired cat, dog).
- Note: Because baseline protein levels differ between fur types, treatment effects were evaluated relative to the distilled-water control within each fur type. Cross-fur comparisons were based on percent reduction rather than absolute protein concentration.
Responding (Dependent) Variable:
- Estimated extractable protein concentration (mg/mL), used for relative comparison between treatments
Controlled/Fixed (Constant) Variables:
- Sample mass (0.5 g)
- Treatment time (5 min)
- Extraction time (10 min)
- Solution volumes
- Temperature
- Lighting
- Equipment settings / timing
Procedure
PROCEDURE:
Experimental Design:
A two-factor experimental design was used with treatment type (steam heat, detergent, vinegar, distilled water) and fur type (short-haired cat, long-haired cat, dog) as independent variables. Distilled-water–treated samples served as the control for each fur type. Each treatment was applied to three independently prepared fur samples per fur type, providing sufficient replication to demonstrate reproducibility and allow assessment of natural variability in fur and measurement noise from smartphone colorimetry. Three replicates were used to improve reliability while accounting for natural variation in fur samples and small measurement differences from the color analysis app. A treatment time of 5 minutes was selected to maximize protein disruption while minimizing uncontrolled protein loss. A reagent blank containing distilled water and Biuret reagent was used to represent zero protein and to establish a baseline colour reference for all measurements. Data was analyzed within each fur type relative to the control and calculated as percent reduction in extractable protein to account for baseline differences between fur types.
Materials (Based on 3 Reps):
- Fur Samples: 18 g total
- Short-haired cat: 6 g
- Long-haired cat: 6 g
- Dog: 6 g
- Solutions:
- ≥2 L Distilled water (control, rinsing, extraction)
- 180 mL of 1% solution (using white vinegar 5% acetic acid)
- 180 mL of 0.5% detergent solution (using liquid dish soap)
- 100 mL Biuret reagent
- 3 g Gelatin (for standard curve)
- Alternatives: BSA, egg white, collagen
- Equipment & Various Supplies:
- Measuring cups
- 4 × 250 mL beakers (solutions + gelatin stock)
- 3 × 50 mL microbeakers (rotate and clean) or disposable cups
- 5 × 15 mL test tubes (gelatin dilutions)
- 6 × 10 mL test tubes (Biuret testing)
- 2 test tube racks (ideally hold 6 tubes each)
- Graduated cylinders (40 mL, 100 mL)
- pipettes (0.2 mL, 1.8 mL, 10 mL)
- 5 x Glass stirring rods
- Instant Pot pressure cooker, trivet, silicone egg holder & tin foil
- Precise electronic scale (±0.01 g accuracy)
- Timer
- Smartphone with colour analysis app (e.g. Colormeter app)
- Alternatively, a 540 nm colour measurement tool can be used if available
- White background (e.g. Trifold)
- Pencil / Pen / Labels
- Paper towels (cleanup)
- Protective tray or spill mat
- Note: As measuring cups, test tubes and microbeakers will be reused, rinse thoroughly with distilled water and shake out excess water between uses.
- Safety Gear:
- Heat-resistant gloves
- Safety goggles
- Mask
- Lab coat or protective clothing
- Copper-containing Biuret reagent should be disposed of according to school chemical waste guidelines
- Waste Disposal:
- Labeled glass or plastic containers to be used for solutions and Biuret reagent (chemical) waste
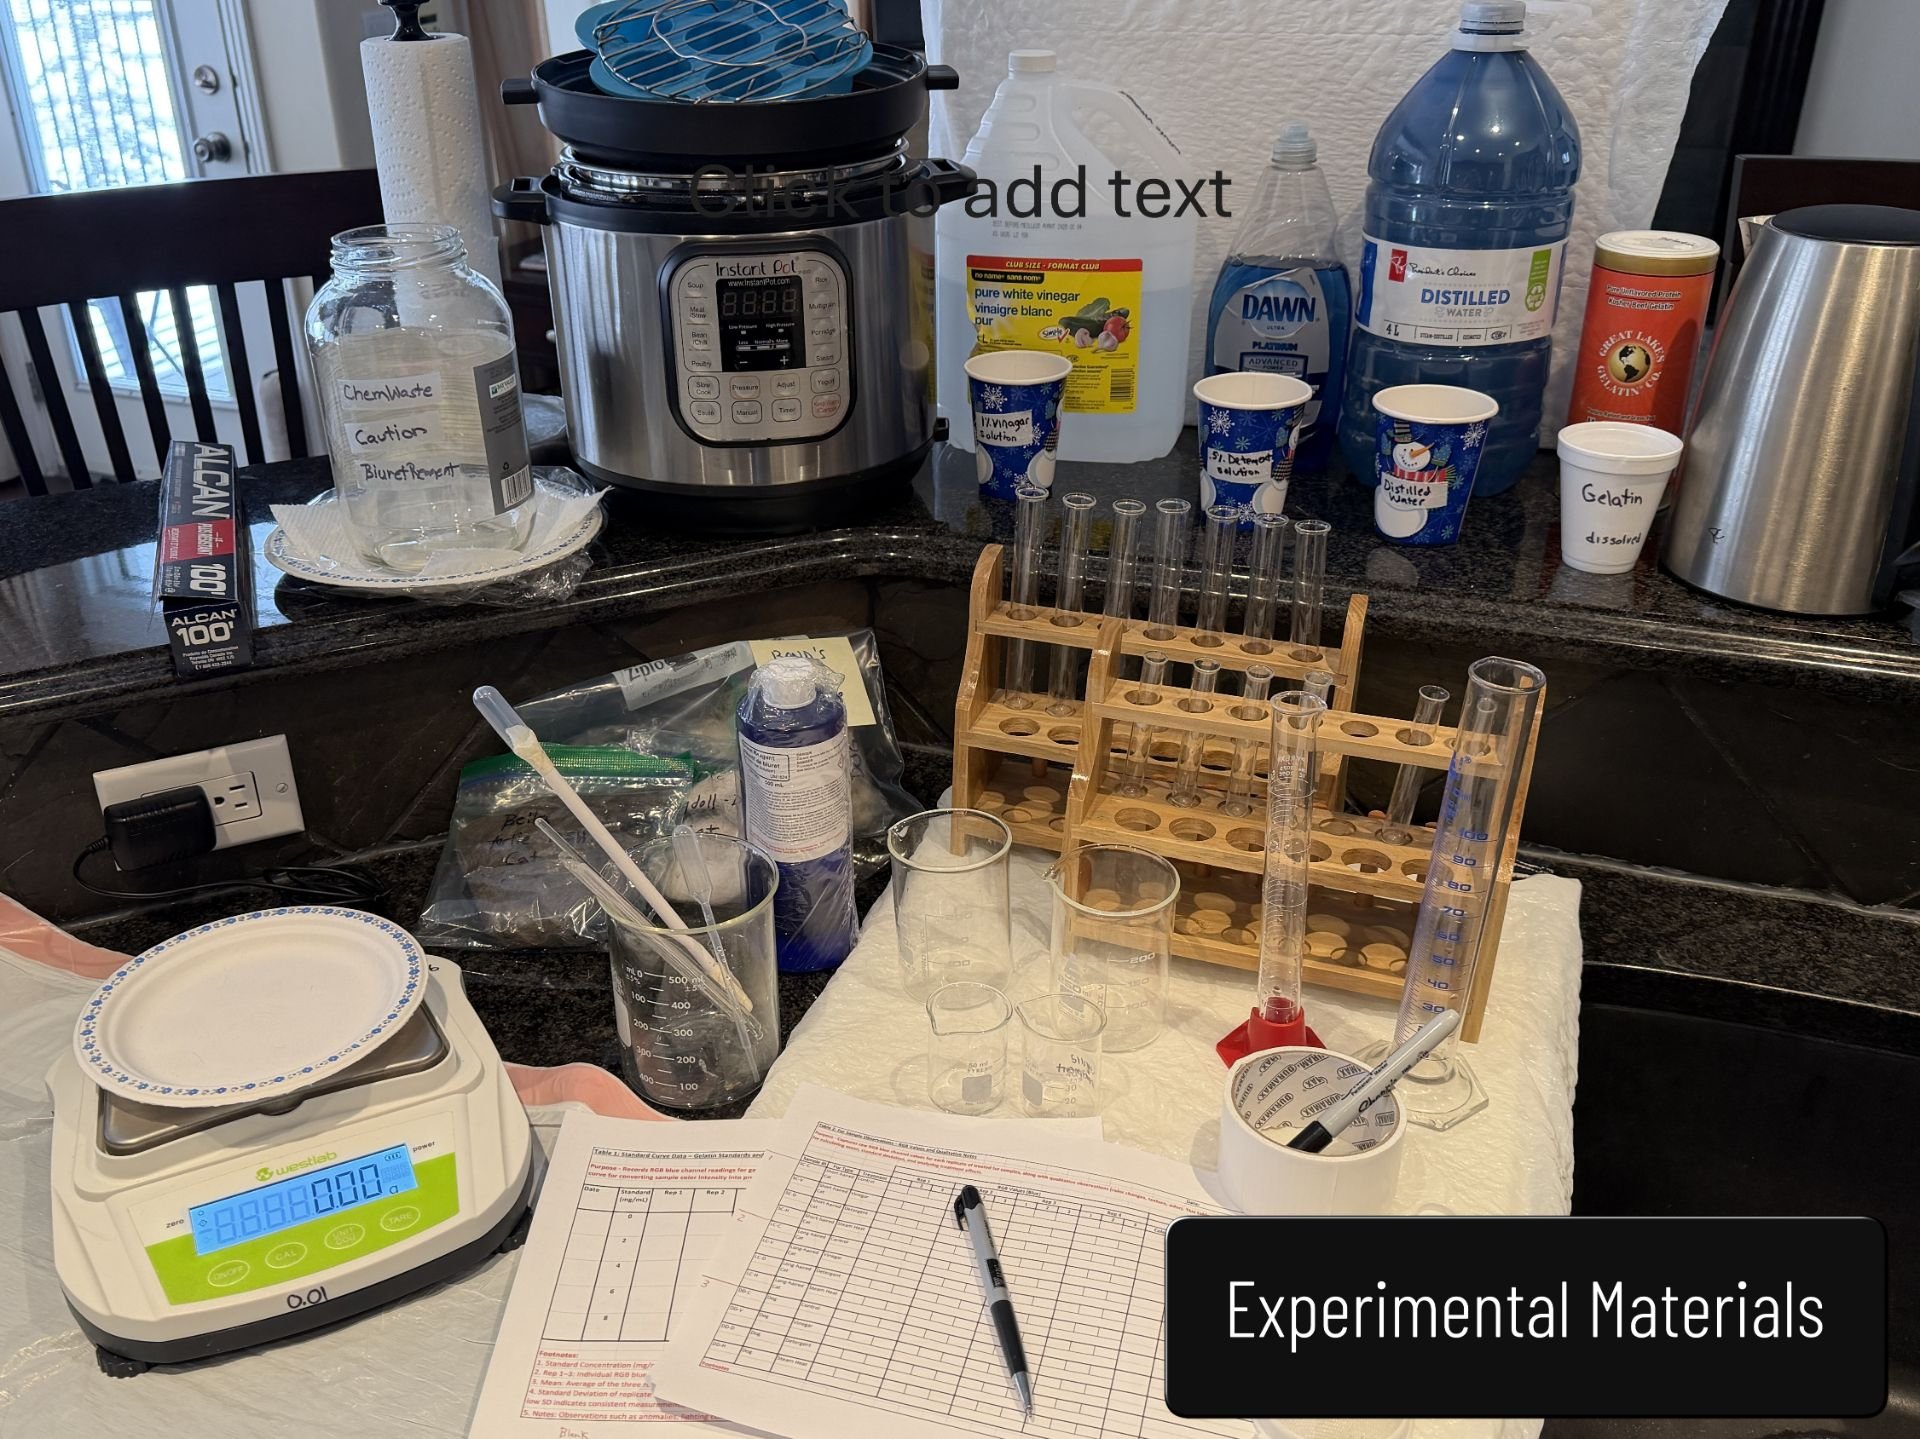
Photo 1: Experimental Materials
- This image shows the materials and equipment used in this experiment. Each item played an important role in conducting the procedure and gathering data.
Section 1: Pre-Testing Preparation:
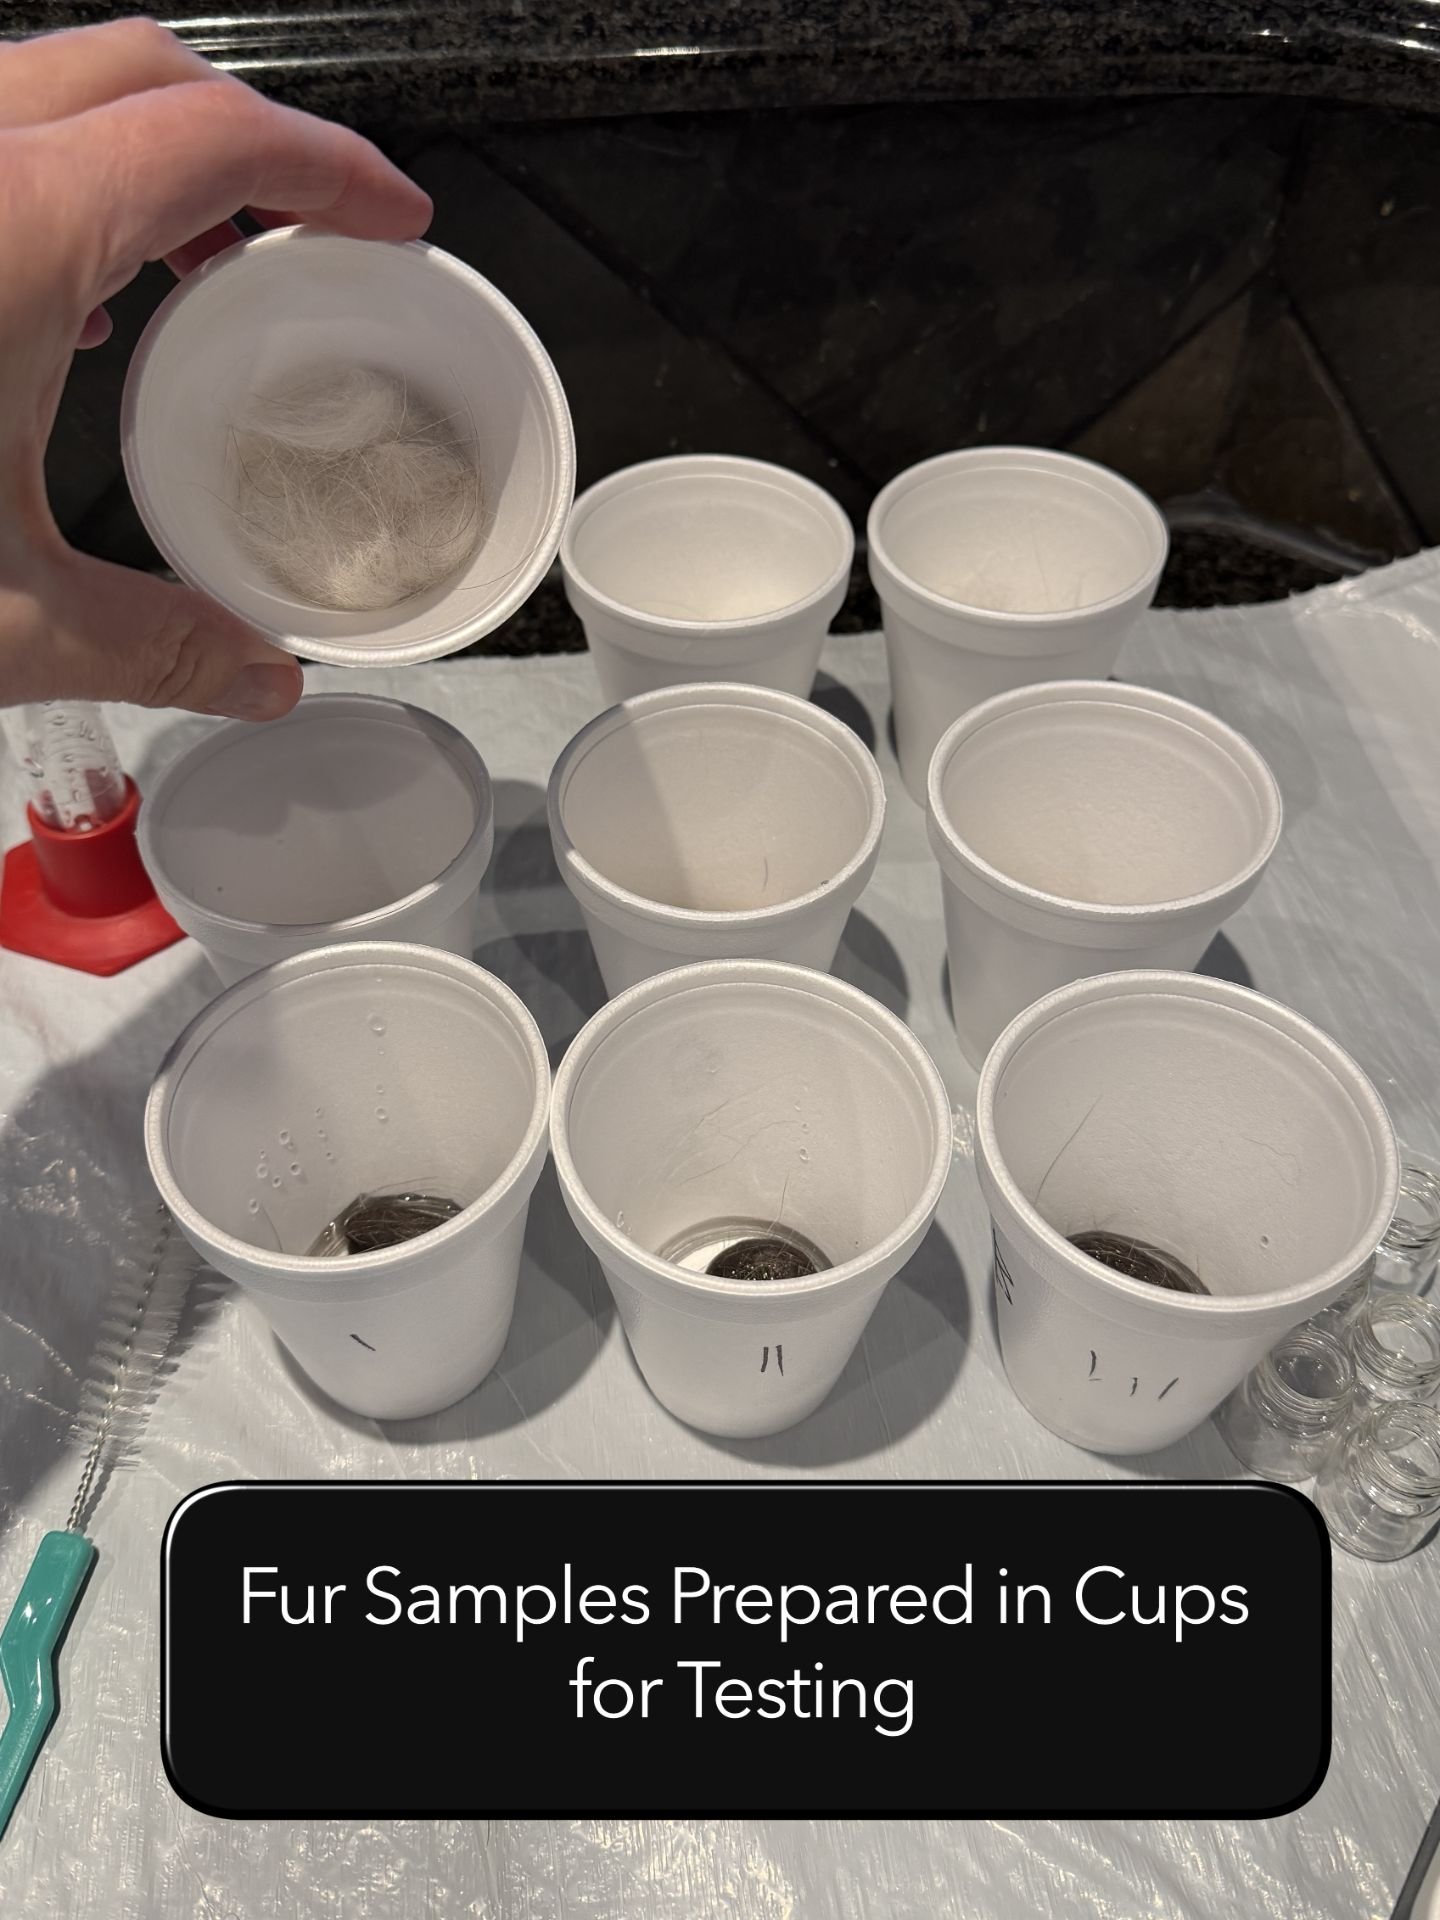
1. Collect & Label Fur Samples (Ethically):
- Collect fur samples from household pets using gentle brushing (with owner permission)
- Minimum 6 g / fur type
- Store each sample in a clean, labeled ziplock bag at room temperature
- Inspect fur samples for major debris or moisture differences before testing to minimize extraction variability
2. Create & Print Logbook Data Entry Table Templates (for data entry during testing):
- Table 1: Standard Curve Data – Gelatin Standards & Blue Channel Values
- Table 2: Fur Sample Observations – RGB Values & Qualitative Notes
- Table 3: Summary: Mean Protein Concentration & % Reduction
3. Gather Required Materials / Safety Equipment & Setup Work Station:
- Including setting up white background & downloading required Colormeter App
- See Materials section for full listing
4. Prepare Gelatin Standard Curve:
- Prepare Stock Solution (10 mg/mL):
- In a labelled 250 mL beaker, weigh 3 g of Great Lakes unflavoured gelatin
- Dissolve in 100 mL of hot distilled water (40–50 °C)
- Stir until fully dissolved, then allow to cool to room temperature
- Note: Must work fast because gelatin will quickly solidify
- Prepare 5 Dilutions for Standard Curve:
- Use labelled 15 mL test tubes for each dilution (10 mL total per tube).
- Target concentrations: 0, 6, 12, 18, 24 mg/mL
- 0 mg/mL (blank): 0.0 mL stock + 10.0 mL distilled water
- 6 mg/mL: 2.0 mL stock + 8.0 mL distilled water
- 12 mg/mL: 4.0 mL stock + 6.0 mL distilled water
- 18 mg/mL: 6.0 mL stock + 4.0 mL distilled water
- 24 mg/mL: 8.0 mL stock + 2.0 mL distilled water
- Allow colour to develop for 5 minutes at room temperature
- Measure Results Using Colorimeter App:
- Use a smartphone colour analysis app to determine RGB values for each standard
- Keep lighting, distance, and phone consistent for all measurements
- Record (triplicate) blue channel values in the prepared data table
- The blue channel is most sensitive since Biuret produces a violet colour
- Average of triplicate readings per standard (triplicates) to minimize potential variability from lighting or angle differences
- Create Calibration Curve:
- Plot protein concentration (mg/mL) vs blue channel intensity
- Use this curve to calculate protein levels in subsequent samples
Section 2 - Testing Phase:
Important Notes:
- Rinse test tubes and beakers with distilled water after each sample to prevent cross-contamination
- Work in organized batches: Complete all steps for one fur type and one treatment before moving to the next. For example:
- Short-haired cat → 3 samples → Water treatment
- Short-haired cat → 3 samples → Vinegar treatment
- Short-haired cat → 3 samples → Detergent treatment
- Short-haired cat → 3 samples → Steam heat treatment
- Then repeat the same sequence for long-haired cat, then dog
- Rotate the order of treatments within each fur type batch so that no treatment is consistently tested first or last. This should reduce any potential effects of time or temperature changes.
1. Prepare Testing Solutions:
- Use labelled 250 mL beakers for each solution:
- 1.0% Vinegar Solution (200 mL)
- Mix 40 mL white vinegar with 160 mL distilled water
- 0.5% Detergent Solution (200 mL)
- Mix 1 mL mild dish detergent with 199 mL distilled water
- Distilled Water (200 mL)
- 1.0% Vinegar Solution (200 mL)
2.. Sample Treatment Application:
- For each fur type (short-haired cat, long-haired cat, dog) and each treatment (Water, Vinegar, Detergent, Steam Heat):
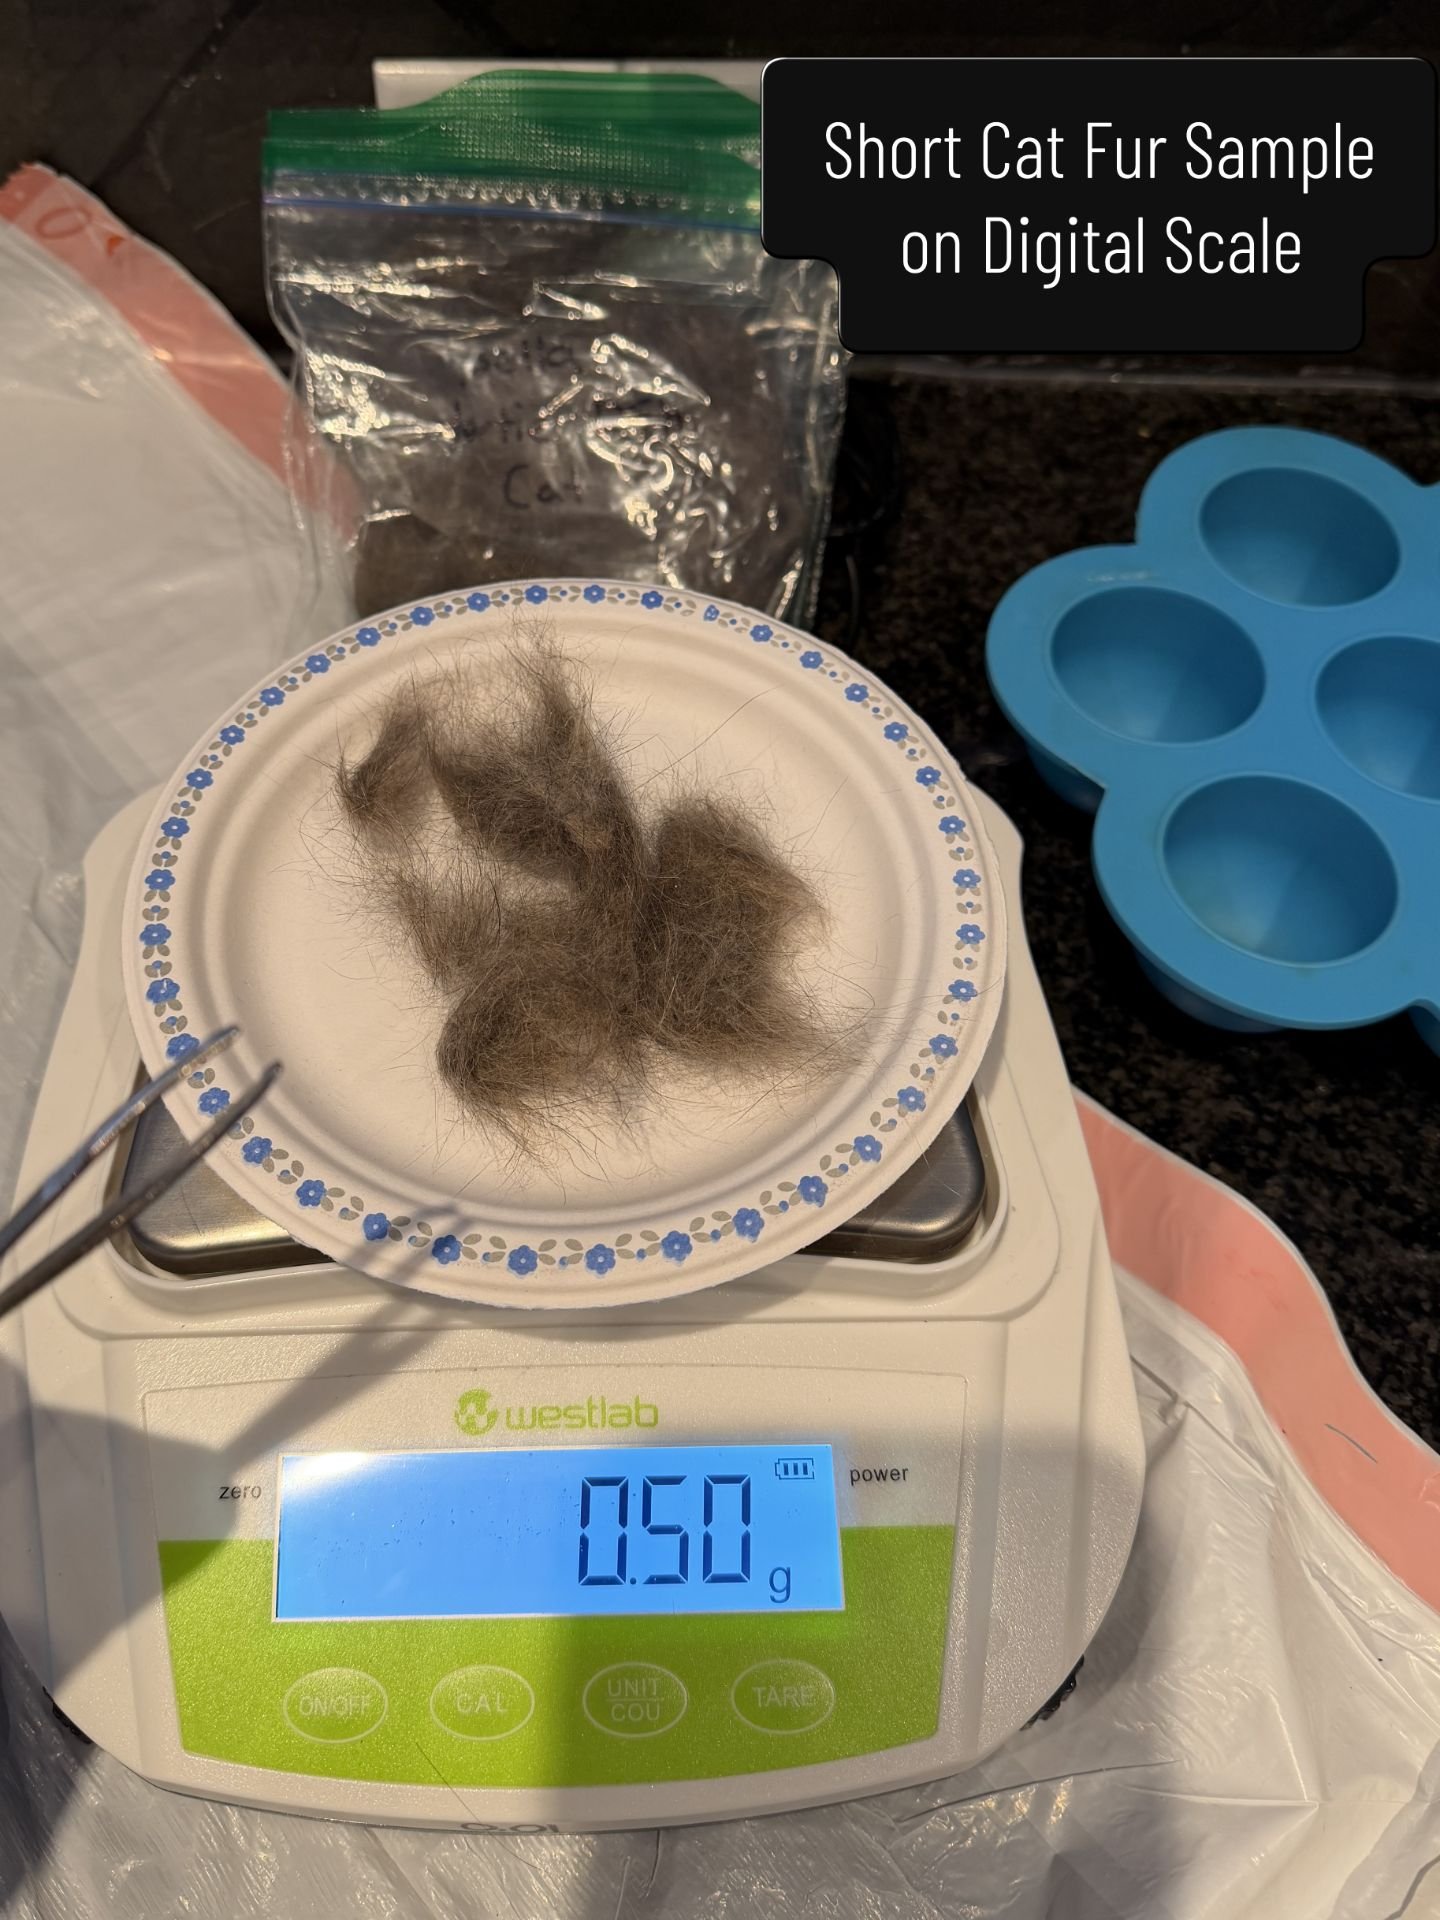
- Weigh 0.50 g of fur using a precise balance
- Place in a clean, labelled 50 mL beaker.
- Apply treatment:
A. Liquid Treatments (Water, Vinegar, Detergent):
- Add 10.0 mL solution, stir gently for 5 min at room temp (22 ± 2 °C)
- Drain solution
- Rinse once with 10.0 mL distilled water (gentle stirring for 30 seconds)
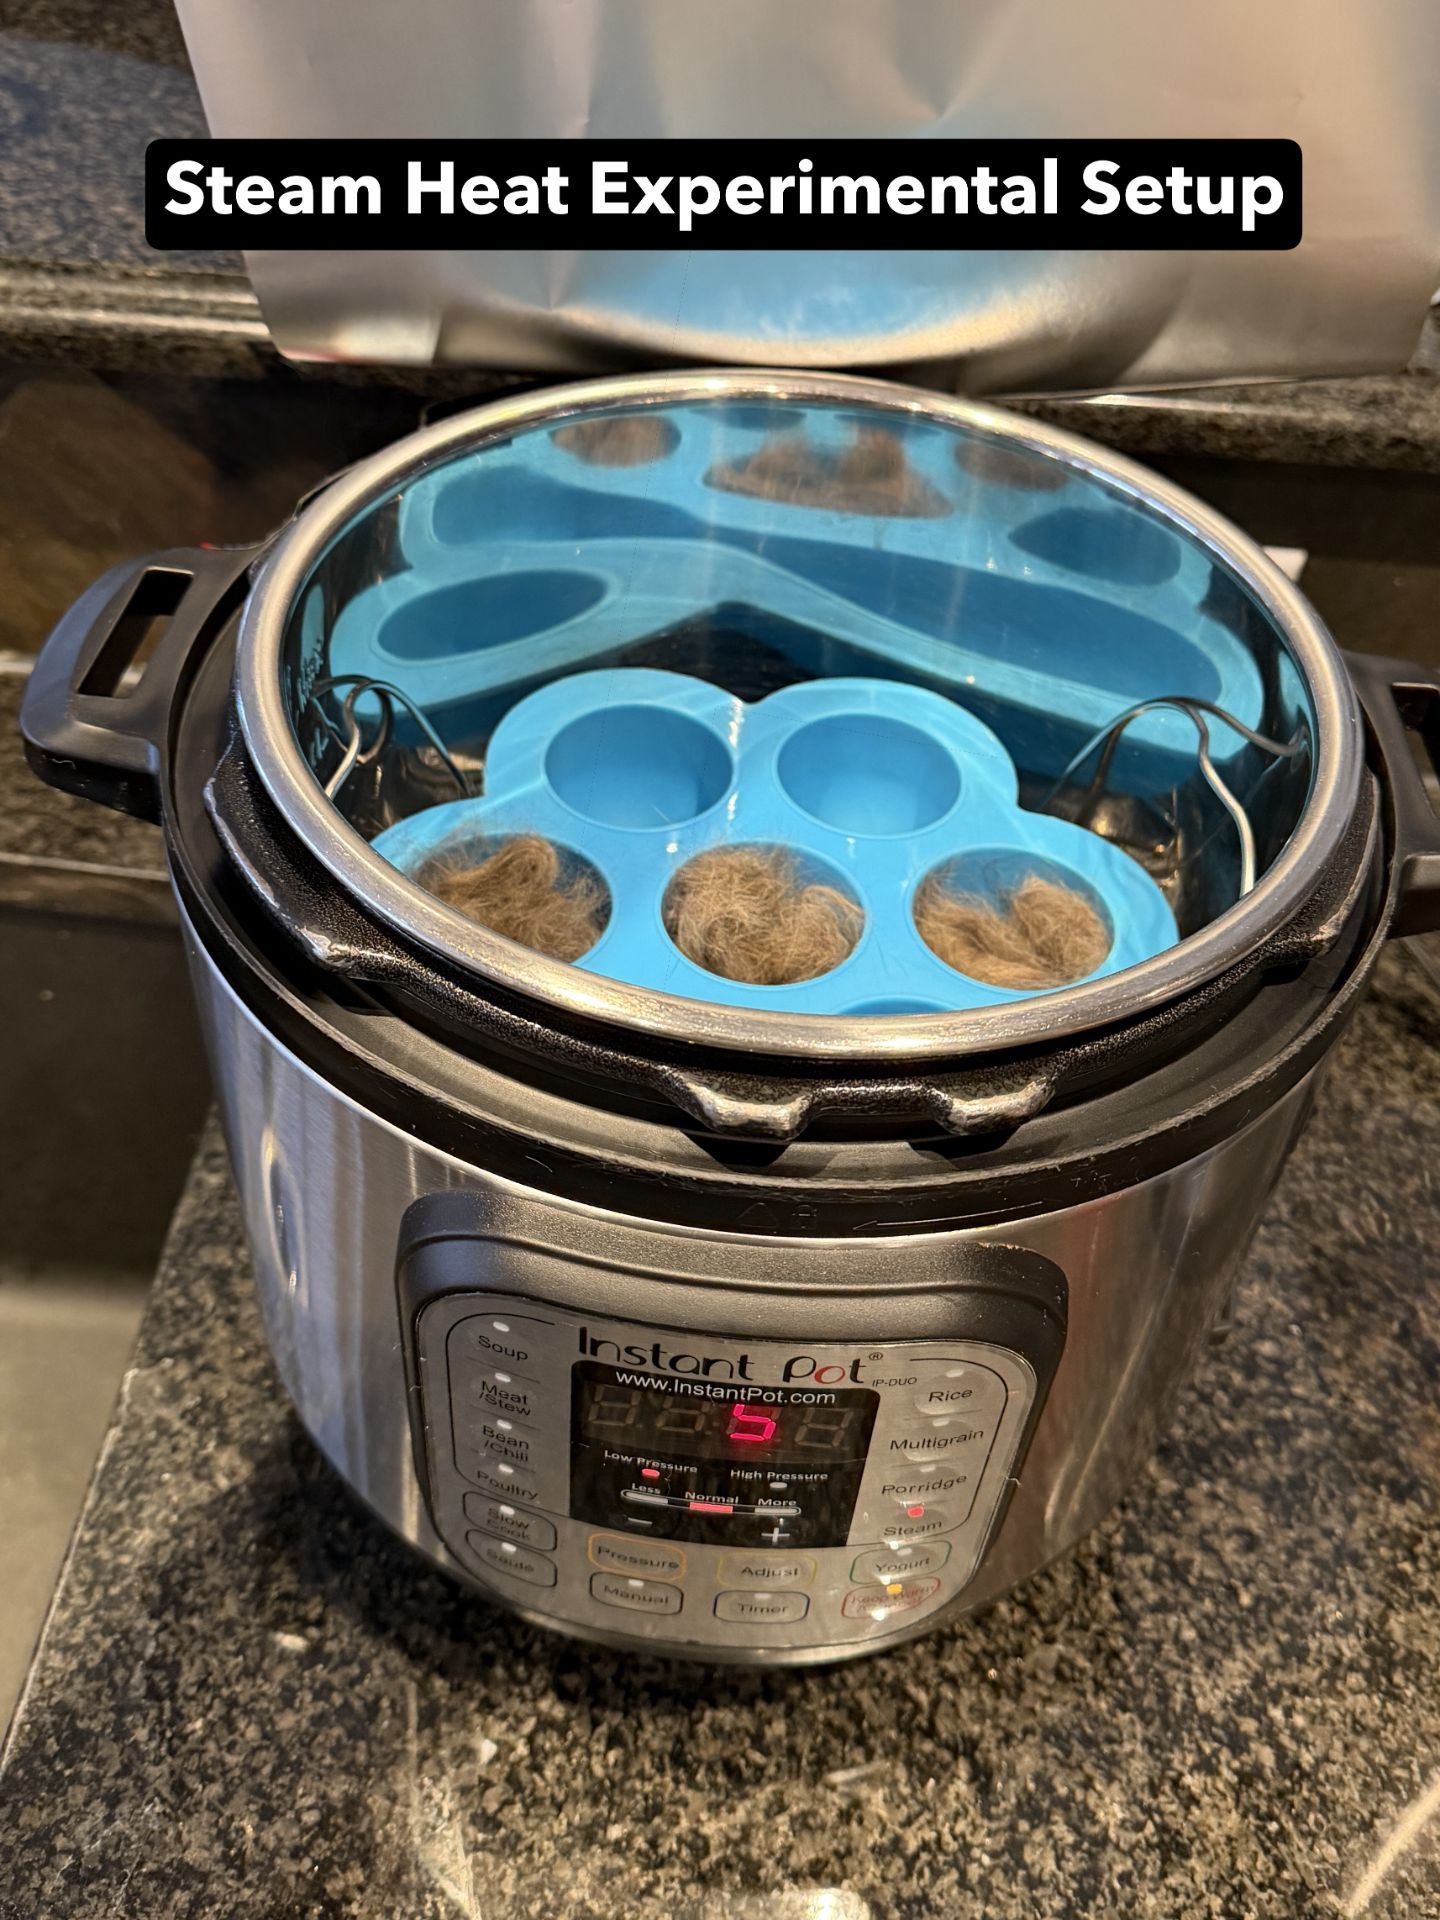
B. Steam Heat Treatment
- Add 250 mL water to Instant Pot, insert the trivet
- Place fur samples into silicone egg holder compartments (no liquid), loosely tent with foil
- Close lid, set valve to sealed (pin up), and press Steam (Low) button for 5 minutes
- When 100 °C internal temperature is reached, Instant Pot will begin 5 minutes countdown
-
Quick release pressure, remove sample with gloves, cool 2 min
-
Caution: Only open lid once pressure is released (pin must be in down position)
-
Rinse once with 10.0 mL distilled water (gentle stirring for 30 seconds)
- Clean and Reset:
- Proceed immediately to Protein Extraction step for each sample before moving to the next sample
- Rinse all reusable containers and tubes before starting next sample
-
3. Protein Extraction:
- Add 10.0 mL distilled water, stir for 10 min, let settle
- Transfer clear extract to a labelled 15 mL test tube
4. Biuret Assay for Fur Extracts:
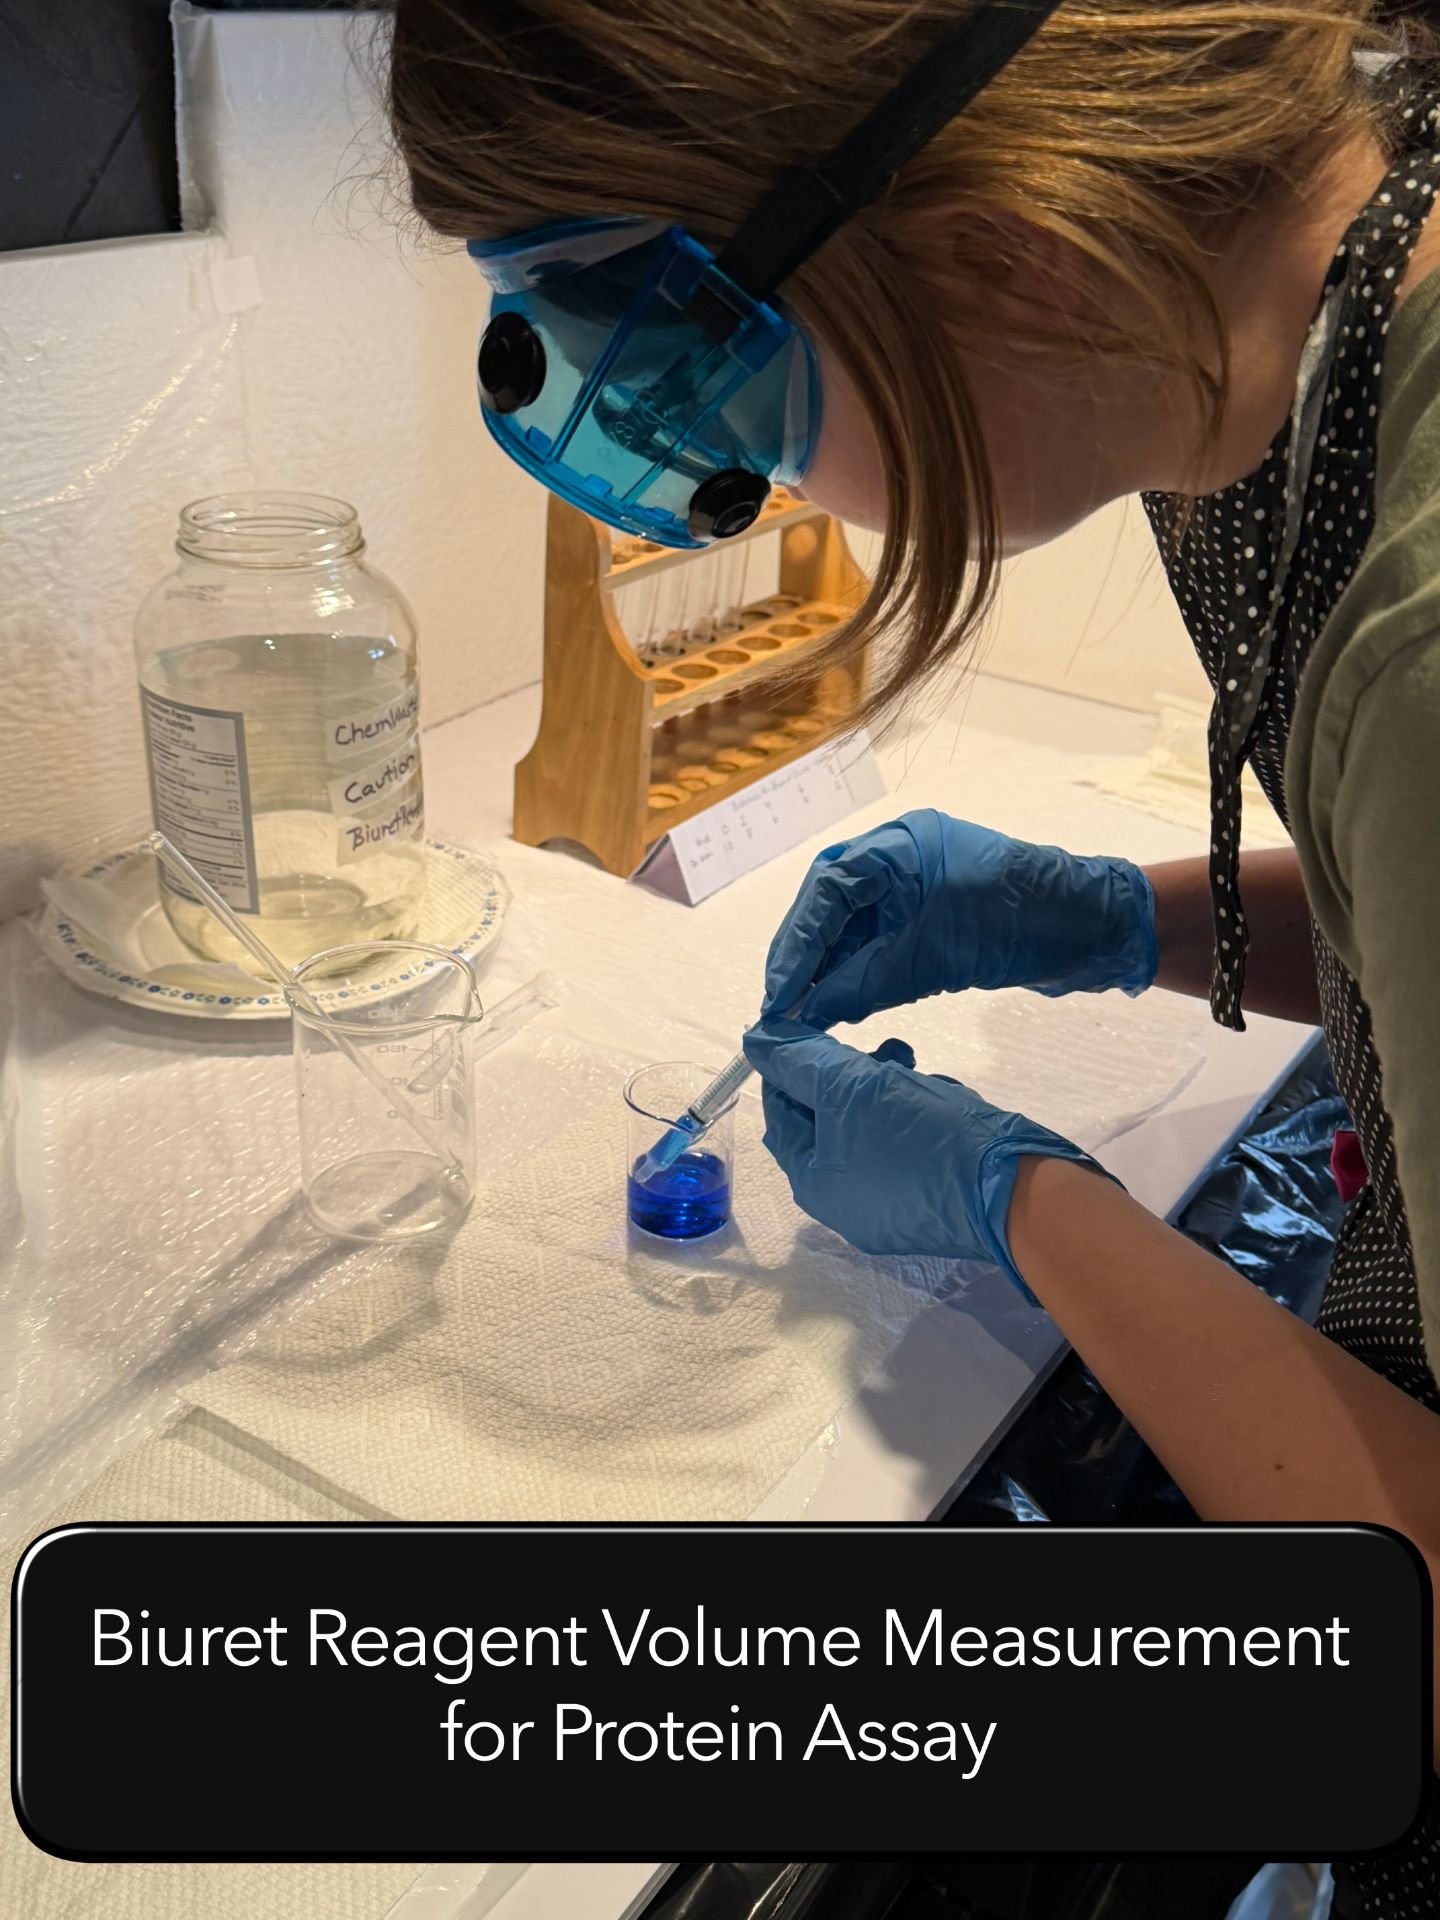
- Pipette 0.20 mL extract into a 10 mL test tube, add 1.80 mL Biuret reagent
- Prepare blank: 0.20 mL water + 1.80 mL reagent in a \~10 mL test tube
- Note: The blank helps set the baseline for zero protein
5. Colour Measurement for Samples:
- Use smartphone app, consistent lighting / distance and white background.
- Record blue channel values into prepared data table template (triplicate readings)
- Biuret produces a violet colour so the blue channel is most sensitive
Section 3: Other Important Reminders & Disclaimers:
1. Safety:
- Work in a well-ventilated area and keep the workspace clear of unnecessary people and pets.
- Wear gloves, safety goggles, and a lab coat at all times.
- Handle hot equipment (Instant Pot and steam) with heat-resistant gloves to prevent burns.
- Biuret reagent safety:
- Contains copper compounds—avoid ingestion or inhalation.
- Use glass or plastic tools only (not metal).
- If spilled, clean immediately while wearing gloves.
- Dispose of all Biuret waste in clearly labeled containers according to school chemical waste guidelines.
- Wash hands thoroughly after completing the experiment.
Ethics & Animal Welfare:
- No animals were harmed or directly involved in testing; all samples were collected as shed fur through gentle brushing with owner permission
- This project follows ethical guidelines for non-invasive biological sample collection.
Various Procedural Photos:
Observations
DATA & OBSERVATIONS
Gelatin Curve - Calibration Standards and Reference Coloration
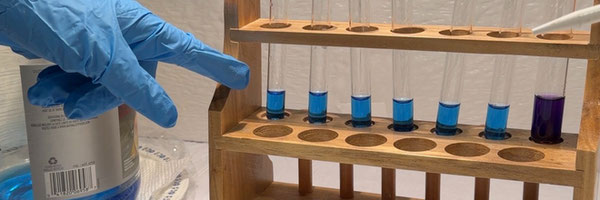
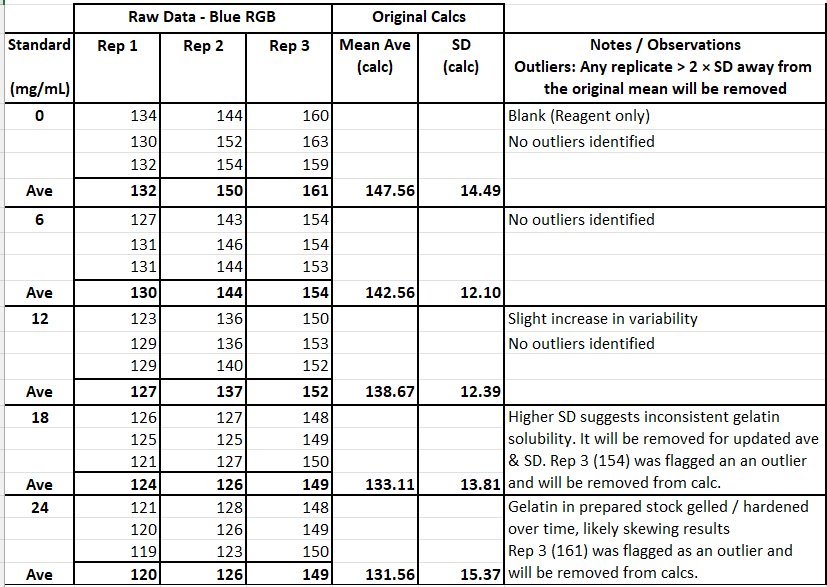
Gelatin standards were prepared and photographed to establish reference coloration for protein concentration measurement (Photo 1: Gelatin Standard Curve Test Tubes). Raw blue-channel RGB values were recorded for all standard solutions (Table 2: Gelatin Standard Curve Data) and used to generate the calibration curve shown in Graph 2. Inspection of raw standard data showed a consistent decrease in blue-channel values from Rep 1 to Rep 3 at each concentration level, indicating systematic gelatin preparation drift rather than random measurement variability. This pattern was observed across all standard concentrations and is addressed quantitatively in the Results & Analysis section.
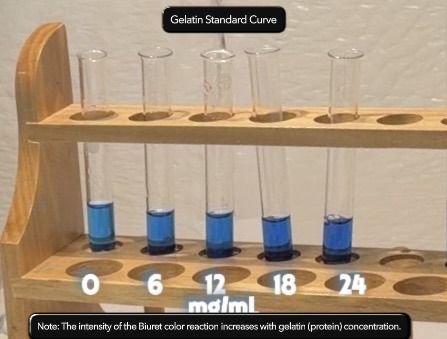
Photo 1: Gelatin Standard Curve Test Tubes
- Visible color gradient across gelatin standards confirms a functional Biuret response; darker violet coloration indicates higher protein concentration, with differences more subtle at lower concentrations.
Graph 2: Standard Curve
- Shows the relationship between blue-channel RGB values and gelatin protein concentration and includes the linear trendline equation and R² value. The red vertical line indicates the effective detection limit subsequently used for interpretation of fur extract results.
- Although the calibration equation produces numerical concentration estimates across the full RGB range, values below \~13–15 mg/mL fall below the assay’s effective detection limit. Concentrations reported below this threshold represent extrapolated estimates based on the calibration model and are interpreted qualitatively only.
- Apparent concentrations below the detection limit indicate relative shifts in signal intensity rather than true, quantifiable protein concentrations.
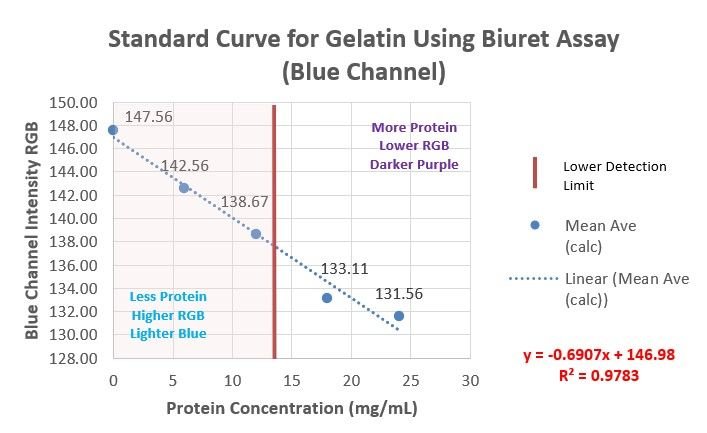
Table 2: Gelatin Standard Curve Data
- Shows the relationship between known protein concentrations and blue-channel RGB values.
Fur Sample Characteristics (Pre-Testing)
Qualitative examination of the three fur types prior to testing revealed clear differences in texture and handling. Short-haired cat fur was soft with a slightly wiry feel and separated easily into small clusters. Long-haired cat fur was extremely soft and fine, and tended to cling together, making separation more difficult. Dog undercoat fur was very soft, light, and fluffy, with fibers that spread apart readily and often appeared to float during handling. These characteristics are summarized in Table 1: Animal Fur Sample Documentation.
Table 1: Animal Fur Sample Documentation
- Provides details of the three fur samples used in this experiment.

Fur Sample Physical Observations During Treatment
During the rinsing stage, all fur samples formed tight, compact balls when wet. Individual strands adhered closely together, reducing exposed surface area compared to their dry state. This clumping behavior was consistent across species and treatments and was visually distinct from the behavior of dry fur.
Fur Sample Colorimetric Observations
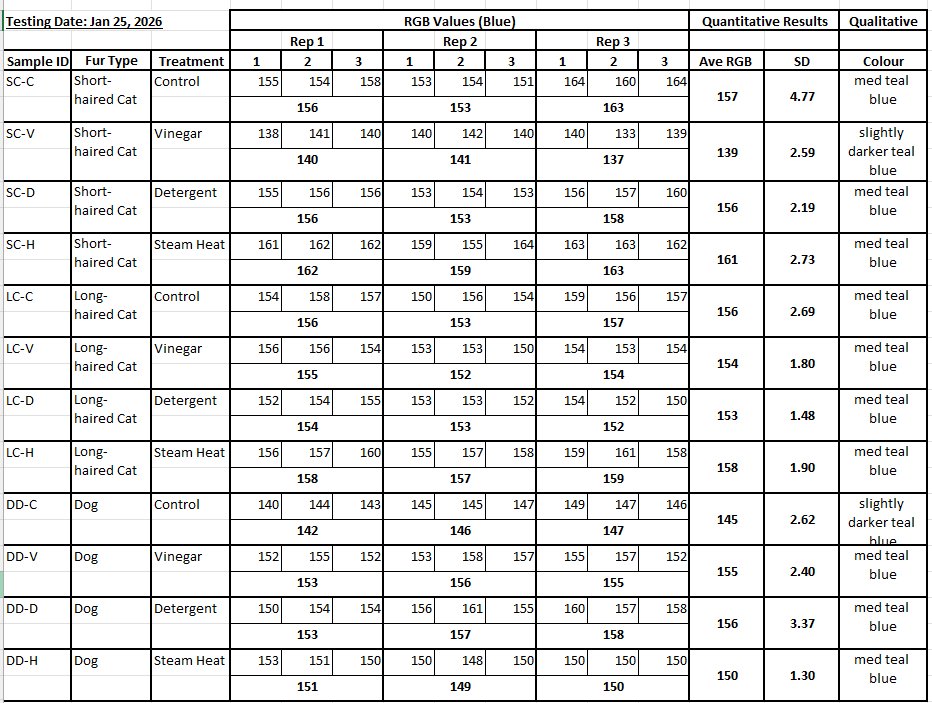
Raw blue-channel RGB readings and qualitative color observations were recorded for all fur samples throughout testing (Table 2: Fur Sample Observations – RGB Values and Qualitative Notes). For each fur type and treatment, three replicate measurements were collected under consistent lighting, distance, and orientation conditions. Within individual samples, replicate readings showed low variability, with standard deviations generally below 5 RGB units, indicating good repeatability of the smartphone colorimetry method.
Across treatments, differences in blue-channel values were difficult to see with the eye. Differences were small and frequently overlapped between treatment groups within the same fur type. Distilled-water controls did not consistently produce darker violet coloration than treated samples, and detergent or steam-treated samples did not consistently appear lighter. Vinegar-treated samples showed no uniform directional shift relative to controls, and in some cases exhibited similar or higher blue-channel values.
Overall, most fur samples exhibited medium teal-blue coloration consistent with low-level Biuret responses, and qualitative color descriptions were similar across treatments and species. These observations indicate that any treatment-related differences in detectable protein were subtle and often within the variability of the measurement method, rather than producing large, visually distinct color changes.
Summary Measurements
Summary values for all replicate measurements, including mean blue-channel readings for each treatment group, are presented in Graph 2: Average RGB Per Treatment & Fur Type and Table 2: Raw RGB Values and Qualitative Notes Summary – Mean Blue-Channel Values. These data formed the basis for subsequent calculations and detection-limit analysis presented in the Results & Analysis section.
Graph 3: Average RGB Per Treatment & Fur Type
- Shows the average RGB value for each treatment and fur type, visually comparing effectiveness. Differences shown are small and often overlap within the assay’s detection limit so should be interpreted qualitatively only.
- Note: Raw RGB values are shown to avoid over-interpretation of concentrations below the detection limit.
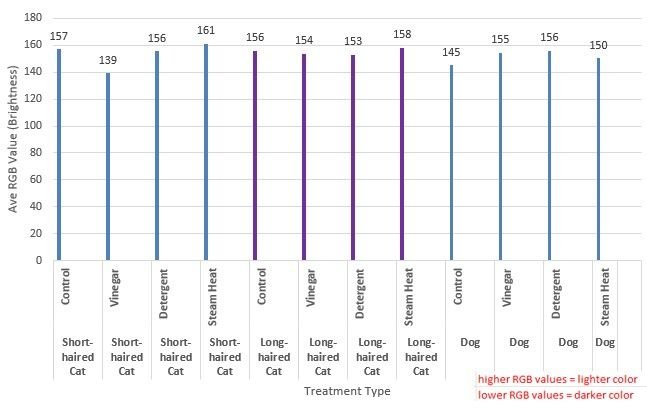
Table 3: Raw RGB Values and Qualitative Notes
- Lists raw RGB values, calculated averages, standard deviations, and qualitative notes for each sample and treatment.
Analysis
ANALYSIS & RESULTS
Data Conversion and Calibration
Blue-channel RGB values were converted to estimated protein concentration (mg/mL) using a calibration curve created from gelatin standards prepared within the low-concentration range appropriate for the Biuret assay. The calibration curve (Graph 2) showed a strong, approximately linear relationship between blue-channel intensity and protein concentration (R² = 0.9783), supporting the use of smartphone-based colorimetry for relative protein measurement within this range.
When comparing the replicate calibration data (Table 2), replicates 2 and 3 showed evidence of preparation drift, likely caused by partial gelatin setting while awaiting processing. Due to limited lab time in our home kitchen and having already returned the borrowed equipment to our school, standards could not be remade. Replicate 1 was therefore used to calculate the detection limit because it reflected normal measurement variation and was not affected by gelatin hardening.
Based on the blank response from Replicate 1 (mean blue-channel value = 132, SD = 2), the assay’s effective lower detection limit was estimated to be approximately 13–15 mg/mL. This ensured that the detection limit represented the sensitivity of the measurement method rather than extra variability from sample preparation, while still allowing all replicates to be retained for trend analysis.
No measurements met the predefined criteria for outlier removal (1.5×IQR with documented procedural error). All data were therefore retained to preserve biological variability and maintain transparency (Table 2).
Descriptive Statistics
For each fur type and treatment, mean blue-channel values and standard deviations were calculated from three replicate measurements. Protein concentrations were estimated using the calibration equation when values fell within the calibrated detection range. Percent change relative to the distilled-water control was calculated for each fur type to allow meaningful within-fur comparisons while accounting for differences in baseline protein extractability (Table 4).
Results
Across all fur types and treatments, most estimated protein concentrations fell at or below the assay’s detection limit, indicating that only very low levels of extractable protein were measurable under the conditions tested. Values below the effective detection limit are extrapolated estimates derived from the calibration equation, not directly detectable concentrations. Protein concentrations approaching the detection threshold were observed only for the vinegar-treated short-haired cat fur (\~11 mg/mL) and for the dog fur distilled-water control (\~3 mg/mL), which, although below detection, was consistently higher than treated dog samples. All remaining samples were interpreted as below detection.
Percent change values varied among treatments and fur types (Figure 4). However, many apparent differences occurred within the below-detection range and therefore represent qualitative trends rather than reliable quantitative differences. Because most measurements fell below the detection threshold, inferential statistical tests such as ANOVA were not appropriate, and results were analyzed descriptively instead.
Discussion
Overall, the effectiveness of the treatments was strongly limited by the sensitivity of the assay. Vinegar treatment of short-haired cat fur showed the clearest trend toward reduced extractable protein, approaching but not exceeding the assay’s detection limit. This provides qualitative support for the hypothesis, suggesting that acidic conditions may promote protein denaturation and removal, even though definitive quantitative confirmation was not possible.
In contrast, detergent and steam-heat treatments did not consistently reduce measurable protein levels and often produced values similar to the distilled-water controls. This may be due to protein aggregation, re-adhesion to fur fibers, or limited release of proteins into solution rather than a complete lack of treatment effect. Denaturation does not guarantee extractability; steam may promote aggregation or fiber binding that reduces protein release into aqueous extract. Distilled-water controls consistently produced near-detection-limit values, indicating that low protein extractability is an inherent property of the fur samples rather than a result of the treatments themselves.
Long-haired cat fur showed minimal measurable response across all treatments, suggesting that fur density and fiber structure limited treatment penetration and protein release. Overall, fur structure appeared to influence treatment effectiveness as much as, or more than, treatment type.
Interpretation of Below-Detection Values
Negative or near-zero estimated protein concentrations resulted from blue-channel values falling outside the calibrated detection range. These values do not represent negative protein content but instead indicate protein levels below the assay’s detection limit. Small numerical differences within this range should not be interpreted as biologically meaningful.
Variability and Methodological Limitations
Some variability among samples was expected due to natural differences in fur composition and structure. Replicate measurements showed good agreement within individual samples, indicating consistent colorimetric measurement. However, the large number of below-detection values highlights assay sensitivity as the main limitation of the method and restricts conclusions to qualitative trends rather than precise quantitative comparisons.
Outlier Handling
Outliers were assessed using the 1.5×IQR criterion and were removed only if a clear procedural or recording error was identified. No such errors were noted so all collected data were retained. Retaining all values avoids artificial inflation of treatment effects when working near the assay’s detection limit.
Graph 4: Percent Change Relative to Control
- Percent changes were calculated from calibration-derived values that fall at or below the assay’s effective detection limit (\~13–15 mg/mL). These values represent relative shifts in colorimetric signal rather than reliable quantitative protein concentrations. Percent change is presented to visualize directional trends within each fur type only and should not be interpreted as absolute protein reduction.

Table 4: Summary of Estimated Protein Concentrations
- Shows calculations of percent change relative to the distilled-water control for each treatment within each fur type
- Note : Percent changes are calculated from extrapolated concentrations below the detection limit and are presented solely to visualize relative trends within fur types, not to quantify absolute protein reduction.

Conclusion
CONCLUSION
This experiment investigated the effectiveness of eco-friendly household treatments (steam heat, mild detergent, and vinegar) on reducing extractable protein from pet fur compared to a distilled-water control. Protein levels were measured using a Biuret assay and smartphone colorimetry, and values were interpreted relative to the assay’s effective detection limit (\~13–15 mg/mL).
Key Findings
- Vinegar treatment of short-haired cat fur demonstrated the clearest trend toward reduced extractable protein (\~11% reduction), approaching the detection limit, supporting the hypothesis that acidic conditions can partially denature and remove proteins.
- Detergent and steam-heat treatments did not consistently reduce detectable protein levels; values were generally similar to distilled-water controls, likely reflecting protein aggregation, re-adhesion, or limited extraction rather than a true absence of effect.
Interpretation Relative to the Hypothesis
The hypothesis, that eco-friendly treatments reduce extractable protein, was supported qualitatively but not quantitatively under the sensitivity constraints of the Biuret assay. Vinegar showed a modest trend consistent with pH-driven denaturation. Steam heat, though theoretically effective for protein denaturation, may have promoted protein aggregation or stronger adhesion to fur, reducing detectable extraction. Detergent did not produce consistent reductions, suggesting that short exposure and low concentration were insufficient for significant protein solubilization. These results highlight the distinction between protein denaturation and protein removal, which are not necessarily equivalent in measurable extracts.
Scientific Significance and Implications
- Even modest reductions in extractable protein may be practically meaningful for households with allergy-sensitive individuals.
- Fur structure influences treatment effectiveness as strongly as treatment type, emphasizing the need to consider physical characteristics in allergen management strategies.
- Assay sensitivity is a critical factor; most measured protein concentrations were near or below detection limits, underscoring the importance of aligning experimental methods with the expected magnitude of biological effects.
Limitations and Considerations
- Biuret assay detects total protein rather than allergen-specific proteins (Fel d 1 or Can f 1).
- Smartphone colorimetry and manual extraction introduce minor variability, mitigated by triplicate measurements and consistent calibration.
- The low sensitivity of the Biuret assay restricted quantitative conclusions. Measurements primarily reflect relative trends rather than precise quantitative differences due to detection limits of the biuret reagent.
Overall Conclusion
This experiment demonstrates that simple, eco-friendly household treatments can influence extractable protein levels on pet fur, but measurable effects were generally small and highly dependent on fur type and assay sensitivity. Vinegar produced the most consistent qualitative reduction on short-haired cat fur, while long-haired cat and dog fur showed minimal response. These findings provide evidence-based guidance for low-cost, environmentally responsible strategies to reduce allergen exposure in domestic settings and offer a foundation for future studies using more sensitive detection methods or optimized extraction procedures.
FUTURE RESEARCH
To advance this project and improve both precision and practical relevance, several next-step investigations are recommended:
- Allergen-Specific Quantification (ELISA): Directly measure Fel d 1 and Can f 1 to determine correlation with total protein reductions.
- Protein Profiling (SDS-PAGE): Visualize molecular weight distribution and treatment effects on protein classes.
- Expanded Material Testing: Test treatments on carpets, upholstery, bedding, toys, clothing, and air filters.
- Prototype Optimization Trials: Refine devices (e.g., Eco‑Steam Refresh Chamber) with varied steam durations, temperature gradients, detergent cycles, and UV-C exposure.
- Benchmarking Against Commercial Products: Compare eco-friendly treatments with commercial sprays, detergents, and HEPA devices.
- Airborne Allergen Monitoring: Measure airborne protein levels and persistence after treatment.
- Assay and Extraction Optimization: Use more sensitive assays, higher concentrate samples, extend extraction time, and use reducing agents. Construct calibration curves with low-concentration standards.
- Data & Observations Strategy: Systematically record all raw RGB values, qualitative observations, and calibration data. Ensure replication and include positive controls to validate assay sensitivity.
WHY THIS RESEARCH MATTERS
Pet allergies affect millions and contribute to asthma and allergic diseases. Identifying accessible, eco-friendly ways to reduce allergenic proteins at the source could improve indoor air quality, support allergy-sensitive individuals, and reduce reliance on chemical interventions.
Even modest reductions in extractable protein can provide practical benefits. This project demonstrates the potential of simple household treatments, emphasizes the role of fur type and treatment method, and establishes a foundation for developing optimized, eco-friendly strategies for allergen reduction.
Application
INTERPRETATION & APPLICATION
Overall Findings
Eco-friendly treatments produced modest reductions in extractable protein. Most concentrations were below the detection limit, limiting quantitative analysis. Vinegar treatment of short-haired cat fur showed the strongest trend (11.32% reduction), occurring near the detection limit, providing limited support for the hypothesis. Detergent and steam treatments did not consistently reduce protein; some apparent increases likely reflected protein aggregation or enhanced adhesion, not actual protein gain.
Influence of Fur Type
Long-haired cat and dog fur showed minimal measurable response, likely due to density and fiber structure, while short-haired cat fur was more responsive to vinegar.
Practical Applications
- Mild acidic rinses (vinegar) may reduce extractable protein for short-haired pets.
- Vacuum attachments or cleaning units applying heat or biodegradable agents could help in pet bedding, toys, and fabrics.
- Low-cost, environmentally responsible sprays may benefit allergy-sensitive households.
Even small reductions can improve indoor air quality and help allergy-sensitive individuals. However, the study highlights that mild treatments alone are unlikely to produce large reductions without assay optimization.
Sources Of Error
EXPERIMENTAL ERROR & PROJECT LIMITATIONS
Several limitations were identified and considered in interpreting results:
- Assay Specificity: The Biuret assay measures total protein rather than allergen-specific proteins (Fel d 1, Can f 1), so allergen reduction could only be inferred indirectly.
- Assay Sensitivity: Most measurements fell at or below the detection limit (\~13–15 mg/mL), preventing detection of subtle differences between treatments.
- Measurement Variability: Smartphone-based colorimetry can introduce variability. This was mitigated by averaging three replicates per sample and using a calibration curve with a high R² (0.9783).
- Biological Variability & Sample Size: Differences in fur type, density, and fiber structure contributed to overlapping values between treatments. The sample size allowed observation of qualitative trends but limited statistical power.
- Manual Handling & Environmental Factors: Rinsing, extraction, and solution handling may have introduced variability. Room temperature and humidity could also have affected reactions.
- Calibration Curve Considerations: Gelatin standards differ from natural fur proteins, affecting absolute accuracy. However, relative comparisons between samples remain valid.
- Extraction Efficiency: Larger sample sizes alone may not guarantee detectable protein concentrations without improving extraction conditions or assay sensitivity.
Future Improvements To overcome these limitations, future studies could:
- Use more sensitive protein detection methods, such as fluorescence-based assays or ELISA.
- Concentrate extracts or increase the extract-to-reagent ratio to enhance detectability.
- Improve extraction efficiency with longer incubation, reducing agents, or controlled agitation.
- Construct calibration curves with additional low-concentration standards for better accuracy near detection limits.
- Incorporate allergen-specific assays and expand testing to fabrics and household surfaces.
Despite these limitations, consistent trends across replicates and fur types support the reliability of relative comparisons and the overall conclusions of this study.
Citations
REFERENCES:
Pet Allergens and Health Impact
- American Lung Association. (2023). Pet dander. Retrieved January 18, 2026, from https://www.lung.org/clean-air/indoor-air/indoor-air-pollutants/pet-dander
- Purpose: Explains what pet dander is and its role in triggering allergies and asthma.
- National Institute of Environmental Health Sciences. (n.d.). Pet allergens. Retrieved January 8, 2026, from https://www.niehs.nih.gov/health/topics/agents/allergens/pets
- Purpose: Overview of common pet allergens and associated health risks.
- Bonnet, B., Messaoudi, K., Jacomet, F., et al. (2018). An update on molecular cat allergens: Fel d 1 and what else? Allergy, Asthma & Clinical Immunology, 14, 14. https://doi.org/10.1186/s13223-018-0239-8
- Purpose: Provides detailed molecular information on Fel d 1, including its origin in sebaceous and salivary glands, low molecular weight, and airborne behavior.
- Thermo Fisher Scientific. (n.d.). Can f 1. Allergen Encyclopedia. Retrieved January 18, 2026, from https://www.thermofisher.com/phadia/us/en/resources/allergen-encyclopedia/e5/e101.html
- Purpose: Provides detailed information on the major dog allergen Can f 1, including its origin, molecular properties, and role in allergic reactions.
- Thermo Fisher Scientific. (n.d.). e94 Fel d 1 scientific information. In Allergen Encyclopedia. Retrieved January 18, 2026, from https://www.thermofisher.com/phadia/us/en/resources/allergen-encyclopedia/e1/e94.html
- Purpose: Provides detailed scientific information on the major cat allergen Fel d 1, including its origin, molecular characteristics, and role in allergic reactions.
- Made in CA. (2024, December). Pet ownership statistics Canada. Retrieved January 18, 2026, from https://madeinca.ca/pet-ownership-statistics-canada/
- Purpose: Summarizes Canadian pet ownership trends
- Canadian Animal Health Institute. (2022, October 12). Latest Canadian pet population figures released. Retrieved January 18, 2026, from https://cahi-icsa.ca/press-releases/2022-latest-canadian-pet-population-figures-released
-
Purpose: Provides official Canadian pet population data, including the statistic that 60% of households own at least one dog or cat.
8. Allergen Bureau. (2022). Quantifying total protein. Retrieved January 18\, 2026\, from https://info.allergenbureau.net/wp-content/uploads/2022/03/Quantifying-total-protein_v4_update-280822.pdf 1. Purpose: Provides guidance on using total protein concentration as a surrogate for allergen presence when specific assays are impractical.
-
Protein Structure and Denaturation
- LibreTexts. (2025). Proteins. In The Basics of General, Organic, and Biological Chemistry. Retrieved January 18, 2026, from https://chem.libretexts.org/Bookshelves/Introductory_Chemistry/The_Basics_of_General_Organic_and_Biological_Chemistry_(Ball_et_al.)/18%3A_Amino_Acids_Proteins_and_Enzymes/18.04%3A_Proteins
- Purpose: Explains protein structure and denaturation, supporting the concept that disrupting interactions alters structure and increases removability.
- Centers for Disease Control and Prevention. (2024, May 17). Steam sterilization. In Guideline for disinfection and sterilization in healthcare facilities. U.S. Department of Health & Human Services. https://www.cdc.gov/infection-control/hcp/disinfection-sterilization/steam-sterilization.html
- Purpose: Explains how steam / moist heat denatures proteins.
- LibreTexts. (2025). Denaturation of proteins. In Applied Chemistry for the Health Sciences. LibreTexts. https://chem.libretexts.org/Courses/American_River_College/CHEM_309%3A_Applied_Chemistry_for_the_Health_Sciences/09%3A_Proteins_-_An_Introduction/9.06%3A_Denaturation_of_Proteins
- Purpose: Explains how detergents disrupt hydrophobic interactions and cause protein denaturation.
Protein Assays and Measurement
- LibreTexts. (2025). Experiment 729: Qualitative testing of amino acids and proteins. In Chemistry 6 and Chemistry 7 Combined Laboratory Manual. LibreTexts. https://chem.libretexts.org/Courses/Los_Medanos_College/Chemistry_6_and_Chemistry_7_Combined_Laboratory_Manual_(Los_Medanos_College)/01%3A_Experiments/1.29%3A_Experiment_729_Qualitative_Testing_of_Amino_Acids_and_Proteins_1_2
- Purpose: Describes the Biuret test for detecting peptide bonds in proteins.
- Thermo Fisher Scientific. (n.d.). Chemistry of protein assays. Retrieved January 8, 2026, from https://www.thermofisher.com
- Purpose: Details Biuret assay chemistry and suitability for school labs.
- Rabin, R. L., Croote, D., Chen, A., Dobrovolskaia, E., Wong, J. J. W., Grossman, J., & Hamilton, R. G. (2024). A human monoclonal antibody based immunoenzymetric assay to measure Fel d 1 concentrations in cat hair and pelt allergenic extracts. Frontiers in Allergy, 4, Article 1417879. https://doi.org/10.3389/falgy.2024.1417879
- Purpose: Reviews immunoassay techniques and supports allergen measurement rationale.
Smartphone Colorimetry Validation
- Gee, C. T., Kehoe, E., Pomerantz, W. C. K., & Penn, R. L. (2017). Quantifying protein concentrations using smartphone colorimetry: A new method for an established test. Journal of Chemical Education, 94(7), 956–961. https://doi.org/10.1021/acs.jchemed.6b00676
- Purpose: Validates smartphone-based colorimetric analysis for Biuret assay.
Eco-Friendly Cleaning
- U.S. Environmental Protection Agency. (n.d.). Safer Choice program. Retrieved January 11, 2026, from https://www.epa.gov/saferchoice
- Purpose: Supports claim that vinegar and mild detergents are eco-friendly alternatives.
Materials & Method Validation
- Instant Brands Inc. (2021). Instant Pot Pro multi-use pressure cooker: EN-US user manual (Version 1). Scribd. https://www.scribd.com/document/963057396/Instant-Pot-Pro-Multi-Use-Pressure-Cooker-EN-US-UserManual-1
- Purpose: Confirms steam function specifications (\~100 °C under non-pressurized conditions) and safety guidelines for using the Instant Pot in the experiment.
Acknowledgement
Thank you to our parents for registering us and for their ongoing encouragement and support throughout this project. Thank you to the Bert Church High School science teachers for answering our questions, providing guidance, and lending us supplies and equipment to perform our testing. We are grateful to the pets and their owners for providing ethically obtained fur samples. Finally, thank you to the Calgary Youth Science Fair organizers and judges for the time and effort you invest in creating this valuable learning opportunity for us.
Note: AI tools were used to help identify relevant research sources and summarize background information. We independently reviewed and confirmed all sources and information used in this project.
