Feeding the Future
Aiza Khwaja, Chenwei Pan
Western Canada High School
Grade 10
Presentation
Problem
Abstract:
Child malnutrition remains one of the most persistent public health challenges worldwide, disproportionately affecting low and middle-income regions. In Sub-Saharan Africa, progress toward reducing malnutrition has stagnated despite decades of targeted interventions. This study investigates the potential of machine learning to improve understanding of the multi-factorial drivers of child stunting and to support early identification of populations at heightened risk. Using publicly available datasets from international organizations, including the United Nations Children’s Fund (UNICEF), the World Bank, and the Food and Agriculture Organization, we integrated climatic, agricultural, socioeconomic, and environmental indicators into a unified analytical framework. Several machine learning models, including Random Forest (RF) and K-nearest neighbours (KNN), were applied to assess the relative importance of these factors and to evaluate their predictive capacity. To address both real-time monitoring and forward-looking risk assessment, the study distinguished between nowcasting models that estimate current stunting prevalence and forecasting models that predict future risk using lagged predictors. Results suggested that climate variability, water access, wheat production and socioeconomic conditions play a critical role in shaping malnutrition outcomes. Certain factors, such as gross domestic product (GDP), are shown to be underlying causes of malnutrition, whereas other determinants have the capability of immediately impacting chronic malnutrition within the same year. These findings highlight the importance of combining food-centred strategies with integrated, data-driven approaches to inform proactive, targeted interventions aimed at reducing child malnutrition across Sub-Saharan Africa. To make these findings accessible, an interactive web application was developed that allows users to explore country-level stunting drivers and visualize model predictions across Sub-Saharan Africa. The application is publicly accessible at: https://stunting-prediction-app.streamlit.app/. The application also implements a recursive forecasting pipeline to generate stunting predictions through 2026.
1 Introduction:
Child malnutrition remains one of the clearest signs of long-term stress within a community. Children are especially vulnerable to poor nutrition because it affects their physical development, cognitive growth, and long-term health [1, 2]. Stunting captures chronic malnutrition, measured as low height-for-age. Because children respond so quickly to changes in food access and living conditions, their nutritional status often mirrors broader community well-being.
As of 2024, approximately 23.2% of children under five worldwide were affected by stunting, with the greatest burden in Sub-Saharan Africa [1]. Despite interventions, progress has been uneven. National strategies focus heavily on agricultural productivity and bolstering food supply, yet evidence suggests child malnutrition is shaped by broader factors, including clean water access, sanitation, healthcare, household income, and environmental conditions [3, 4, 5]. This complexity highlights the need to reassess which determinants most strongly influence child nutritional outcomes and how limited resources can be deployed most effectively.
Monitoring and evaluation systems further complicate this challenge. Many countries rely on Demographic and Health Surveys (DHS) [6]. While these surveys provide valuable, high-quality data, they are typically conducted only every four to five years. Such infrequent measurement limits the ability to detect emerging trends or respond to sudden shocks. Survey estimates are vulnerable to measurement error, recall bias, and inconsistencies in data collection, which can obscure real-time changes in nutritional status [7, 8]. As a result, interventions are often reactive rather than preventative, addressing malnutrition only after it has already become widespread.
The analysis and prediction of health–related data have been conducted by researchers using machine learning approaches. For example, Obermeyer et al. [9] have pointed out that machine learning can be used to extract more insightful information from existing data. In a more relevant study, Shen et al. [10] have applied multiple machine learning algorithms to predict stunting among children under five in Papua New Guinea. Their study identified child age, regional location, family wealth, and birth size as key predictors, emphasizing the importance of early-life interventions. The strong predictive performance observed demonstrates the feasibility of machine learning approaches for identifying high-risk populations and guiding targeted interventions. However, their study is limited to a single DHS dataset from one country, with the features studied being limited to only socioeconomic factors.
In this study, machine learning is applied to model child stunting across Sub-Saharan Africa. The study has three primary objectives: (1) to identify the most influential socioeconomic, environmental, and agricultural factors associated with stunting, (2) to develop a predictive modelling framework for estimating current malnutrition and forecasting future risk using readily available data, and (3) to translate these findings into a publicly accessible decision-support tool for governments and humanitarian organizations. This work aims to support earlier, more targeted interventions and inform data-driven strategies for reducing child malnutrition.
Method
2 Methods:
2.1 Data Sources:
Multiple datasets from internationally recognized organizations were integrated to construct a comprehensive panel dataset covering Sub-Saharan African countries from 2000 to 2023. All sources were selected based on data quality, consistency, and relevance to child nutrition outcomes and summarized in Table 1.
Table 1: Datasets used for this study
| Dataset Name | Source | Data Contents | Note |
|---|---|---|---|
| Joint model-based estimates for stunting and overweight (2025 edition) [11] | UNICEF-WHO-The World Bank: Joint Child Malnutrition Estimates | Primarily annually aggregated, country-wise stunting data. | As stunting is the primary target for this machine-learning-model, this dataset was a key part of the data the model was trained upon. Yearly stunting estimates from this data were used. |
| Children’s Climate and Environment Risk Index Data [12] | CCRI: UNICEF | A risk score based on how exposed and vulnerable children are to climate change impacts globally. | The scores were used as a feature. |
| FAOSTAT: Dataset 1 [13] | Food and Agriculture Organization (FAO) of the United Nations | Annual crop production data of primary food crops in Sub-Saharan Africa, including Maize, Cassava, Sorghum and Rice. | This dataset served as a key source of feature generation. |
| FAOSTAT: Dataset 2 [13] | Food and Agriculture Organization (FAO) of the United Nations | Annual economic and social indicators of countries in Sub-Saharan Africa, such as gross domestic product (GDP), access to drinking water, sanitation and political stability. | This dataset served as a key source of feature generation. |
| Spatially aggregated climate data [14] | World Bank | Annual country-wise temperature and precipitation data. | This dataset served as a key source of feature generation. |
2.2 Data Processing and Cleaning:
All datasets were standardized to a country-year format and combined into a single dataset. The initial dataset contained 972 observations across 41 countries. Countries with greater than 30% missing data were excluded as suggested by Alam et al. [15], resulting in 852 observations across 36 countries. Median imputation was applied for extrapolating the remaining missing values. After data cleanup, the final dataset contained 780 complete observations. The exact features can be found in Table A-1 of the Appendix.
2.3 Feature Engineering:
2.3.1 Designing Temporal Features
Considering that the impact of factors such as food availability on malnutrition is not immediate, all the entries in the combined dataset from the past two years were defined as the lagged features for the present year. This formed two categories or variables as potential features for the machine learning: the present-year variables and lagged features. This study adopted two temporal feature design approaches to predict stunting: nowcasting and forecasting. The nowcasting approach uses both present year variables and the lagged features to predict the present year stunting, whereas the forecasting approach only uses the lagged features to predict current stunting. The nowcasting addresses the limited availability of up-to-date malnutrition estimates, whereas forecasting provides nations with the opportunity to plan based on estimates [16, 17].
2.3.2 Feature Generation
A total of 91 features were constructed and listed in Table A-1, including socioeconomic indicators (12), climate variables (6), crop production metrics (72), and environmental vulnerability (1). For each of six staple crops, four metrics were included: production volume, area harvested, yield, and production volatility (three-year rolling standard deviation). Among those features, sixty lagged features were created for all socioeconomic indicators, climate variables, and crop production metrics.
2.4 Machine Learning Algorithms and Model Training
In this study, two complementary algorithms were selected to predict stunting: Random Forest (RF) and K-Nearest neighbors (KNN). RF was chosen for its interpretability and feature importance capabilities, whereas KNN was selected as a simpler baseline comparator [18, 19]. The hyperparameters for RF and KNN were selected through a sensitivity analysis: 100 decision trees with a maximum depth of 15 for RF and k=5 and distance-weighted for KNN. Scikit-Learn was used to implement all models and evaluation procedures [20]. Because KNN is sensitive to feature scale, all input variables were standardized to zero mean and unit variance before training [19]. The RF and KNN were recombined separately with the features generated from the nowcasting and forecasting approaches to create four different models: RF Nowcasting, RF Forecasting, KNN Nowcasting and KNN Forecasting.
The dataset was then randomly divided into training (80%, n=624) and testing (20%, n=156) sets. Model performance was quantified using the coefficient of determination (R- squared) and mean absolute error (MAE) [21, 22]. R- squared measures the proportion of variance explained, while MAE provides average prediction error in percentage points. Feature importance scores were extracted from the RF models [18].
2.5 Web Application Development
To translate model outputs into an accessible policy tool, an interactive web application was developed using Streamlit and deployed publicly via Streamlit Community Cloud. The application allows users to select any Sub-Saharan African country and view the trained Random Forest model's feature importance specific to that country, a time-series visualization of historical stunting rates extended with recursive forecasts to 2026, a 2026 predicted stunting rate with severity classification, the top five most influential predictors with correlation direction, and a categorical breakdown of driver types. The application uses the same final processed dataset and RF model architecture described above, retrained per country to surface location-specific insights.
2.5.1 Recursive Forecasting
Oftentimes, socioeconomic, crop and climate data is not available for the current year, or even the past two years. In scenarios like this, where current, lag1, and lag2 feature data is unavailable, other methodology must be employed to yield predictions and forecasts for future years. Recursive forecasting was utilized to address these situations. This method is a multi-step time series technique where a model predicts one step ahead, and that predicted value is then used as an input to forecast the next time step. This process is repeated until the desired future horizon is reached. For example, the model uses 2022 and 2023 data to predict stunting in 2024. This prediction is then fed back into the model as a feature, and used to predict 2025 values. Recursive forecasting for our model provides a future prediction assuming current factors, such as the country’s crop yield, GDP, and water access, remain the same. One key limitation of this technique is declining accuracy when used over long horizons [23].
2.5.2 Country-wise feature importance
In order to be more valuable to governments and organizations, along with assessing a general model feature importance, country-wise feature importance values were generated. This was based on the idea that variables such as temperature, precipitation, and crop yield differ for each country, meaning separate strategies must be developed per-country. Country-wise feature importance was achieved by running small random forest models on data from each country separately, and yielding a comprehensive feature importance.
Analysis
3 Results:
3.1 Model Predictive Performance:
The predictive performances from four models were summarized in Table 2 with R-squared and MAE. Figures 1 and 2 illustrate further analysis of error distribution, accuracy prediction breakdown, and a Q-Q Plot, which compares the observed residuals and the theoretical normal distribution.
| Model | R2 | Mean Absolute Error (MAE) |
|---|---|---|
| RF Nowcasting | 0.957 | 1.48% |
| RF Forecasting | 0.957 | 1.52% |
| KNN Nowcasting | 0.957 | 1.45% |
| KNN Forecasting | 0.950 | 1.58% |
Overall, good performances were achieved by all four models. More than 68% of predictions fell within ±2 percentage points of observed stunting rates, indicating high reliability. These model outputs are made interactively accessible through the deployed web application, which surfaces country-specific feature importance and historical trends for policy-makers. While KNN marginally outperformed RF for nowcasting, RF demonstrated better performance for forecasting tasks, which can be considered more valuable to governments and institutions when proactively strategizing for malnutrition.
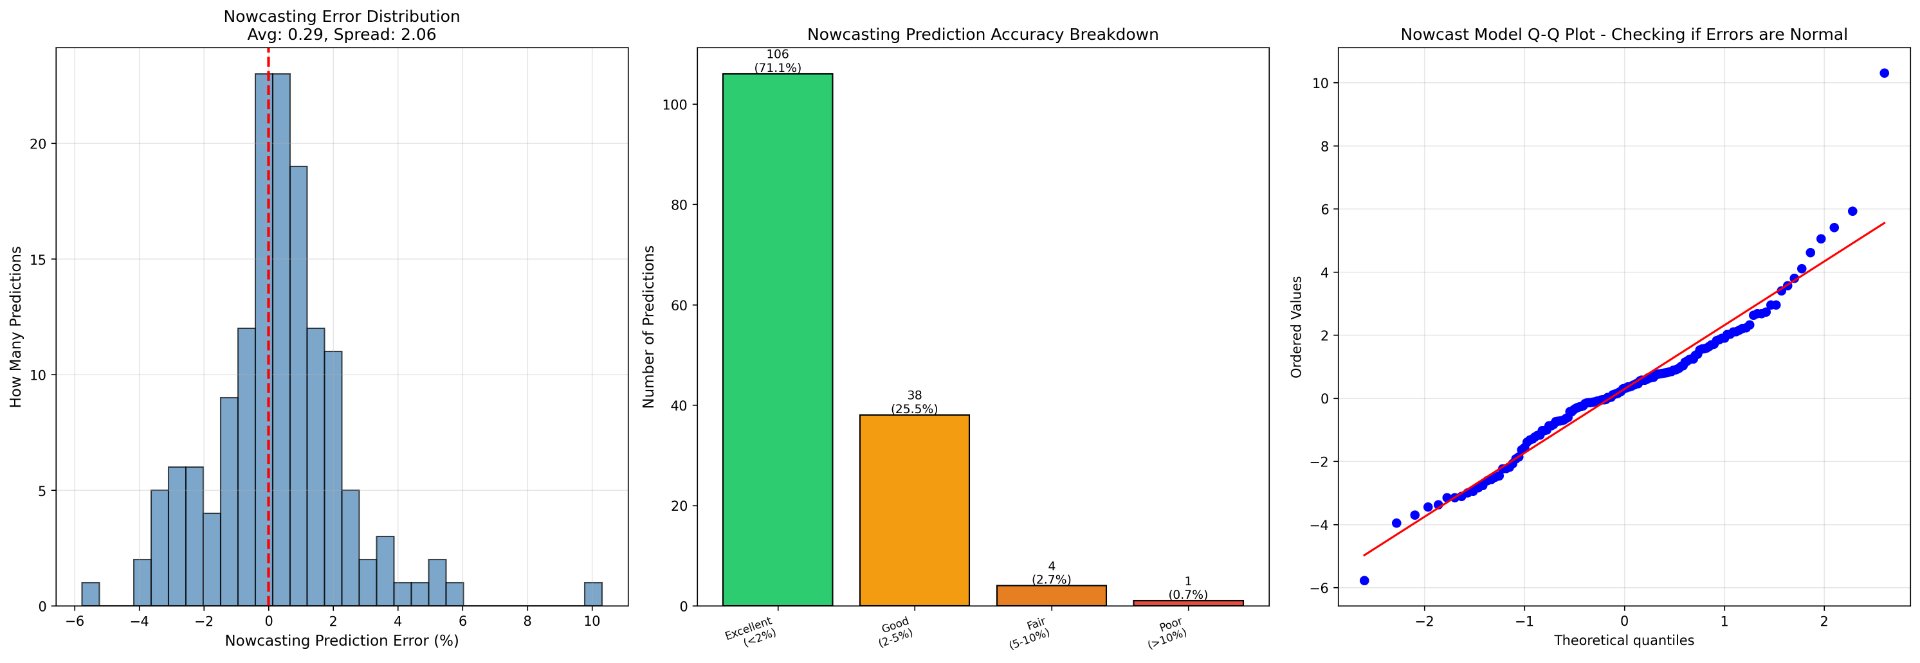 Figure 1: Error distribution (left), accuracy prediction breakdown (middle), and Q-Q Plot (right) for the nowcasting model.
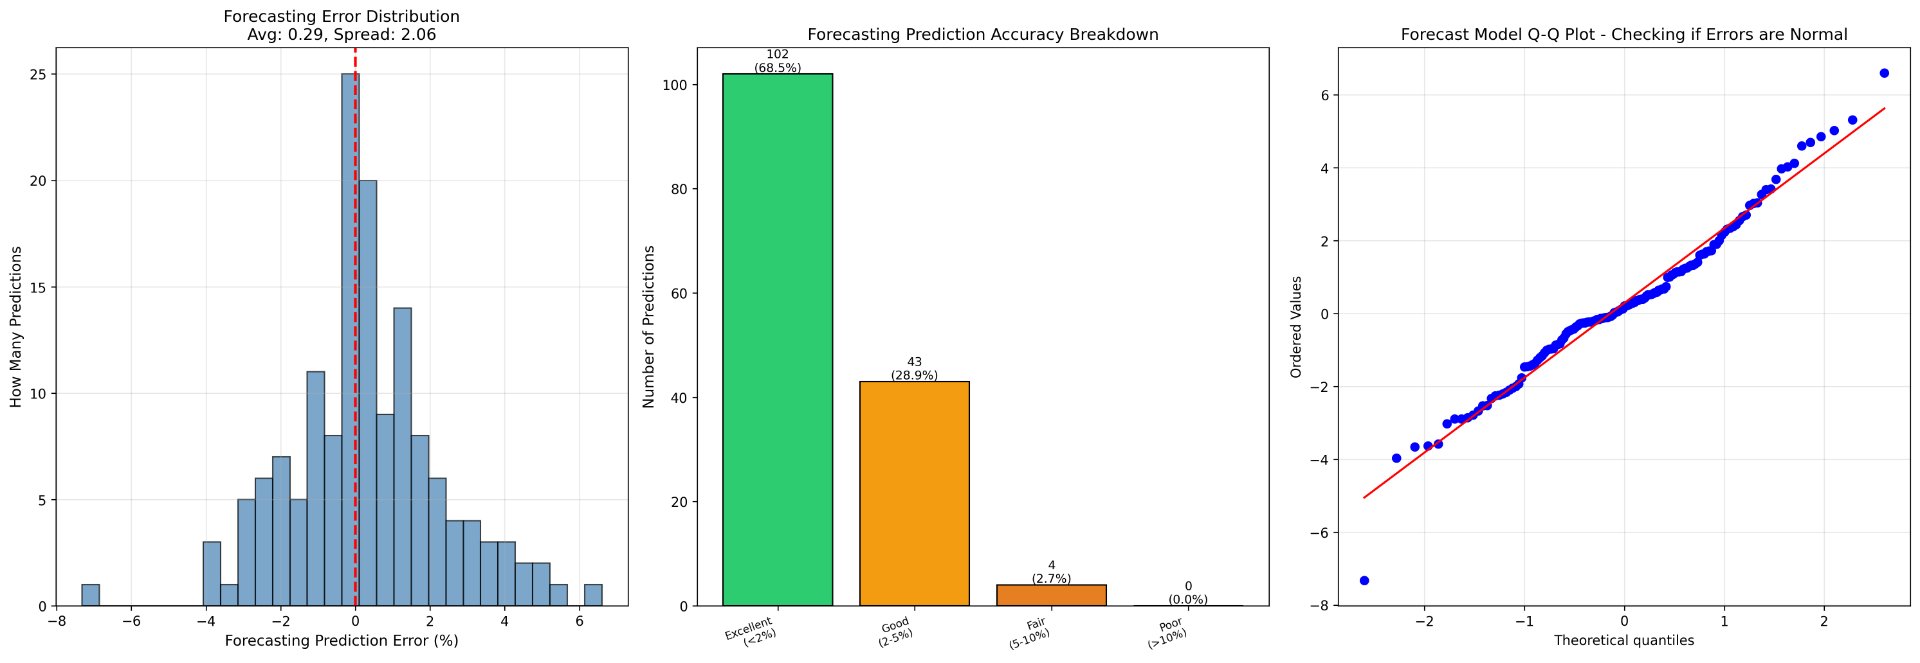 Figure 2: Error distribution (left), accuracy prediction breakdown (middle), and Q-Q Plot (right) for the forecasting model.
3.2 Residual Analysis:
To further evaluate model performance, a residual analysis was conducted. A residual analysis has proven to be an effective technique in terms of analyzing goodness of fit, or how well the model generalizes when presented with new data, while capturing underlying trends. Randomly spread out residuals indicate a good fit, whereas patterns in residuals could signify overfitting or underfitting, commonly seen in models that memorize noise or fail to track patterns. The following formula was used to calculate residuals:
Residual = Observed Value (Actual) - Predicted Value
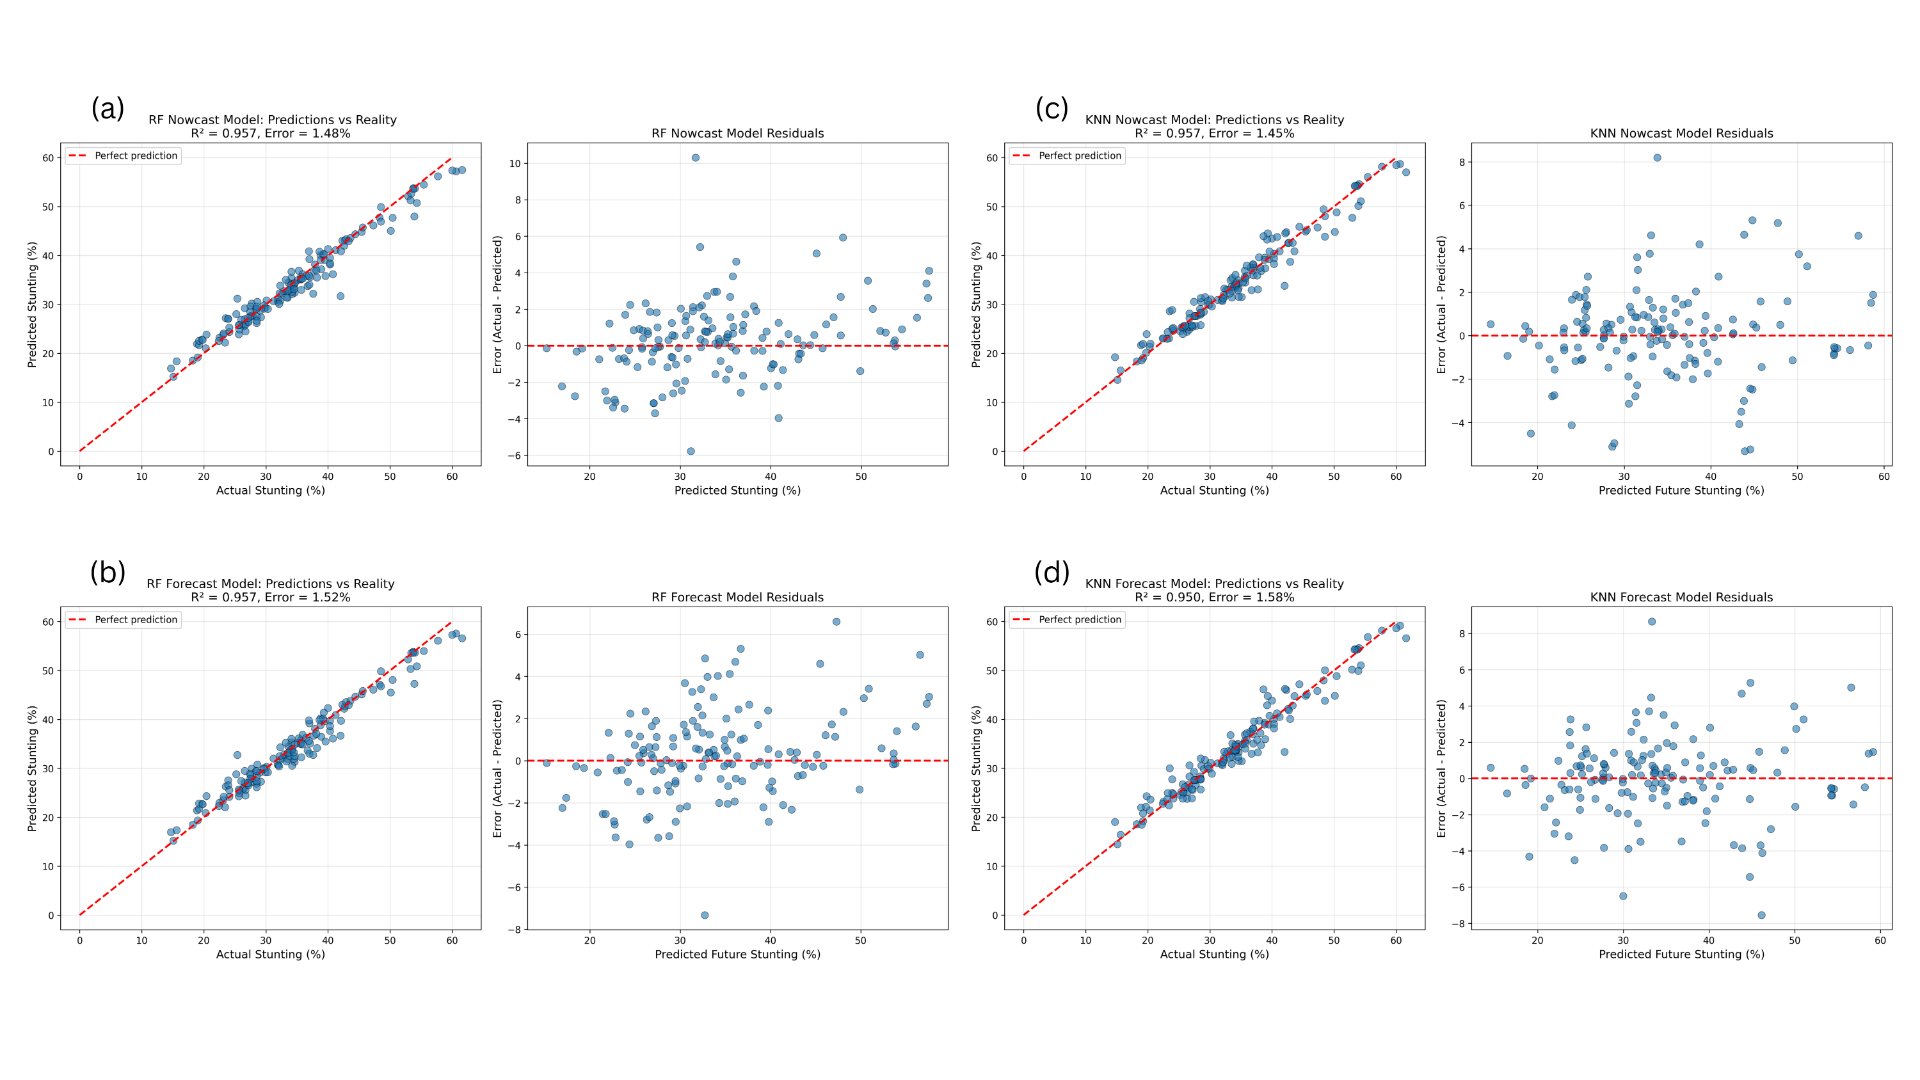 Figure 3: Parity and residual scatterplots demonstrating the difference between actual and predicted values for the RF algorithm; (a) RF nowcasting, (b) RF forecasting, (c) KNN nowcasting, and (d) KNN forecasting
Figure 3 demonstrates that both RF and KNN exhibited similar residual scatter distributions, with residuals randomly dispersed around zero and no clear systematic patterns. This indicates comparable fits for both models and suggests that neither algorithm showed pronounced overfitting or underfitting.
3.3 Feature Importance:
The feature importance from RF models was analyzed and plotted in Figure 4. Gross domestic product (GDP) per capita (\~0.37), water access (\~0.1) and wheat production (0.026 - 0.036) emerged as the strongest predictors of chronic malnutrition for both the nowcasting and forecasting models. Lagged features consistently outperformed current-year features, highlighting how stunting develops slowly and over time, with previous trends having a long-term impact on current and future conditions. Specifically, lag2 features, which are the variables that were lagged two years, showcased higher capabilities for both predictive models. However, both current and lagged water access variables had a high rank, demonstrating their ability to impact stunting immediately as well as over time. Additionally, certain current-year variables had greater importance compared to their lagged counterparts, including maize area, political stability, cassava production, and rice production.
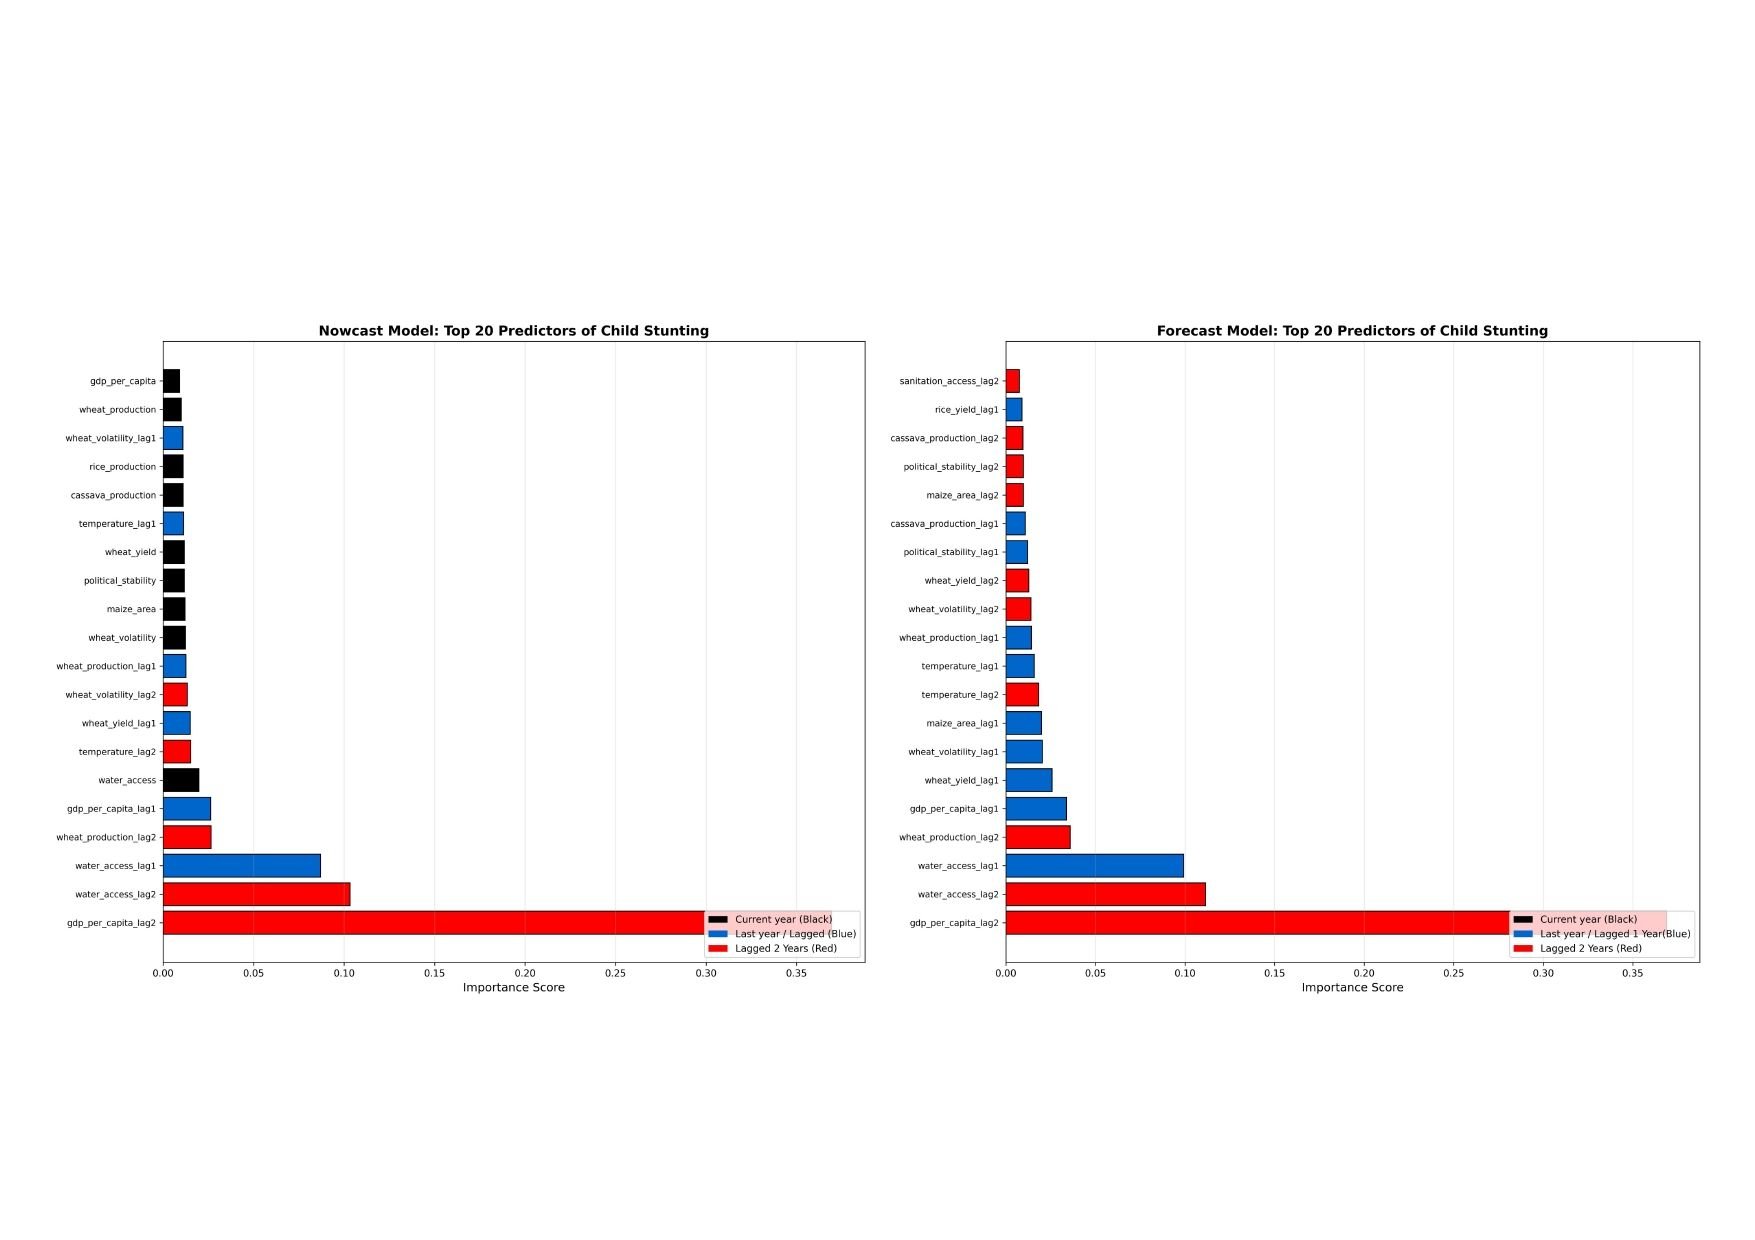 Figure 4: Bar Graph showcasing feature importance for nowcasting model (left) and forecasting model (right), where the Y-axis represents the features and the X-axis represents the importance score. Note: The feature importance graphs above reflect the overall RF model trained across all 36 Sub-Saharan African countries. Country-specific feature importance, historical stunting trends, and driver breakdowns can be explored interactively at the web application linked above.
To further illustrate the value of country-level analysis, the web application was used to explore stunting drivers in Burundi, the country with the highest recorded stunting rate in the dataset at 54.9% as of 2023. Despite a modest decline of 6.7 percentage points since 2003, Burundi's stunting burden remains the most severe across all 36 countries studied. Notably, the country-level feature importance for Burundi diverges substantially from the global model. Rather than GDP per capita or water access dominating as primary drivers, crop-specific agricultural variables emerged as the strongest predictors. Yams area harvested lagged by two years and one year ranked as the top two predictors, both positively correlated with stunting, suggesting that expansion of yam cultivation may reflect underlying food insecurity rather than improved nutrition. Maize production in the current year was the third strongest predictor and negatively correlated with stunting, reinforcing its role as a short-term food security buffer. These country-level divergences highlight a key limitation of global models: aggregate feature importance may obscure the locally specific pathways through which malnutrition manifests. The interactive application addresses this gap by retraining the Random Forest model per country, allowing policy-makers to identify location-specific intervention priorities rather than relying solely on regional averages. Figures 5 and 6 illustrate these outputs for Burundi as visualized in the application.
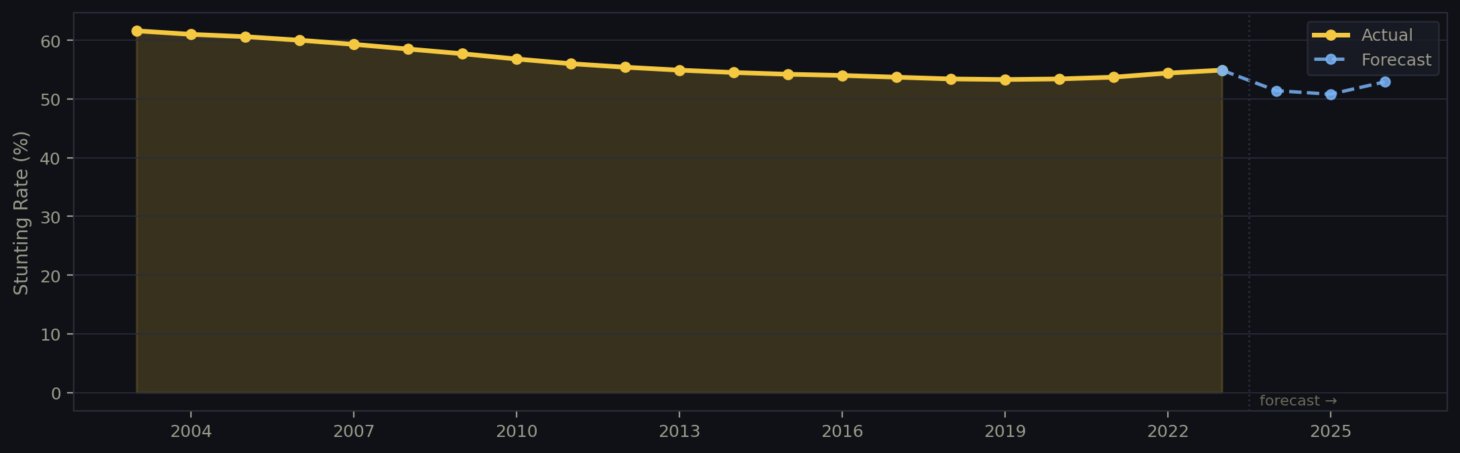 Figure 5: Stunting rate over time in Burundi (2003–2023) with recursive forecasts to 2026 as visualized in the interactive web application, showing a decline of 6.7 percentage points despite remaining the highest stunting prevalence among all 36 countries studied. Dashed blue line indicates iterative predictions generated by the Random Forest forecasting model.
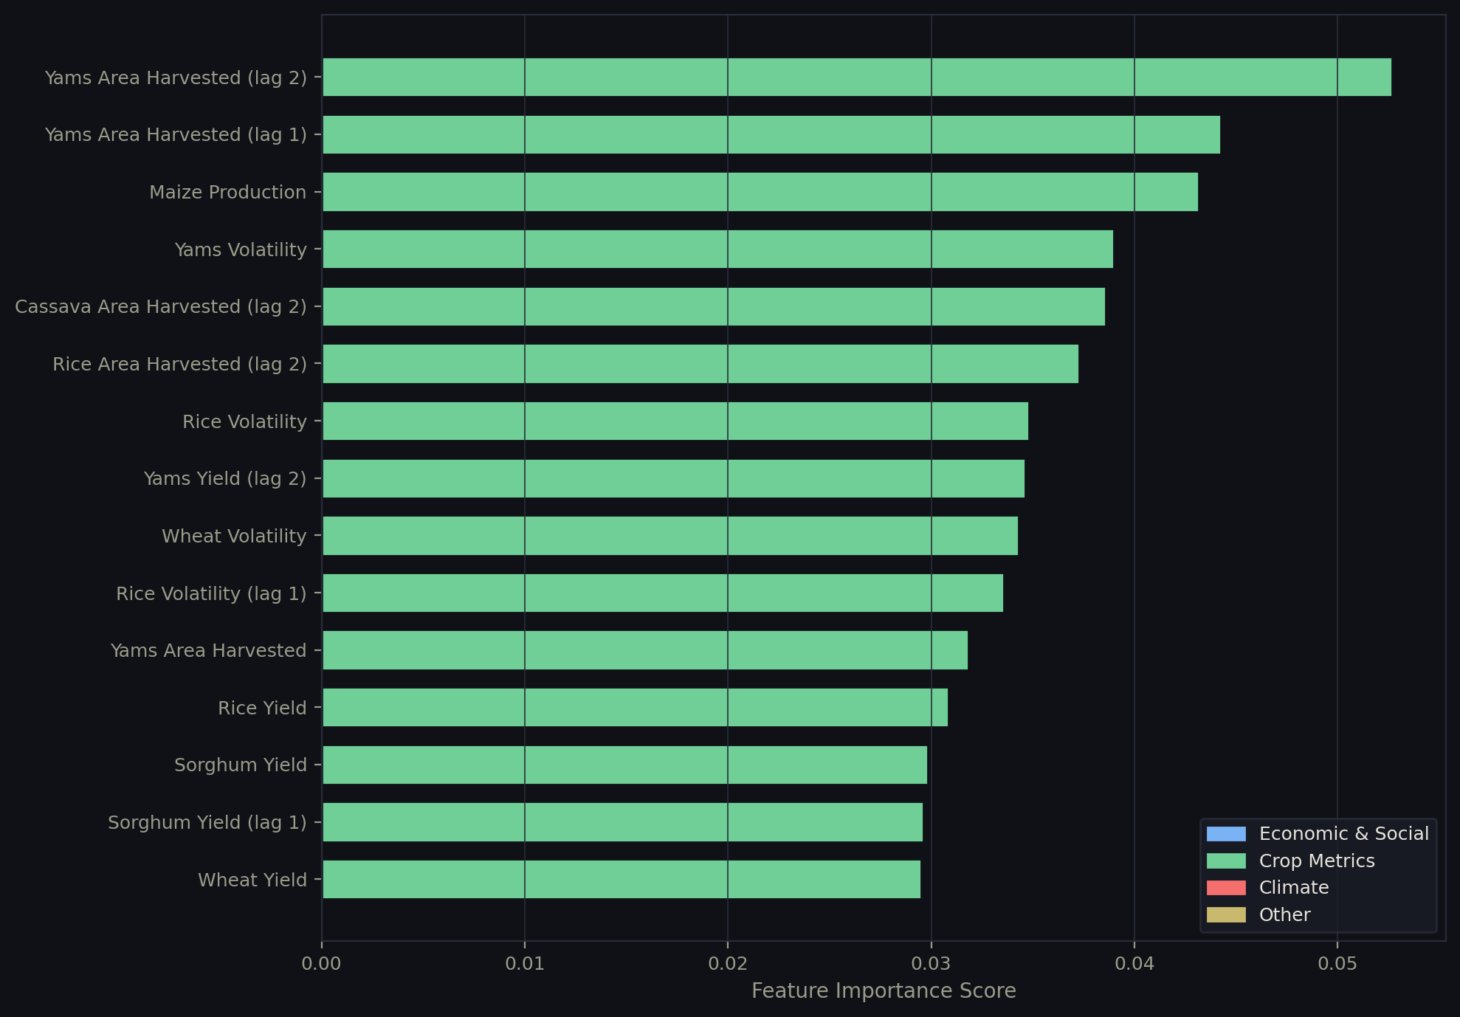 Figure 6: Country-level feature importance for Burundi as generated by the Random Forest model in the interactive web application, highlighting the dominance of crop-specific agricultural variables, particularly yams area harvested and maize production, as primary drivers of stunting in contrast to the global model.
While country-level drivers vary as demonstrated above, the overall categorical breakdown across all 36 countries reveals consistent patterns. Figure 7 showcases the importance breakdown for categories when predicting stunting. Economic and social features exemplified the highest importance when predicting stunting, with a total importance of about 65%. Crop metrics achieved an importance of around 30%, followed by climate variables (3.5 - 3.7%).
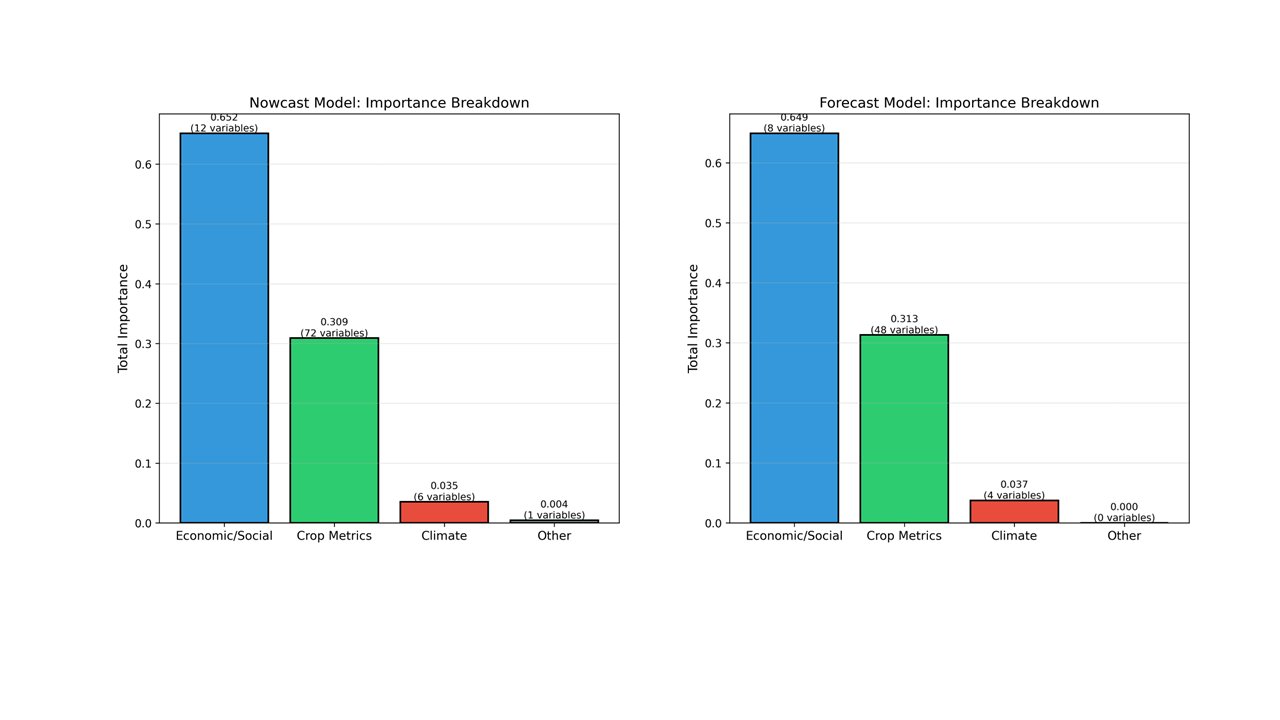 Figure 7: Categorical feature importance breakdown for nowcasting model (left) and forecasting (right); Blue bar represents economic/social feature, green bar represents crop metrics, red bar represents climate, and grey bar represents other features.
3.4 Feature Correlation Analysis:
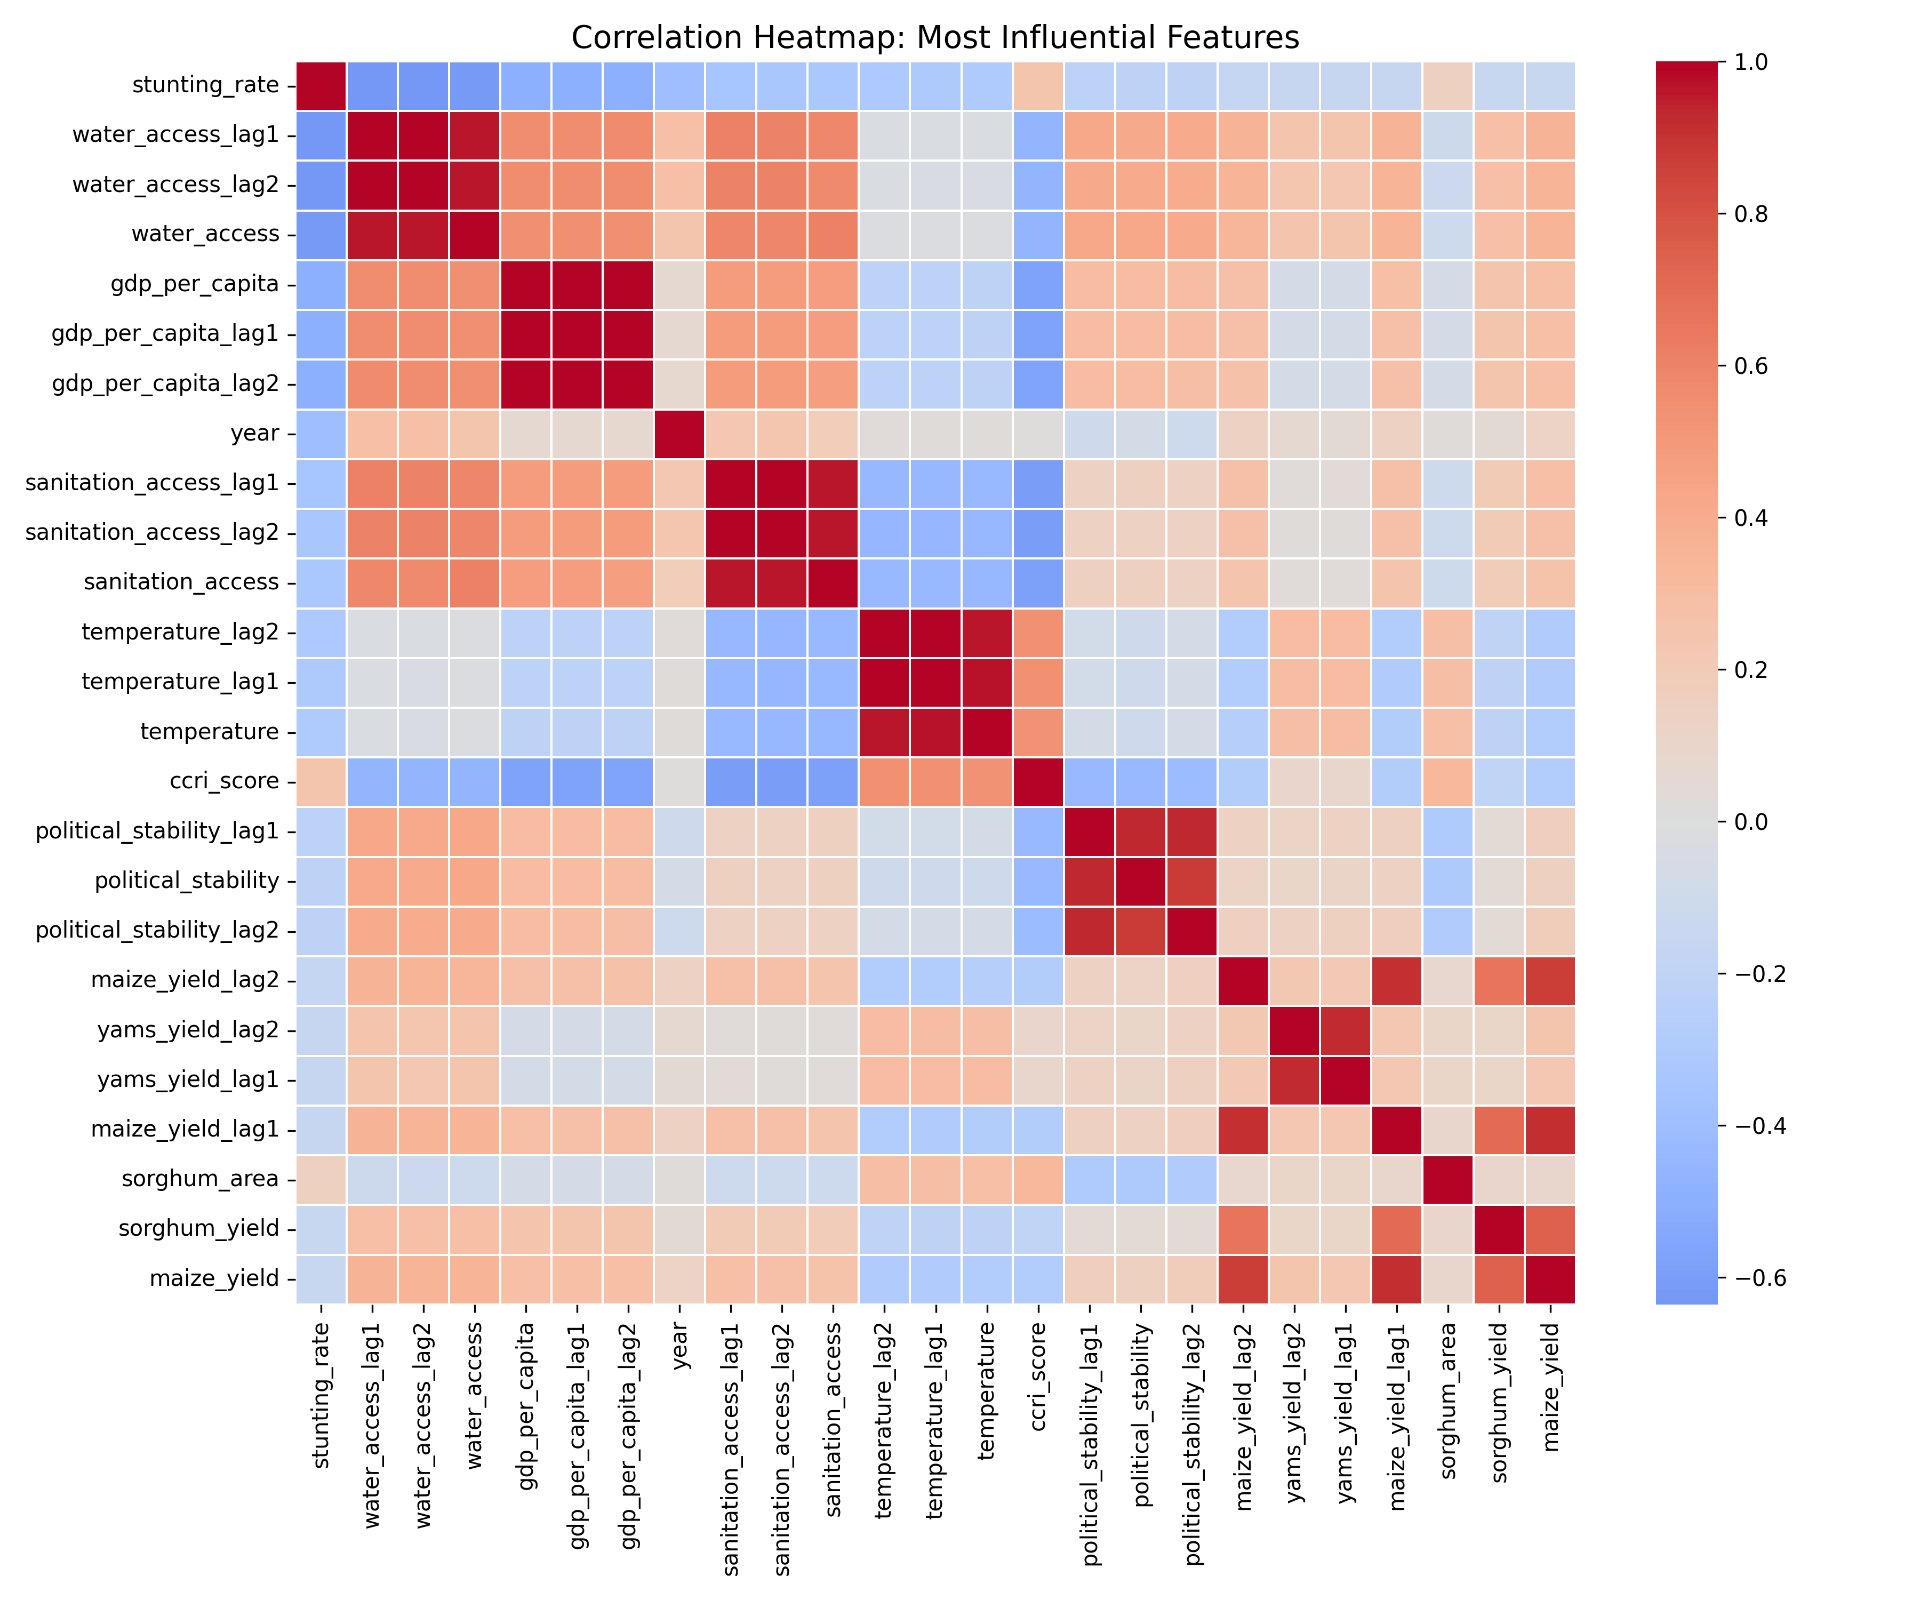 Figure 8: Correlation heatmap illustrating relationships among the most influential features and the stunting rate. Darker red colours indicate stronger positive correlations, whereas darker blue colours denote stronger negative correlations.
Figure 8 provides insight into the relationships among key predictors and the stunting rate used in the machine learning models and helps contextualize the feature importance results. Strong negative correlations were observed between socioeconomic indicators (such as GDP per capita, access to clean water, access to sanitation, and political stability, including their lagged versions) and the stunting rate. This indicates that higher levels of these socioeconomic indicators would reduce the stunting rate. To be noted, although wheat production was not included as one of the most influential features by the model, it also had a negative correlation with the stunting rate, indicating that the increase in wheat production would reduce the stunting rate.
4 Discussion:
4.1.1 Objective 1: Improving Stunting in Sub-Saharan Africa:
The model’s feature importance estimates provide critical insight into the structural drivers of child stunting, which is a key objective of this study. These estimates offer more practical value for early risk identification and policy planning. This is particularly valuable for governments, as they now know what kind of features can become available and also have a strong impact on stunting.
Lagged features consistently demonstrated higher importance when predicting stunting compared to current-year features. This highlights the slow-developing nature of chronic malnutrition, as damage accumulated in previous years cannot be reversed by sudden current-year improvements or changes alone. Moreover, features that were lagged by two years were better predictors of both current and future malnutrition compared to other features, reinforcing the way stunting takes time to manifest. This delayed effect occurs over multiple years of poor nutritional, economic, and climate-related conditions. Temporal patterns like these highlight the biological realities of chronic child malnutrition: chronic malnutrition occurring during the first 1,000 days or two years is largely considered irreversible [24]. Hence, conditions even two years prior leave a lasting impact on stunting rates that continue to persist even after circumstances improve. As circumstances between the ages of 0-2 are crucial for a child’s development, features that were lagged two years (lag2) may coincide better with this window, making them stronger predictors for stunting. Results from this study reflect the need for early intervention since the effects of economic shocks compound over multiple years.
Lagged GDP per capita was the most prominent predictor of stunting, and can be considered a key root cause of the chronic malnutrition problem. However, its implications are well understood and largely constrained by long-term structural change. In contrast, water access and wheat-related features provide more direct points of intervention.
Both current and lagged water access were key drivers of stunting, highlighting the importance of access to clean water throughout the stages of malnutrition. While current water quality impacts health and malnutrition status immediately, it is also a persistent factor that compounds as time passes. Poor water quality can lead to repeated infections, diseases, and impaired nutrient absorption, which will worsen malnutrition over time. These results emphasize that investment in reliable water access points, rainwater harvesting systems, groundwater resource evaluation, sanitation systems, and other water infrastructure can yield immediate changes in malnutrition rates, and can also benefit stunting in the long-term.
Additionally, both current and lagged wheat production, yield, and volatility consistently outperformed other crops, reflecting its importance due to high nutritional value as well as its significance in terms of global trade. Despite being an annually harvested crop, wheat production is vulnerable to many stressors, such as climate change and geopolitical events, positioning it as a valuable indicator of global trends with the ability to have a long-term impact on malnutrition. Improving wheat resilience and supply through climate-smart agriculture, drought-resistant varieties, irrigation efficiency, and strategic reserves could therefore help stabilize food stability and help reduce long-term malnutrition risk.
In the nowcasting model, certain current-year variables performed better than their lagged counterparts. These included maize area, political stability, cassava production, rice production, and current wheat variables. Such results showcase these variables as factors that can impact stunting rates even within the same year. Maize and rice have relatively short growing seasons and can buffer acute food shortages [25], [26]. Cassava, in particular, is widely considered a risk-buffer crop and famine reserve, making it a critical tool for short-term nutrition stabilization [27], [28]. Political instability also emerged as a key immediate feature, as it can disrupt food systems and healthcare access rapidly.
Overall, two main classes of factors are determined from these results: underlying factors or root causes that shape long-term vulnerability (GDP per capita, water access, wheat production, temperature) and immediate factors (water access, political stability, maize, rice and wheat production) that trigger impacts on nutrition in the short term. While improving economic capacity remains essential for reductions in stunting, the findings suggest that emphasis should also be placed on realistic, lesser-known, sector-specific interventions that target water access and wheat production. Strengthening water infrastructure, expanding reliable access to safe drinking water, reducing the volatility of wheat production, and investing in resilient agricultural practices are likely to produce more tangible and timely reductions in stunting than blindly increasing food production alone. Based on these classifications, the strategy for interventions would depend heavily on the objective. Government efforts that seek to rapidly improve stunting rates in the short-term would require targeting immediate factors, whereas focusing on underlying factors would allow for the eradication of food insecurity on a lasting basis.
By prioritizing these high-impact and modifiable factors, governments and other agencies can better align interventions with the most influential factors of stunting and make more progress towards long-term nutrition targets to achieve United Nation’s goal 2 of zero-hunger by creating a world free of hunger by 2030.
4.1.2 Objective 2 & 3: Monitoring, Planning, and Knowledge Translation for Stunting in Sub-Saharan Africa:
The results of this study demonstrate that machine learning models can effectively capture the complex, multifactorial nature of child stunting across Sub-Saharan Africa. Both RF and KNN achieved high predictive accuracy, with R2 values exceeding 0.95, indicating that a substantial proportion of variation in stunting prevalence can be explained using readily available socioeconomic, environmental, and agricultural data.
The strong performance of both nowcasting and forecasting models highlights the feasibility of using routinely collected data to support near-real-time nutritional surveillance. This is particularly valuable in settings where traditional survey data are infrequent, delayed, or logistically challenging to collect. By leveraging existing data streams, policymakers can gain earlier insight into emerging risks and allocate resources more proactively.
The nowcasting model can be used when recent data on socioeconomic and agricultural indicators are available, but stunting survey data are not yet collected or processed. This approach could supplement infrequent DHS surveys by providing interim estimates between survey rounds. It can also be used to validate the measured stunting rates and identify potentially erroneous data.
The forecasting model can be used to predict future stunting rates, supporting other, widely-utilized early warning systems. This forward-looking approach is particularly valuable for humanitarian planning and resource allocation, as it provides a warning of emerging nutritional crises 12 months in advance. To further demonstrate this capability, the web application implements a recursive forecasting pipeline that iteratively predicts 2024, 2025, and 2026 stunting rates using only lagged features, with each year's prediction serving as input for the next. This allows the model to generate actionable multi-year outlooks from the most recently available survey data.
As a third objective, the findings of this study were translated into a publicly accessible web application to support knowledge mobilization beyond the academic community. The tool allows governments, NGOs, and humanitarian organizations to interactively explore country-specific stunting drivers and historical trends without requiring technical expertise, directly addressing the gap between research outputs and operational decision-making. By making model outputs navigable at the country level, the application bridges the divide between predictive modelling and real-world policy implementation.
4.2 Limitations and Sources of Error:
There were several limitations to be considered for this project.
Firstly, the annual aggregation of the data reflected the current state of international development databases, which limited sensitivity to within-year fluctuations. When we removed certain climate features and retested the model, accuracy actually improved, which told us those features were adding noise rather than signal. This suggests our yearly data is too broad to capture sudden events like a single bad drought season, which likely still affect stunting but don't show up clearly in annual averages.
Secondly, when we looked at Burundi or specific countries, different factors rose to the top compared to the global model. This showed us that just because two things are correlated across all 36 countries doesn't mean one is actually causing the other in any specific place. However, the global model is still valuable. It identifies broad regional patterns and common drivers that apply across Sub-Saharan Africa as a whole, which is useful for large-scale policy and resource allocation. The country-specific analysis in our web application addresses this gap by allowing users to explore local drivers for each individual country, combining the big-picture view with on-the-ground detail.
In scenarios where recursive forecasting must be utilized in order to provide future predictions, since recent socioeconomic, climate and crop data is unavailable, the limitations of the methodology must be addressed. When forecasting over large horizons, errors may accumulate and magnify over the horizon. Due to this, accuracy may decline. To mitigate this error propagation as much as possible, we maintained a horizon of 1-3 steps. Keeping recursion depth, or the number of steps, to a maximum of three would allow for forecasting over that still predicts the future and is valuable to organizations, while maintaining accuracy.
Finally, the models were developed using historical data from 2000 to 2023, and their performance assumed relative stability in underlying relationships. As contexts evolve through policy changes, economic transitions, or climate shifts, periodic model updating would be necessary to maintain accuracy.
4.3 Future Directions:
Future research could build upon this work in several important ways. Incorporating subnational or geospatially resolved data would allow for more granular risk mapping and improved targeting of interventions. Integrating additional data sources, such as satellite-derived vegetation indices, food price data, or conflict exposure metrics, could further enhance predictive performance.
Methodologically, future studies could explore hybrid modelling approaches that combine machine learning with causal inference frameworks to better distinguish correlation from causation. Deep learning architectures or spatiotemporal models may also offer advantages in capturing complex temporal dynamics, particularly as higher-resolution data becomes available.
Finally, this study's web application represents an initial step toward embedding predictive models into operational early warning systems. Future iterations could incorporate automated data pipelines, real-time alerts for high-risk countries, and integration with existing humanitarian platforms such as FEWS NET or the UN's Global Early Warning System. The current recursive forecasting approach, while effective for short-term projection, could also be improved through ensemble methods or uncertainty quantification to communicate prediction confidence intervals alongside point estimates.
Conclusion
5 Conclusion:
This study demonstrates that child stunting across Sub-Saharan Africa is highly predictable using routinely available national data and that its strongest drivers extend well beyond food production alone. Machine learning models achieved consistently high performance in both nowcasting and forecasting, underscoring the slow-moving, cumulative nature of chronic malnutrition and the value of incorporating lagged socioeconomic, agricultural, and environmental conditions. Socioeconomic and infrastructural factors, particularly GDP per capita, access to clean water and sanitation, and political stability, emerged as the most influential predictors of stunting. Among agricultural variables, wheat-related features showed consistently higher importance than other staple crops, suggesting that the stability and resilience of nutritionally dense staples play a more meaningful role than overall crop output. Together, these findings reinforce the need to combine food-centred strategies with integrated, data-driven approaches that prioritize structural living conditions and resilient food systems to more effectively reduce child malnutrition. To support knowledge translation, a publicly accessible web application was developed to enable policy-makers to explore these findings interactively at the country level.
6 Appendix A:
Table A-1: List of Current, Lag1, and Lag2 features used when predicting stunting
| Current | Lag 1 | Lag 2 | Explanation |
|---|---|---|---|
| cassava_area | cassava_area_lag1 | cassava_area_lag2 | Data refers to the area from which a crop is gathered. Area harvested, therefore, excludes the area from which, although sown or planted, there was no harvest due to damage, failure, etc. (in hectares. |
| cassava_production | cassava_production_lag1 | cassava_production_lag2 | Amount produced in the year (in tonnes) |
| cassava_yield | cassava_yield_lag1 | cassava_yield_lag2 | Measured in Kilograms per hectare |
| cassava_volatility | cassava_volatility_lag1 | cassava_volatility_lag2 | Measures how unstable cassava production has been recently using a 3-year standard deviation. Higher values = more unpredictable harvests, which could signal climate impacts or other disruptions. |
| maize_area | maize_area_lag1 | maize_area_lag2 | Data refers to the area from which a crop is gathered. Area harvested, therefore, excludes the area from which, although sown or planted, there was no harvest due to damage, failure, etc. (in hectares. |
| maize_production | maize_production_lag1 | maize_production_lag2 | Amount produced in the year (in tons) |
| maize_yield | maize_yield_lag1 | maize_yield_lag2 | Measured in Kilograms per hectare |
| maize_volatility | maize_volatility_lag1 | maize_volatility_lag2 | Measures how unstable maize production has been recently using a 3-year standard deviation. Higher values = more unpredictable harvests, which could signal climate impacts or other disruptions. |
| rice_area | rice_area_lag1 | rice_area_lag2 | Data refers to the area from which a crop is gathered. Area harvested, therefore, excludes the area from which, although sown or planted, there was no harvest due to damage, failure, etc. (in hectares. |
| rice_production | rice_production_lag1 | rice_production_lag2 | Amount produced in the year (in tons) |
| rice_yield | rice_yield_lag1 | rice_yield_lag2 | Measured in Kilograms per hectare |
| rice_volatility | rice_volatility_lag1 | rice_volatility_lag2 | Measures how unstable rice production has been recently using a 3-year standard deviation. Higher values indicate more unpredictable harvests, which could signal climate impacts or other disruptions. |
| sorghum_area | sorghum_area_lag1 | sorghum_area_lag2 | Data (in hectares)refers to the area from which a crop is gathered. Area harvested, therefore, excludes the area from which, although sown or planted, there was no harvest due to damage, failure, etc. |
| sorghum_production | sorghum_production_lag1 | sorghum_production_lag2 | Amount produced in the year (in tons) |
| sorghum_yield | sorghum_yield_lag1 | sorghum_yield_lag2 | Measured in Kilograms per hectare |
| sorghum_volatility | sorghum_volatility_lag1 | sorghum_volatility_lag2 | Measures how unstable sorghum production has been recently using a 3-year standard deviation. Higher values indicate more unpredictable harvests, which could signal climate impacts or other disruptions. |
| wheat_area | wheat_area_lag1 | wheat_area_lag2 | Data (in hectares) refers to the area from which a crop is gathered. Area harvested, therefore, excludes the area from which, although sown or planted, there was no harvest due to damage, failure, etc. |
| wheat_production | wheat_production_lag1 | wheat_production_lag2 | Amount produced in the year (in tons) |
| wheat_yield | wheat_yield_lag1 | wheat_yield_lag2 | Measured in Kilograms per hectare |
| wheat_volatility | wheat_volatility_lag1 | wheat_volatility_lag2 | Measures how unstable wheat production has been recently using a 3-year standard deviation. Higher values indicate more unpredictable harvests, which could signal climate impacts or other disruptions. |
| yams_area | yams_area_lag1 | yams_area_lag2 | Data (in hectares) refers to the area from which a crop is gathered. Area harvested, therefore, excludes the area from which, although sown or planted, there was no harvest due to damage, failure, etc. |
| yams_production | yams_production_lag1 | yams_production_lag2 | Amount produced in the year (in tons) |
| yams_yield | yams_yield_lag1 | yams_yield_lag2 | Measured in Kilograms per hectare |
| yams_volatility | yams_volatility_lag1 | yams_volatility_lag2 | Measures how unstable yam production has been recently using a 3-year standard deviation. Higher values indicate more unpredictable harvests, which could signal climate impacts or other disruptions. |
| gdp_per_capita | gdp_per_capita_lag1 | gdp_per_capita_lag2 | Gross domestic product per capita based on purchasing power parity (constant 2021 international $) |
| water_access | water_access_lag1 | water_access_lag2 | Percentage of population using at least basic drinking water services (percent) |
| sanitation_access | sanitation_access_lag1 | sanitation_access_lag2 | Percentage of population using at least basic sanitation services (percent) |
| political_stability | political_stability_lag1 | political_stability_lag2 | Political stability and absence of violence/terrorism (index) |
| temperature | temperature_lag1 | temperature_lag2 | Average mean surface air temperature |
| precipitation | precipitation_lag1 | precipitation_lag2 | Annually aggregated accumulated precipitation in mm |
| Country | Constant Feature | Constant Feature | Country |
| Year | Constant Feature | Constant Feature | Year |
| ccri_score | Constant Feature | Constant Feature | Exposure to shocks & stressors + child vulnerability score |
Citations
7 Citations:
[1] World Health Organization. Hunger numbers stubbornly high for three consecutive years as global crises deepen: Un report. https://www.who.int/news/item/24-0 7-2024-hunger-numbers-stubbornly-h igh-for-three-consecutive-years-a s-global-crises-deepen--un-report, 2024. [Internet; cited 2025-11-09] WHO news item.
[2] World Health Organization. Malnutrition in children. https://www.who.int/data /nutrition/nlis/info/malnutrition-i n-children, 2018. [Internet; cited 2025- 11-09].
[3] Roseline Remans, Paul M. Pronyk, Jessica C. Fanzo, Jing Chen, Cynthia A. Palm, Brian Nemser, et al. Multisector intervention to accelerate reductions in child stunting: an observational study from 9 subsaharan african countries. American Journal of Clinical Nutrition, 94(6):1632–1642, 2011.
[4] Roshan Asirvatham, Samuel M. Demi, and Obidimma Ezezika. Are sub-saharan african national food and agriculture policies nutrition-sensitive? a case study of ethiopia, ghana, malawi, nigeria, and south africa. Agriculture and Food Security, 11(1), 2023.
[5] Rediet M. Anteneh, Nigussie Moges, Alemayehu A. Gebeyehu, Dagnew T. Anley, Endashaw S. Chanie, Sewunet S. Tsega, et al. Wealth-related inequalities in undernutrition among under-five children in sub-saharan africa. Scientific Reports, 15(1):19010, 2025.
[6] Emma Phillips, Sarah Zobrist, Emma M. Milner, Joseph K. Kung’u, Rebecca A. Heidkamp, and Rachael K. Benedict. Nutrition intervention coverage and inequities along the continuum of care: results from the eighth demographic and health survey in six sub-saharan african countries. Maternal and Child Nutrition, page e70085, 2025.
[7] Hrishikesh V. Harkare, Daniel J. Corsi, Ritam Kim, Sebastian Vollmer, and S. V. Subramanian. The impact of improved data quality on the prevalence estimates of anthropometric measures using dhs datasets in india. Scientific Reports, 11(1):10671, 2021.
[8] Becky Wahl, Gautam I. Menon, Kevin Nyhan, Yukun Ren, Ana L. Coria, Bhramar Mukherjee, et al. Global health data precarity: Safeguarding the demographic and health survey program as a global public good. Scientific Data, 12(1):1827, 2025.
[9] Ziad Obermeyer and Ezekiel J. Emanuel. Predicting the future — big data, machine learning, and clinical medicine. New England Journal of Medicine, 375(13):1216– 1219, 2016.
[10] Hu Shen, Hai Zhao, and Yan Jiang. Machine learning algorithms for predicting stunting among under-five children in papua new guinea. Children, 10(10):1638, 2023.
[11] Benjohnson. Unicef-who-the world bank: Joint child malnutrition estimates (jme) — levels and trends — 2025 edition. https: //data.unicef.org/resources/jme/, 2025. [Internet] UNICEF Data.
[12] UNICEF. Children’s climate and environment risk index (ccri). https://knowledg e.unicef.org/CEED/resource/childre ns-climate-and-environment-risk-ind ex-ccri. [Internet].
[13] Food and Agriculture Organization of the United Nations. Faostat. https://www.fa o.org/faostat/en/#data. [Internet].
[14] World Bank. Download data | climate change knowledge portal. https://clim ateknowledgeportal.worldbank.org/d ownload-data. [Internet].
[15] Saad Alam, Muhammad Saqib Ayub, Shubham Arora, and Muhammad Asif Khan. An investigation of the imputation techniques for missing values in ordinal data enhancing clustering and classification analysis validity. Decision Analytics Journal, 9:100341, 2023.
[16] Pattanee Winichagoon and Barrie M. Margetts. The double burden of malnutrition in low- and middle-income countries. In Energy Balance and Obesity. NCBI Bookshelf, 2017.
[17] Akhtar Ali Karim, Edmon Pardede, and Stephen Mann. A model selection approach for time series forecasting: Incorporating google trends data in australian macro indicators. Entropy, 25(8):1144, 2023.
[18] Leo Breiman. Random forests. Machine Learning, 45(1):5–32, 2001.
[19] Naomi S. Altman. An introduction to kernel and nearest-neighbor nonparametric regression. The American Statistician, 46(3):175, 1992.
[20] F. Pedregosa, G. Varoquaux, A. Gramfort, V. Michel, B. Thirion, O. Grisel, M. Blondel, P. Prettenhofer, R. Weiss, V. Dubourg, J. Vanderplas, A. Passos, D. Cournapeau, M. Brucher, M. Perrot, and E. Duchesnay. Scikit-learn: Machine learning in Python. Journal of Machine Learning Research, 12:2825–2830, 2011.
[21] Davide Chicco, Matthijs J. Warrens, and Giuseppe Jurman. The coefficient of determination r-squared is more informative than smape, mae, mape, mse and rmse in regression analysis evaluation. PeerJ Computer Science, 7(5):e623, 2021.
[22] Cort J. Willmott and Kenji Matsuura. Advantages of the mean absolute error (mae) over the root mean square error (rmse) in assessing average model performance. Climate Research, 30:79–82, 2005.
[23] L.J. Herrera, H. Pomares, I. Rojas, A. Guillén, A. Prieto, O. Valenzuela. "Recursive prediction for long term time series forecasting using advanced models". Neurocomputing 2007; 70(16):2870-2880.
[24] Cesar G. Victora, Linda Adair, Caroline Fall, Pedro C. Hallal, Reynaldo Martorell, Lynette Richter, et al. Maternal and child undernutrition: consequences for adult health and human capital. The Lancet, 371(9609):340–357, 2008.
[25] Matteo Rolle, Silvia Tamea, Pierluigi Claps, Eya Ayari, Nicolas Baghdadi, and Mehrez Zribi. Analysis of maize sowing periods and cycle phases using sentinel 1&2 data synergy. Remote Sensing, 14(15):3712, 2022.
[26] Fathan I. Ginting, Roni Rudiyanto, Nabil Fatchurrachman, Rahman M. Shah, Nelson C. Soh, Samuel G. E. Giap, et al. High-resolution maps of rice cropping intensity across southeast asia. Scientific Data, 12(1):1408, 2025.
[27] Kingsley O. Dankwa, Winnie Gimode, and Busayo Olasanmi. A review of global cassava (manihot esculenta crantz) production trends, post-harvest physiological deterioration (ppd) challenge, and control strategies. Discover Food, 5(1), 2025.
[28] Abay W. Borku, Tesfaye T. Tora, and Mebratu Masha. Cassava in focus: A comprehensive literature review, its production, processing landscape, and multidimensional benefits to society. Food Chemistry Advances, 7:100945, 2025.
Acknowledgement
8 Acknowledgements
We would like to thank supervisor Catherine Trainor for her guidance and support throughout this project, as well as the Food and Agriculture Organization (FAO), UNICEF, and the World Bank for making their datasets publicly accessible, without which this research would not have been possible. We are also grateful to Dr. Lauren DeDieu (Department of Mathematics and Statistics, University of Calgary) for her guidance on communicating the mathematical foundations of machine learning models clearly and accessibly, which shaped how we approached presenting our methodology to a broader audience, and to Dr. Jonathan Hudson (Department of Computer Science, University of Calgary) and Dr. Chel Hee Lee (Department of Mathematics and Statistics, University of Calgary) for their feedback on our machine learning methodology and data engineering approach. Finally, we would like to acknowledge the resources provided by the STEM Fellowship.