Analyzing the Effects of Temperature, pH and Inhibitors on Catalase Activity and Stability for Food Preservation and Industrial Applications
Aydin Seifi
Tom Baines School
Grade 9
Presentation
No video provided
Hypothesis
Catalase is an enzyme which catalyzes the decomposition of hydrogen peroxide (H2O2) into oxygen and water (O2 + H2O). Its catalytic efficiency is highly dependent on the tertiary structure of the protein, and the overall productivity of the enzyme is greatly affected by factors such as temperature, pH, and the presence of natural inhibitors in the reaction, or the area to which an enzyme is added to increase the rate of reaction through substrate binding. Substrate binding is the process by which a reactant molecule binds to an enzyme, forming an enzyme-substrate complex. Then, the enzyme lowers the activation energy required for the reaction to occur by aligning the molecular bonds in the correct orientation, creating a favourable environment for the given reaction, which in this case is 2H2O2 ⇒ 2H2O + O2, the decomposition of hydrogen peroxide.
Considering that catalase is found in almost all living organisms that are exposed to oxygen, a base that can be used for my hypothesis is that the optimal conditions would be a range of the conditions similar to the state of the human body and animals with varying body temperatures, and pH levels in areas of the body where catalase functions most, namely red blood cells and the liver. I hypothesize that if the temperature of our enzyme source, which is sweet potato extract, is increased or decreased above or below a range of 34ºC to 40ºC, inclusive, meaning 3ºC subtracted or added to the regular human body temperature of 37ºC, the enzyme will proceed to denature. Taking into account the range of endotherms with varying body temperatures, spanning from 36ºC to 40ºC, this is the most feasible prediction as to what will occur in the experiment, because the optimal temperature of the environment where this particular enzyme, catalase, is used is indeed in the human body, but it is also crucial in nearly all organisms which are exposed to oxygen. Furthermore, it is of utmost importance that the protein does not denature, so that the enzyme-substrate complex can be formed adequately. Additionally, if the pH level is increased or decreased from a neutral pH of 7, I believe that the enzyme will proceed to denature, as the acidic or basic solution will cause the specific, folded protein structure to come undone when exposed to the acid, due to the natural environment of catalase in the human body, in the kidneys and red blood cells, which both usually have pH levels of around 7.2. Therefore, I predict that the enzyme will perform best at pH levels in the range 6 - 8, and that the catalase will denature if the pH level exceeds or subceeds this range. Lastly, the presence of natural inhibitors, our third manipulative variable, must be taken into account. Enzyme inhibitors work by binding to either the active site of the enzyme, thereby preventing the reactants from binding, or by binding to another site, thereby blocking catalysis. This process can either be reversible or irreversible. I believe that the presence of natural inhibitors will cause the proteins to denature, more so in trials where the concentration of the natural inhibitors is increased.
Research
Overview of Proteins
Enzymes are a specific type of macromolecule, known as proteins, that act as biological catalysts, meaning they accelerate essential chemical reactions in living organisms. Proteins are abundant and diverse, present in all cells and their components, as they are vital for numerous functions. Proteins are polymers composed of amino acids, which compose the specific folded shape that defines the function of the protein, as the shape is critical to its function. Protein structure can be described in four different levels: primary, secondary, tertiary, and quaternary structure, with catalase activity mainly relying on its quaternary structure. Amino acids are connected through peptide bonds. When these bonds break, the protein's shape is altered, rendering the entire protein non-functional, in a process known as denaturation. Although proteins exhibit extreme diversity, they are primarily composed of a class of 20 common amino acids. The sequence of amino acids dictates the folding and function of proteins; in this situation, enzymes form the basis for their catalytic properties.
Amino Acids
Amino acids are the monomers that compose proteins. Amino acids are linked together through peptide bonds. Proteins consist of one or more polypeptides, which are linear chains of amino acids linked together in a specific order. Specifically, the properties and order of the amino acids are key in determining the function of the protein they are part of, since the order of the amino acids in the polypeptide chain directly affects the specific three-dimensional folded shape of the protein. Therefore, proper folding of the amino acids is crucial to the human body. A fact that can represent this claim is "Proteins make up 50% - 60% of the dry weight of a cell" (Proteins: Structure and Function by David Whitford).
Amino acids have the same general structure, which consists of a singular carbon atom in the center of the molecule, known as the alpha, or *a-*carbon. This atom is connected to four main groups: the amino group, the carboxyl group, a hydrogen atom, and the R group or side chain. Their unique R group varies the amino acids; each of the 20 amino acids has a different R group, and it is the only variable throughout the amino acids, hence it results in the unique properties, size, and charge of amino acids. Depending on the hydrophilic or hydrophobic properties of the amino acids, determined by the R group, proteins fold. Amino acid R groups are significant to this project because they determine the structure and stability of catalase, and its ability to decompose hydrogen peroxide. Changes in temperature, pH, and the presence of inhibitors could alter the specific interactions of the R group, meaning the chemical bonds and forces maintaining the specific tertiary structure of the protein. The structure of the protein is necessary for its function, especially in an enzyme, as the folding of the amino acids results in the formation of the active site.
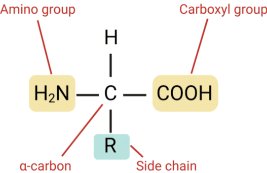 (Wang, Y., PhD.) (2021, September 14). Structure of an amino acid. Rapid Novor. https://www.rapidnovor.com/structure-of-an-amino-acid/)
Denaturation
Denaturation occurs when a protein loses its natural, folded structure, preventing the enzyme's active site from functioning and thereby reducing enzyme activity. However, the sequence of amino acids remains the same. Denaturation can be reversible, in that when the denaturating agent is removed, the protein can refold, or irreversible denaturation, which results in the permanent loss of protein structure and function, possibly in part due to the aggregation of denatured proteins, meaning when unfolded, misfolded or denatured, driven by hydrophobic regions seeking to minimize contact with water, hence insoluble and non-functional masses of proteins are formed.
Changes in environmental conditions, such as temperature, pH, or the presence of inhibitors, typically cause denaturation. The temperature of the enzyme increases, resulting in the addition of kinetic forces to the macromolecules; hence, molecular vibration breaks weaker bonds, such as hydrogen bonds, which occur when one molecule's proton is attracted to another molecule's negatively charged atom. Denaturation caused by heat, if it is mild and removed quickly, can be reversible, but it is often irreversible under higher temperatures, such as when cooking foods. Denatured enzymes are easier to digest.
Another common cause of denaturation is changes in pH. When proteins are exposed to acidic conditions, they are essentially flooded with protons, causing the strong ionic bonds and attractive forces within the protein to become imbalanced, resulting in protein denaturation. An exception to this may be pepsin, an enzyme which is predominantly present in the stomach, where extremely low pH conditions are present. Pepsin is structurally stable at low pH levels, and it is only activated when it comes into contact with stomach acid. Paradoxically, this enzyme denatures and becomes inactive at neutral pH levels, again due to the charges becoming unbalanced. Denaturation caused by pH may be reversible at less extreme pH levels, and differences from their optimal pH, yet more extreme pH levels almost always cause irreversible denaturation.
Natural Enzyme Inhibitors don't usually denature a protein. Still, they bind to the active site, sometimes altering the protein's shape, but do not permanently affect the protein's structure, meaning they only bind to the active site of the enzyme or another location, changing the enzyme's shape and thereby preventing the substrate from entering the active site. Certain chemicals, such as urea or guanidine, can cause denaturation by disrupting hydrogen bonding, leading to the denaturation of proteins.
Enzymes
Enzymes are proteins that act as biological catalysts, relying on their specific structure to lower the activation energy of a reaction without being altered themselves. This could be done through heat, but that would kill the cell. There is a specific region, often a pocket, where the substrate binds. Substrates are the specific molecules that the enzyme acts upon; in the case of catalase, hydrogen peroxide. The presence of enzymes in the human body is necessary because many reactions are essential for survival, such as the digestion of food in the stomach.
The structure of an enzyme is a complex shape that creates an active site, based on its specificity, meaning the reaction that the enzyme usually catalyzes. The enzyme works by binding to the substrate and holding it in a way that facilitates the reaction, in the case of catalase, the chemical bond breaking of hydrogen peroxide, to occur more readily. In other words, the substrate molecule is brought together in the perfect orientation, straining its bonds, causing the reaction to occur with less required energy. When the substrate is actively bound to the active site, it forms a temporary structure known as the enzyme-substrate complex. Two primary models describe the enzyme-substrate complex and the substrate binding process: the lock-and-key model and the induced-fit model. The lock and key model suggests a rigid enzyme active site, which perfectly matches the substrate. In contrast, the induced fit model proposes a more flexible active site that changes slightly when binding to a substrate to better accommodate it, better explaining the flexibility of enzymes. The induced fit model is a refinement of the older lock and key model, and it is more widely accepted. After products leave the enzyme, it may be reused again, under the induced fit model, slightly changing for the next substrate molecule.
To measure enzyme activity in the experiment trials, we must quantify the effectiveness of the catalase by identifying the amount of product generated. The products in our experiment are water and oxygen, which can be used to determine enzyme activity. The efficiency of enzymes can be measured through their turnover rate, which indicates the number of substrate molecules an enzyme converts into product per second. In this investigation, enzyme activity is measured as the rate of oxygen production, while temperature, pH, and inhibitor presence act as independent variables that affect catalase function
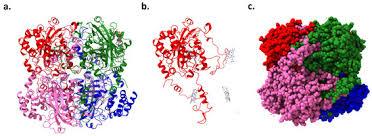
Catalase's function is to break down hydrogen peroxide into water and oxygen. It follows the chemical reaction: 2H2O2 ⇒ (after catalase) 2H2O + O2. It has one of the highest turnover rates of any enzyme, with reported turnover rates of 40 million reactions per second by various sources. Catalase is a tetramer, made of four protein chains each containing a heme group with an iron atom at the center that acts as the physical tool to break apart hydrogen peroxide. Although enzyme activity is measured by turnover rates, in this experiment, we indirectly estimate the catalase activity by measuring oxygen production over time. Catalase has industrial applications in the food and textile industry, being used to remove hydrogen peroxide from fabrics and milk before cheese production. Catalase is highly concentrated in the peroxisomes of the liver, kidneys, and erythrocytes. Catalase is mainly found here because these tissues are key sites of high metabolic activity and oxygen transportation throughout the body, which constantly generate hydrogen peroxide as a harmful byproduct. Catalase rapidly decomposes the hydrogen peroxide to prevent harm to these tissues. Common inhibitors of catalase include cyanide or sodium azide, cyanide being found in fruit pits and seeds, while sodium azide is found in at-home disease testing kits and car airbags, but it is mainly used in laboratories. Ethanol is the inhibitor being used in this experiment, and it is a common inhibitor of catalase used as a biofuel and disinfectant. It is derived from corn or sugarcane in a fermentation process.
The activity of enzymes is greatly affected by factors such as temperature, pH, and the presence of inhibitors. Reactions have optimal temperatures and pH levels in which the enzyme functions best. The enzyme will still function at conditions mildly outside this range, but the rate of reaction will be decreased. As the temperature of a reaction increases, the rate of reaction also gradually increases until a certain point, then it drops sharply due to the denaturation of the enzyme. Therefore, the highest temperature achieved without the enzyme denaturing becomes the optimal temperature. Similarly, enzymes also have optimal pH levels, primarily determined by the role of the enzyme and its location within the human body. An example of this could be pepsin, an enzyme that is mainly located in the stomach, hence it has an optimal pH of about 1.5. At conditions outside the optimal range, the protein will denature. The concentration of substrate and enzyme molecules also affects the rate of the reaction. When there are more substrate molecules, the rate of enzyme activity increases, due to more collisions with enzyme active sites, more enzyme-substrate complexes are formed, and therefore, the rate of the reaction also increases. It is important to keep in mind that this is true up to a certain point, due to the limited number of enzymes to interact with the increased number of substrate molecules. When the enzyme concentration is increased, the rate of the chemical reaction increases due to the availability of more enzyme molecules to catalyze the reaction. Lastly, the presence of inhibitors must be taken into account. There are two types of inhibitors, varying in their method of inhibition. Competitive inhibitors compete with substrate molecules for binding to the active site, thereby preventing substrate molecules from binding. Noncompetitive inhibitors, also known as allosteric inhibitors, bind to another site on the enzyme known as allosteric sites. By doing so, they alter the shape of the enzyme and its active site, preventing the substrate from binding to the enzyme. For this reason, when inhibitors are increased in a reaction, the rate of reaction decreases due to decreased enzyme activity as a result of the resistance by inhibitory substances. The inhibitor being used in this experiment is ethanol, which is a noncompetitive inhibitor.
Variables
Independent/Manipulated Variables
The independent variable in our experiment will be the temperature, pH level, and presence of ethanol as our enzyme inhibitor. These variables were deliberately changed to observe their effect on catalase activity.
Responding/Dependent Variable
The responding variable from our trials will be catalase activity, measured by the production of oxygen as a product of the decomposition of 2H2O2 ⇒ 2H2O + O2. This amount is represented by the amount of foam produced by the reaction. Soap is added as a surfactant, a liquid that reduces the surface tension of another liquid, in this case, water. This allows the water to stretch and trap the rising oxygen, which forms stable bubbles which accumulate as foam. The amount of foam produced is directly proportional to the amount of oxygen produced.
Controlled Variables
To ensure that the outcomes were a result of the manipulation of our independent variables, the following factors are kept constant.
- Source of catalase (sweet potato extract for all trials)
- Mass of catalase used
- Method of catalase extraction
- Type and amount of Surfactant
- Reaction Container shape and size
- Time intervals at which foam levels are recorded
- Ambient Temperature
- The speed of the addition of the reactant (stable)
- Concentration of substrate (hydrogen peroxide)
- Volume of substrate
Procedure
- Gather required materials to experiment:
- 5 sweet potatoes: 650g-750g
- Blender
- 3% hydrogen peroxide: 400.0 mL
- Distilled water: 1.5 litres
- Scale
- Filter Paper
- Liquid Soap (as Surfactant): 3 drops per test tube
- Ethanol: 100.0 mL
- pH buffers for pH values 4, 7, 10: 120.0 mL of each
- Identical Reaction Containers (100.0 mL, graduated cylinder)
- Thermometer
- 3 Water baths of temperatures 14, 37, and 60 degrees Celsius
- Stopwatch
- Ruler
- Camera
- Safety Goggles and Gloves
- Pipettes
- Peel and cut Sweet Potatoes to a mass of 400.0 grams.
- Blend 400 grams of the mass achieved above with 400.0 mL of distilled water for exactly 30 seconds.
- Filter this mixture through filter paper once.
- Keep the outcome refrigerated as the master enzyme stock. This is done for uniformity of the catalase source, ensuring accuracy.
- Label reaction containers according to temperature, pH, ethanol treatment, or control (Ensure all containers are the same shape and size).
- Place the calculated amounts of hydrogen peroxide for each temperature level into the corresponding water baths to heat or cool to the desired temperature.
- Pipette 10.0 mL of the master stock, three drops of liquid soap, 10.0 mL of pH buffer or ethanol (if applicable) and 10.0 mL of distilled water into the reaction cylinder.
- Measure exactly 10.0 mL of 3% hydrogen peroxide into a separate, clean test tube to keep the substrate isolated during the heating process (temperature as manipulated variable test).
- Submerge both the reaction cylinder and the substrate test tube in the designated water bath for 10 minutes to achieve thermal equilibrium. (temperature as a manipulated variable test).
- Pour the pre-heated hydrogen peroxide into the reaction cylinder to start the enzyme-substrate interaction at the target temperature.
- Start the stopwatch immediately upon contact to record the foam volume at 30, 60, and 300-second intervals for precise data collection. 300 being the final record, and the trial considered finished
- Repeat two more times to guarantee accuracy, yielding 24 tests in total. (1 control, 1 inhibitor, 3 pH, 3 temperature x3)
Observations
Trial 1: Control-1
- Initial Height: 4 cm
- Addition of Hydrogen Peroxide (Substrate)
- Measurements:
- Height after 30 seconds: 11.5 cm
- Height after 60 seconds: 15.6 cm
- Height after 300 seconds: 23.2 cm
- Foam Height (Initial Height - Height after 300 seconds): 19.2 cm
- Observations: Very fine bubble shape, rapid buildup, no odour produced, the orange section at the bottom (the initial height decreased from 4 cm to 3.1 cm)
Trial 2: pH 7-1
- Initial Height: 3.9 cm
- Addition of Hydrogen Peroxide (Substrate)
- Measurements:
- Height after 30 seconds: 10 cm
- Height after 60 seconds: 14.2 cm
- Height after 300 seconds: 23.3 cm
- Foam Height (Initial Height - Height after 300 seconds): 19.4
- Observations: Fine bubbles similar to trial 1, gradual buildup, very similar characteristics to trial 1, possibly due to similar components only differing in water and pH buffer 7.
Trial 3: pH 4-1
- Initial Height: 3.8 cm
- Addition of Hydrogen Peroxide (Substrate)
- Measurements:
- Height after 30 seconds: 7 cm
- Height after 60 seconds: 7.5 cm
- Height after 300 seconds: 9.9 cm
- Foam Height (Initial Height - Height after 300 seconds): 6.1
- Observations: The initial Height increased from 3.8 to 4.9, with a slower buildup of foam
Trial 4: pH 10-1
- Initial Height: 3.9 cm
- Addition of Hydrogen Peroxide (Substrate)
- Measurements:
- Height after 30 seconds: 9.5 cm
- Height after 60 seconds: 10.7 cm
- Height after 300 seconds: 17.4 cm
- Foam Height (Initial Height - Height after 300 seconds): 13.5
- Observations: The foam produced has been similar across all tests. I believe that the characteristics of the foam will be similar across all tests. The foam buildup began faster than in trial 3. The bottom remained at the same volume
Trial 5: Temperature 37-1
- Initial Height: 4 cm
- Addition of Hydrogen Peroxide (Substrate)
- Measurements:
- Height after 30 seconds: 10.3
- Height after 60 seconds: 13
- Height after 300 seconds: 20.5
- Foam Height (Initial Height - Height after 300 seconds): 16.5
- Observations: The bottom remained at the same volume. The foam buildup was aggressive at the start, but then slowed down at about 221 seconds
Trial 6: Temperature 60-1
- Initial Height: 4 cm
- Addition of Hydrogen Peroxide (Substrate)
- Measurements:
- Height after 30 seconds: 11 cm
- Height after 60 seconds: 13 cm
- Height after 300 seconds:19.5 cm
- Foam Height (Initial Height - Height after 300 seconds):15.5
- Observations: Fastest buildup, rapid start, slowed down a lot at the three-minute mark. A potential source of error in this trial was that I accidentally shook the container at the beginning of the trial.
Trial 7: Temperature 14 -1
- Initial Height: 4.1 cm
- Addition of Hydrogen Peroxide (Substrate)
- Measurements:
- Height after 30 seconds: 7.5 cm
- Height after 60 seconds: 9.4 cm
- Height after 300 seconds: 17.3
- Foam Height (Initial Height - Height after 300 seconds): 13.2 cm
- Observations: Slower buildup, more gradual, less rapid than the control
Trial 8: Ethanol Treatment-1
- Initial Height: 3.8 cm
- Addition of Hydrogen Peroxide (Substrate)
- Measurements:
- Height after 30 seconds: 6 cm
- Height after 60 seconds: 6.8 cm
- Height after 300 seconds: 9.5 cm
- Foam Height (Initial Height - Height after 300 seconds): 5.7 cm
- Observations: Very slow to start foaming, foam starts increasing at 58 seconds.
Trial 9: Control-2
- Initial Height: 3.9 cm
- Addition of Hydrogen Peroxide (Substrate)
- Measurements:
- Height after 30 seconds: 8.2 cm
- Height after 60 seconds: 10.2 cm
- Height after 300 seconds: 18.4 cm
- Foam Height (Initial Height - Height after 300 seconds): 14.5
- Observations: Quick start, similar to trial 1, foam begins to rise quickly.
Trial 10: pH 7-2
- Initial Height: 3.9 cm
- Addition of Hydrogen Peroxide (Substrate)
- Measurements:
- Height after 30 seconds: 8.8 cm
- Height after 60 seconds: 9.3 cm
- Height after 300 seconds: 18.7 cm
- Foam Height (Initial Height - Height after 300 seconds): 14.8 cm
- Observations: Foaming started more quickly. Some areas in the foam had bubbles that popped at regularly spaced locations, but their sizes varied.
Trial 11: pH 4-2
- Initial Height: 3.8 cm
- Addition of Hydrogen Peroxide (Substrate)
- Measurements:
- Height after 30 seconds: 6.5 cm
- Height after 60 seconds: 6.9 cm
- Height after 300 seconds: 8.5 cm
- Foam Height (Initial Height - Height after 300 seconds): 4.7 cm
- Observations: Very slow to begin building up again, did not have soda-like bubbles rising, unlike the other tests, other than trial 3.
Trial 12: pH 10-2
- Initial Height: 3.9 cm
- Addition of Hydrogen Peroxide (Substrate)
- Measurements:
- Height after 30 seconds: 7.7 cm
- Height after 60 seconds: 9.4 cm
- Height after 300 seconds: 14.5 cm
- Foam Height (Initial Height - Height after 300 seconds): 10.6 cm
- Observations: Less gas rising from the bottom than in trial 13
Trial 13: Temperature 37-2
- Initial Height: 4.1 cm
- Addition of Hydrogen Peroxide (Substrate)
- Measurements:
- Height after 30 seconds: 9 cm
- Height after 60 seconds: 11 cm
- Height after 300 seconds: 18.3 cm
- Foam Height (Initial Height - Height after 300 seconds): 14.2 cm
- Observations: Faster growth than trial 12, seemingly more dense foam from trial 12.
Trial 14: Temperature 60-2
- Initial Height: 3.7 cm
- Addition of Hydrogen Peroxide (Substrate)
- Measurements:
- Height after 30 seconds: 8.9 cm
- Height after 60 seconds: 11.9 cm
- Height after 300 seconds: 16.4 cm
- Foam Height (Initial Height - Height after 300 seconds): 12.7 cm
- Observations: This trial rose much faster than trial 15, but it slowed down at the end and trial 15 continued to rise slightly, closing the gap but still staying below the level of this trial.
Trial 15: Temperature 14-2
- Initial Height: 4.1 cm
- Addition of Hydrogen Peroxide (Substrate)
- Measurements:
- Height after 30 seconds: 7.4 cm
- Height after 60 seconds: 10.7 cm
- Height after 300 seconds: 15.4 cm
- Foam Height (Initial Height - Height after 300 seconds): 11.3 cm
- Observations: Slower buildup than trial 14, similar rate of rising gas at the bottom, kept going when trial 14 slowed down.
Trial 16: Ethanol Treatment-2
- Initial Height: 3.7 cm
- Addition of Hydrogen Peroxide (Substrate)
- Measurements:
- Height after 30 seconds: 6.3 cm
- Height after 60 seconds: 6.6 cm
- Height after 300 seconds: 8.3 cm
- Foam Height (Initial Height - Height after 300 seconds): 4.6
- Observations: Less dense foam, orange section at the bottom rose.
Trial 17: Control-3
- Initial Height: 3.8 cm
- Addition of Hydrogen Peroxide (Substrate)
- Measurements:
- Height after 30 seconds: 7.9 cm
- Height after 60 seconds: 9.4 cm
- Height after 300 seconds: 15.9 cm
- Foam Height (Initial Height - Height after 300 seconds): 12.1 cm
- Observations: Fast start at the beginning, initial Height at the bottom decreased
Trial 18: pH 7-3
- Initial Height: 3.8 cm
- Addition of Hydrogen Peroxide (Substrate)
- Measurements:
- Height after 30 seconds: 7.7 cm
- Height after 60 seconds: 9.4 cm
- Height after 300 seconds: 16.3 cm
- Foam Height (Initial Height - Height after 300 seconds): 12.5 cm
- Observations: Less foam production than trial 17.
Trial 19: pH 4-3
- Initial Height: 3.9 cm
- Addition of Hydrogen Peroxide (Substrate)
- Measurements:
- Height after 30 seconds: 6 cm
- Height after 60 seconds: 6.6 cm
- Height after 300 seconds: 8.2 cm
- Foam Height (Initial Height - Height after 300 seconds): 4.3 cm
- Observations: Similar to the ethanol trials.
Trial 20: pH 10-3
- Initial Height: 3.7 cm
- Addition of Hydrogen Peroxide (Substrate)
- Measurements:
- Height after 30 seconds: 6.4 cm
- Height after 60 seconds: 7.9 cm
- Height after 300 seconds: 11.5 cm
- Foam Height (Initial Height - Height after 300 seconds): 7.8 cm
- Observations: Reacts better than the more acidic pH 4 trials
Trial 21: Temperature 37-3
- Initial Height: 3.8 cm
- Addition of Hydrogen Peroxide (Substrate)
- Measurements:
- Height after 30 seconds: 8.3 cm
- Height after 60 seconds: 10.9 cm
- Height after 300 seconds: 15.5 cm
- Foam Height (Initial Height - Height after 300 seconds): 11.7 cm
- Observations: Similar to control tests.
Trial 22: Temperature 60-3
- Initial Height: 3.7 cm
- Addition of Hydrogen Peroxide (Substrate)
- Measurements:
- Height after 30 seconds: 7 cm
- Height after 60 seconds: 9.1 cm
- Height after 300 seconds: 14.6 cm
- Foam Height (Initial Height - Height after 300 seconds): 10.9 cm
- Observations: More active at the beginning of the trial.
Trial 23: Temperature 14-3
- Initial Height: 3.9 cm
- Addition of Hydrogen Peroxide (Substrate)
- Measurements:
- Height after 30 seconds: 6.6 cm
- Height after 60 seconds: 9.7 cm
- Height after 300 seconds: 15.3 cm
- Foam Height (Initial Height - Height after 300 seconds): 11.4 cm
- Observations: Continues more consistently after trial 22 slows down.
Trial 24: Ethanol Treatment-3
- Initial Height: 3.8 cm
- Addition of Hydrogen Peroxide (Substrate)
- Measurements:
- Height after 30 seconds: 5.5 cm
- Height after 60 seconds: 5.8 cm
- Height after 300 seconds: 7.7 cm
- Foam Height (Initial Height - Height after 300 seconds): 3.9
- Observations: Lower activity
Ambient Temperature: 21.6 degrees Celsius.
Analysis
The following analysis evaluates the catalytic efficiency of catalase under varying environmental conditions, specifically focusing on pH levels and the temperature of the reaction components. The primary function was to observe the rate of decomposition of hydrogen peroxide into water and oxygen gas, represented by the reaction formula: 2H2O2 => 2H2O + O2. In the experiment, the amount of foam produced through the use of a surfactant is used as a proxy for reaction rate under varying conditions. More foam produced represents more oxygen produced, thus a more vigorous reaction. To quantify these results, a "Catalase Activity Index" was calculated; certain measures must be taken for the accuracy of this index. For the accuracy of this index, we can subtract the initial height, which was recorded, from the height after 300 seconds, regarded as the end of the trial, thus representing the amount of foam produced. Finally, this takes the form of: (Height after 300 seconds - Initial height) / 300 seconds (the total time elapsed in the given trial). Lastly, catalase efficiency is higher when fresh, hence this must be kept in mind because the first tests have had fresher catalase rather than those conducted at the end.
Analysis Specific to each Experimental Condition
Controls
The control of an experiment is a crucial part of this experiment, as it will be used for the comparison of other trials as a baseline. Having multiple control trials also allows for the observation of variability between trials, allowing for better judgment of our results. Furthermore, the presence of controls will ensure that the results are not random events. Controls also account for variability in the experiment setup.
Catalase Activity Index
Control 1 = 0.064
Control 2 = 0.048
Control 3 = 0.040
Evidently, the productivity of the catalase gradually decreases; this can likely be attributed to the sweet potato extract performing better when the source was fresh, because of the further stability of the enzyme molecules when recently extracted. Since the trials are listed in chronological order.
Analysis
The observations that were recorded during these tests included some that were common among all tests, such as no odour being produced or the shape of the bubbles, which were common across all tests. A unique observation that was common across all three of the trials was the rapid start that was displayed by the reaction. This is due to the availability of substrate for the enzyme to react with, not hindered by other substances or unfavourable conditions. The water in the control tests does not affect the enzyme structure, and was purely used to level the amount of volume at the beginning of the trial; the conditions can be considered as in the optimal range that was predicted in the hypothesis.

To summarize, the gradual decrease of the foam produced by the reaction can be linked to the freshness of the catalase source, which affects the efficiency of the enzyme. This must be accounted for in the other trials; each round of testing (Control 1 - Ethanol Treatment 1, continuing to rounds 2 and 3 ) can be compared to the control test that was conducted, respectively, to ensure accuracy. The rapid start of the reaction is due to the availability of substrate molecules, not hindered by favourable conditions, and the water used to equalize the initial height does not alter the structure of the catalase in any way.
pH Tests
The following trials were conducted to observe the catalytic efficiency of catalase under varying pH conditions. pH levels of 4 (acidic), 7 (neutral), and 10 (basic) were tested to cover the pH range adequately. The values of 4 and 10 were strategically chosen because their difference is the same as a neutral pH of 7; therefore, we can observe whether catalase prefers an acidic or basic environment.
Catalase Activity Index
pH 7 - 1: 0.064
pH 7 - 2: 0.049
pH 7 - 3: 0.042
pH 4 - 1: 0.020
pH 4 - 2: 0.016
pH 4 - 3: 0.014
pH 10 - 1: 0.045
pH 10 - 2: 0.035
pH 10 - 3: 0.026
We observe the steady decrease in catalase activity because of higher activity when the sweet potato extract was fresh, as observed in the control group.
Analysis
As observed by the index above, the pH tests of level 7 were the most productive, followed by the basic pH 10 tests. The pH 4 level tests yielded very little foam production in comparison to other tests, due to the low pH disturbing their three-dimensional structure and, as a result, not allowing the substrate to bind to the catalase. However, the enzyme only partially denatures; it would not produce any foam because all the enzyme molecules could no longer carry out their function. The pH 10 trials produced more foam than the pH 4 trials; it can be inferred that catalase has a higher catalytic efficiency at moderately basic environments in comparison to acidic environments. This could be due to adaptation to conditions in human physiological conditions, which have a neutral pH or are slightly basic to optimize biological cell processes. Since the greatest amount of foam during the pH tests was produced by the pH 7 trials, we can assume that pH levels above 7 but below ten will still perform adequately, with higher efficiency as the difference between pH 7 decreases.
 As seen above, the tests were very similar, accounting for the decrease in enzyme activity over time, except for an outlier at the 60-second mark, regarding the pH 7 - 2 test, which did not increase in volume at the same rate as other trials, as the third pH 7 test surpassed it in volume. It further increased to above the pH 7 -3 trial, but the difference between the first and second trials is larger than the difference between the second and third trials. This could be a result of a longer wait between trial pH 7 - 1 and trial pH 7 - 2; thus, catalase efficiency decreased more because of the longer period of time. These tests are very similar to the control tests, with minimal difference in between the respective rounds. This is because of the very similar reactants in the trials, the only difference being water and pH buffer 7, which provide similar pH, only differing in buffering capacity (The ability to hold a specific pH level).
 The pH four group resulted in very low foam production, as seen above, with similar trends. The catalase activity was significantly less than that of the pH 7 trials, and the basic environment performed better by a range of 0.012 - 0.025 on the catalase activity index.
 (Note: pH 10 - 1 = Blue, pH 10 - 2 = Red, and pH 10 - 3 = Yellow)
The trends are very similar, and the differences between tests are due to the enzyme degradation over time. The above values are greater than the pH 4 group tests, yet lower than the pH 7 group tests. Catalase's catalytic efficiency is higher at a neutral pH.
Overall, the enzyme's catalytic efficiency was highest at pH 7, followed by the basic pH 10 conditions, in which catalase produced more oxygen, as represented by the amount of foam produced. Using this information, we can infer that catalase's catalytic activity is greater in basic environments as opposed to acidic conditions. It can be assumed that catalase would perform adequately in pH levels from 7 to 10, depending on the significance of the reaction and the needed amount of decomposed substrate. Human cells maintain a neutral to slightly basic pH level; thus, the adaptability of catalase to slightly basic conditions is of utmost importance. Consequences of improper hydrogen peroxide decomposition in cells include oxidative stress, which is the imbalance between harmful chemicals in the human body and their respective antitoxins. At pH 4, foam production was lowest, likely due to the high concentration of hydrogen + ions, which can disturb the necessary bonds for maintaining catalase's specific structure. The pH 7 tests performed very similarly to the control tests because of the similarity of the materials involved in the reaction, only differing in water and pH buffer 7.
Temperature Tests
The following tests were conducted to represent the conditions present in the human body, at 37 degrees, and in environments of 14 degrees and 60 degrees, for their positive difference is equal to the natural human body temperature of 37 (Difference of 23 degrees). The chosen values also represent a vast range of temperatures, allowing for the inference of an optimal range for catalase and an optimal temperature at which its activity is highest without denaturing.
Catalase Activity Index
Temperature 37 -1: 0.055
Temperature 37 -2: 0.047
Temperature 37 -3: 0.039
Temperature 60 -1: 0.052
Temperature 60 -2: 0.042
Temperature 60 -3: 0.036
Temperature 14 -1: 0.044
Temperature 14 -2: 0.038
Temperature 14 -3: 0.038
The decrease in activity in the 14° tests was lower, and the second and third tests were the same. Catalase is stabilized by cold temperature, which is seen in our results, because the effects of denaturation of the enzyme would yield results similar to the pH four tests. Despite this, the outcome is lower foam produced, likely due to the lowered kinetic energy at the cold temperature. The reason the last two tests are the same could be because of the stabilization provided by the cold water, which could oppose the degradation of the enzyme over time.
Analysis
 This graph displays a rapid start during the time intervals of 30 to 60 seconds, but the increase is lower during the longer time period between the 60-second and 300-second intervals. This could be because of the rapid start, fewer hydrogen molecules are left as substrate in the experiment after a point, or it could be a result of increased vibration caused by the highly exothermic reaction, causing denaturation in the protein.
 As shown above, this series of trials had a slower start than the tests at 37°. This could be due to partial denaturation of the enzyme due to the higher heat levels.
 In this test group, there is a significantly smaller difference between the tests due to the enzyme stabilization provided by the cold temperature. This characteristic of the enzyme may have industrial applications in that the enzyme is more stable at lower temperatures and degrades less; thus, storage should be at lower temperatures.
Ultimately, in the trials in which temperature was a manipulated variable, catalase's catalytic activity was highest at 37°C and lowest at the heat level of 14°C. However, while other trials observed large declines in enzyme activity after the first trial, in the trials where the conditions were maintained at 14°C, the catalase underwent significantly less degradation. This is due to the stability provided by lower temperatures (to a point), through the lowered kinetic energy in such conditions, thus there is less molecular motion and a lower chance of the enzyme structurally denaturing. Based on this observation, we infer that catalase should be stored at lower temperatures for the catalytic potential to remain at its highest. The tests at 37°C yielded higher foam production than those at 60°C, likely due to partial denaturation caused by the increased heat energy. Through this, we can deduce that the temperature of 60°C is greater than the optimal temperature of the enzyme because the catalase produced more foam at lower conditions. A rapid start was documented in the trials, at which the temperature was equal to the human body temperature of 37°C. This could be because of the adaptation to this temperature, similar to how other enzymes, such as pepsin, are adapted to lower pH levels. The process of adjustment to perform best at this pH is known as molecular evolution, a lengthy process that has been ongoing since catalase existed, thus when the first oxygen-consuming organisms lived.
Ethanol Tests
Ethanol is a non-competitive inhibitor of catalase that is often used to study catalase by reducing its activity. In the tests below, ethanol is added to observe its effect on the activity of catalase, and particularly the start of the reaction, for it is the most crucial time period of the reaction, because it is at that time that the catalase activity is highest.
Catalase Activity Index
Ethanol Treatment - 1: 0.019
Ethanol Treatment - 2: 0.015
Ethanol Treatment - 3: 0.013
The decrease in activity between trials is significantly less drastic, possibly because of the inhibition of the enzyme, resulting in a lower amount of enzyme to decline.
 The difference between the three tests decreased in comparison to the control tests. This could be due to the inhibitor reducing the amount of functional catalase, thus the effect of enzyme degradation over time is less pronounced. The first trial observed a lower height at the time interval of 30 seconds.
The catalysis rate of the enzyme dropped as expected, yet the difference between the trials was less noticeable, due to the lowered amount of total enzyme. Ethanol could be used to inhibit catalase in instances where the reaction is out of control. Despite this, although the speed of the foam production decreased, I predict that the enzyme will continue to function because of the limited amount of inhibitor. This could mean that a lower concentration of the enzyme could yield similar results, only in a longer period of time. The significance of this observation is the lower cost to companies that use enzymes, such as those in the dairy or textile industries. Hydrogen peroxide is added to dairy products to limit bacterial growth and to preserve the given product.
Synthesis of Catalytic Trends
This investigation confirms that the catalytic activity of sweet potato catalase is highly dependent on its environment. The rate of catalysis of catalase decreases over time, due to the further stability of enzyme molecules when recently extracted. The optimal pH conditions of the pH trials were at pH 7, followed by the basic pH 10 conditions. Catalase's activity is higher in basic conditions rather than acidic environments. It can be assumed that catalase would perform adequately from pH 7 to pH 10. In the temperature trials, catalase's catalytic activity was highest at 37°C, and lowest at 14°C. Despite this, the declines in foam production due to enzyme degradation over time were lower in the 14°C trials as a result of the stability provided by lower temperatures to the tetramer structure of catalase. The tests at 37°C provided greater oxygen production than that of 60°C, possibly because of the partial denaturation of the enzyme. It can be inferred that 60°C exceeds the optimal temperature of catalase. Catalase's optimal conditions, according to this experiment, are pH 7 and 37°C, which are similar to the conditions of the human body. This could be a result of adaptation to this environment through a process of molecular evolution. The activity of the enzyme, when inhibited or at lower concentrations, is decreased, but the results could be the same; only tests with a lower concentration of enzyme would require an increased period of time to finish. This could pose a lower cost to companies that rely heavily on this enzyme, such as those in the dairy or textile industry. Catalase performs best in conditions similar to the human body as a result of a lengthy process of molecular evolution.
Conclusion
The primary objective of this experiment was to investigate the environmental effects of varying pH levels, thermal energy, and the presence of inhibitors on the catalytic activity of catalase. The enzyme was obtained through the extraction of the protein from sweet potatoes. The product is comparable to catalase in the human body. To get a proxy of the rate of catalysis, a surfactant was added, thus producing foam. A greater amount of foam produced represents a higher rate of hydrogen peroxide decomposition, as oxygen is a byproduct of this reaction. A total of 24 trials were conducted, comprising one control test, pH tests at levels 4, 7, and 10, temperature tests at 14°C, 37°C, and 60°C, and one trial with ethanol treatment as the enzyme inhibitor. This group of trials were repeated thrice to ensure the accuracy of the results. The values of the manipulated variables were systematically chosen; In the temperature trials, 37°C was chosen to represent the amount of heat energy in the human body, and the two values have equal differences from this amount to allow for comparison of the trials. pH 7 was selected because it is neutral on the pH scale, and the alternative environments also had equal differences from the neutral pH of seven.
Overall, catalase's catalytic activity was highest at pH 7 and 37°C. These conditions are similar to those of human physiology. The pH 10 tests yielded higher foam production than the pH 4 trials; therefore, catalase performs more efficiently in basic environments compared to acidic conditions. These observations correlate with the physiological state of the human body. The human body generally maintains a neutral to slightly basic pH, hence the results match up. The data indicated that catalase has adapted to conditions in the human anatomy. This is likely a result of molecular evolution, which is the change in DNA, RNA, and proteins over time through genetic drift and advantageous mutations. Returning to my hypothesis, I predicted that the optimal range of pH and temperature would be similar to that in the human body. This hypothesis was true as the enzyme performed best at pH 7 and 37°C. The degradation of the catalase over time was less pronounced in the 14°C trials. This is due to the stability provided to the tetramer structure of catalase at lower temperatures. Molecular kinetic energy is lowered as temperatures decrease, reducing the chance of denaturation. Therefore, the storage of catalase should be at lower temperatures, but above temperatures, causing denaturation. The addition of ethanol resulted in lower activity in the reaction. However, despite this, I predict that the result could be similar, only requiring a longer period of time. This could pose a lower cost to companies that use catalase, such as those in the dairy or textile industries. Ultimately, this experiment shows that catalase is adapted to human physiological conditions, operating best at neutral pH and human body temperature, and our trials reveal that lower temperatures stabilize catalase structure.
Discrepancies between the expected and observed results were mainly due to the gradual loss of enzyme activity over time. This is clearly seen in the difference in activity between repeated identical tests, but must also be accounted for as the trials continued. This could result in slightly less accurate answers, despite the comparison of trials with the respective rounds. Furthermore, this has applications in that the catalytic activity of sweet potato decreases over time. Lastly, sweet potato catalase is not identical to catalase found in the human body; results must be used cautiously to directly relate to processes in the human physiological system.
This experiment demonstrated that the catalytic activity of catalase is highly dependent on the present environmental conditions. Catalase performed best at 37°C and pH 7, which are the conditions in the human body. This is likely a result of molecular evolution. Lower temperatures stabilize the structure of catalase, as observed by the reduced enzyme degradation over time in the 14°C tests. Further areas of research could include the observation of catalase activity in conditions that do not separate conditions for increased accuracy and real-world application. Those who look to repeat or follow up on this study could look to systematically extract fresh batches of catalase to prevent the enzyme from degrading and allow for more precise comparison of results. Ultimately, this experiment demonstrates that the catalytic activity of sweet potato catalase is highly sensitive to environmental conditions, performing optimally at pH 7 and 37°C, which closely mirrors the physiological conditions of the human body.
Application
This study investigates the environmental thresholds of catalase activity, using sweet potato extract to demonstrate how human physiological conditions optimize biocatalytic efficiency. Applications from project results can be implemented in fields such as biochemistry and in industries which rely heavily on this enzyme, including textile industries and dairy production. In these fields, catalase is used to remove hydrogen peroxide from products, such as textiles or cheese. It is also used to prevent browning as hydrogen peroxide is a main cause of produce darkening. The data indicate that catalase degraded less rapidly when exposed to lower heat energy. This is due to the stabilization of the tetramer structure of the enzyme at lower temperatures. Therefore, the optimal temperatures for storing catalase are lower, until denaturation does not occur. However, before a reaction occurs, the temperature of the reactants and the enzyme must be increased to allow for increased reaction, causing collisions. This could have significant applications in production, which requires catalase, in that storage must have a lower ambient temperature. The physiological conditions of the human body, at pH 7 and 37°C, were observed to have the highest foam production, due to the molecular evolution of catalase. Catalase optimization can be used to treat a variety of diseases, such as protection from neurodegenerative diseases, by eliminating hydrogen peroxide-induced damage. Ethanol may be used as an inhibitor of catalase, as in our trials, it greatly reduced catalase's enzymatic activity, possibly due to partial denaturation. This may be used in instances in which a reaction must be controlled or an uncontrolled reaction stopped. Catalase's foam production, used as a proxy to measure oxygen production, was greater in basic pH 10 conditions as opposed to acidic pH 4 environments. This could indicate that the pH of the reaction sites does not need to be neutralized after previous processes, such as fabrics being bleached in an alkaline solution. This could pose lower time and cost to companies in this industry, and similar applications in many others. This experiment yielded interesting data with applications to a variety of fields, paving the way for future studies to further refine factory and healthcare procedures.
Sources Of Error
Several factors regarding the uncertainty of this experiment were identified, primarily human measurement errors and enzyme degradation over time, resulting in discrepancies in the results. Inexact measurements and pipetting could result in slight differences in outcomes. Due to the characteristics of the sweet potato-derived catalase, which causes the catalytic activity to decrease over time, the results could be majorly altered, as the enzyme could degrade more quickly in certain time periods. Another issue could be the improper function of the surfactant, in that gas could be released at a certain point, altering the overall findings of the experiment. The molecular composition of the pH buffers could have affected the catalase activity, as in certain instances are noted to have acted as an enzyme buffer. The inconsistent size of the potatoes used as the source of the enzyme could have affected the results, in that the amount of catalase in each potato varies. In summary, many unforeseen errors affected the results of this experiment; the error with the highest potential for alteration of outcomes is the lack of specified lab equipment to accurately measure the amount of oxygen released, as having a proxy does not yield the same level of accuracy.
Citations
Admin. (2023, August 29). Peptide Bond - Definition, formation, structure, examples. BYJUS. https://byjus.com/jee/peptide-bond/
Alberts, B., Johnson, A., Lewis, J., Raff, M., Roberts, K., & Walter, P. (2002). Protein function. Molecular Biology of the Cell - NCBI Bookshelf. https://www.ncbi.nlm.nih.gov/books/NBK26911//
Amino acids. (n.d.). Genome.gov. https://www.genome.gov/genetics-glossary/Amino-Acids
Amino acids: MedlinePlus Medical Encyclopedia. (n.d.). https://medlineplus.gov/ency/article/002222.htm#:\~:text=Amino%20acids%20are%20molecules%20that,Break%20down%20food
Britannica Editors. (2007, January 25). Enzyme. Britannica. Retrieved January 17, 2026, from https://www.britannica.com/science/enzyme
Buddies, S. (2024, February 20). The liver: Helping enzymes help you! Scientific American. https://www.scientificamerican.com/article/bring-science-home-liver-helping-enzymes/
Client challenge. (n.d.). https://www.khanacademy.org/science/ap-biology/cellular-energetics/enzyme-structure-and-catalysis/a/enzymes-and-the-active-site
Health Encyclopedia. (n.d.). Histidine. University of Rochester Medical Centre. https://www.urmc.rochester.edu/encyclopedia/content?contenttypeid=19&contentid=Histidine
Jensen, F. B. (2004). Red blood cell pH, the Bohr effect, and other oxygenation‐linked phenomena in blood O2 and CO2 transport. Acta Physiologica Scandinavica, 182(3), 215–227. https://doi.org/10.1111/j.1365-201x.2004.01361.x
Khan Academy. (n.d.-a). https://www.khanacademy.org/science/biology/macromolecules/proteins-and-amino-acids/a/introduction-to-proteins-and-amino-acids
Khan Academy. (n.d.-b). https://www.khanacademy.org/test-prep/mcat/biomolecules/amino-acids-and-proteins1/a/protein-folding-and-denaturation
Khan Academy. (n.d.-c). https://www.khanacademy.org/test-prep/mcat/biomolecules/amino-acids-and-proteins1/a/amino-acid-structure-and-classifications
Khan Academy. (n.d.-d). https://www.khanacademy.org/science/ap-biology/cellular-energetics/environmental-impacts-on-enzyme-function/a/hs-enzymes-review
Khan Academy. (n.d.-e). https://www.khanacademy.org/science/ap-biology/cellular-energetics/enzyme-structure-and-catalysis/a/enzymes-and-the-active-site
Khan Academy. (n.d.-f). http://khanacademy.org/science/biology/macromolecules/proteins-and-amino-acids/a/introduction-to-proteins-and-amino-acids
Khan Academy. (n.d.-g). https://www.khanacademy.org/test-prep/mcat/biomolecules/amino-acids-and-proteins1/a/protein-folding-and-denaturation
Liao, S. (2024, September 15). What are amino acids? WebMD. https://www.webmd.com/diet/foods-high-in-amino-acids
Libretexts. (2022, August 31). 11.2: Ion-Dipole Forces. Chemistry LibreTexts. https://chem.libretexts.org/Courses/University_of_Arkansas_Little_Rock/Chem_1403%3A_General_Chemistry_2/Text/11%3A_Intermolecular_Forces_and_Liquids/11.02%3A_Ion-Dipole_Forces
Libretexts. (2024, March 21). 2.2: Structure & function - amino acids. Biology LibreTexts. https://bio.libretexts.org/Bookshelves/Biochemistry/Book%3A_Biochemistry_Free_For_All_(Ahern_Rajagopal_and_Tan)/02%3A_Structure_and_Function/202%3A_Structure__Function_-_Amino_Acids#:\~:text=All%20amino%20acids%20have%20the,to%20as%20a%20side%20chain.
Libretexts. (2025, March 19). 8.6: Enzyme activity. Chemistry LibreTexts. https://chem.libretexts.org/Courses/Georgia_Southern_University/CHEM_1152:_Survey_of_Chemistry_II_(Osborne)/08:_Proteins/8.06:_Enzyme_Activity
Merck Veterinary Manual. (2025, December 12). Table:Normal Rectal Temperature Ranges-Merck Veterinary Manual. https://www.merckvetmanual.com/multimedia/table/normal-rectal-temperature-ranges
PDB101: Molecule of the Month: Catalase. (n.d.). RCSB: PDB-101. https://pdb101.rcsb.org/motm/57#:\~:text=Catalase%20performs%20its%20rapid%20destruction,hydrogen%20peroxide%20molecule%20to%20bind.
Professional, C. C. M. (2025, December 22). Enzymes. Cleveland Clinic. https://my.clevelandclinic.org/health/articles/21532-enzymes
Protein function | Learn Science at Scitable. (n.d.). https://www.nature.com/scitable/topicpage/protein-function-14123348/#:\~:text=Proteins%20are%20responsible%20for%20nearly,cell%20and%20mobilize%20intracellular%20response.
Reddy, M. K. (2025, January 30). Amino acid | Definition\, Structure\, & Facts. Encyclopedia Britannica. https://www.britannica.com/science/amino-acid
Schmidt, B. (2006). Proteins: Structure and Function. by David Whitford. ChemBioChem, 7(4), 702–703. https://doi.org/10.1002/cbic.200600064
Schneider, K. (2022, January 20). An easy guide to understanding how surfactants work. International Products Corporation. https://ipcol.com/blog/an-easy-guide-to-understanding-surfactants/
Sun, Z. (2013). Foundations for the study of structure and function of proteins. In Springer eBooks (pp. 303–336). https://doi.org/10.1007/978-3-642-38951-1_10
The Editors of Encyclopaedia Britannica. (2024, December 17). Denaturation | Definition\, Examples\, & Facts. Encyclopedia Britannica. https://www.britannica.com/science/denaturation
The Organic Chemistry Tutor. (2019, October 23). Factors affecting enzyme activity - pH, temperature, competitive and noncompetitive inhibition [Video]. YouTube. https://www.youtube.com/watch?v=no36EgNHg6s
Wang, Y., PhD. (2021, September 14). Structure of an amino acid. Rapid Novor. https://www.rapidnovor.com/structure-of-an-amino-acid/ What are proteins and what do they do?: MedlinePlus Genetics. (n.d.). https://medlineplus.gov/genetics/understanding/howgeneswork/protein/
Wikipedia contributors. (2025a, September 28). Enzyme inhibitor. Wikipedia. https://en.wikipedia.org/wiki/Enzyme_inhibitor#:\~:text=In%20addition%20to%20small%20molecules,tightest%20known%20protein%E2%80%93protein%20interactions.
Wikipedia contributors. (2025b, October 1). Catalase. Wikipedia. https://en.wikipedia.org/wiki/Catalase
Acknowledgement
I would like to thank my CYSF coordinator, Mrs. Friesen, for helping me with the registration aspect of this project and for providing certain equipment, which greatly assisted in the unfolding of my experiment. I would also like to thank my parents for providing the materials which were required for this experiment; it would be impossible to complete this project without them. Lastly, I would like to thank the authors and creators of the sources that I used in aspects of my experiment (cited in the references), as they importantly supplied sources that were needed to understand and analyze this experiment. In the spirit of respect and truth, I acknowledge the traditional Treaty 7 territories of the Blackfoot Confederacy, the Tsuut’ina, and the Iethka Stoney Nakoda Nations. I also recognize that the City of Calgary is situated on land traditionally known as Moh’kinsstis and is home to the Otipemisiwak Métis Government.