Creating an AI-Powered Portable and Affordable Ultrasound Device for Multi-Cancer Screening and Diagnosis
Grade 10
Presentation
Problem
1.0 Abstract
This project focuses on the topic of early cancer detection, specifically via creating a portable ultrasonographic device accelerated by artificial neural networks in order to be nominal and accessible to underserved regions lacking essential medical infrastructure. When I visited my extended family in their village last year in India, I wondered how they would manage if diseases arose. When I inquired them about it, they explained that they have little to no transportation, and the nearest hospital was hours away by foot. Due to this, people there ignored the lumps on their body or any other symptoms, simply due to lack of accessibility. Early cancer detection is crucial, yet in remote or rural areas, this may be a fantasy. The reason for this could be lack of resources, such as medical imaging devices, or cancer specialists readily available. However, due to these diagnostic delays, malignant tumours are able to metastasize or grow, significantly worsening the cancer. Due to this severe issue, I have built a portable ultrasound that is accelerated by an artificial intelligence neural network, specifically by implementing real-time segmentation that runs on the ultrasound results. The Jetson Nano 4GB runs this segmentation inferencing on the image pieced together by the microcontroller based on inputs from the transducer converted into a readable signal by an array of chips. After training a YOLOv8 segmentation model to run on the Jetson Nano, the key results were a model accuracy of 95%, and an inference speed average of ~1.23s/image. This project shows the possibilities on how cancer screening can be revolutionized in remote populations.
2.0 Introduction
2.1 Cancer Overview
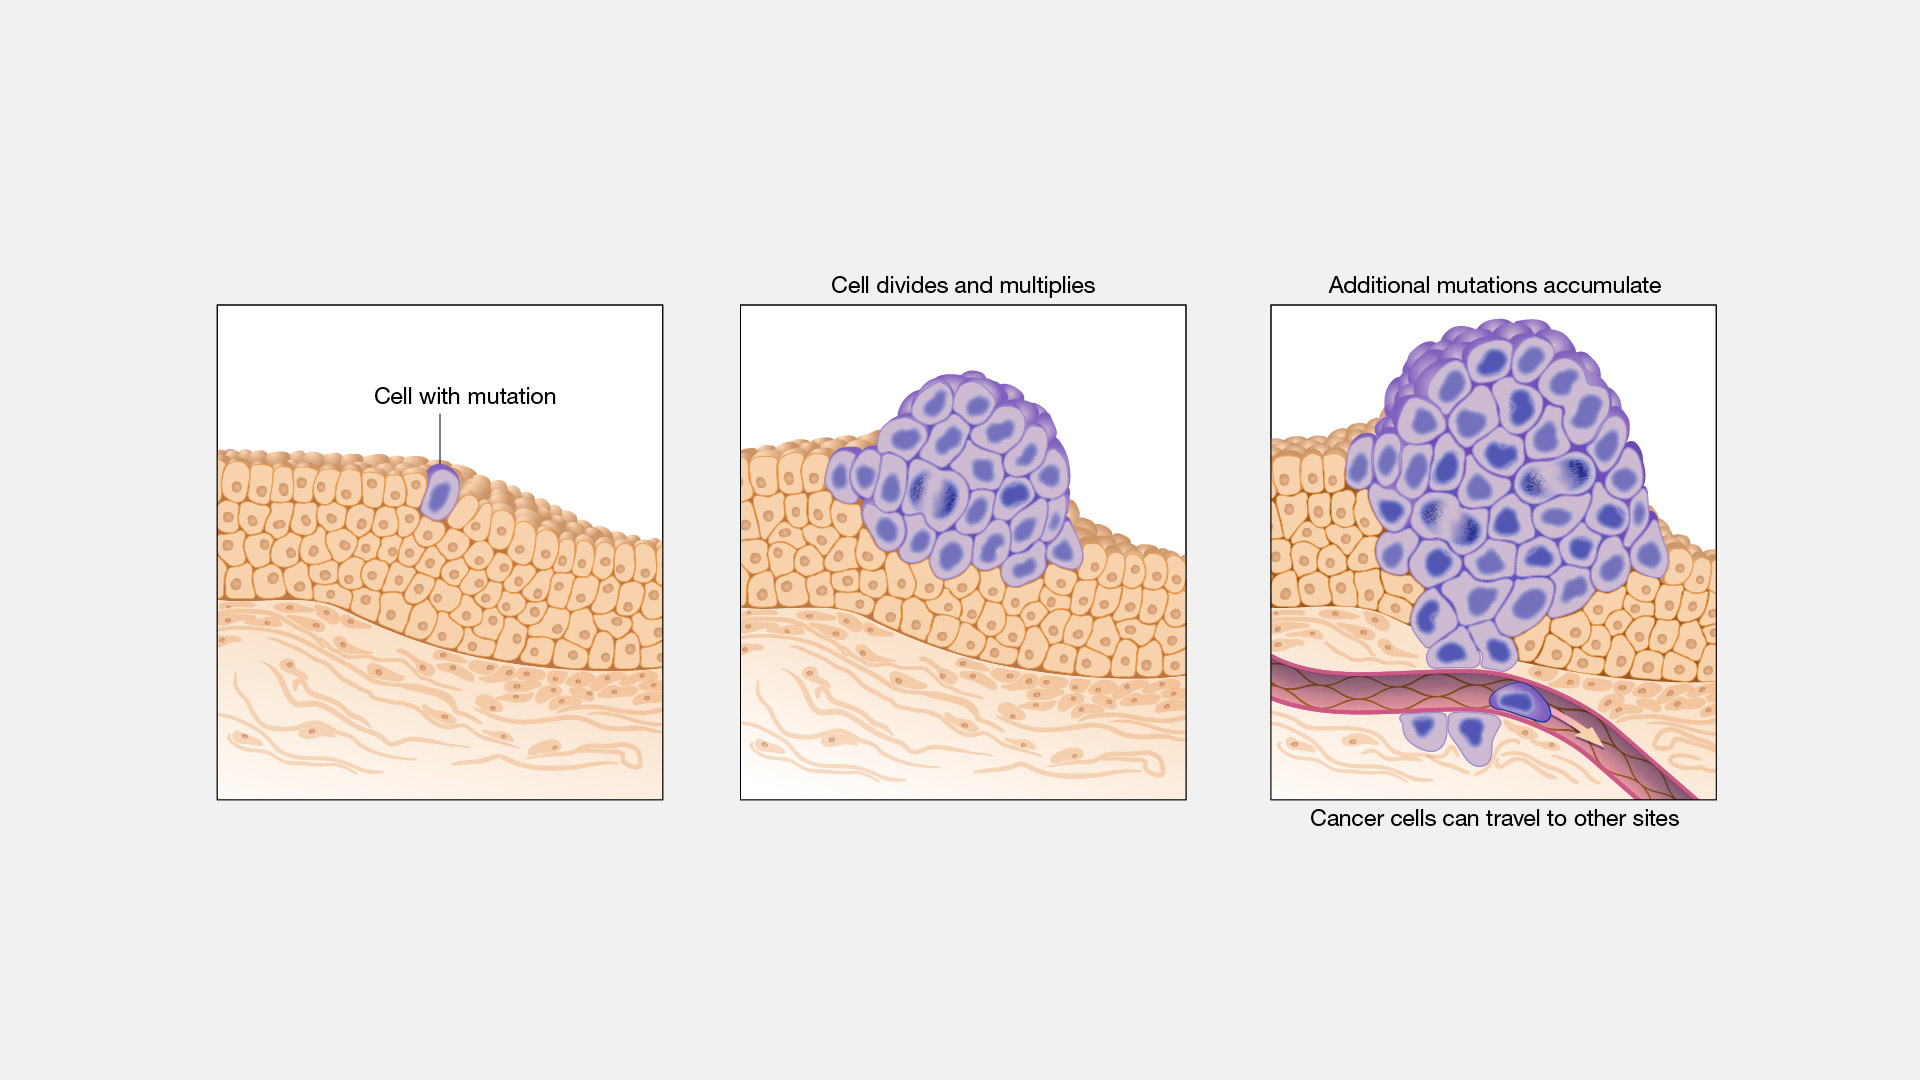
Cancer is one of the worst diseases, which can arise from our own bodies. According to the World Health Organization: globally “over 35 million new cancer cases are predicted in 2050, a 77% increase from the estimated 20 million cases in 2022. The human body is consists of trillions of cells, which are considered the smallest unit of life. In these cells, there are instructions located within its “brain”- the nucleus, called DNA, or deoxyribonucleic acid, which tell it how to reproduce, etc. Normally, the cells in our body grow and multiply via the process of cell division, specifically mitosis. When old cells become damaged or die, brand new ones are produced through this process, producing a daughter cell identical to the parent cell. When the body later needs to get rid of old cells, due to either unwanted growth or damage, it does this via apoptosis. Commonly called programmed cell death, this is when the body tells a cell to die and stop reproducing. However, the very DNA that instructs cells on their most vital tasks, can get a genomic mutation which allows the cells to reproduce excessively and avoid apoptosis. Mutations can occur through things like UV radiation from the sun, tobacco smoke, carcinogens, and others that are labeled as “cancer-causing”. These corruptions in DNA can cause our cells to start abnormally reproduce at a rapid rate, and ignore signals from the body like apoptosis. These large groups of cells then grow and cluster into a solid tumour.
There are two main types of cancer tumours: malignant and benign. Malignant tumours are more destructive, and they spread to many organs across the body. Benign tumours are localized, can be removed and will not grow back. However, benign tumours can still cause significant harm, like blocking blood flow in the brain if they grow large enough.
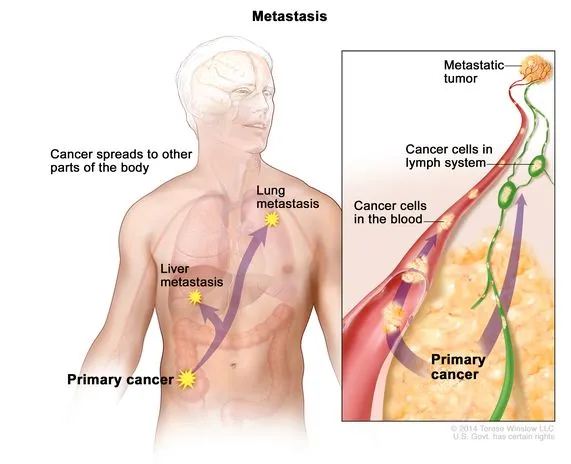
Once it has grown to a large size, malignant tumours will begin performing the action of “metastasis”. This is the spread of cancerous cells by breaking off the primary tumour, then travelling through the blood or lymph system in order to create more metastatic tumours in other parts of the body. Metastasis can happen very quickly across multiple organs, and when cancer is diagnosed, it typically has already metastasized.
Due to this issue, it is vital that cancerous tumours are found earlier. However, the essential medical infrastructure or resources are not accessible to all regions.
2.2 Diagnostic Challenges in Remote areas
All across the world in remote areas, people are at a significant disadvantage due to lack of diagnostic medical devices, or specialists. According to CMR, the global average is 45 radiologists to 1 million people, but there are significant disparities. In higher-income countries, this number is 97.9 radiologists per million, making sense because of its bustling economy like the United States. However, in low-income countries, there are less than two radiologists per 1 million people.
What does this mean?
It means the majority of those one million people won’t be able to have full, concrete access to radiologists or cancer specialists in their lifetime. These people don’t have the proper medical infrastructure, and if they have a suspicious lump on their throat, they’re more likely to ignore it for weeks just due to lack of accessibility.
Additionally, this means that there is a lack of essential diagnostic technology, which is crucial for finding cancer earlier. As these devices can cost upwards of $15 000, many regions cannot afford them.
With the combined circumstance of lack of medical devices and no specialists, early detection of cancerous tumours become a fantasy in these remote areas.
In remote areas, it takes about 66 days to wait for a cancer diagnostic screening (NCCI Australia, 2019). On top of this, there’s an additional average of 2 weeks (14 days) for waiting for the results.
Using these values, and the average TVDT (Tumour Volume Doubling TIme) for hepatocellular carcinoma (HCC) liver cancer taken from a study (Chansik An et al, 2015), we can calculate the approximate growth of an HCC liver cancer tumour as a percentage.
If we assume exponential growth, then it would yield a growth factor of: Growth Factor = 280/90
280/90 = 1.8517494246
280/90 ≈ 1.85
This means that the tumour would be 1.85x bigger than where it started from, and would’ve grown by 85%. Keep in mind that these values are for screening and waiting for results to get back, and that it may be too late when it’s found. The tumour may be too big to take out, it might have metastasized to other parts of the body, or the cancer may be Stage 4.
2.3 Importance of Early Detection
Upon the study of the 5-year survival rate for cancers, the standard in the oncology field, it can be seen that early detection has the potential to greatly improve it.
According to the SEER (Surveillance, Epidemiology, and End Results) database provided by the National Cancer Institute, here are the 5-year survival rates in localized, regional, and distant stages for breast, liver, and papillary thyroid cancers.
Breast Cancer
| SEER Stage | 5-year Relative Survival Rate |
|---|---|
| Localized | >99% |
| Regional | 87% |
| Distant | 32% |
Papillary Thyroid Cancer
| SEER Stage | 5-Year Relative Survival Rate |
|---|---|
| Localized | >99.5% |
| Regional | 99% |
| Distant | 74% |
Liver Cancer
| SEER Stage | 5-year Relative Survival Rate |
|---|---|
| Localized | 37% |
| Regional | 13% |
| Distant | 3% |
As you can see, survival rates are greatly improved across cancers when it is diagnosed in the localized stage. Most cancer types start off in the localized stage, confined to one area before it starts to multiply and spread to other organs via metastasis. For context, the regional stage is when the cancer has metastasized to nearby structures, and the distant stage is when it has reached a distant organ in the body.
The reason for the disparity in the liver cancer statistics is because of it’s asymptomatic nature, further bringing to light how a more effective screening solution will help save many lives.
2.4 Problem Statment
In remote areas, there is limited access to essential medical infrastructure and necessary oncological professionals. Due to this matter, the screening and diagnosis of cancerous tumours is often delayed by many weeks it allows cancerous tumours to metastasize easily to many parts of the body, which allows liver cancer to grow 86% within an 11-week period (typical wait time). Additionally, that’s only the statistics for those who can afford screening procedures. Many remote communities lack basic medical technology, as these can cost upwards of $15 000. Finally, due to the lack of medical specialists, an analysis on their results may take weeks or months, with 2 radiologists per 1 million people.
With the above information in mind,
How can we make a low-cost, fast, and effective portable multi-cancer screening system that can be set up anywhere, is nominal to remote communities, can be operated by anyone, and will provide results instantaneously?
3.0 Literature Review
3.1 Current Cancer Diagnostic Methods
Currently, there are many methods used to screen for cancer.
Computer Tomography (CT) Scan
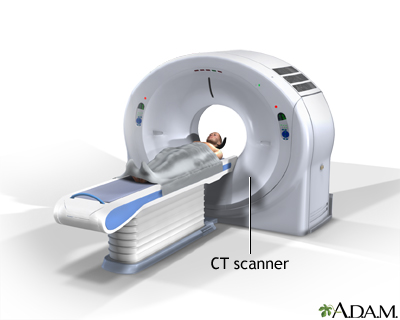
This procedure utilizes a computer linked up to an x-ray machine to create detailed pictures of many areas in the body. By taking pictures from different angles, 3D views are taken of different structures and organs. Dyes can be injected into veins, or taken orally in order to show specific tissues in more detail. However, the combined cost of these machines can be more than $80 000, above the threshold that remote communities can handle. These machines are also huge, making it nearly impossible to transport.
Magnetic Resonance Imaging (MRI)
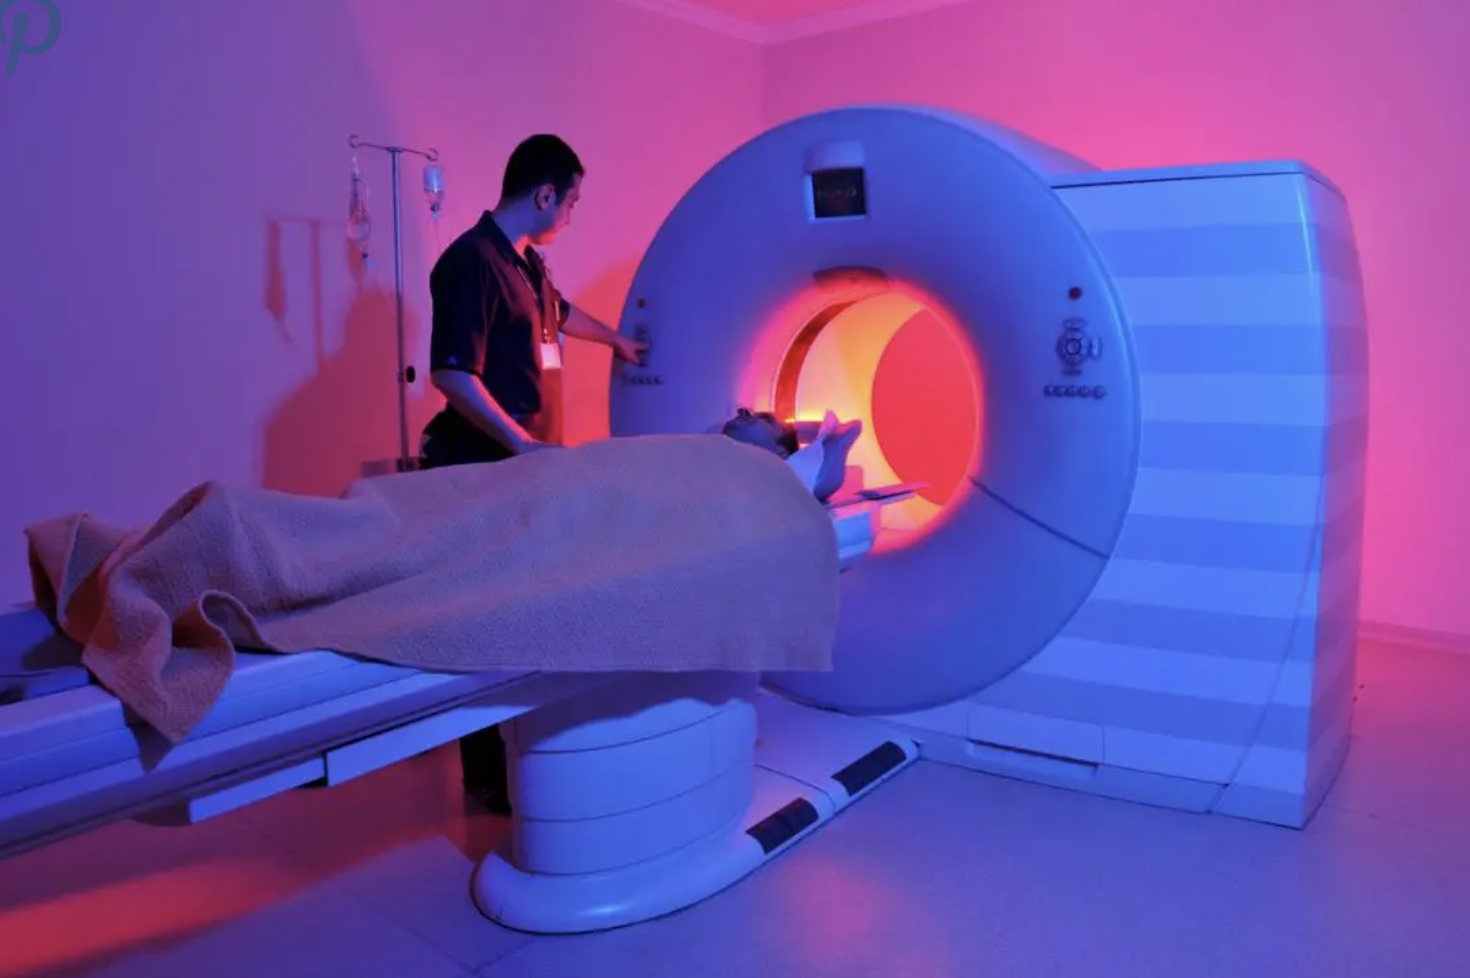
MRI scanners create a strong magnetic field around your body, which causes your atoms to align in the same direction. Radio waves are then sent to move atoms out of their position, and when the atoms move back, they send a set of their own radio waves. These signals are received and pieced together into an image by a computer, and easily displays the difference between normal tissue and cancerous ones. “MRI may be used instead of computed tomography (CT) when organs or soft tissue are being studied. MRI is better at telling the difference between types of soft tissues and between normal and abnormal soft tissues.” (Hopkins Medicine) However, the entry-level cost for these machines is $225K, which is very unrealistic for many regions. Additionally, the cost of one scan can cost from $600-$2500, limiting access to the low-income population.
Ultrasound Imaging
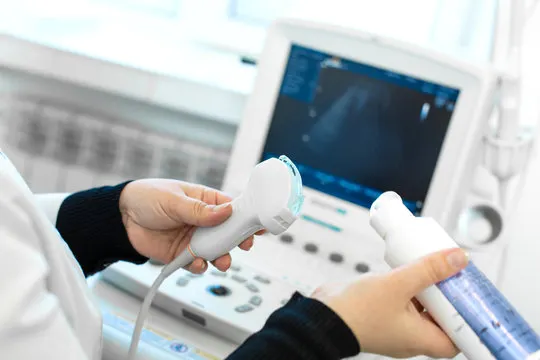
Ultrasound imaging works mainly via a piezoelectric transducer. The most commonly used technique, ultrasound waves are produced by a transducer with a special ceramic crystal material called piezoelectrics. When an electric field is applied to them, they produce sound waves that enter the body, and when it has found something, the sound waves are reflected back onto the piezoelectric. These materials are also able to generate an electrical field when a sound wave hits them, which ends up being constructed into the final image. Ultrasound gel is also used, in order to prevent air pockets from forming between the transducer and the skin. The cost for a full-size machine, is upwards of $20 000. This is still too expensive and difficult to transport, but since the technology is simple, it can be applied into a portable solution.
3.2 Portable Ultrasound Research
Ultrasound technology is a widely used diagnostic imaging method that relies on high-frequency sound waves to visualize internal body structures. Traditional ultrasound machines are large, expensive, and require skilled radiologists for diagnosis. This section explores the principles of ultrasound, and the possibilities of creating a portable system.
3.2.1 How an Ultrasound Works
Ultrasound imaging, also called sonography works by emitting high-frequency sound waves into the body and detecting the echoes that return from different tissues. The basic principles are as follows:
-
Generation of Sound Waves
The ultrasound transducer contains piezoelectric crystals, which convert electrical energy into sound waves. A short electrical pulse is applied to the piezoelectric material, causing it to vibrate and emit high-frequency sound waves. These waves propagate through the body and reflect off different tissue boundaries.
-
Detection of Echoes
When sound waves encounter tissue interfaces, some waves are reflected back to the transducer while others continue deeper. The returning echoes cause the piezoelectric crystals to vibrate again, converting them back into electrical signals.
-
Image Formation
The time delay and intensity of the returning echoes determine the depth and type of tissue. The received signals are amplified, processed, and displayed as a grayscale image, with stronger echoes appearing brighter and weaker echoes appearing darker.
3.2.2 Possible Portable Ultrasound
Based on research done thus far, to build a mock portable ultrasound, here are the necessary basic components.
-
Ultrasound Transducer
A probe that emits sound waves and receives echoes to create an image, and different frequencies are available based on budget/required resolution.
-
Pulse Generation Circuit
Generates short bursts of high-frequency electrical pulses that drive the transducer. Should include a timing component, a pulse amplifier, and a switching element to control signal transmission.
-
High-Voltage Power Supply
Converts a lower voltage input to the higher voltage needed to excite the transducer.
-
Signal Reception and Processing Circuit
Captures the returning echoes and amplifies the weak signals. Should include amplifiers, rectifiers, and filtering components to extract useful data.
-
Microcontroller
Controls the timing of pulses and synchronization of the signal, collects them to create the image. Must have a high analog-to-digital conversion rate in order to create the image in real time.
3.3 Artificial Intelligence in Cancer Imaging
Artificial Intelligence has the possibility to screen for cancer tumours much more quickly than humans every could. By training a neural network on a series of medical images with labels, it can achieve an accuracy higher than a human professional. In a study done by MedicalNewsToday, a group of medical professionals applied a deep learning AI model to ~50 000 LDCT scans which indicate an abnormal growth of lung nodules (cancer). They then compared the AI’s results with the results from a group of “six board-certified U.S. radiologists who had up to 20 years of clinical experience.”
“When prior LDCT scans were not available, the AI ‘model outperformed all six radiologists with absolute reductions of 11% in false positives and 5% in false negatives,’ report Tse and colleagues. When previous imaging was available, the AI performed just as well as the radiologists.”
This means that AI excels at finding tumours in shorts amount of data, something that humans can struggle with. Additionally, it can help reduce invasive procedures done on people by screening them for cancer. Dr. Etemadi expands on this.
“Not only can we better diagnose someone with cancer, we can also say if someone doesn’t have cancer, potentially saving them from an invasive, costly, and risky lung biopsy,”
By incorporating Artificial Intelligence into cancer imaging, there are many advantages, as it can find tumours faster,
3.4 Basics of Neural Networks
Neural networks are the foundation of artificial intelligence, and have been increasingly getting popular over the last decade. Designed to mimic the human brain, these computational models recognize patterns over time in order to make inferences on data.
3.4.1 Structure of a Neural Network
Neural networks are fully made up of units called neurons that mimic the actual neurons in our brains. The following information and media is taken directly from V7 Labs’ “The Essential Guide to Neural Network Architectures” (Baheti, 2021).
Neurons are complex mathematical figures, but are easy to understand at a high level. A diagram can be seen below.
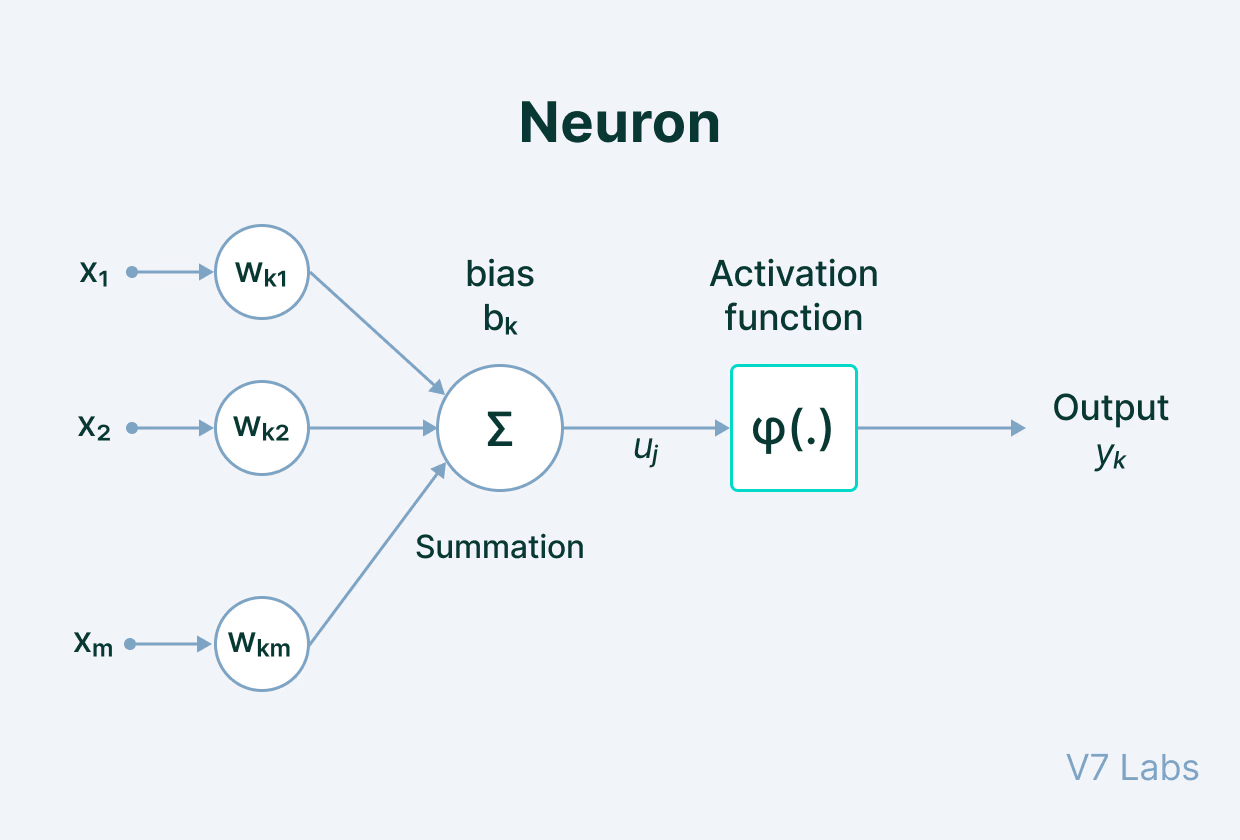
To put it simply, this is basically the learning process of an AI model. There are 5 main components of this process:
- Input - a set of features given to the model for training. An example is annotations for an object detection software.
- Weight - gives importance to features that contribute more towards the learning by using scalar multiplication between the input value and the weight matrix.
- Transfer Function - combines all inputs into one output value so that the activation function can be applied (finds the sum).
- Activation Function - introduces non-linearity in the working of perceptrons to consider varying linearity in inputs.
- Bias - shifts the value produced by the activation function, like the constant in a linear function.
When multiple of these neurons are stacked on top of each other, it creates a layer. Multiple of these layers next to each other and interconnected creates what’s called a multi-layer neural network.

In a neural network, neurons are organized into layers, each serving a specific role in data processing. The primary types of layers include:
- Input Layer: This is the initial layer that receives raw data inputs, such as images or text. Each neuron in this layer represents a feature or attribute of the input data.
- Hidden Layers: Located between the input and output layers, hidden layers perform computations and feature extraction. A network with multiple hidden layers is considered a deep neural network. Common types of hidden layers are:
- Dense (Fully Connected) Layer: Each neuron connects to every neuron in the preceding layer, enabling the learning of complex patterns.
- Convolutional Layer: Mostly used in image processing, these layers apply convolution operations to detect spatial features like edges and textures.
- Recurrent Layer: Designed for sequential data, such as time series or language, these layers maintain information across inputs to capture temporal dependencies.
- Output Layer: The final layer produces the network’s predictions or classifications. The number of neurons here corresponds to the number of desired output classes or values.
Each layer’s neurons apply activation functions to introduce non-linearity, which allows the model to detect patterns it’s been trained on in the data.
3.5 AI Deployment Techniques
3.5.1 Hardware Required
To train and deploy a real-time AI model for the portable ultrasound, there are some hardware requirements.
Firstly, the computer must be small, and easily portable so that it would not increase the size of the overall device and keep it accessible to remote communities.
Additionally, the computer must be able to at least have 4GB of RAM (Random Access Memory), and be able to compute AI tasks easily and efficiently.
For this project, I have selected the Jetson Nano Developer Kit with 4 gigabytes of RAM, which has a very high processing speed for AI applications. According to Nvidia, “Jetson Nano delivers 472 GFLOPs for modern AI algorithms.”
This means that the Jetson Nano can compute 472 billion floating point operations per second, which are essential for AI model deployments. These floating point operations are being done in real time whenever a computer vision program is running, giving these statistics high value.
Therefore, I will be using the Jetson Nano 4GB Developer Kit to deploy my AI software.
3.5.2 YOLO vs R-CNNs
There are two most commonly used types of neural network architecture, which are R-CNNs and the YOLO architecture, with both working in different ways.
R-CNN
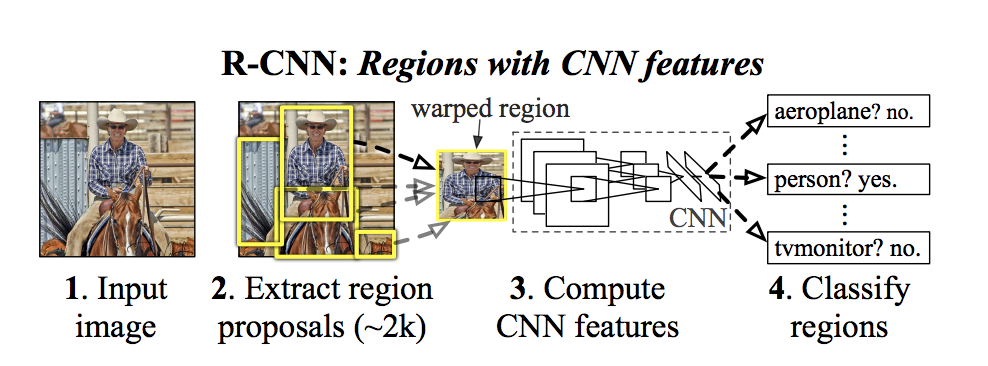
In R-CNNs (Region-Convolutional Neural Network), it works by extracting 2000 region proposals from the input image. Each one of these regions are warped into a square, and fed into a separate CNN which outputs the features present in the images. Finally, it takes the CNN features computed and predicts what is in those regions, giving an output of either a polygon or a bounding box (segmentation vs. detection).
YOLO (You Only Look Once)
The YOLO architecture, however, utilizes single-shot detection, implied by its name. In R-CNNs, the network doesn’t look at the complete image, but rather parts of it that have increased possibilities of having the object. However, in YOLO, a single neural network predicts the annotations and the class probabilities for these too.
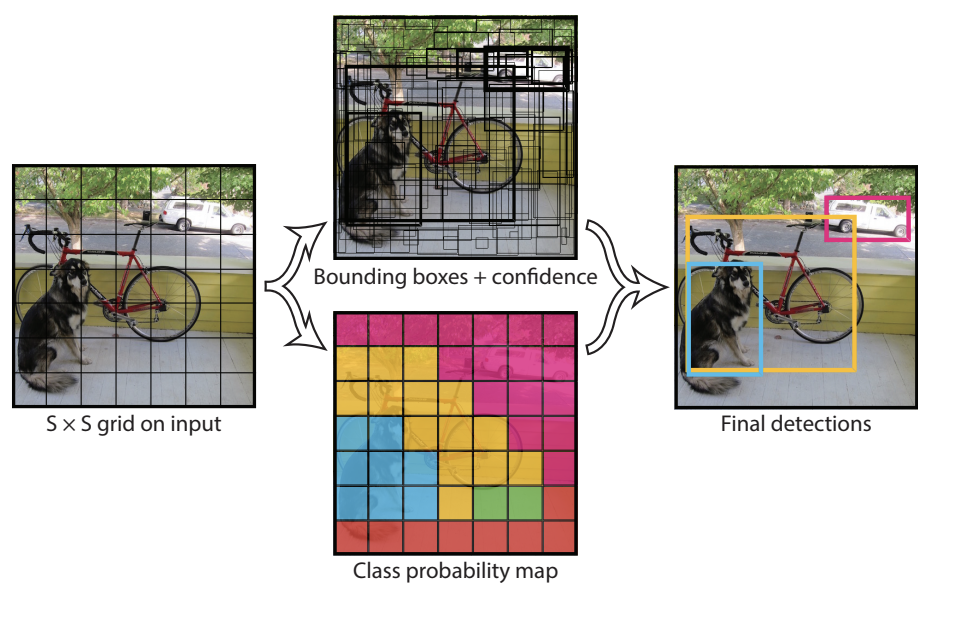
YOLO works by taking an image and splitting it into an SxS grid, where within each grid we take m annotations (bounding boxes/polygons). For each annotation, it outputs both a class probability and offset values, making processes much faster.
By using the YOLO architecture, it greatly helps to improve the speed of processing, which is vital to medical detection in real time, especially for cancer tumours.
3.5.3 Segmentation vs Detection
Object segmentation and detection are two different techniques used in image inferencing, and can be used in order to determine the presence and location of cancer tumours in an ultrasound scan. However, there are key differences between the two that give each other its own use case.
Object Detection
Object detection uses training data of images labelled with bounding boxes, and outputs it respectively. Although it does not have a high level of precision when showing detected objects, it allows for a smaller model size, faster inferencing speed, and less time spent on annotating images.
Object Segmentation
This method is superior to object detection in terms of precision, as it shows the exact pixels occupied by the detected object via a polygon. In terms of cancer ultrasound screening, this precision is very important as it gives medical professionals the exact information that is required including location of the tumour. However, this level of precision means that all training data must be annotated in polygons, and that the model size + inferencing speed will be sacrificed. Upon analysis, it can be determined that the pixel-precision provided by segmentation far outweighs the minor issues of increased labelling time, model size, and inferencing time.
As you can see, object segmentation is superior to object detection especially in this use case, providing medically-required precision to screen for cancer tumours earlier.
Method
My proposed solution is to create a portable, accessible, and affordable multicancer ultrasound screening device under $600 using basic components that generate imaging from human organs. It will incorporate the Jetson Nano 4GB to run real-time object segmentation on the ultrasound scans, allowing for the detection of tumours in breast, liver, and thyroid tissues.
The ultrasound will work via a transducer taken from a paint thinner, chips to amplify the signals, and the Teensy 4.1 microcontroller to piece together the image based on the signals from the chips. After that, the real-time ultrasound feed would be sent to the Jetson Nano via USB serial, which would run my trained YOLOv8 tumour segmentation model in real-time. Finally, the results of the segmentation program would be displayed on a Streamlit web app, accessible by a device on the same network.
The reason for choosing specifically breast, liver, and thyroid cancers, is because of the need to spread the variety of cancers across the body, inferencing issues, and dataset availability. Firstly, training the model on a variety of cancers helps to not only increase the use case but also to reduce inferencing issues. Since breast, liver, and thyroid cancers are not all in the same area, more people will be able to use my device. For 2024 in the US, breast cancer was estimated to have ~311 thousand new cases, and thyroid was estimated to have 44 thousand new cases. Additionally, liver cancer was estimated to have ~42 thousand new cases in the same year, showing how widespread these diseases are. Additionally, since this is a multi cancer detection system, including cancers of organs next to each other can cause incorrect predictions, mostly due to the fact that they look very similar in a low-quality ultrasound. Finally, there limited availability for datasets online of specific cancer ultrasound scans, and due to breast, liver, and thyroid’s popularity, these are more readily available.
This proposed solution offers a more effective way to screen for cancer tumours by using a portable ultrasound device powered by an artificial intelligence neural network. The device is designed to cost under $600 and will be easy to use, even for individuals without advanced experience.
5.1 Materials & Costs
To build my portable ultrasound, I have used the following materials. I found these materials via my research of basic ultrasound components.
| Seq # | Material (Item Name) | Qty | Purpose/Use | Cost CAD | Notes |
| 1 | LM7171BIN/NOPB | 1 | Voltage feedback op amp | $ 8.41 | Texas Instruments, DIP-8 |
| 2 | AE9986 (IC DIP Socket 8-pin) | 10 | Socket for 8-pin DIP IC | $ 1.41 | Assmann WSW Components, Tin contacts |
| 3 | 1175-1487 (IC DIP Socket 14-pin) | 1 | Socket for 14-pin DIP IC | $ 0.32 | CNC Tech, Tin contacts |
| 4 | SN74121N | 1 | Monostable multivibrator IC | $ 9.48 | TI, DIP-14 |
| 5 | IRL630PBF | 1 | N-channel MOSFET | $ 4.68 | Vishay, 200V/9A, TO-220AB |
| 6 | ICL7667CPA+ | 1 | Half-bridge gate driver | $ 13.41 | Analog Devices/Maxim, DIP-8 |
| 7 | LM7171AIMX/NOPB | 1 | Voltage feedback op amp | $ 7.27 | TI, SOIC-8 |
| 8 | AD811ANZ | 3 | Current feedback amplifier | $ 83.25 | Analog Devices, DIP-8 (total for 3 units) |
| 9 | DFR0123 (XL6009 Eval Board) | 1 | DC–DC boost converter board | $ 11.40 | DFRobot |
| 10 | TEENSY 4.1 (DEV-16996) | 1 | Microcontroller development board | $ 60.18 | SparkFun |
| 11 | L7805CV | 1 | Linear voltage regulator (5V) | $ 0.81 | STMicroelectronics, TO-220 |
| 12 | ECQ-E2104KB (Film Capacitor, 0.1µF) | 10 | General decoupling/filtering | $ 2.90 | Panasonic, 250V (total for 10 capacitors) |
| 13 | UCS2D470MHD1TO (Electrolytic, 47µF) | 1 | Power supply smoothing/filtering | $ 1.63 | Nichicon, 200V |
| 14 | 561R10TCCQ50 (Ceramic Capacitor, 50pF) | 1 | High-voltage circuit applications | $ 2.90 | Vishay, 1kV rating |
| 15 | B32529C0102K289 (Film Capacitor, 1nF) | 6 | Filtering or timing circuits | $ 2.40 | EPCOS/TDK, 63V (total for 6 capacitors) |
| 16 | TVA1442.1 (Electrolytic, 20µF) | 1 | Power filtering in higher-voltage applications | $ 11.29 | Vishay Sprague, 200V |
| 17 | DEVMO 8–32V to 45–390V DC–DC High Voltage Boost Converter | 1 module | Step-up booster for high-voltage applications | $ 21.99 | DEVMO; ZVS step-up booster module |
| 18 | E-Projects Radial Electrolytic Capacitors, 0.1µF, 50V (Pack of 5) | 1 pack (5 caps) | General decoupling/filtering in circuits | $ 8.71 | E-Projects; 105°C rated |
| 19 | Wavelength MP Blue Multi-Purpose Ultrasound Gel (250 mL) | 1 bottle | Ultrasound coupling medium | $ 10.55 | National Therapy Products, Brampton, ON |
| 20 | Ultrasonic Thickness Gauge Probe, 5MHz, Dia 8 (Replacement Probe for GM130/GM100) | 1 transducer | Measuring material thickness via ultrasound | $ 39.42 | Fydun; suits GM130/GM100 gauges |
| 21 | Security-01 9V 1A Power Supply Adapter (Center Negative), 5.5×2.1mm | 1 adapter | Power supply for center-neg. 9V devices | $ 14.65 | Security-01; 6.8 ft cord; UL listed |
| 22 | Facmogu 9W 9V/1A Power Supply Adapter (Center Positive), 5.5×2.5mm & 5.5×2.1mm Plugs | 1 adapter | Power supply for center-pos. 9V devices | $ 11.42 | Facmogu; AC 100–240V input; multiple plug sizes |
| Total | $ 328.48 |
Additionally, we need to include the cost of the Jetson Nano, bringing it to:
Ultrasound--$328.48
Jetson Nano-$249.99
Total--$578.47
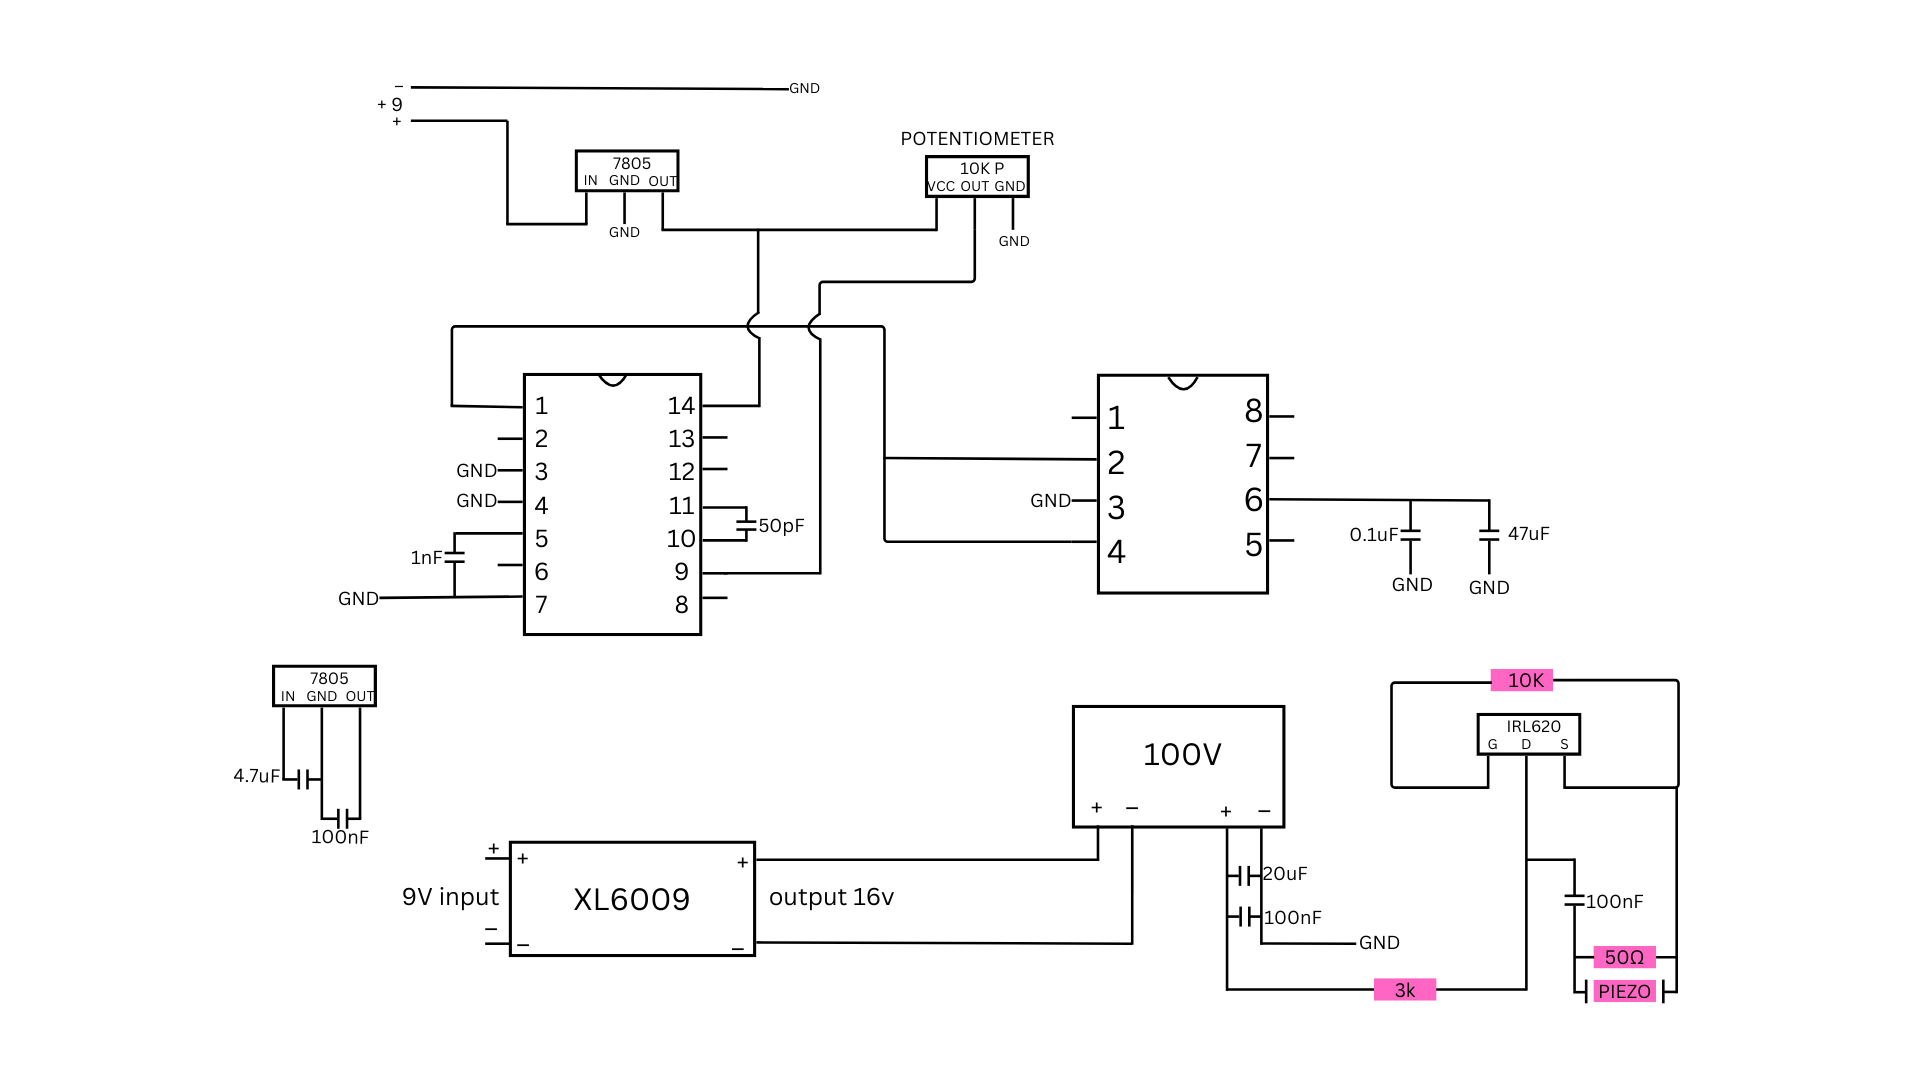
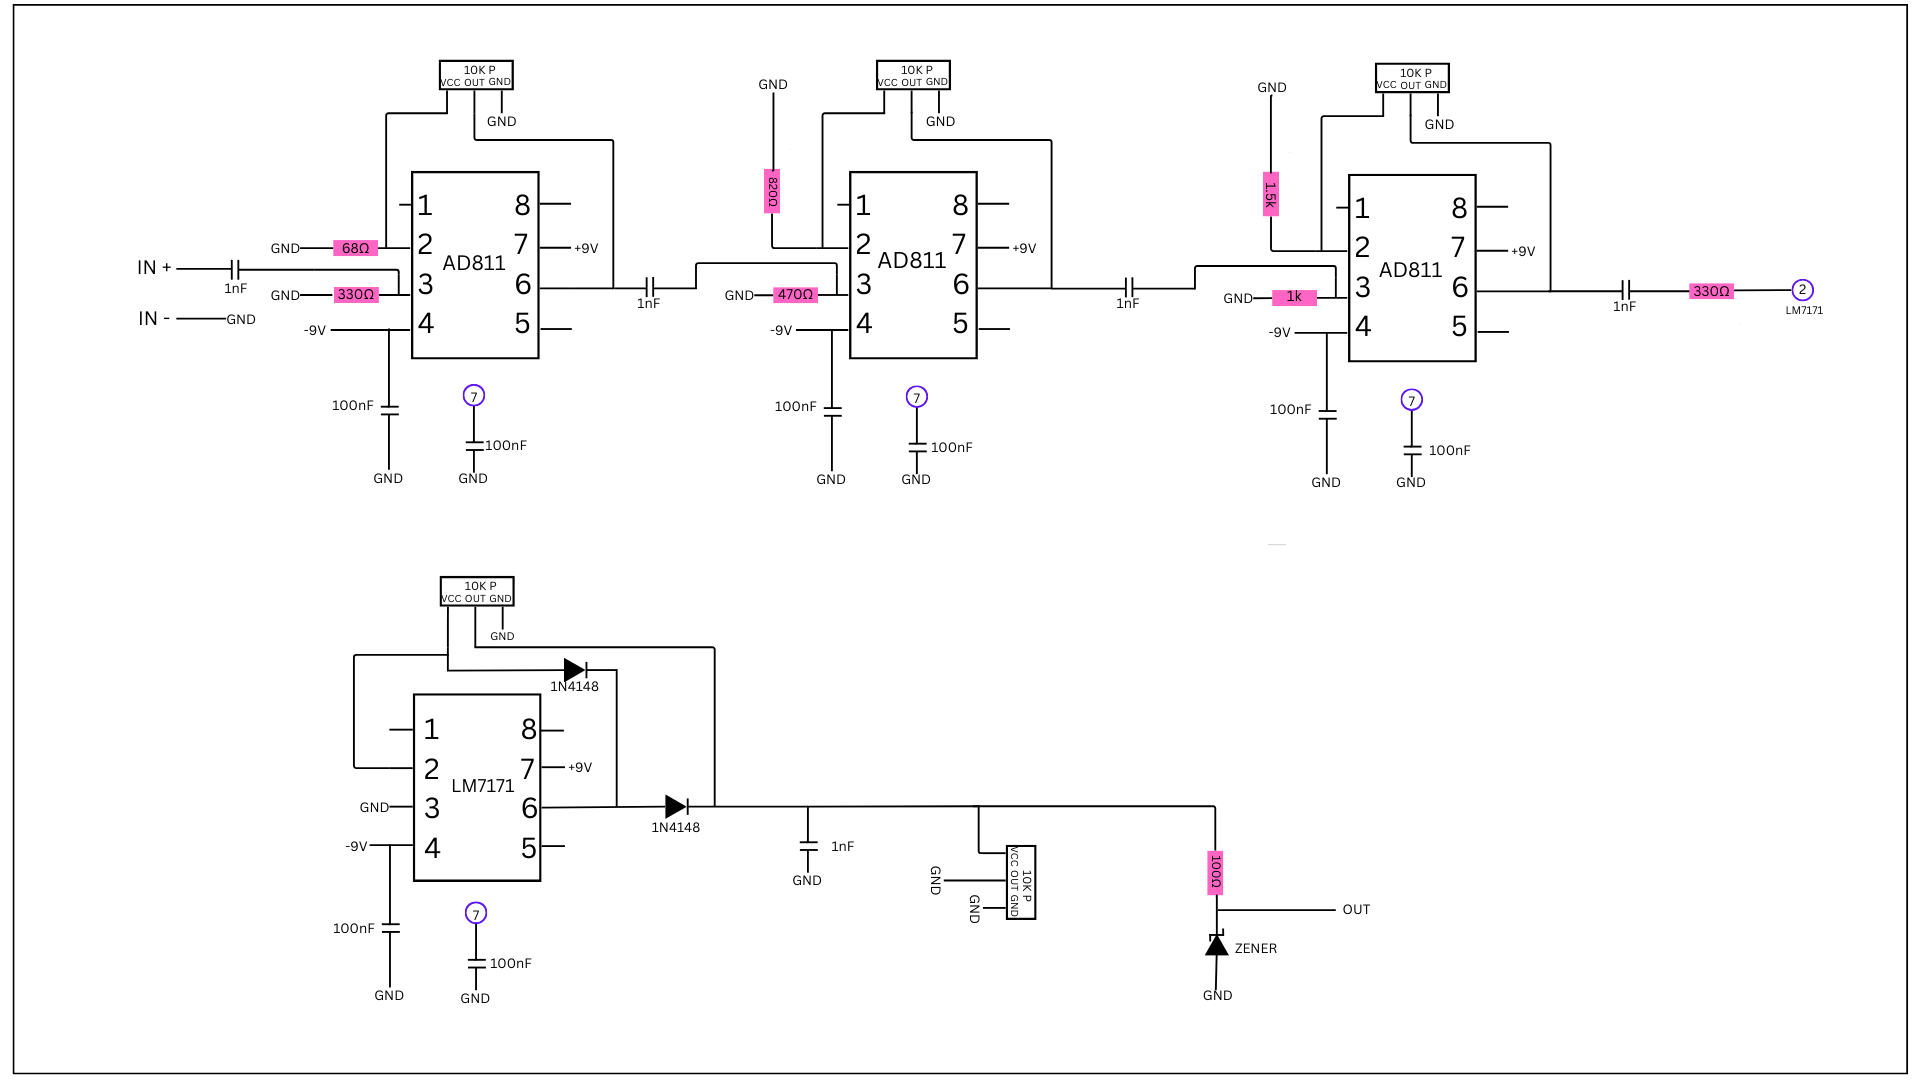
Hardware Design:
Next, we needed to design the hardware of the portable ultrasound. For this, I took inspiration from the journal of open hardware and created my own using the parts I had accessible. However, I had trouble soldering as it was my first time doing it on a self-built circuit. In the end, I used a soldered breadboard rated for 250V and 22 AWG wire and soldered it all after.
Circuit Diagrams:
AI Model Development
In order to build the neural network, there are three main steps. These steps are annotating the dataset, training the model, and finally deploying the software on the Jetson Nano.
5.3.1 Annotating the Dataset
Firstly, I needed to create data to train my machine-learning model on. These are called datasets. Datasets are made up of features (like an extra file) and images (for a image inferencing model like object segmentation). In my YOLOv8 segmentation neural network, the format required would be PNG images with text files detailing where the tumours are in each image, by giving polygon values tracing out the outline of the images.
When training the model, the neural network architecture uses these polygon values in order to learn, and also validate its predictions.
For this, I did lots of research to find accurate databases of ultrasound images of breast, liver, and thyroid cancers.
To find the data to train my model, I first looked for breast cancer ultrasound datasets. Since it is a very common type of cancer, many images were readily available on the open-source dataset website, Kaggle. I downloaded images from the dataset which contained malignant tumours in the tissue, and the total count was 210.
For the liver cancer dataset, I had to do extensive research as clinical scans were not easily accessible. However, I finally had found the dataset “B-mode-and-CEUS-Liver | Ultrasound data of a variety of liver masses“ for liver cancer ultrasounds in “The Cancer Imaging Archive” (TCIA). Here, I found images of B-mode and contrast-enhanced ultrasound (CEUS) images of liver masses. Since the format of the dataset is in DICOM (DIgital Imaging and Communications in Medicine), I had to manually convert each one to the PNG format. This is because each individual DICOM file had numerous slices in it, displaying the history. When all the images were put back to back, it seemed like a video of the ultrasound scan. After converting to PNGs, the total image count was 238.
Finally, for the thyroid cancer dataset, I had to search really hard since there were no references to it. Even though there were many scientific papers written on thyroid ultrasound images, they all did not reference the original website it was uploaded. I ultiimately found the location of the dataset, with it being on the National University of Columbia's Computer Imaging and Medical Applications Laboratory website. There, I found the dataset named TDID (Thyroid Digital Image Database), where there were photos of suspicious malignant thyroid nodules in their respective folders. After downloading the images as an NII format, also known as NIfTI (Neuroimaging Informatics Technology Initiative), I mass-converted them into PNG images. The final image count for thyroid was 471.
Next, I had to draw the annotations on the dataset to indicate where the tumours were in each photo.
To annotate and draw the polygons, I used an online software called Roboflow. This software allows people to easily annotate their datasets, and providing a seamless experience. On Roboflow, I drew the polygons around the regions that were tumours, which I learned from separate files like masks in the dataset. After annotating all 919 images, I applied augmentations to each one separately, and then augmented the combined dataset. Augmenting a dataset means producing copies of the same images slightly altered, mainly to improve training and make it be able to still predict accurately under altered conditions. I applied the shear augmentation, which would shear each image slightly. The final image count in the combined dataset with only augmentations applied to each separate image was 3278, and after augmenting the combined dataset, the final image count was 10 144.
5.3.2 Training the Model
Next, I had to train the model on the YOLO architecture. Since I am working with segmentation, I’m using the Jetson nano, and I’m using python 3.8 (the best version to use in case of package mismatch), I am going to use the YOLOv8n-seg model.
To train my model, I am utilizing a pre-trained model so I can take advantage of transfer learning, keeping the same weights but switching out the labels.
By keeping the nano version of YOLO, we will be able to still get accurate results, while having the inference times higher on the Jetson Nano.

When I was trying to train my model, I couldn’t do it locally on my Jetson Nano as it had only 4GB of space, and would time out really soon without training the model fully. Instead, I rented out a cloud computer on vast.ai for ~$0.70 per hour, with an Nvidia Geforce RTX 5090 graphics card. As this is very powerful, it was able to finish my training within 90 minutes, for a segmentation dataset of 10 000 images.
![]()
I trained my model for 100 epochs, and it finished training them swiftly, outputting mAP values as it went on.
The model trains by looking at each image and the corresponding text file. When training on the dataset, YOLOv8n-seg takes the text file for each image and processes it to understand the polygon present, and find the tumour in each ultrasound scan.
From the dataset, there were three directories: train, valid, and test. The YOLO neural network trains the model using the train directory, which contains all 10,000 images I annotated. While it is in its training process, it checks how the model is doing so far by conducting regular validation tests. It takes the photos from the valid directory and it’s text file, and runs the YOLO model on it. Based on how it performs during that checkpoint, it gets scored and saved. This is how the best checkpoint is given to the user after training, and how it determines it.
After the model finishes training, YOLO tests and measures the accuracy of the model through various tests. These tests are conducted using images from the test directory, which are not the same as the train directory to ensure it is working properly. These tests are conducted on numerous of the top checkpoints, and often provide a confusion matrix detailing the amount of false positives and negatives. Next, it plots various graphs about the confidence, precision, and recall values.
It also saved the best checkpoint, which was the version of the model that had the best speed and accuracy. It is saved as best.pt, which will ultimately be used to run our streamlit web app for instance segmentation of tumours.
5.3.3 Software Deployment
Finally, I need to deploy the previously trained YOLOv8n-seg model onto the Jetson Nano. I did this by utilizing the “best.pt” file previously generated, and coded the software in python.
The Jetson Nano code allows it to read raw scan data sent over USB from the Teensy microcontroller, reconstruct an image from the scans, and then process that image using a YOLO segmentation model.
The detailed walkthrough of the code is as-follows:
- Serial Communication:
- The app opens a serial connection over USB to receive scan data from the Teensy. Data is expected in CSV format with a header that indicates the number of samples.
- Data Acquisition & Processing:
- The read_scan() function reads a line from the serial port, parses it, and, if needed, reduces 600-sample scans to 300 samples. The app collects 18 scans to form one full image, where each scan forms a column.
- Image Reconstruction:
- Once 18 scans are collected, they’re stacked horizontally to create a grayscale image. This image is resized and converted to a BGR format to fit the YOLO segmentation model’s requirements.
- Segmentation & Visualization:
- The YOLO model processes the image and returns segmentation overlays. The resulting segmented image (converted to RGB) and the raw image are then displayed side by side in the Streamlit web app.
- End Result:
- The inputted scan would’ve been annotated with pixel precision and would’ve been classified as liver, thyroid, or breast cancer.
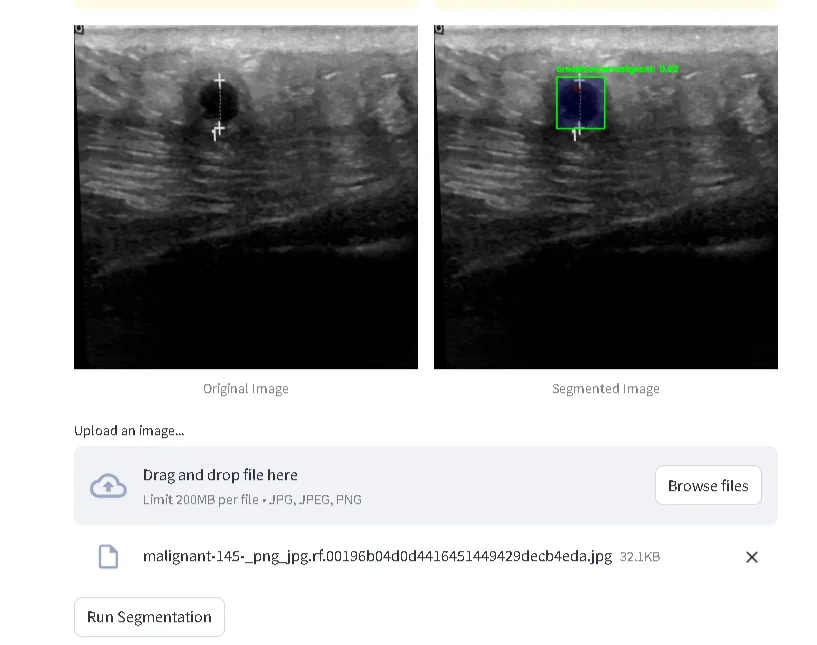
The above image is a screenshot taken from my streamlit web app, where one can upload an image of an ultrasound scan, and the output will be annotated and labelled. However, it is also important to note that you can also run inferencing real-time on the data collected from the ultrasound device I built.
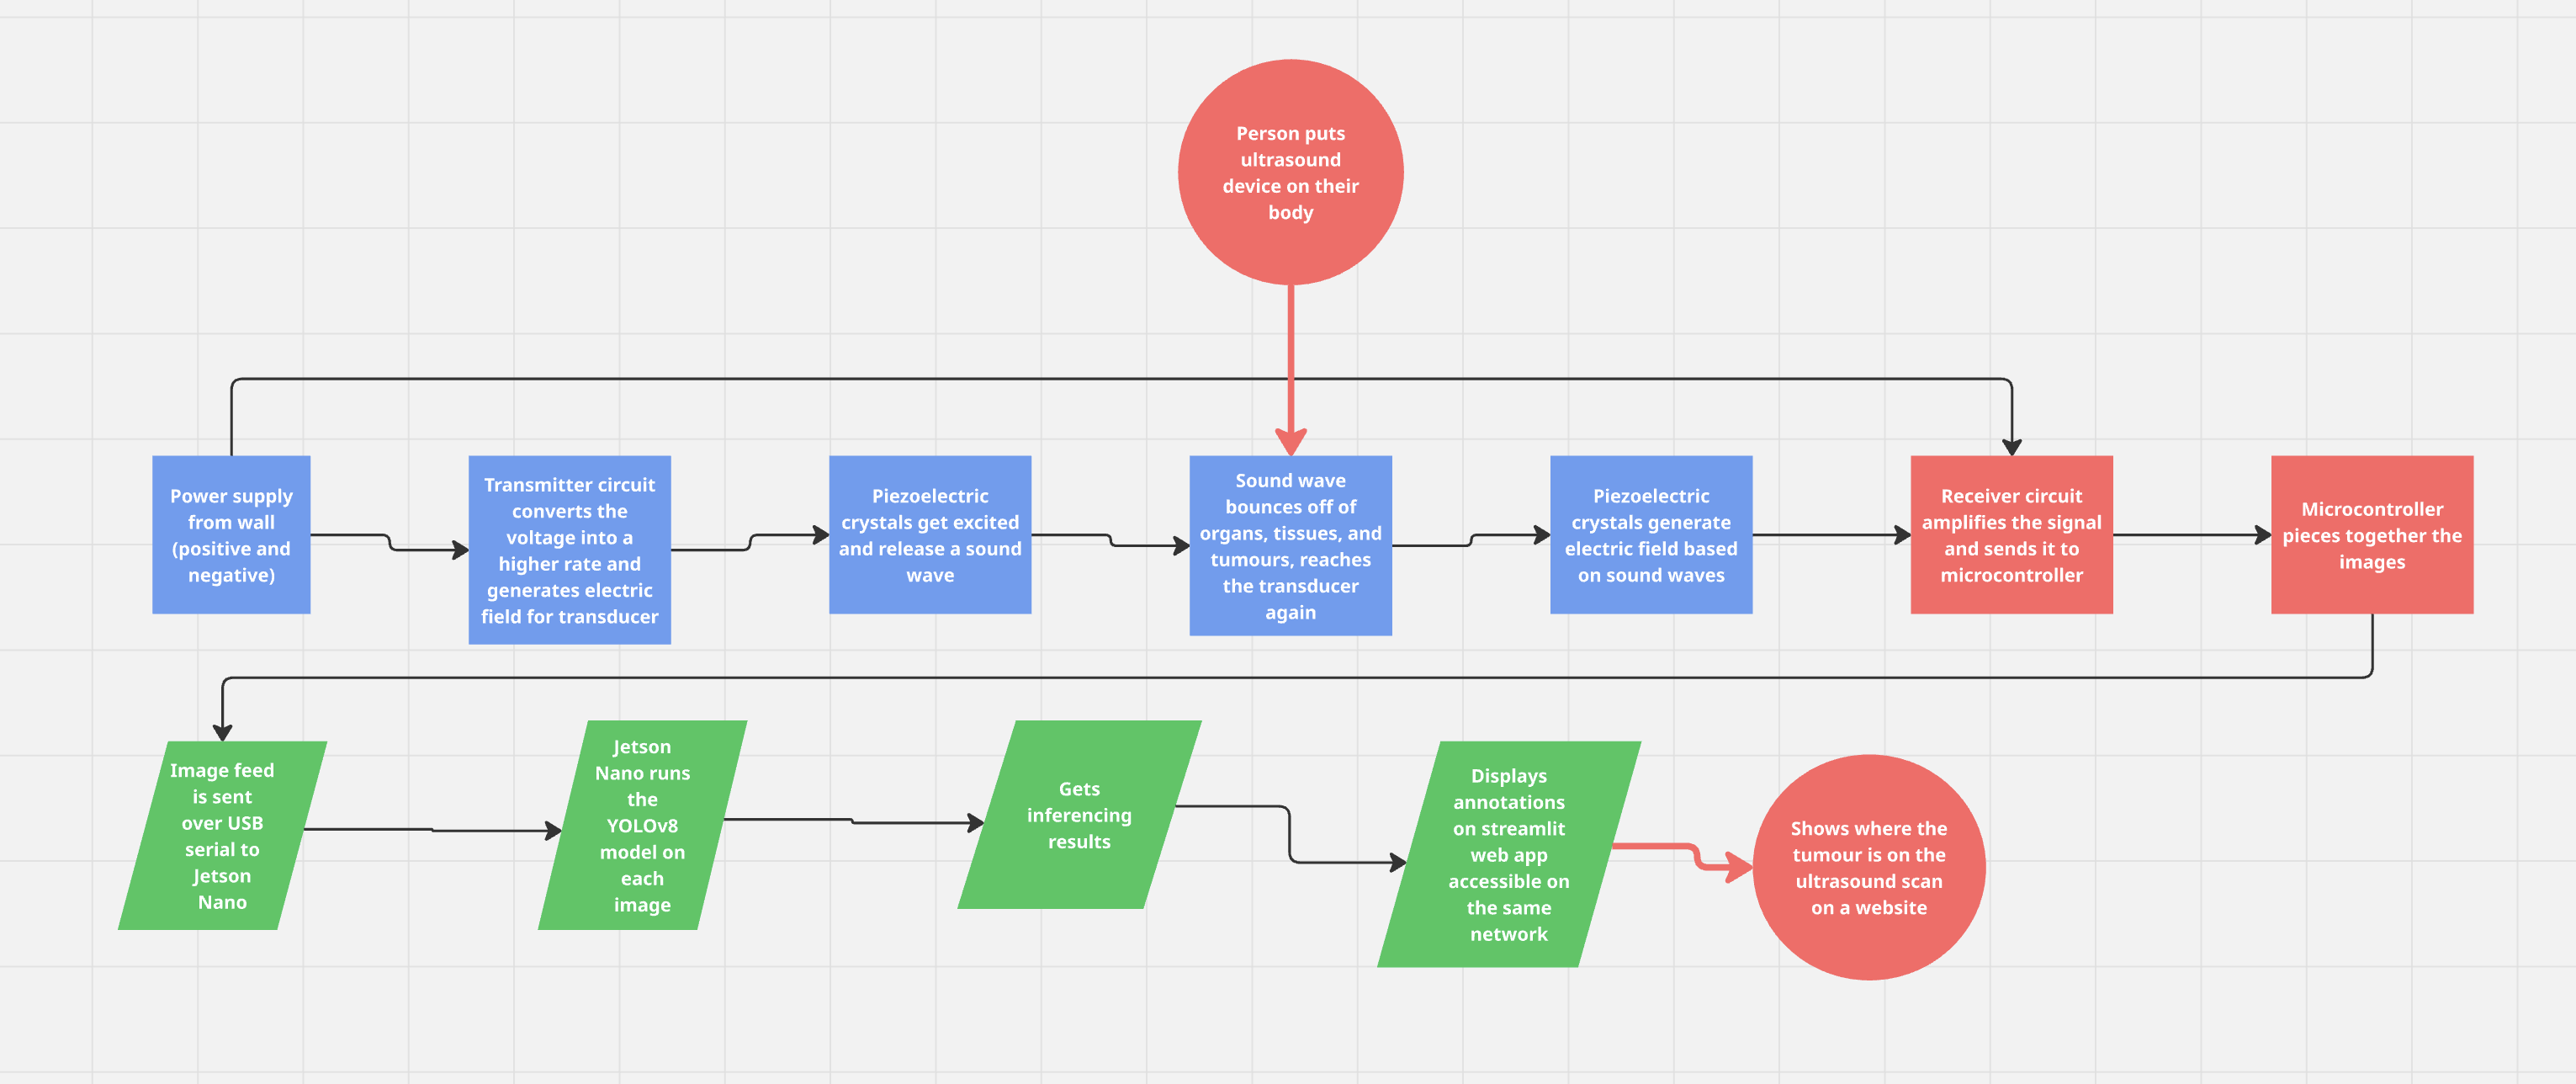
Here is a flowchart detailing the whole process of my device:
Analysis
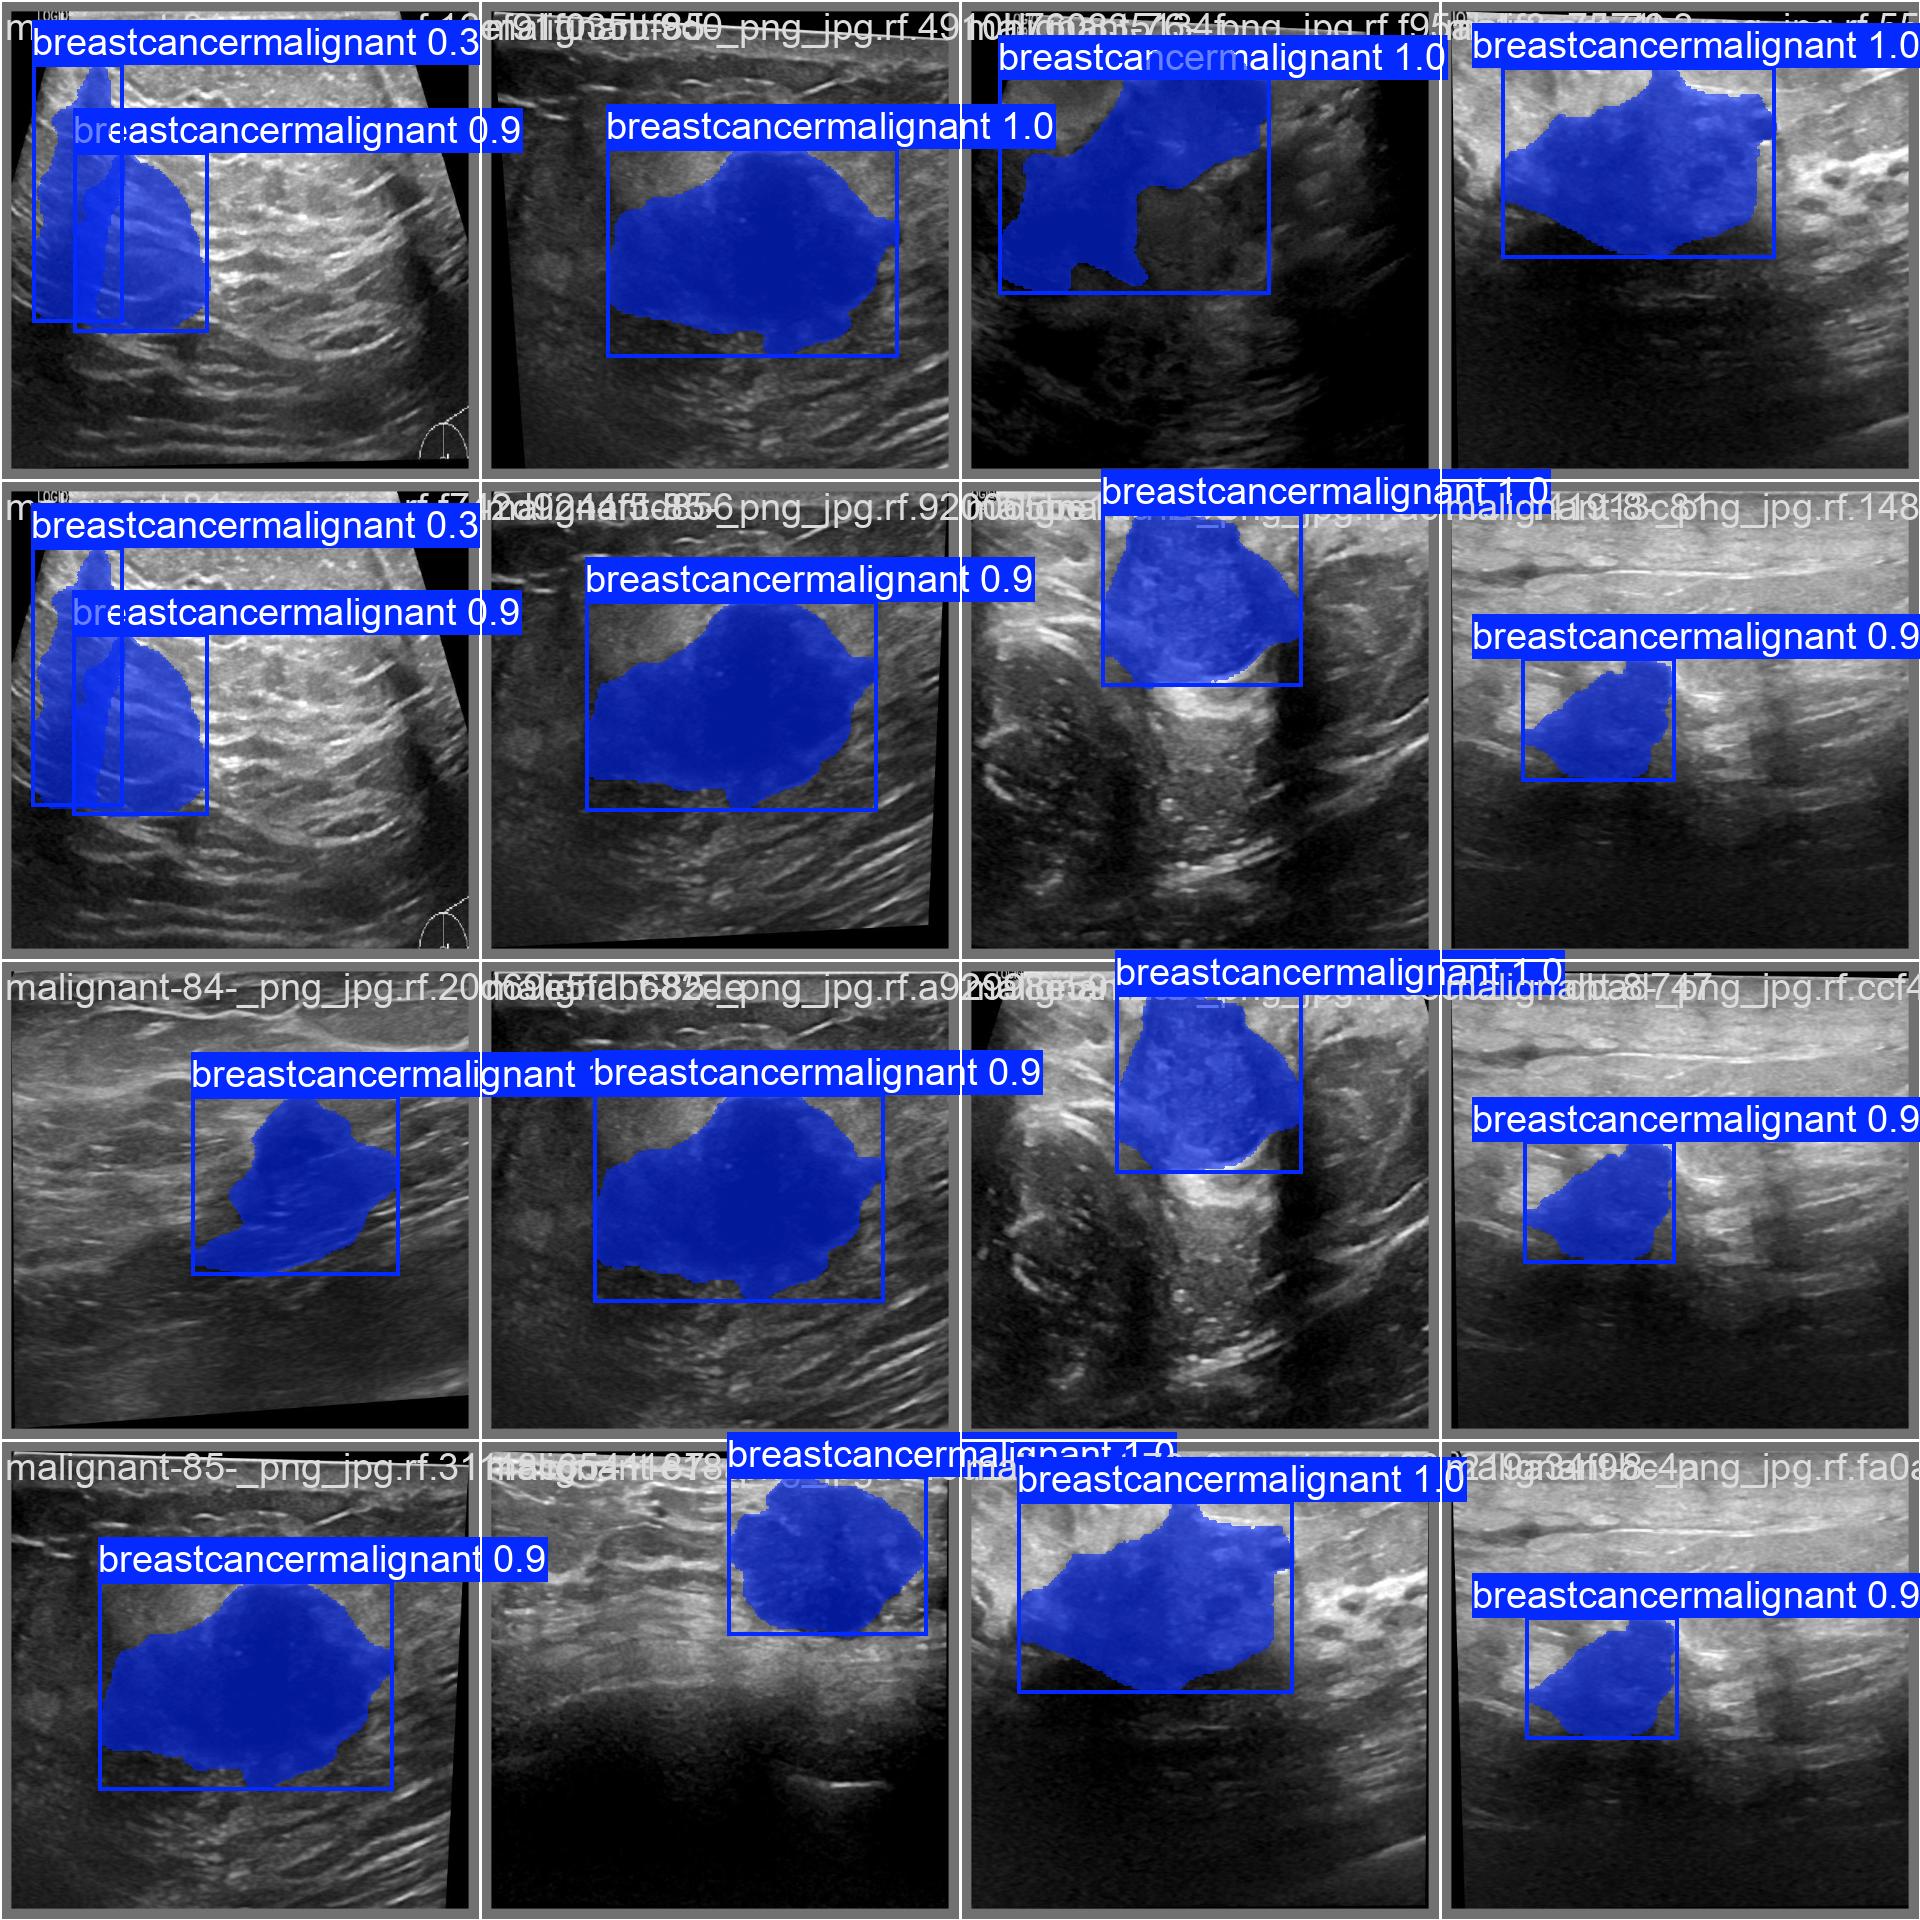
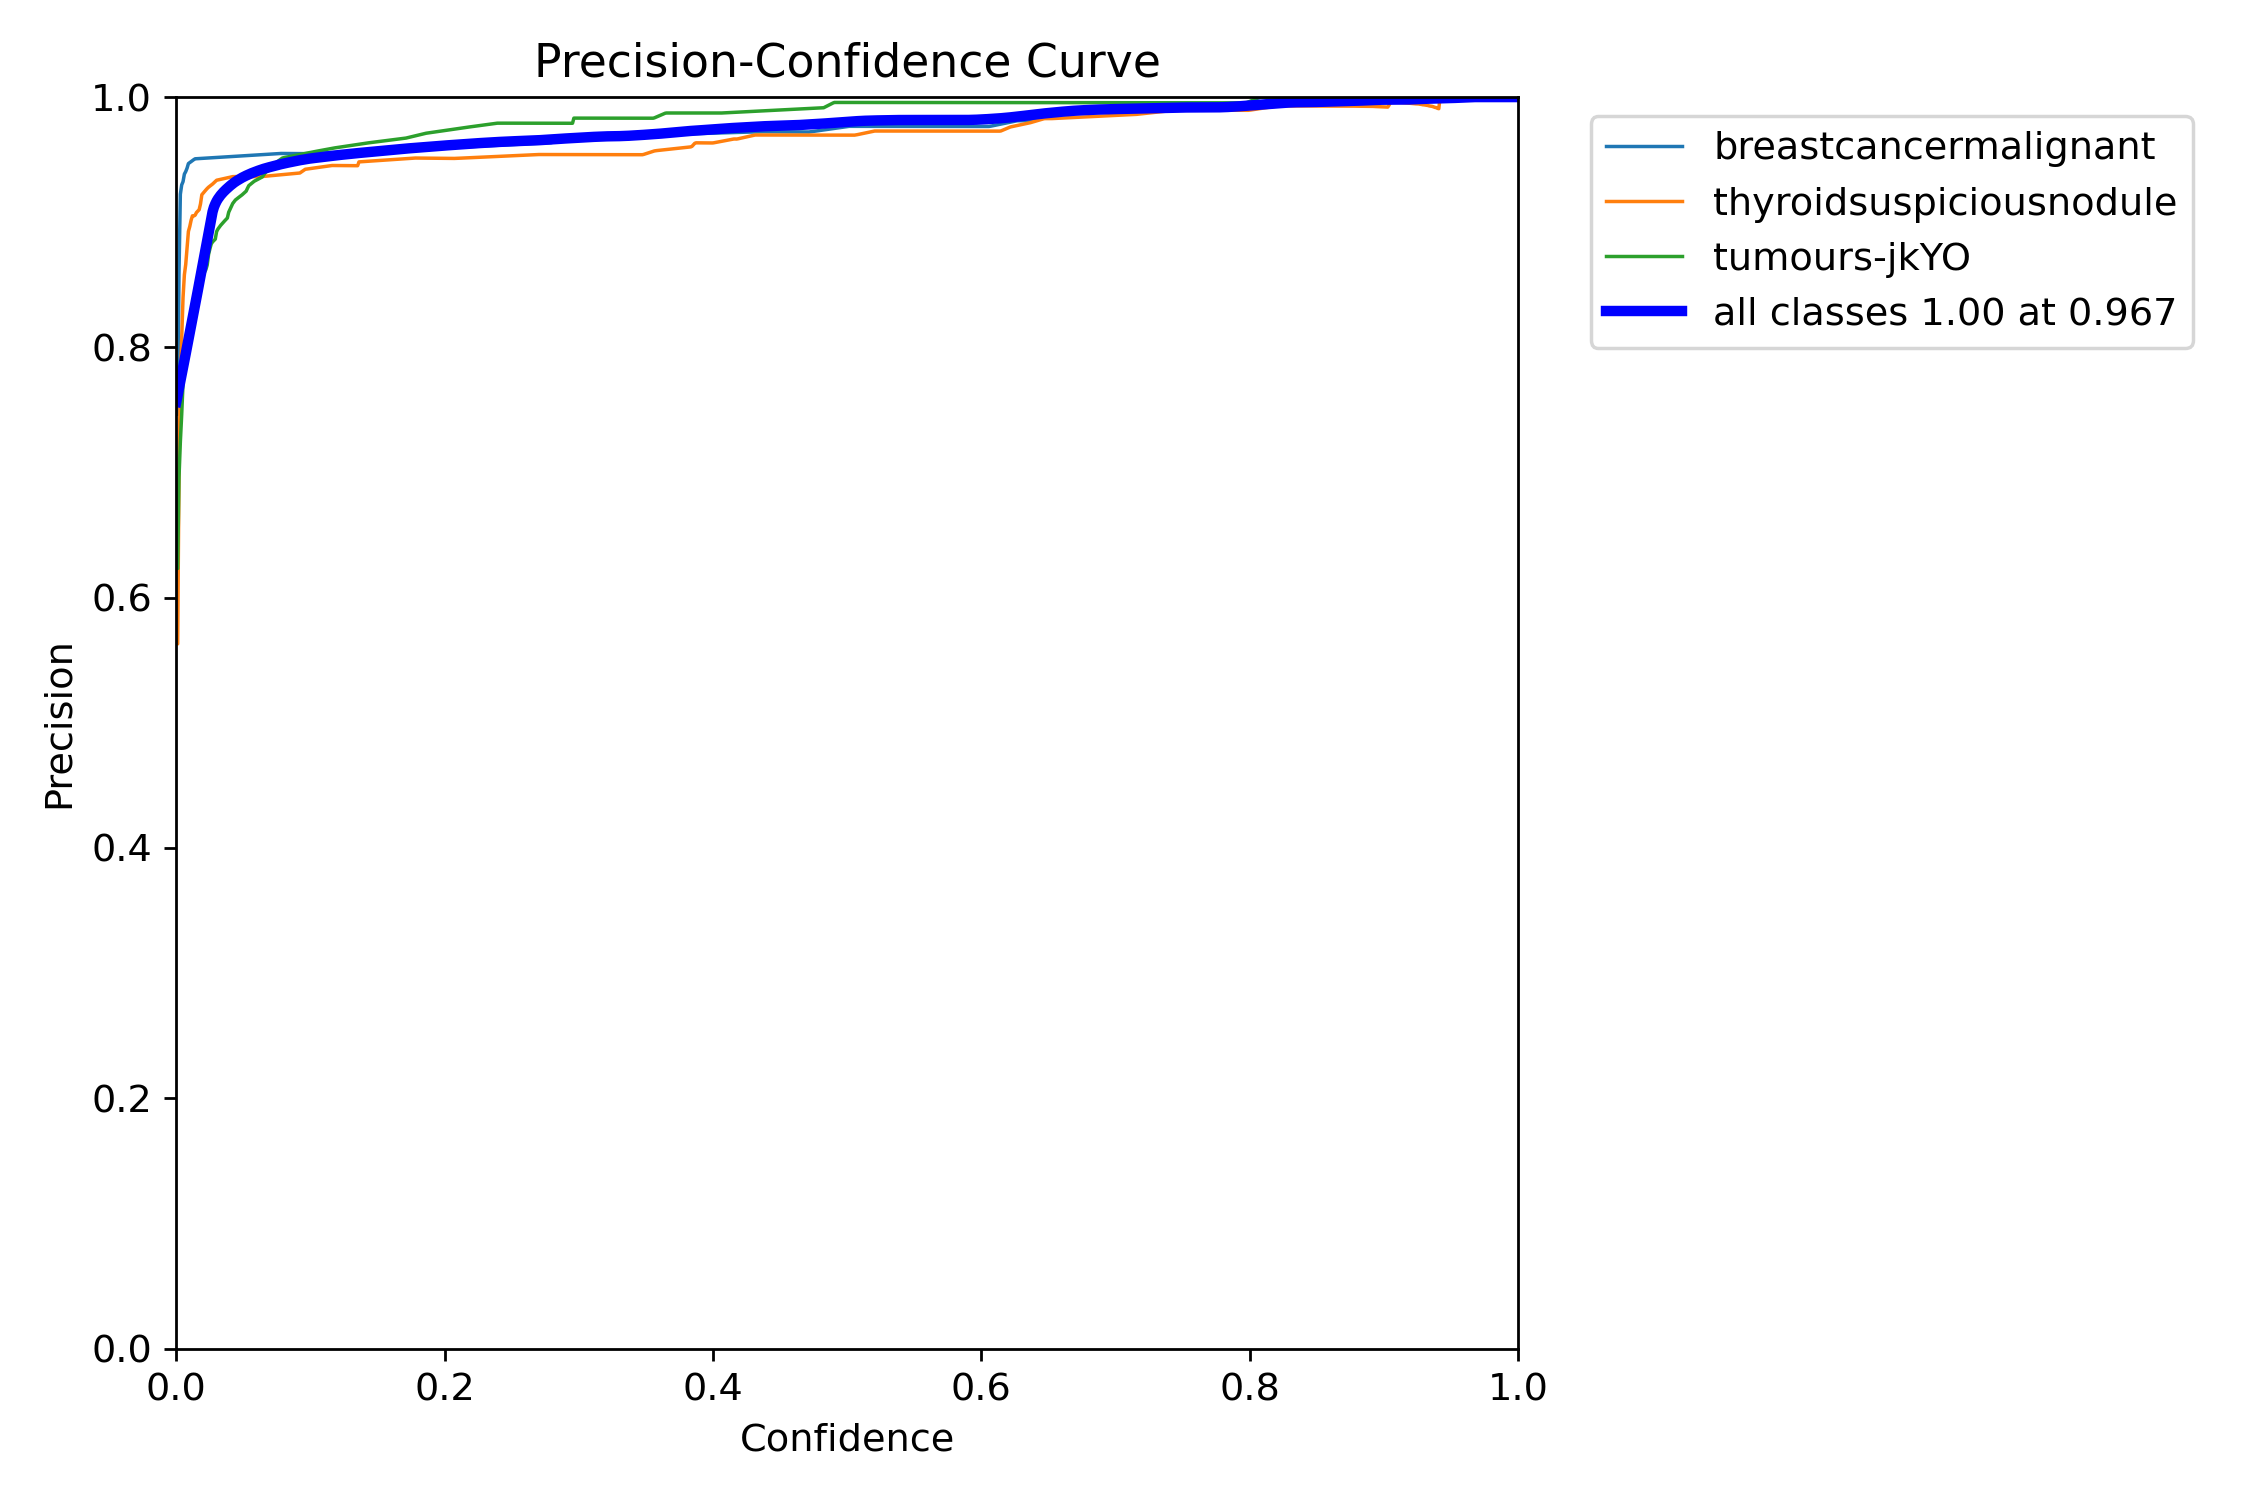
6.0 Results & Analysis
The model that was trained in the YOLOv8n segmentation neural network had quite high accuracies upon the testing phase.
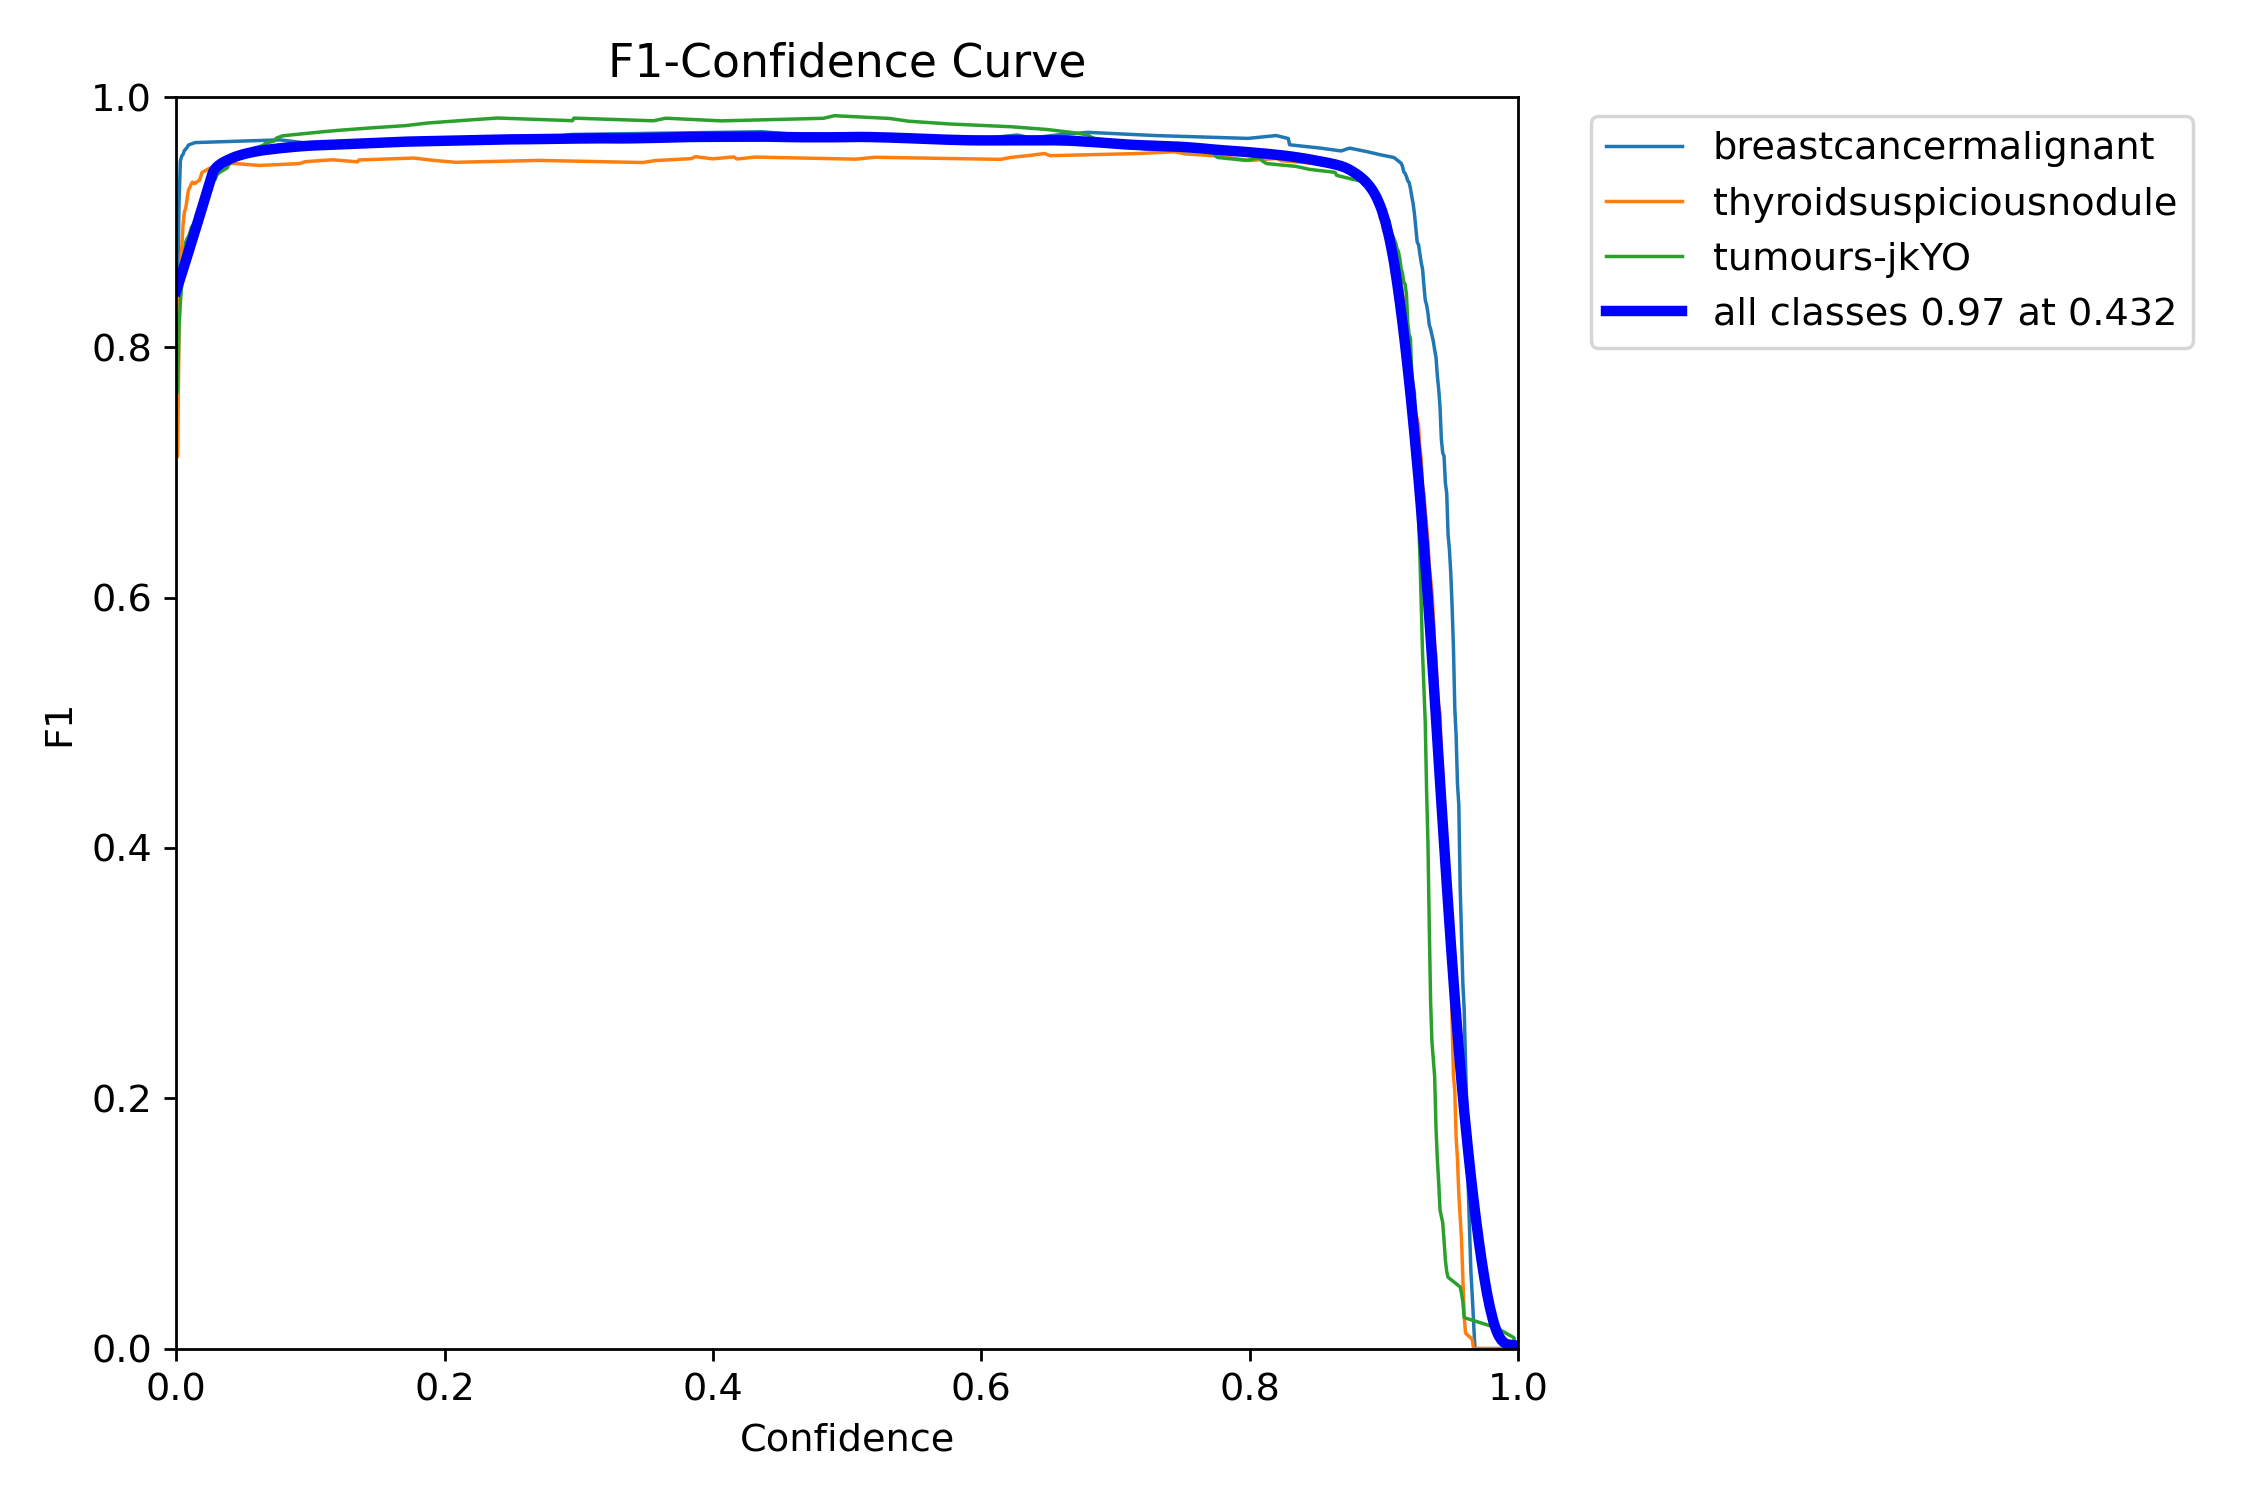
I ended up with an average confidence rate for all classes of 97%, with the precision-confidence curve being really high and stabilizing really well.
My real-time live YOLOv8 object segmentation software is accurate; however, it can lead to false positives. This means that sometimes liver cancers can, in some cases, be classified as thyroid cancers, or sometimes a normal tissue may seem like a tumour to it. False positives arise due to the fact I have trained multiple cancers on the same model, and some structures may cause it to misclassify it.
Additionally, my ultrasound is low-quality, mostly due to the fact that it only utilizes a 5mhz transducer from a paint thinner. However, I was able to simulate a tumour by putting a small marble in a water-filled balloon, which gave me good results and the segmentation model detecting it as a liver cancer tumour (which look similar).
Conclusion
7.0 Conclusion
My multi-cancer portable screener works very well and is very accurate, however there are some issues when put in practical use. For example, the ultrasound is very low quality due to the lack of advanced materials. This is because of a confined budget, such as having a low quality (5mhz) transducer taken from a paint thinner. Additionally, there are latency issues when sending over the real-time ultrasound information from the DIY ultrasound to the Jetson Nano. Even though I had originally wanted to use over the internet and switched to usb serial for faster times, there were still some latency issues, and sometimes it wouldn’t update on the Jetson Nano. Another contributing factor was that the segmentation process would take long on the real-time data, giving an FPS of around 10. Finally, the device also has some false positive issues, as sometimes some cancers or some normal tissues can be classified as cancerous. However, I spoke to Dr. Cenabre, who explained that this is only a screening tool, not to be relied on. “False positives are better than false negatives as you still are able to check for things, and not miss an actual tumour.”
My multi-cancer screening device works much better than traditional machines, as it is faster, doesn’t require experienced professionals, and is easily accessible to communities due to its low price and portability. It displays the possibilities of making advanced, high-tech healthcare machinery accessible to all, even those in remote villages. Now, people are able to find out if they have cancer instantly, and it doesn’t matter how much money they have, what medical devices their clinic has, or if they have a specialist ready. My device ultimately redefines how people in remote communities get access to advanced healthcare.
This essentially can prevent the problem that was viewed earlier- an 85% tumour growth in remote communities during the 11-week period waiting for a diagnosis. With this device, someone thinking they have cancer can get it diagnosed as early as possible- holding the potential for saving millions of lives.
8.0 Future Work
Some future improvements I can do to improve the results of my device would be investing and also improving the dataset. By purchasing a more higher-quality transducer, I would be able to look further within the human body rather than just surface level, and also getting ethics approval would allow me to test on actual organs rather than balloon models. Additionally, improving the dataset with images of more cancers will also help to increase accessibility to all patients, while also keeping it accurate. Finally, a future improvement I want to implement is creating and designing a fully enclosed case, allowing it to be transported easily everywhere.
Citations
American Cancer Society. (2024). Breast cancer staging. Retrieved from https://www.cancer.org/cancer/breast-cancer/detection-diagnosis-staging/staging.html
American Cancer Society. (2024). Liver cancer staging. Retrieved from https://www.cancer.org/cancer/liver-cancer/detection-diagnosis-staging/staging.html
American Cancer Society. (2024). Thyroid cancer staging. Retrieved from https://www.cancer.org/cancer/thyroid-cancer/detection-diagnosis-staging/staging.html
Amin, M. B., Edge, S., Greene, F. L., Byrd, D. R., Brookland, R. K., Washington, M. K., Gershenwald, J. E., Compton, C. C., Hess, K. R., Sullivan, D. C., Jessup, J. M., Brierley, J. D., Gaspar, L. E., Schilsky, R. L., Balch, C. M., Winchester, D. P., Asare, E. A., Madera, M., Gress, D. M., … & Meyer, …
Canadian Cancer Society. (n.d.). Breast cancer staging. Retrieved March 19, 2025, from https://cancer.ca/en/cancer-information/cancer-types/breast/staging
Canadian Cancer Society. (n.d.). Liver cancer staging. Retrieved March 19, 2025, from https://cancer.ca/en/cancer-information/cancer-types/liver/staging
Canadian Cancer Society. (n.d.). Thyroid cancer staging. Retrieved March 19, 2025, from https://cancer.ca/en/cancer-information/cancer-types/thyroid/staging
Cancer Imaging Archive. (2024). TCGA-LIHC: Liver hepatocellular carcinoma dataset. Retrieved from https://www.cancerimagingarchive.net/collection/tcga-lihc/
Eisenbrey, J., Lyshchik, A., & Wessner, C. (2021). Ultrasound data of a variety of liver masses [Data set]. The Cancer Imaging Archive. DOI: https://doi.org/10.7937/TCIA.2021.v4z7-tc39
European Association for the Study of the Liver (EASL). (2018). Clinical practice guidelines: Management of hepatocellular carcinoma. Journal of Hepatology, 69(1), 182–236. https://doi.org/10.1016/j.jhep.2018.03.019
Funsto. (2024). Ultrasonic measuring transducer. Retrieved from https://www.amazon.ca/Funsto-Ultrasonic-Measuring-Transducer-Consumption/dp/B0D8FZLVG4
Jonveaux, L. (2017). Arduino-like development kit for single-element ultrasound imaging. Journal of Open Hardware, 1(1). https://doi.org/10.5334/joh.2
Llovet, J. M., Fuster, J., & Bruix, J. (2004). The Barcelona Clinic Liver Cancer staging system. Hepatology, 37(3), 519–527. https://doi.org/10.1053/jhep.2003.65042
National Cancer Institute (NCI). (2023). Breast cancer treatment guidelines. Retrieved from https://www.cancer.gov/types/breast/patient/breast-treatment-pdq
Piezo Technologies. (2024). Designing an ultrasonic transducer. Retrieved from https://piezotechnologies.com/designing-an-ultrasonic-transducer/
PubMed Central (PMC). (2021). Article on ultrasound and AI in medical imaging. National Center for Biotechnology Information. Retrieved from https://pmc.ncbi.nlm.nih.gov/articles/PMC8700062/
Roboflow. (n.d.). Roboflow: Computer vision made easy. Roboflow. Retrieved , from https://roboflow.com/
Shah, A. (2021). Breast ultrasound images dataset. Kaggle. Retrieved from https://www.kaggle.com/datasets/aryashah2k/breast-ultrasound-images-dataset
University of British Columbia (UBC). (2018, September 4). Could a DIY ultrasound be in your future? UBC breakthrough opens door to $100 ultrasound machine. Retrieved from https://news.ubc.ca/2018/09/could-a-diy-ultrasound-be-in-your-future-ubc-breakthrough-opens-door-to-100-ultrasound-machine/
Acknowledgement
I would like to thank the following professionals for their recommendations and feedback on my project:
- Dr. Cenabre from the Arthur Child Cancer Center for his clinical insights and recommendations.
- Mr. Michael Cole from Active Tech for his insights and feedback on the materials for my project.
- My science fair teachers from my school and my parents for their support.
Without all of you, my project would never have been possible. Thank you all for your encouragement and support.