Bye-Bye Blooms!
Grade 8
Presentation
Problem
Abstract
Introduction
The objective of this innovation project is to create a floating wetland system for the conditions of Alberta. The main purpose of the system is to filter agrochemicals, focusing on nitrate and phosphate removal in bodies of water through the use of plants and phytoremediation. The goal is to create a system that can not only be cheap and sustainable, but also demonstrate effectiveness over reducing nutrients in water bodies.
Problem
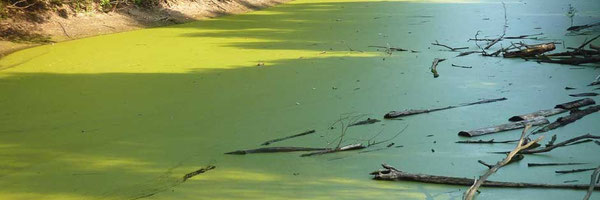
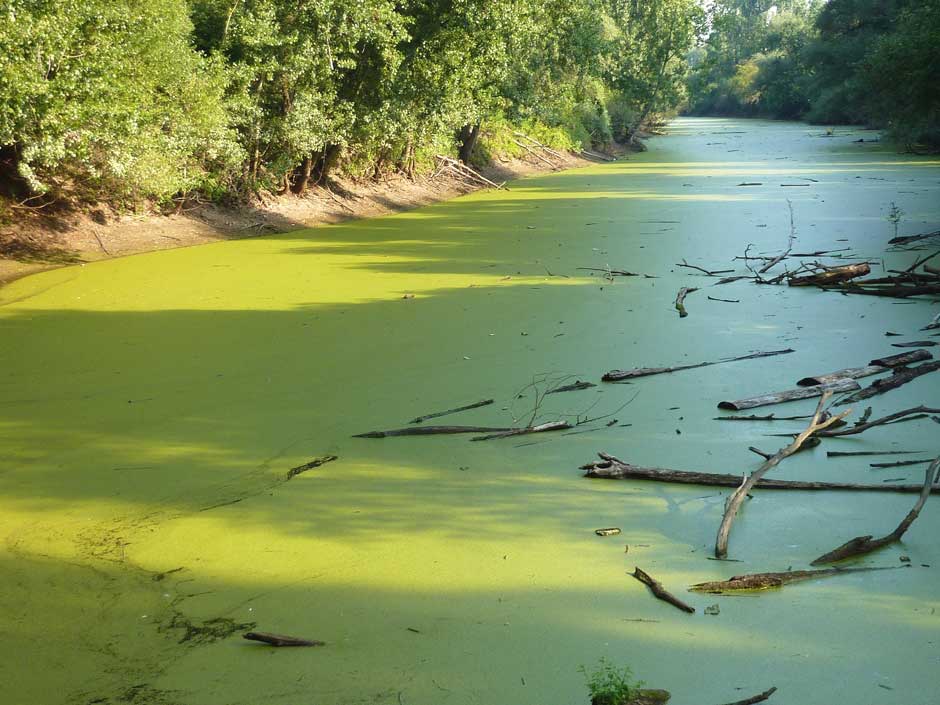
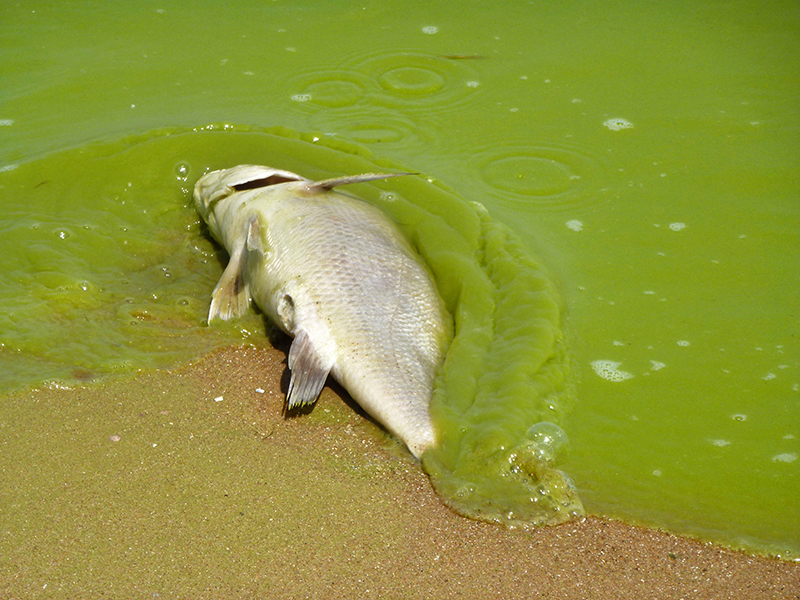
Agricultural runoff often ends up in freshwater ecosystems. This is a significant environmental issue, causing excess nutrients such as nitrogen and phosphorus to enter bodies of water. This has many adverse effects. One of the most devastating impact is eutrophication. This happens when there is an overgrowth of plants, especially algae. As these plants decompose by bacteria, large amounts of dissolved oxygen is used from the water. This causes hypoxic conditions which can significantly impact aquatic life and causes loss of biodiversity. Eutrophication can also have other impacts such as problems to drinking water supply. For instance, algae can often cause water to have unpleasant scents or a murky appearance. Furthermore, cyanobacteria (also known as blue-green algae), may release toxins which can be harmful to both humans and aquatic life. Excess nutrients can also cause bioaccumulation which can pose challenges to ecosystems as a whole.
Runoff happens for a variety of reasons. Firstly, heavy rainfall and irrigation causes supersaturated soil which then leave as runoff which end up in bodies of water. Impermeable surfaces due to urbanisation have also contributed to significantly more runoff. Deforestation and agriculture also impacts the ability of soil to absorb water. Unsustainable agricultural practices, especially in the proper utilisation of fertilizers, also significantly contribute to runoff entering water. As seen with the above text, it is evident that recent practices have accelerated nutrient pollution in waters. Intensive agriculture to support the growing population, urban expansion, and more extreme weather with climate change is all making this a rising problem, impacting people globally.
Background Research
What is eutrophication?
Eutrophication happens when water sources contain too many nutrients. This can lead to many problems such as oxygen depletion, increased algal growth, and more.
Causes of Eutrophication
Eutrophication has many causes but the primary cause is runoff from agricultural areas, untreated sewage water, and industrial waste. This runoff contains high levels of nutrients such as forms of nitrogen and phosphorus.
Consequences of Eutrophication
|
Algal blooms |
Excessive growth of algae can block sunlight to plant below and as they die and decompose. Bacteria take up lots of oxygen during decomposition which causes oxygen depletion. |
|
Water Quality |
Excessive algal growth makes the water appear murky in colour and gives it an unpleasant odor. |
|
Loss of Biodiversity |
Hypoxic (possibly even anoxic) conditions cause the death of complex organisms that depend on oxygen for metabolism. |
Eutrophication can be prevented with plant buffer zones as well as nutrient management and sustainable agricultural practices. This is important to avoid the significant environmental risks that come with eutrophication.
What are agrochemicals?
An agrochemical is any chemical used in agriculture. The main use of agrochemicals are specifically designed and used to increase crop yields, prevent disease in crops, prevent weeds and pests, and improve soil fertility. Some examples include herbicides (used for managing weeds), pesticides (used for managing pests and disease), fertilizers (used to provide essential nutrients to plants), and fungicides (used to prevent/combat fungal infections).
Agrochemicals are essential in optimizing crop yields. This ensures food security for the growing population. However, there are some potential health risks. Acute pesticide poisoning, respiratory illnesses, and chronic conditions are some of the health risks associated with agrochemical use.
What is Nitrate?
Naturally occurring in low concentrations inside of soil, air, water and some foods, nitrate is a substance that is made out of nitrogen and oxygen
Nitrate may also occur in man-made forms such as in industrial applications and in agriculture. It is required for animals and plants to thrive. For plants, it acts as a form of nitrogen which helps to produce amino acids which are the building blocks of proteins. It also helps to produce chlorophyll in plants. In animals, nitrogen helps make up nucleic acids and help to form various proteins. It has no detectable colour, taste or smell in drinking water.
Drinking water with high levels of nitrate, specifically 50 mg/l can cause diseases such as baby blue syndrome in young infants. This happens when nitrate interferes with hemoglobin and turns it into methemoglobin. This interferes with oxygen transfer and causes the infant to turn blue. This has significant health risks too such as even brain damage and death. Nitrate may be absorbed into the blood which can interfere with oxygen transfer.
Nitrate reaches drinking water in a variety of ways. Nitrate is highly soluble meaning that it easily dissolves in water. Because of this, it is easy for it to transport through soil to groundwater. It then can reach various bodies of water through runoff from agricultural, domestic and industrial sites. Sources of contaminants include:
- decomposing plants
- too much fertilizer
- animal waste
- waste water
- septic tanks
What is Bioremediation?
Bioremediation is the use and application of living organisms to purify various types of pollutants. For example, contaminants and toxins in water, soil and other natural environments. Bioremediation may be applied for aspects such as contaminated ground water and oil spills.
Bioremediation works by stimulating the growth and productivity of certain microorganisms that utilise contaminants for energy. These microorganisms can create harmless products such as carbon dioxide and water.
Bioremediation requires a mix of the correct temperature, nutrients, and food. When the organisms are not placed in the correct environment, the efficiency of pollutant degradation reduces. Because of this, certain “amendments” may be made to accelerate the degradation process.
There are two types of bioremediation:
|
Type |
Definition |
|
In situ |
|
|
Ex situ |
|
The bioremediation process may take up to several months to years depending on various factors such as size of contaminated area, temperature, concentration of contaminants, and the type of bioremediation process (In Situ or Ex Situ).
The Advantages of Bioremediation
Because it utilises natural methods, it reduces the damage done to ecosystems. In general, bioremediation has a much lower impact on the environment and animals than other cleaning methods. Furthermore, it is also normally cheaper than normal methods because of the reduced labour and substantial equipment required. The process of bioremediation also usually produces safe byproducts.
In Alaska, in 1989, the Exxon Valdez oil spill occurred. It ended up spilling around 11 million gallons of oil. During the time, bioremediation was gaining lots of attention. Because of this, over 100 000 pounds of fertilizer was applied and by 1992, the fertilizer helped boost the microbes, and had degraded all of the oil. Another example of bioremediation is compost because it reduces the amount of trash going into landfills.
The Types of Bioremediation
|
Type |
Description |
|
Biostimulation |
|
|
Bioaugmentation |
|
|
Intrinsic Bioremediation |
|
|
Mycoremediation |
|
What is agricultural pollution?
In unsustainable agriculture, pollutants are causing a huge threat to the water supply of humans. Agriculture is one of the leading causes of water pollution. Modern agriculture causes the discharge of various factors such as organic matter, agrochemicals, and sediments making their way into bodies of water.
During the time that followed the 2nd world war, there was a large boom in the agricultural industry. Global sale of pesticides went from around $1 billion to $35 billion in one year. 99% of human deaths caused by pesticide use however, occurs in developing countries.
Irrigation is the world's largest producer of agricultural-related water waste. 115 million tons of mineral nitrogen fertilizers are given to crops each year. Around 20% of these fertilizers end up in soils or biomass and around 35% end up in oceans.
Furthermore, livestock production increased as well. Livestock numbers have tripled since 1970. This leads to increased organic matter in the drinking water of humans.
Aquaculture is now also responsible for releasing fish excreta, uneaten feed, fungicides, and antifouling agents in waters.
laws, reducing food waste, and minimizing pesticide use are ways that agriculture pollution could be reduced.
What is Runoff?
When there is excess water present in soil, runoff occurs. The runoff flows across the surface and reaches various bodies of water such as ponds, creeks and streams. This runoff may occur naturally but also due to human activities.
One example of runoff snowmelt. When mountains and foothill soils cannot absorb water from heavy snowfall, it leaves as natural runoff and forms lakes, rivers and other bodies of water. glaciers, snow and rain all cause natural runoff.
Soil erosion is also another process of natural runoff. Ih natural erosion, toxic chemicals may still enter waterways. For example, the toxic gasses from volcanoes may return to water or soil through precipitation.
Runoff caused by human activities come in two forms, point sources and Nonpoint sources and enter the ecosystem with runoff. In point sources, is when pollution is directly released in a water way. Nonpoint source pollution is when runoff does not go directly in a waterway. One huge example of this is agriculture. In agriculture, however, pesticides and fertilizers are usually also carried into waterways.
Impervious surfaces such as roads, sidewalks and parking lots make it difficult for water to absorb, making runoff more prominent. Soaps, litter and spilled gas may all become runoff.
Runoff can ruin an entire ecosystem. Small microorganisms, like algae and plankton, absorb pollutants in the runoff, then larger fish feed on these organisms, birds later feed on these fish. This creates an increasing level of pollution in their bodies. In this process, known as biomagnification, increases the amount of pollutants in an animals’ body. This can become a threat to human civilization as well.
To solve the problem, people must limit pollution and farmers can use less fertilizer. Amounts of impervious surfaces should also be reduced in urban areas. Furthermore, it is beneficial for communities to plant native vegetation as plants prevent erosion and runoff entering waterways.
What is fertilizer?
Soil fertility is the quality of a soil that describes its ability to provide various compounds in adequate amounts to plants. fertilizer is a natural or artificial substance. They contain chemical elements that improve the quality of soil and in turn improve the growth of plants. Fertilizer either enhances or replaces chemical elements in soil.
Fertilizer is usually added to soil when the quality of the soil is reduced or diminished. Synthetic fertilizers or natural fertilizers such as compost may be added to improve the fertility of the soil.
Synthetic fertilizers
Most modern fertilizers use the three nutrients; nitrogen, phosphorus and potassium. These are considered the most important nutrients for plant growth
Most nitrogenous fertilizers are obtained from synthetic ammonia.8 This is used as either a gas, in a water solution, or is converted into a salt. Urea is also a type of nitrogenous fertilizer as well one of the most concentrated and cheapest. Phosphorus fertilizers normally come from calcium phosphate which is obtained from bones or phosphate rock. Potassium fertilizers like potassium chloride or potassium sulfate are mined from potash deposits.
Mixed fertilizers are also commonly used. They consist of more than one type of essential nutrients. For mixed fertilizers, a grade is used to express the percentage quantity of each nutrient. Ex. 10-20-10.
What is Soil, and How Does Soil Erosion Impact Freshwater?
Soil is a biologically active part of the crust of the Earth. It makes the uppermost surface. Soil is essential as it acts as a reservoir for water, nutrients and filtration. I also support the carbon cycle and other elements.
Though exacerbated by human activities, soil erosion is a natural process. It normally occurs because of factors such as water, wind, ice, or gravity. In water, raindrops break the bond that holds soil together. This soil later leaves as surface runoff. Sheet erosion and rill erosion are the most common types of erosion.
When soil erodes in excessive amounts, it may come with many adverse effects. Firstly through this process, it is likely that nutrient-rich topsoil will be lost, leading to less crop yields. Furthermore, sediments often end up in various water bodies. This causes increased water turbidity, damaged aquatic habitats and disturbed flow of water, affecting both the quality of the water and aquatic life.
Nutrient pollution from nitrogen, phosphorus and potassium which are usually naturally present in soil, may end up in water bodies. This increases algae growth and depletes water oxygen levels. This can lead to the death of aquatic life and contamination of drinking water.
Topsoil also contains pesticides, insecticides, herbicides and fertilizers. This further increases the threat to human water supply as well as aquatic life and ecosystems.
What are Pesticides?
Pesticides are a large and diverse group of chemicals that are used to kill pests or reduce the damage done by the pest. Insects, mice, unwanted plants (weeds), fungi, bacteria, viruses, and other unwanted animals are examples of organisms for which pesticides are used. Pesticides may also be used for a variety of other tasks such as acting as a drying agent (desiccant), modifying plant growth (regulator), and causing a plant to drop its leaves completely (defoliant)
Though pesticides include a large variety of chemicals, the below table lists some of the most common types of pesticides.
|
Type |
Purpose |
Examples |
|
Insecticides |
Repels or kills ticks, insects, and mites. |
|
|
Herbicles |
Kills weeds and unwanted plants |
|
|
Fungicides |
Kills various types of fungi including mould and mildew |
|
|
Rondenticles |
Kills mice, rats and other rodents |
|
|
Disinfectants |
Kills mould, bacteria, and mildew |
|
|
Wood preservatives |
Protects wood from insects and fungi |
|
Pesticides are classified into families they either share a chemical property with or act in a similar way in terms of impacting the pest.
Below is a table of some common types of families
|
Name of Family |
Characteristics |
Examples |
Chemical structure |
|
Organophosphates |
|
|
|
|
Organochlorines (Chlorinated Hydrocarbons) |
|
|
|
|
Carbamates and Thiocarbamates |
|
|
Carbamates: O-organyl Thiocarbamates (1) S-organyl Thiocarbamates (2) |
|
synthetic/pyrethroids |
|
|
|


From the above chart, two families of pesticides are the least likely to degrade, synthetic and organochlorine.10
Pesticides are created in liquid, gaseous or solid forms. This is necessary to know because some forms are more toxic than others. For example, liquid may be absorbed quicker than powder into the skin. Adjuvants can be added to a spray solution, changing how much it sticks and gets absorbed into the skin. Pesticides may also contain inert ingredients apart from the one or two active ingredients. Inert ingredients may also be harmful. Because of the possible harmful effects, it is important to store and use pesticides with caution and proper research.
Currently, there are various laws and regulations in Canada to support the proper use of pesticides. The federal government ensures that all pesticides are registered through the Pest Control Products Act (PCPA). This system is re-evaluated every fifteen years based on new data and scientific discoveries. The provincial and territorial governments ensure safe use, transportation and storage of pesticides. They are also responsible for looking at training, certification, licensing or vendors, growers, and applicators. The provincial/territorial government is also responsible for looking after incidents such as spills. Municipal government state bylaws for the use of pesticides. For example, many have banned the use of pesticides for “aesthetic” purposes. 11
What is Phosphate and Nitrate pollution?
Plants need nutrients such as nitrogen and phosphorus but most of these elements found in waterways are due to human activities including the use of fertilizers. When crops are given excessive amounts of fertilizer, it seeps into groundwater and reaches various water bodies. This is known as runoff and has a bad impact on the environment.
Nutrients are chemical elements that act like food for plants, animals and humans. Phosphorus and nitrogen are among the most abundant nutrients. When there are excessive nutrients, algae, which feed on these nutrients, grow and dirty the surface of water. When too much algae starts to decay it may also lead to bad water taste and smell. The decomposition of the algae done by bacteria also consumes water which sometimes leads to the death of fish and other aquatic animals.
The most common type of pesticide are herbicides in the agricultural industry. Twelve out of the top 25 active ingredients in pesticides are herbicides. Other common active ingredients include fungicides, fungicides, and insecticides, accounting for four, five, and two, respectively, of the top 25 active ingredients. Glyphosate is the most common active ingredient while Chlorothalonil is the most common fungicide active ingredient.
What is the Phosphorus Cycle?
Phosphorus is one of the most important elements for all living organisms. It is an important part of ATP which is important for metabolic processes. It is also part of DNA and RNA.
Phosphorus is in soil as both organic and inorganic substances. Soil contains low amounts of phosphorus and only a limited amount of it is available to plants. Phosphorus usually moves by diffusion. In acidic conditions, phosphorus (P) reacts with calcium, iron, magnesium, and aluminum to become less soluble in water.
The Phosphorus cycle describes the process by which phosphorus moves through the biosphere, lithosphere, and hydrosphere. The phosphorus cycle goes as the following:
Weathering
The main source of phosphorus is found in rocks, hence why the start of the phosphorus cycle is in weathering. various sources of erosion such as rain result in phosphorus ending up in soil.
Absorption by Plants
Organisms such as fungi and plants absorb the phosphorus from the soil. Animals may also absorb phosphorus from drinking water or eating plants. Some of this phosphorus may also end up in bodies of water.
Return to The Environment
When plants and animals pass away, they return to the soil via decomposition, plants and fungi then reuse this phosphorus, repeating step two of the process.
Humans significantly impact the phosphorus cycle. Fertilizers, for example, add to the phosphorus levels in soil. This is especially detrimental to aquatic life. When phosphorus is naturally added to water, it is known as eutrophication. This amount of nutrients is good for the water but when too much phosphorus reaches water due to human activities, artificial or anthropogenic eutrophication. When too many nutrients are present in the water, it can cause excessive algae growth. This algae either dies or forms algal blooms. This harms aquatic life.15/16
What are the differences between the different forms of nitrogen in water?
Some key forms of nitrogen in water include nitrate (NO₃⁻), nitrite (NO₂⁻), ammonia (NH₃), and ammonium (NH₄⁺). These are classified as inorganic nitrogen and are bioavailable, meaning they are easily utilized by organisms in the water. Nitrate and nitrite are oxidized forms of nitrogen, while ammonia and ammonium are considered reduced forms, meaning they contain nitrogen in a lower oxidation state and can more easily donate electrons in chemical reactions. The balance between ammonia and ammonium depends on the pH of the water, with ammonia (NH₃) being more common in higher pH levels, and ammonium (NH₄⁺) more prevalent in lower pH. Organic nitrogen, which comes from decaying plant and animal matter, is also present in water bodies. The total nitrogen content in freshwater includes both organic nitrogen and inorganic forms like ammonia, ammonium, nitrate, and nitrite. From fertilizers, ammonium and nitrate are the most common types. Urea is also common but eventually breaks down into ammonium and nitrate.
Below is an image showing various sources of nitrogen:

What types of organisms change or remove these different forms of nitrogen from the water?
- Micro algae
- they can remove nitrogen compounds such as ammonium and nitrate and turn them into biomass18
- Denitrifying bacteria
- convert nitrate into nitrogen gas, this process is called denitrification
- common genera:
- Thiobacillus denitrificans,
- Micrococcus denitrificans
- some species of
- Serratia, Pseudomonas, and Achromobacter
- Wetland Plants
- They take in inorganic nutrients through the roots and/or foliage. Around 10-20 percent of pollutants absorbed is released back into the wetland through bioaccumulation but this is relatively than other removal processes
- Bacteria also plays a huge role in this process
- In the end, harmless nitrogen gas is released back into the atmosphere. The main transformation processes:
- ammonification
- nitrification
- denitrification
- it is one of the most important processes in cleaning fertilizer pollution as nitrate is a common part of agricultural run off
- Examples of Wetland Plants:
- Hornwort (Ceratophyllum demersum) - global distribution
- because of its rapid growth rate, it takes up many nutrients
- may exhibit weed-like growth
- produces biochemicals to inhibit phytoplankton and algal growth
- Cattails (typha spp.) - Mostly in The Northern Hemisphere
- exists along the edge of many large fresh-water bodies of water in the Northern Hemisphere
- Tolerable of partial submersion
- generally efficient because of fast growth rate
- Soft rush (Juncus effusus)
- Thrives in Edges of Ponds
- Has been shown to aid in the purification of agricultural runoff
- Roots and the surrounding biofilm efficiently take up nitrogen and phosphorus compounds
- Has the tendency to become invasive because of its fast metabolism20
- Hornwort (Ceratophyllum demersum) - global distribution
What are the differences between the different forms of phosphorus in water?
- Inorganic Phosphorus
- Orthophosphate
- often found in fertilizers and normally enters water bodies from agricultural runoff
- Readily available for biological uptake (bioavailable)
- Simplest form of phosphate
- Condensed Phosphate
- complex
- eventually break down to Orthophosphate
- often used in detergents and water treatment processes
- Orthophosphate
- Organic Phosphorus
- enters water bodies because of decomposition of any organic matter
- significant part of phosphorus cycle
What types of organisms change or remove these different forms of phosphorus from the water?
Because Orthophosphate is very bioavailable, many different types of plants can absorb this type of phosphorus easily. Some examples include Cattails, Algae, and Water Hyacinth (Eichhornia crassipes). All of these species not only purify water from phosphorus but also nitrogen in the form of ammonium or nitrate.
What are Wetlands?
A wetland is an area of land that is either saturated with water or is covered with water, for at least part of the year. Wetlands are known as transition zones. They are neither completely wet nor dry. Wetlands may be created by groundwater, sea water, as well as a river or lake.
The vegetation that grows in wetlands is adjusted to the hydric soil and different vegetation is determined by how saturated the water is. Plants living in wetlands are known as hydrophytes. Occasionally dry wetlands or wetlands with slow-moving water support the growth of trees whilst ones that are consistently flooded.
Wetlands can be found everywhere in the world except for Antarctica. They can be as large as salt marshes or as small as prairie-potholes. Some major examples of wetlands include: swamps, peatlands, sloughs, marshes, and bogs.
Wetlands have many benefits. During heavy rains. They absorb excess water. They can protect coastal communities from storm surges. They can also filter Nitrates and other chemicals that make it into wetlands from farms. Pollutants not absorbed eventually settle into the soil and form sediment.
Many wetlands have been destroyed because removing them was an accepted practice until recently. Wetlands used to be looked at as a useless area of land, being hard to build on and containing many pests such as insects and crocodiles. Nearly half of the Wetlands in America have been destroyed. 23
What are Algal Blooms?
An algal bloom, also known as algae blooms occur when there is a rapid accumulation of algae. This can be recognised by a discoloration of the water due to the algae’s pigments. They are caused by nutrients from various sources such as fertilizer runoff and nutrient pollution. Algal blooms can deplete the oxygen levels in the water and some blooms may also release toxic byproducts.24
How do wetlands purify water?
Wetlands, known as the kidneys of our watershed, are water purifiers that are able to filter sediments and other toxic chemicals. In developing areas, oftentimes, excess nutrients from fertilizers end up in bodies of water. This can cause eutrophication. The cost to filter water can range between 298.1 billion to 344.8 billion. This cost can be heavily reduced. For example, updating wastewater facilities can cost $8.56/lb of nitrogen while conserving wetlands costs 3.10/lb of nitrogen, reducing the cost by over half.

Wetlands do this by slowing the flow of water. This not only prevents erosion but also allows any sediment to settle at the bottom, acting as a natural filter. Wetlands are also able to prevent downstream flooding. Furthermore, the roots of the plants absorb any nutrients in the water. Plants also absorb CO2, which is a greenhouse gas.

There are many physical processes that happen in wetlands. For example, physical processes of nutrient removal in which the particle settles (sedimentation), volatilization (releasing the nutrient as gas into the atmosphere), and sorption (when two substances attach). There are also chemical processes that involve changing nutrients from one form to another. This includes chemical precipitation. Biological processes are assimilation (uptake, when organisms, such as bacteria, plants, and algae use the nutrients). All these processes occur in various areas of the wetland and contribute to the purification of water. 25/26

Will chlorella be a good fit for this project?
Chlorella
- According to studies done in 2016 and 2012, using chlorella to remove phosphate and nitrate is highly effective
- A 2016 study looked at how two types of microalgae, Spirulina platensis and Chlorella vulgaris, can remove nitrate and phosphate from water. The researchers added different amounts of nitrate and phosphate (0.25, 0.35, and 0.45 g/L) to water samples and measured how much the algae was removed over 8 days. Chlorella vulgaris removed the most nitrate, 89.80%, at the lowest concentration (0.25 g/L), while Spirulina platensis removed 81.49% at the same concentration. For phosphate, Spirulina platensis removed 81.49% at the highest concentration (0.45 g/L), and Chlorella vulgaris removed 88% at the same level. The study showed that both types of algae significantly reduced nitrate and phosphate, with Chlorella vulgaris performing better overall.
- in 2016 study, Chlorella vulgaris removed 89.80% of the 0.25g/L and 88% 0.45g/L (KNO3, K2HPO4) in eight days potassium nitrate and dipotassium phosphate
- The 2012 study looked at using a type of algae, Scenedesmus sp., trapped in gel sheets to clean dirty water by removing harmful nutrients like nitrogen and phosphorus. The scientists found that the amount of algae in the gel was really important. With the right amount, they were able to remove 99.1% of nitrogen after 105 minutes and all of it after 135 minutes. They also removed all of the phosphorus in just 15 minutes. The system worked well over nine cycles in 21 days, showing it could be a good way to clean water.
- 89.80% nitrate, 98.81% ammonia-nitrogen 100% phosphorus-orthophosphate (Chlorella Vulgaris)29
- A 2016 study looked at how two types of microalgae, Spirulina platensis and Chlorella vulgaris, can remove nitrate and phosphate from water. The researchers added different amounts of nitrate and phosphate (0.25, 0.35, and 0.45 g/L) to water samples and measured how much the algae was removed over 8 days. Chlorella vulgaris removed the most nitrate, 89.80%, at the lowest concentration (0.25 g/L), while Spirulina platensis removed 81.49% at the same concentration. For phosphate, Spirulina platensis removed 81.49% at the highest concentration (0.45 g/L), and Chlorella vulgaris removed 88% at the same level. The study showed that both types of algae significantly reduced nitrate and phosphate, with Chlorella vulgaris performing better overall.
What are indicators for early algal blooms?
- Fish Assemblage - the variety and amount of fish in a water body
- The variety/amount of fish can signify the quality of water because they are easily affected by temperature, dissolved oxygen, pH, and more
- Nitrogen/phosphorus
- From fertilizer, atmospheric deposition, and runoff. Stimulates algae growth and may cause algal blooms
- Dissolved oxygen
- DO is one of the main measurements of water quality
- DO levels less than 5 mg/L - stressful for fish
- DO levels less than 3 mg/L - too low for fish to live.
- DO levels below 1 mg/L are considered hypoxic and usually can not support any life at all
- DO is one of the main measurements of water quality
- Plant community
- They can easily signify nutrient enrichment, turbidity, etc.
- Water clarity
- Waters naturally may be turbid but fertilizer runoff, sediments, and more can cause even more turbidity.
Method
Unfortunately, I could not upload all the images. Please visit my logbook for additional images related to this section.
Designing the System
After months of research and exposure to different fields, doing a project about water is highly beneficial to the world.
Water pollution is a huge problem. This project may focus on agricultural pollution.
A possible project idea is a water filtration system:
objective of the project: create a water filtration system that tackles agricultural pollutants such as pesticides, soil and fertilizer through the use of nanoparticles, chemical catalysts and various microorganisms.
There are many factors to consider with this innovation.
-
What materials are needed?
-
How will the different parts of the filtration be separated? By layers? If so, how will I build the layers themselves?
-
How will I test for the purity of the water?
water purity may be tested using the following:
-
PH strips
-
Phosphate detection kits
-
Pesticide testing kit
-
Dissolved oxygen testing kit
Whilst coming up with project ideas, I created a few very rough sketches of what the final product may look like:

Above, is the first sketch I had made of my prototype, though it does need a large amount of adjustments.

The same day I had also made a slightly more detailed sketch of my initial idea. It was clear from the beginning that some aspects of the prototype needed a lot of edits, the tube mechanism, for example, was something I did not like at that moment.

Later on, I considered the idea to include buckles and rubber to keep the different layers air-tight. Overall, the concept of this design was to create a filtration system people could use at their homes specifically for agrochemicals.
However, this did not make sense for a variety of reasons. For example:
-
One could simply use a multi-purpose filter which would work for agrochemicals
-
It would be a cost-effective way to target the source itself.
From the above ideas, two main designs were created:
-
Creating a floating filter system.
-
Creating a filter system that diverts water to another area to be filtered.
In the floating system, the idea is to keep it floating so that it would not disturb aquatic life below. This is one of the most essential aspects to consider. To ensure that the design stays afloat in water, the aerodynamics of it must be considered. Motors may also be included in this design.
In the Water Diversion system, water will be directed to the filtration system and redirected to a cleaner area. It will likely use gravity to collect the water and divert it. It will also make use of many pipes.
Both systems will make use of the “external testing area” which will be a part of the filtration system where the water is tested for nitrate, PH, turbidity and TDS. This is important to ensure that the system is functioning properly.
|
Type of Filtration system |
|
||||||||
|
Floating |
Water Diversion |
||||||||
|
Diagram: |
Diagram: |
||||||||
|
|
|


In the end, the floating filtration system was chosen because it will most likely work better for what this is being designed for. This is because the water filtration system is not meant to be a permanent solution, instead, it is a way to purify currently-polluted water. Having flexibility in terms of moving the filter makes it easier to stop the use of it when the time comes. Furthermore, this design has limited interference with underwater wildlife. These are the reasons as to why this design was chosen in the end. However, there are some problems with the floating system:
-
Water re-pollution
-
Aerodynamics
-
Noise Pollution
Originally the plan was to use sensors and an arduino to examine the purity of the water before release but after a discussion with a professional, it was realised that using aquarium test kits is cheaper and more accessible. However, I still want to include AI in the design and I am currently considering using AI to somehow reduce the disturbance to animals. Possibly for aquatic animal behavioural monitoring?
Another idea which may be included into the final design is a turbine to generate hydroelectric power alongside solar panels.
This system produces electricity as well which may be beneficial to people.
This design uses AI, solar panels, a turbine for hydroelectric power generation and aquatic plants for bioremediation and nutrient absorption. The most space is given to the plants because bioremediation is one of the main focuses for the project. There are a few options for the plants that will be used. Some examples that are being considered include: Cattails, Algae, and Bulrush. A mixture of multiple plants will likely be used for biodiversity and to further replicate a natural environment. Though a Raspberry Pi would have to be used, AI can be applied to the project to avoid the filter disturbing the natural environment. This will be done by pattern identification and avoiding areas where many aquatic animals pass through. Solar panels and turbines can be used to generate electricity not only for the system but the energy may also be stored and used for other purposes such as powering appliances in homes.
However, after some further consideration, it was realised that turbines will not work in this specific system because the most nutrients and agrochemical pollution actually end up in waters that are primarily static. For example, lakes and wetlands. Because of this, it would be immensely difficult to make much significant contributions to electricity generation.
Later, I decided to remove the AI and motor along with the methods of renewable energy such as the solar panels and turbine. This is because in Alberta, water has strong circulation. So, if the system is deployed in one area, it can purify the entire lake. Also, AI can make the system much more expensive. Removing AI will make the system more accessible to people who could not afford expensive technology.
The design above is the filter that utilises only plants and other abiotic factors such as pebbles, gravel, sand, and charcoal. The sand was moved to the end of the plant section to slow the speed of the water flow and charcoal was kept at the end to absorb any potential toxic chemicals from the plants.
Why was hornwort, cholera, and bulrush chosen?
For this system, resilient, hardy, and fast growing plants were required. Hornwort is an aquatic plant that grows extremely quickly. It is often used to reduce nitrogen, phosphorus, and its forms in aquariums, furthermore it is very common in Alberta. Bulrush is an emergent plant. It is one of the most common wetland plants in Alberta and is very effective in reducing nutrients in water. Cholera is a type of algae. Though I may face some problems with out-competing bulrush and hornwort, Cholera is the fastest at reducing nutrients in this list. A study was done showing these results: Cholera was able to reduce close to 90% of nitrate at a concentration of 0.25 g/L over the course of eight days
To make the system even more simple and affordable, many aspects were removed. This is the most cost effective design so far. This involves the use of plants such as hornwort and bulrush as well as abiotic factors like rocks and bottles for buoyancy. In this design I also decided to remove the algae because the chances of the algae blooming are high and also have a chance of out-competing the main plants which will affect the system’s ability to reproduce its plants in the lake/wetland.
It was also determined that, in a real application, the system would have to be deployed from mid-late spring until fall. This is because spring is when farmers use the most fertilizer. A lot of this ends up in waters, requiring additional support of this system.

Later on, this design was created. It made use of charcoal instead of pebbles. The pebbles were removed to reduce weight. Charcoal is great at reducing many forms of pollutants. Other than this change, most aspects were kept the same.

Unfortunately, it was impossible to bulrush during December. Because of this I resorted to using a floating plant, duckweed as a replacement. Duckweed is very fast growing and can double the size within two days. This also means that duckweed absorbs nutrients very quickly. However, problems related to the duckweed escaping may be faced with the design preceding this. Also, in the same design, the use of floating plants can drastically reduce the light the hornwort can receive. Because of this, I had the idea of creating various sections made of plastic water bottles to house different plants. Through doing so, the hornwort can still easily receive light.
The charcoal is placed in the center of nine bottles which have been cut. The hornwort/bulrush is placed around the charcoal. Plastic bottles are used throughout the system which is actually cheaper than the previous design.
Estimating the cost:
-
24 plastic water bottles cost roughly $3.27. 13 were used for the system. Cost: $1.77
-
Charcoal. Cost: $4.17
-
4.17 + 1.77 = 5.94 Total cost for one system: roughly $5.94
Five dollars is extremely cheap. Roughly 100x less money to build a real wetland.
Final Method
Required Materials
Abiotic components:
-
Components of the FWS
-
Abiotic Components
-
Charcoal (8-10 pieces)
-
4400 cm^2 of stainless steel woven wire
-
13 plastic water bottles
-
Several zip-ties
-
-
Biotic components:
-
-
Bulrush
-
Hornwort
-
Nitrifying bacteria
-
Testing Setup
-
2 Plastic tubs with a capacity of at least 29L
-
Any liquid fertilizer that contains a 10-15-10 ratio
-
Water
-
One pack of phosphate aquarium testing kits
-
One pack of nitrate aquarium testing kits
-
Timer
-
One pack of ammonium test kits
-
One pack of ammonia nitrogen test kits
-
One pack of pH test kits
-
One pack of Free Chlorine test kits
-
Access to a computer for data collection
-
Secchi Disk
-
Any disk (a play dough cap was used in this experiment)
-
A permanent marker
-
String
-
Weighted object
-
-
-
Tools
-
Measuring spoons for measurement
-
Spoons for dissolving
-
Ruler
-
Pencil
-
Camera or device with a camera
-
Compass
-
Scissors
-
Weighing scale to measure mass
-
-
Safety Equipment
-
Several pairs of gloves
-
Building the FWS
-
Gather the following equipment:
-
Charcoal
-
2200 cm^2 of stainless steel woven wire
-
2 plastic tubs with a capacity of at least 29L
-
13 plastic bottles
-
Scissors
-
zip-ties
-
Phone for a camera
-
Compass
-
Plants
-
Preferably, choosing plants native to one's area is beneficial
-
For this project hornwort and duckweed was used
-
-
Nitrifying Bacteria
-
-
Assemble the base
-
Cut 13 plastic water bottles in half so that each will be around 10 cm tall.
-
Using the bottom part of the plastic water bottles, remove the bottom of each bottle to create a “tube”
-
Use the “tube” parts of the plastic water bottles and attach 9 of them into a 9x9 grid as such (using a drill to make holes on the sides and zip-ties to attach the bottles together):
-
-
On all of the bottom of each bottles, place metal mesh, cut to measurements of 3 cm x 3 cm
-
This is to act as something for the plants to “grab” onto, without using soil.
-
-
Repeat step “2d” two more times
-
Gather four additional plastic bottles
-
Attach four of the bottles to the outside of the 9x9 plastic water bottle gird using gorilla glue
-
-
Repeat step “2f” on all of the grids of plastic water bottles.
-
-
Adding Biotic and Abiotic elements
-
Firstly, insert the Abiotic elements.
-
Inside the middle hole with metal mesh on the bottom, add the bag of charcoal
-
Insert Biotic Elements
-
Measuring starting height of the plants
-
In one system:
-
Transplant the hornwort into 4 holes of the system as such:
-
-
In the 4 other holes, transplant the duckweed.
-
-
-
Setting up testing
-
Fill 2 buckets with about 25.85 litres of water
-
Add exactly 12.5 mL of liquid fertilizer to each bucket
-
Using a spoon, dissolve the Miracle Gro powder by stirring until the water appears clear
-
-
Place the buckets in areas with good sunlight
-
Make a 1 x 2 grid with the buckets, as such:
-
-
In front of each bucket, add a sign to signify the types of testing (with system, without system, only hornwort, only bulrush)
-
Measure phosphate and nitrate levels using aquarium testing kits
Testing
-
In one bucket, the finished floating wetland system. Leave one bucket empty.
-
Add Nitrifying bacteria to each bucket
-
Make daily observations
-
Record the height of the plant every day
-
Make qualitative observations based on the health of the plants
4. After one week:
-
Measure and record the turbidity of the water using the secchi disk made earlier
-
Measure and record the phosphorus and nitrate levels in the water using aquarium testing kits
5. Repeat steps “2a - 2b” every week for two weeks
Data Collection 1.0
Quantitative Observations
System deployed bucket:
|
Variable |
Day 0 (12/30/2024) |
Day 7 (01/06/2024) |
Day 14 (01/13/2024) |
|
Ammonium (ppm) |
0 |
100 |
0 |
|
Nitrite (ppm) |
0 |
0 |
25 |
|
Nitrate (ppm) |
0 |
5 |
0 |
|
Free chlorine (ppm) |
0 |
0.5 |
0 |
|
Hardness (ppm) |
0 |
0 |
0 |
|
Total Alkalinity (ppm) |
0 |
240 |
240 |
|
pH |
7.6 |
7.8 |
7.6 |
|
Sodium Chloride (ppm) |
0 |
0 |
0 |
|
Ammonia Nitrogen (ppm) |
0 |
0 |
0 |
|
Phosphate (ppb) |
400 |
70 |
0 |
|
Turbidity (NTU) |
10.3 |
10 |
10 |
Control bucket:
|
Variable |
Day 0 (12/30/2024) |
Day 7 (01/06/2024) |
Day 14 (01/13/2024) |
|
Ammonium (ppm) |
0 |
50 |
0 |
|
Nitrite (ppm) |
0 |
3.5 |
50 |
|
Nitrate (ppm) |
0 |
15 |
0 |
|
Free chlorine (ppm) |
0 |
2 |
0 |
|
Hardness (ppm) |
0 |
0 |
0 |
|
Total Alkalinity (ppm) |
0 |
240 |
240 |
|
pH |
7.6 |
7.8 |
7.6 |
|
Sodium Chloride (ppm) |
0 |
0 |
0 |
|
Ammonia Nitrogen (ppm) |
0 |
0 |
0 |
|
Phosphate (ppb) |
400 |
125 |
150 |
|
Turbidity (NTU) |
10.3 |
10 |
10 |
Growth of Plants
*For hornwort and duckweed, the numbers refer to the bottle they were kept in:
|
Date |
12/30 |
12/31 |
01/01 |
01/02 |
01/03 |
01/04 |
01/05 |
01/06 |
01/07 |
01/08 |
01/09 |
01/10 |
01/11 |
01/12 |
01/13 |
|
Hornwort (cm) |
1. 15 2. 15 3. 15 4. 15 |
1. 15 2. 15 3. 15 4. 15 |
1. 15 2. 15 3. 12 4. 15 |
1. 15 2. 12 3. 13 4. 11.5 |
1. 10.5 2. 13.5 3. 11.5 4. 11 |
1. 9.5 2. 0 3. 15 4. 0 |
1. 0 2. 0 3. 0 4. 0 |
1. 0 2. 0 3. 0 4. 0 |
1. 0 2. 0 3. 0 4. 0 |
1. 0 2. 0 3. 0 4. 0 |
1. 0 2. 0 3. 0 4. 0 |
1. 0 2. 0 3. 0 4. 0 |
1. 0 2. 0 3. 0 4. 0 |
1. 0 2. 0 3. 0 4. 0 |
1. 0 2. 0 3. 0 4. 0 |
|
Duckweed |
1.5% |
AVG: |
AVG: |
AVG: |
1.6% |
1.9% |
2.1% |
1.3% |
AVG: |
AVG: |
AVG: |
AVG: |
AVG: |
4.1% |
4.1% |
Qualitative Observations
Official testing began on Dec. 30, 2024 and ended on Jan. 13, 2024.
|
Date |
Observations |
|
12/17/2024 |
|
|
12/18/2024 |
|
|
|
|
|
12/19/2024 |
|
|
12/20/2024 |
|
|
12/21/2024 |
|
|
12/22/2024 |
|
|
12/23/1014 |
|
|
12/24/2024 |
|
|
12/25/2024 |
|
|
12/26/2024 |
|
|
12/27/2024 |
|
|
12/28/2024 |
|
|
12/29/2024 |
|
|
12/30/2024 |
|
|
01/01/2025 |
|
|
01/02/2025 |
|
|
01/03/2025 |
|
|
01/04/2025 |
|
|
01/05/2025 |
|
|
01/06/2025 |
|
|
01/07/2025 |
|
|
01/08/2025 |
|
|
01/09/2025 |
|
|
01/10/2025 |
|
|
01/11/2025 |
|
|
01/12/2025 |
|
|
01/13/2025 |
FINAL TESTING DAY
|


Data collection 2.0
As part of science, it is important to continue testing innovations to guarantee and prove function. Because of this, the system is being tested again with a few changes:
- Increase volume of water
- Clear buckets
- Increased testing time
Quantitative observations
System deployed bucket:
|
Variable |
Day 0 (02/23/2025) |
Day 3 (02/26/2025) |
Day 6 (03/01/2025) |
Day 9 (03/04/2025) |
|
Ammonium (ppm) |
0 |
0 |
0 |
0 |
|
Nitrite (ppm) |
0 |
1 |
2 |
5 |
|
Nitrate (ppm) |
3 |
25 |
50 |
100 |
|
Free chlorine (ppm) |
0 |
0 |
0 |
0 |
|
Hardness (ppm) |
125 |
0 |
0 |
0 |
|
Total Alkalinity (ppm) |
240 |
240 |
240 |
240 |
|
pH |
7.6 |
7.6 |
8 |
7.8 |
|
Sodium Chloride (ppm) |
0 |
0 |
0 |
0 |
|
Ammonia Nitrogen (ppm) |
0 |
0 |
0 |
0.5 |
|
Phosphate (ppb) |
0 |
0 |
0 |
0 |
|
Variable |
Day 12 (03/07/2025) |
Day 15 (03/10/2025) |
Day 18 (03/13/2025) |
Day 21 (03/16/2025) |
|
Ammonium (ppm) |
0 |
0 |
0 |
0 |
|
Nitrite (ppm) |
5 |
7 |
6 |
3 |
|
Nitrate (ppm) |
150 |
250 |
250 |
200 |
|
Free chlorine (ppm) |
1 |
2 |
5 |
3 |
|
Hardness (ppm) |
0 |
0 |
0 |
0 |
|
Total Alkalinity (ppm) |
240 |
240 |
240 |
120 |
|
pH |
8 |
8.6 |
8.4 |
8 |
|
Sodium Chloride (ppm) |
0 |
0 |
0 |
0 |
|
Ammonia Nitrogen (ppm) |
0 |
0 |
0 |
0 |
|
Phosphate (ppb) |
200 |
300 |
350 |
100 |
Control bucket:
|
Variable |
Day 0 (02/23/2025) |
Day 3 (02/26/2025) |
Day 6 (03/01/2025) |
Day 9 (03/04/2025) |
|
Ammonium (ppm) |
0 |
75 |
75 |
75 |
|
Nitrite (ppm) |
0 |
0 |
1 |
1 |
|
Nitrate (ppm) |
6 |
5 |
5 |
4 |
|
Free chlorine (ppm) |
0 |
0 |
0 |
0 |
|
Hardness (ppm) |
125 |
0 |
125 |
50 |
|
Total Alkalinity (ppm) |
240 |
240 |
240 |
240 |
|
pH |
7.8 |
7.6 |
7.6 |
7.6 |
|
Sodium Chloride (ppm) |
0 |
0 |
0 |
0 |
|
Ammonia Nitrogen (ppm) |
0 |
0 |
0 |
0.5 |
|
Phosphate (ppb) |
0 |
0 |
0 |
0 |
|
Variable |
Day 12 (03/07/2025) |
Day 15 (03/11/2025) |
Day 18 (03/13/2025) |
Day 21 (03/16/2025) |
|
Ammonium (ppm) |
100 |
75 |
100 |
100 |
|
Nitrite (ppm) |
1 |
1 |
1 |
2 |
|
Nitrate (ppm) |
3 |
3 |
5 |
10 |
|
Free chlorine (ppm) |
0 |
0 |
0 |
0 |
|
Hardness (ppm) |
125 |
125 |
125 |
125 |
|
Total Alkalinity (ppm) |
250 |
250 |
240 |
250 |
|
pH |
7.6 |
8.6 |
8.6 |
8.6 |
|
Sodium Chloride (ppm) |
0 |
0 |
0 |
0 |
|
Ammonia Nitrogen (ppm) |
0.5 |
0.5 |
0.5 |
0.5 |
|
Phosphate (ppb) |
50 |
100 |
100 |
150 |
Qualitative observations
|
02/23/2025 |
|
|
02/24/2025 |
|
|
02/25/2025 |
|
|
02/26/2025 |
|
|
02/27/2025 |
|
|
02/28/2024 |
|
|
03/02/2025 |
|
|
03/05/2025 |
|
|
03/09/2025 |
|
|
03/011/2025 |
|
|
03/14/2025 |
|


Analysis
The project aims to address agrochemical runoff, particularly by exploring nutrients. Excessive runoff can lead to eutrophication and ecosystem degradation. By optimizing both function and cost, this system has the ability to make significant contributions to environmental preservation and sustainable water management. The two main goals of the project were optimizing function and cost. These goals were proven to be achieved through a series of successful experiments and data analysis. This will be further discussed in this section.
Function Analysis 1.0
Firstly, the function will be examined. Through the observation and analysis of various nutrients, it was found that this system was efficiently reducing many different forms of nitrogen and phosphorus efficiently. Secondly, the cost aspect will also be explored to provide further insights into the effectiveness of the system. Analysis of individual aspects:

pH was measured. Before testing, it was expected that pH could provide insights into the nutrients available in the water due to the fact that pH impacts many chemical reactions as well as living organisms in water systems. For example, in highly acidic conditions, certain nutrients may become too soluble, and in basic conditions, essential nutrients may precipitate and become unavailable. Furthermore, processes like nitrification may impact the pH of the water itself, providing important insights. However, very small changes in the water were noticed. In both buckets, the pH measured 7.6, then increased to around 7.8 and decreased to 7.6 once more. This is a change of roughly only 3% throughout the test. This indicates that the water has a stable pH level. Therefore, the pH did not provide much insight into the effectiveness of the system.

Secondly, the turbidity was also measured. There were small amounts of precipitation during the experiment, likely due to the basic conditions of the water. Turbidity was measured to see if the addition of plants would make any changes to the precipitation of the experiment. However, given that the turbidity was caused by precipitation, there were naturally minimal changes in the turbidity measurements. However, in a real river, measuring turbidity may be highly effective in determining water quality and the impact of plant additions.

Free chlorine is the available chlorine in a water sample. Chlorine is present in some fertilizers as a micronutrient. It can be in many forms, such as potassium chloride or ammonium chloride. Although they do not serve the same purpose as chlorine disinfection in water, they may behave similarly. This can impact the microorganisms in the water, eventually hurting the plants and other aquatic life. This was an essential aspect to measure due to these reasons. From the graph above, the function of my system could easily be understood. By the end of the two weeks, it can be seen that the control bucket had roughly 1 ppm of free chlorine, yet the deployed system had 0 ppm of free chlorine; the control bucket had 100% more free chlorine. In the graph, it is seen that the system was much quicker than the control bucket. Throughout the testing, the control bucket started at 0 ppm of free chlorine rose to roughly 2 ppm the first week and dropped down to roughly 0.5 ppm by the end of the second week. In the deployed system bucket, the free chlorine started at 0 ppm, rose to 0.5 ppm after the first week, and dropped to 0 ppm after two weeks. The control bucket could only reduce 75% of all free chlorine, but the deployed system bucket reduced it by 100%.


Ammonium was also measured. The graph above shows that the deployed system was slower for this nutrient. This is likely because there were more algae in the control bucket than in the system-deployed bucket. This will be further explored in upcoming sections. The control bucket worked better for this specific nutrient because it peaked at a lower ammonium concentration (50 ppm compared to 100 ppm of the system-deployed bucket) and still was able to remove all ammonium without any sharp increases of the nutrient. However, by the end of the two weeks, the system-deployed bucket was still able to reduce ammonium completely. This further proves the function of the system despite having no algae.


Nitrate testing went almost exactly as predicted. As seen in the graph above, the bucket with the deployed system most quickly reduced nitrate with the least extreme spikes in nitrate amounts. The deployed system was also much faster than the control despite the control having more algae. Nitrate levels are likely one of the most important nutrients to measure because they provide direct insight into the efficiency of the plants' and microorganisms' health as nitrate is the easiest nutrient for plants to sequester. Because of this, high nitrate levels can also lead to a greater likelihood of algal blooms and eutrophication.

Phosphorus is the easiest identifier of whether an algal bloom will occur. The most common type of phosphorus in fertilizers is orthophosphate. It is extremely difficult to find test kits for primarily orthophosphate so a test kit to identify phosphate was used. The graph above, provides the best insight into the function of the system, showing the reduction of the phosphate in comparison to the algae and bacteria in the control bucket. This can be proven because the control bucket, had an average reduction of 28.57 ppb per day while the control reduced only about 17.86 ppb per day. The system was approximately 60% higher.
Function Comparison Between Various Nutrients
|
Variable |
Control Peak |
Deployed Peak |
|
Phosphate (ppb) |
400 |
400 |
|
Nitrate (ppm) |
15 |
5 |
|
Nitrite (ppm) |
50 |
25 |
|
Ammonium (ppm) |
100 |
50 |
|
Free Chlorine (ppm) |
2 |
0.5 |

Although the above graph is not a great way to compare phosphate, the peak heights give insight into the efficiency of the system compared to the control bucket and algae. In the graph, the higher the bar, the worse the performance. This is because the bucket with the highest peak has the most amount of nutrients. This graph proves that the control bucket was only able to perform better in sequestering ammonium. This is because algae prefer this form of nitrogen over even nitrate. This is because nitrate has a higher energy requirement for assimilation. Nevertheless, the system was still able to completely reduce ammonium despite having much less algae.
Average Growth of Hornwort
|
Date |
12/30 |
12/31 |
01/01 |
01/02 |
01/03 |
01/04 |
01/05 |
01/06 |
01/07 |
01/08 |
01/09 |
01/10 |
01/11 |
01/12 |
01/13 |
|
Hornwort (cm) |
15 |
15 |
14.25 |
12.875 |
11.625 |
6.125 |
0 |
0 |
0 |
0 |
0 |
0 |
0 |
0 |
0 |


The growth of hornwort was the least successful aspect of this project. As seen in the graphs above, the height of the hornwort reduced and broke apart by the end. This was due to the lighting situation. The hornwort was kept in buckets like these:

As seen in the image above, the box is completely black which lets almost no light inside of the bucket. A solution to this would be using a clear bucket next time. However, it was very difficult for me to find the same size bucket for an affordable price. Throughout the second week, I had to add some more hornwort into the system.
Growth of Duckweed:
The growth of duckweed is very hard to measure because of the large amount of individual fronds making it very difficult and time-consuming to measure each one individually. Because of this, an estimation kwon as a grid-based estimation was used. In this method, a grid is placed on top of a photograph of the duckweed and it is estimated how much duckweed fills the individual squares of the grid. The number is then divided by the total number of squares, in this case 900. Below is the rough estimate of the amount of duckweed throughout the two weeks. For some days the images were lost. EST signifies that it is just a rough estimate based on past trends.
|
Date |
12/30 |
12/31 |
01/01 |
01/02 |
01/03 |
01/04 |
01/05 |
01/06 |
01/07 |
01/08 |
01/09 |
01/10 |
01/11 |
01/12 |
01/13 |
|
Duckweed Growth |
1.5% |
EST: 1.52% |
EST: 1.55% |
EST: 1.57% |
1.6% |
1.9% |
2.1% |
EST: 1.7% |
1.3% |
EST: 1.86% |
EST: 2.42% |
EST: 2.98% |
EST: 3.54% |
4.1% |
4.1% |

From the graph above, it is clear that the overall growth of the duckweed was substantial. The growth accelerated in the second week, likely due to the conversion of nutrients. However, there was one outlier. On 01/07/2025, it was found that the amount of duckweed was approximately 63% less than the previous day but returned to normal levels throughout the week.
There are many reasons this may have happened. One possible reason is environmental stress, as the temperature during this week suddenly changed from −11°C to +9°C within 72 hours. This is a roughly 182% difference and could have disrupted the duckweed. Other factors, such as extreme changes in pH levels, nutrient imbalances, or even human error during estimation, may have contributed. It is worth noting that this is an estimate, and perfect accuracy can not be expected.
Function Analysis 2.0
The system worked well during the first test. However, before using it in the real world, it is necessary to conduct extensive studies and research to confirm its function and to make any possible improvements. Because of this, the system was tested in water buckets for a second time. This time I changed a few aspects:
- Clear buckets were utilized, allowing plants to receive more light
- The volume of water was doubled
- Increased the testing time by one week
- water samples were tested for nutrients every three days instead of every seven.
This new setup allowed us to explore the potential of the system even further.
One noteworthy observation is that there was much more periphyton growth in the system-deployed bucket rather than in the control bucket. This will be further discussed in this section.

Throughout the three weeks, fluctuations in the pH were seen, but they were generally small. Near the end of the three weeks, it was seen that the pH increased, and on average, the deployed system bucket had more basic water. This is likely due to microbial respiration, which releases CO₂, creating basic conditions. However, the small drop in pH on days 18 and 21 in the system-deployed bucket was likely due to the death of periphyton. When periphyton dies, it releases organic acids, causing the pH to drop.

The rise in free chlorine in the system-deployed bucket is likely due to the decomposition of the periphyton. As periphyton breaks down, it turns into small organic matter, which then interacts with the chlorine present in water and creates forms of chlorine that are much harder to break down. Because there was much less periphyton in the control bucket, free chlorine was not observed in this bucket.

There was a noticeable ammonia spike on day 9 when both buckets experienced ammonia levels of 0.5 ppm. The ammonia seemed to get converted in the system-deployed bucket but was still present in the control bucket, indicating that ammonia was not fully converted or used. This likely happened either because microbes in the control bucket were slower at converting ammonia or the periphyton may have utilized it. The reason lower periphyton means slower nitrification (ammonia to nitrite to nitrate) is because it is a biofilm that creates a habitat, and more periphyton allows for more nitrifying bacteria.

The control bucket had much more ammonium throughout the testing. By day 21, the control bucket had 100 ppm of ammonium, and the system deployed bucket had none. This means that the control bucket had 100x more than the system-deployed bucket by the end of the three weeks. This is the opposite of what had happened during the previous tests. Last time, the control bucket had less ammonium. This is because many forms of algae prefer ammonium over any form of nitrogen, and because there was more periphyton in the system-deployed bucket, there was also less ammonium.
\\


In the system-deployed bucket, nitrite and nitrate experienced large spikes, only starting to reduce near day 18. The reason for this is likely the decomposition of periphyton as well. As it decomposes, periphyton releases nutrients back into the water because its cells break down and release stored nitrogen or phosphorus. As microbial activity gradually stabilizes, decreases in nitrate levels can be seen. Additionally, nitrification happened much faster in the system-deployed bucket, as seen in the ammonia graph. This means that in the control bucket, ammonia was not being converted to nitrate or nitrite as quickly, likely due to less periphyton and bacteria.

Similar to nitrate and nitrite, phosphate levels had spiked in the system-deployed bucket, eventually reducing near days 16-18. This is likely due to periphyton decomposition as well.
As the cells break down, they may also release phosphorus compounds, increasing phosphate levels in water. After the bacteria gradually stabilized, it was evident that the phosphate levels decreased as well. This fluctuation in phosphate levels shows a strong relationship between periphyton, bacteria, and nutrient cycling in the ecosystem. Understanding these interactions is crucial for maintaining water quality in aquatic environments.
Function Analysis 2.0
|
Variable |
Control peak |
System-deployed peak |
|
Phosphate (ppb) |
150 |
350 |
|
Nitrate (ppm) |
10 |
250 |
|
Nitrite (ppm) |
2 |
7 |
|
Ammonium (ppm) |
100 |
0 |
|
Free Chlorine (ppm) |
0 |
5 |
|
Ammonia Nitrogen (ppm) |
0.5 |
0 |

This graph shows the highest amount of a specific nutrient throughout the testing. From this graph it appears that the system only performed well for controlling ammonium and ammonia. However, due to the lighting situation, this graph is an unfair comparison. It would be better to compare the nutrients over time instead for more reliable results. This will be further discussed.
Growth of Duckweed/Hornwort/Periphyton:
Hornwort:
Unfortunately, even with clear buckets the light was not enough. In the wild, plants require roughly 2 000 lux to thrive, in my conditions, it was receiving only around 500-600 lux for most of the day which is not enough. Because of this, it was still required to replace the hornwort, even with clear buckets. As a result, data on the growth was not collected.
Duckweed:
|
Day: |
0 |
3 |
6 |
9 |
12 |
15 |
18 |
21 |
|
Hornwort Growth (%): |
0.67% |
0.61% |
7.89% |
11.00% |
EST: 11.89% |
EST: 12.78% |
EST: 13.67% |
14.56% |

The growth of duckweed was measured using the same estimation method as before. A grid was placed on top of an image and then analysed for how much space it would take up. For example:

From the line chart above, it is clear that the duckweed grew. Though it is worth noting that it was replaced on day 5, the growth was still noticeable. From day 6 to 21 the duckweed grew roughly 85%, around 5.64% per day. In the wild, these numbers are usually 2-10% per day so this is in the normal range, even with inadequate lighting.
Periphyton
For periphyton growth, the Excess Green Index (ExG) was used to measure. This is a method that quantifies the amount of green light relative to red and blue light. Because periphyton contains chlorophyll which reflects green light, ExG is a very useful tool for measuring periphyton and other plants. This method is especially useful as it is possible to analyse the amount of periphyton simply with images instead of needing specialized equipment. ExG values will be calculated throughout a few days in the three weeks. The formula used is the following:
ExG = 2G - (R+B)
G = green light intensity, R = red light intensity, B = blue light intensity
First, RGB values throughout six different areas of the bucket were collected and the formula was applied to each pixel. Then, the average ExG value was determined.
|
Day 1 |
Day 7 |
Day 21 |
|
|
Control Bucket |
-9.167 |
-9.833 |
-6.333 |
|
System-Deployed Bucket |
-9.148 |
-4.500 |
3.833 |


From the graphs above, it can be seen that there is more ExG value in the system-deployed bucket. This indicates a higher chlorophyll concentration in aquatic plants as well as periphyton. The ExG value in the control bucket is about -6.333 and 3.833 in the system-deployed bucket by the end of the three weeks. This is roughly 160% more periphyton by the end of the testing period. This indicates that there was more plant growth (including periphyton growth) in the system-deployed bucket. I believe this was because of the light exposure. When the lux levels were measured, it was found that the system-deployed bucket received three times more light than the control bucket. Since clear buckets were used this time, the light difference impacted the growth of periphyton much more. However, this hypothesis must be further tested.
How did excess periphyton growth impact performance?
My prediction of the rapid increase in nitrogen levels is likely due to periphyton decomposition. As periphyton dies, it releases stored nutrients back into the water, temporarily increasing nutrients in the water. Because of this, it may take more time for the system to fully stabilize nutrient levels. However, based on the data, it already appears that the system is working for nutrient stabilization. This is also something that may happen in the real world so this was a very interesting mistake. However, this experiment should be replicated even more times with the same amount of light to get more accurate results.
Cost Analysis
Traditional floating wetland systems are already highly cost-effective, typically costing around $35. However, this project introduced several improvements to traditional designs. For instance, soil was not used in this system, allowing it to house both aquatic and floating plants, which traditional floating wetland systems do not support. Additionally, it makes use of additional materials such as activated charcoal to reduce nutrients in water. This adaptation helps to mimic a natural wetland ecosystem more closely. Despite these enhancements, the system has an estimated cost of $5.85, making it approximately seven times less expensive than traditional floating wetland systems. This significant reduction in cost makes the system highly affordable when scaling it for broader implications. Additionally, floating wetlands are far more affordable than constructing large artificial wetlands, which cost an average of $ 18,000, reducing the cost by around 3000x. By leveraging these cost benefits, the system offers a practical and affordable solution.
Limitations and Future Improvements
Challenges were faced in many aspects of this project. One of the biggest challenges was figuring out lighting. Due to inadequate light, the hornwort could not grow and consistently had to be replaced during the second week of the first testing period. Even with clear buckets, the light was hard to control as the system-deployed bucket received 3x more light, causing excess periphyton growth. However, this hypothesis should be tested under more controlled environments.
Another major limitation was the inaccessibility to emergent plants. This test was done during winter, and during this time, no shops sold bulrush, a plant I was originally planning to use. When replicating this experiment, it will be a huge benefit to include bulrush or any other emergent plant native to Alberta.
Human error may also be a potential challenge because some errors in measurement may have occurred, such as adding too much fertilizer or bacteria. A weighing scale would have helped with this problem, but currently, I do not have access to a weighing scale that can measure such small amounts.
The accuracy of the test kits may have also impacted the results. It is almost impossible to identify the exact quantity of a specific nutrient or pollutant in the water just by looking at coloured test kits. Sensors would have made this much more accurate.
Another improvement would be using the system in real freshwater ecosystems to see how it performs under natural conditions. The system could also be optimized to filter pesticides, herbicides, and other agrochemicals.
Conclusion
The objective of this project was to create an affordable and effective system capable of removing agricultural runoff from freshwater ecosystems. Since then, this project evolved into a practical floating wetland system. The system has proven to be highly effective, as seen in the data. For instance, phosphate reduction in the system-deployed bucket was approximately 60% faster than in the control bucket (28.57 ppb/day versus 17.86 ppb/day). Nitrate levels were also reduced significantly faster, with the highest nitrate concentration in the control bucket being 30% higher than in the system-deployed bucket. Even in the second test with light levels increasing periphyton growth, the system was still able to reduce nutrients near the end of the three weeks. These results further validate the functionality of the floating wetland system.
This project has many applications. Firstly, eutrophication is a problem globally, affecting over 30% of lakes and reservoirs. Excessive algal blooms create hypoxic zones, making these areas inhabitable to aquatic life. Additionally, the use of plastic bottles helps to reduce waste. With over 300 million tons of plastic produced annually and only 9% being recycled properly, repurposing plastic can help to improve sustainability across the globe. The cheap price also allows people living in first-world countries to gain access to cleaner water. To improve this project, it should be tested in better conditions with more controlled variables such as controlling light lux. Furthermore, additions such as zeolite and emergent plants will further improve the functionality and efficiency of the system.
Citations
- Atwood, D., Paisley-Jones, C., Biological and Economic Analysis Division, Office of Pesticide Programs, Office of Chemical Safety and Pollution Prevention, & U.S. Environmental Protection Agency. (2017). Pesticides Industry Sales and Usage 2008-2012 Market Estimates. In U.S. Environmental Protection Agency. https://www.epa.gov/sites/default/files/2017-01/documents/pesticides-industry-sales-usage-2016_0.pdf
- Biology Dictionary. (2017, June 5). Phosphorus Cycle. https://biologydictionary.net/phosphorus-cycle/
- Clean Water. (n.d.). Wetlands Work. https://www.wetlandswork.org/wetland-benefits/clean-water#:~:text=Since%20the%20flow%20of%20water,of%20creeks%20and%20rivers%20downstream
- Encyclopædia Britannica, inc. (n.d.). Denitrifying bacteria. Encyclopædia Britannica. https://www.britannica.com/science/denitrifying-bacteria
- Environmental Protection Agency. (2012, March 6). 5.6 phosphorus. EPA. https://archive.epa.gov/water/archive/web/html/vms56.html
- Floating wetlands for low-cost wastewater treatment. (2024). Springer Nature Communities. https://communities.springernature.com/posts/floating-wetlands-for-low-cost-wastewater-treatment
- Gonzalez, P. (2021, April 14). Understanding phosphorus. Chem Inc. https://www.cheminc.com/post/understanding-phosphorus
- Government of Canada, Canadian Centre for Occupational Health and Safety. (2024, May 10). Pesticides - General. https://www.ccohs.ca/oshanswers/chemicals/pesticides/general.html
- Government of Canada, Canadian Centre for Occupational Health and Safety. (2024b, May 10). Pesticides - Health Effects. https://www.ccohs.ca/oshanswers/chemicals/pesticides/health_effects.html
- How much do artificial wetlands cost. (2024). Bing. https://www.bing.com/search?q=how%20much%20do%20artificial%20wetlands%20cost&qs=n&form=QBRE&sp=-1&lq=0&pq=how%20much%20do%20artificial%20wetlands%20cost&sc=12-36&sk=&cvid=28777706FBB145C084D97A35A2250F17&ghsh=0&ghacc=0&ghpl=
- Indicators: Phosphorus | US EPA. (2024, May 30). US EPA. https://www.epa.gov/national-aquatic-resource-surveys/indicators-phosphorus
- Mays, C., McLoughlin, S., Frank, T. D., Fielding, C. R., Slater, S. M., & Vajda, V. (2021). Lethal microbial blooms delayed freshwater ecosystem recovery following the end-Permian extinction. Nature Communications, 12(1). https://doi.org/10.1038/s41467-021-25711-3
- Mitchell, C. (2024, May 18). What Is Bioremediation and How Does It Work? Investopedia. https://www.investopedia.com/terms/b/bioremediation.asp
- Nitrogen - Water Quality Guide - DataStream. (n.d.). DataStream. https://datastream.org/en-ca/guidebook/nitrogen
- Nitrate in drinking water. (2024, July 9). Health Information and Services. https://info.health.nz/keeping-healthy/environmental-health/nitrate-in-drinking-water#:~:text=Nitrate%20is%20a%20 naturally%20 occurring,or%20smell%20in%20drinking%20water
- Nutrient Removal — The Wetlands Initiative. (n.d.). The Wetlands Initiative. https://www.wetlands-initiative.org/nutrient-removal#:~:text=These%20naturally%20occurring%20processes%20adsorb,the%20atmosphere
- Nutrients and Eutrophication | U.S. Geological Survey. (2019, March 2). https://www.usgs.gov/mission-areas/water-resources/science/nutrients-and-eutrophication
- OpenAI. (2024). ChatGPT (September 11 version) [Large language model]. https://chat.openai.com/
- Parker, J., Pell, J., Tim, & (Chris), P. I. (2024, June 1). 12 best plants that Clean & Filter Pond Water. Pond Informer. https://pondinformer.com/plants-that-clean-water/
- Phosphorus Cycle | Southwest Research and Outreach Center. (n.d.). https://swroc.cfans.umn.edu/research/soil-water/phosphorus-cycle
- Pollutants from agriculture a serious threat to world's water. (n.d.). Newsroom. https://www.fao.org/newsroom/detail/Pollutants-from-agriculture-a-serious-threat-to-world's-water/en#:~:text=Agricultural%20water%20pollution%3A%20Numbers%20of%20note%201%20Irrigation,sprayed%20into%20the%20environment%20every%20year.%20More%20items
- Runoff. (n.d.). https://education.nationalgeographic.org/resource/runoff/
- Sayadi, M. H., et al. "Removal of nitrate and phosphate from aqueous solutions by microalgae: An experimental study." (2016): 357-364.
- Sposito, G. (2024, August 16). Soil | Definition, Importance, Types, Erosion, Composition, & Facts. Encyclopedia Britannica. https://www.britannica.com/science/soil/Soil-erosion
- Stewart, R. E. (2024, August 31). Fertilizer | Definition, Types, Plant Nutrients, Application, & Facts. Encyclopedia Britannica. https://www.britannica.com/topic/fertilizer
- Taziki, M., Ahmadzadeh, H., Murry, M. A., & Lyon, S. R. (1970, January 1). Nitrate and nitrite removal from wastewater using algae. Latest TOC RSS. https://www.ingentaconnect.com/content/ben/cbiot/2015/00000004/00000004/art00005#:~:text=Microalgae%20have%20a%20high%20capability%20to%20remove%20combined,opportunity%20for%20efficient%20recycling%20of%20nutrients%20in%20wastewater.
- The Editors of Encyclopaedia Britannica. (2009, February 20). Agrochemical | Pesticides, Fertilizers & Herbicides. Encyclopedia Britannica. https://www.britannica.com/technology/agrochemical
- Wetland. (n.d.). https://education.nationalgeographic.org/resource/wetland/
- Wetlands Purify - DNREC. (2024, August 26). DNREC. https://dnrec.delaware.gov/watershed-stewardship/wetlands/purify/#:~:text=Wetlands%20purify%20our%20water%20by,the%20kidneys%20of%20our%20watersheds.%E2%80%9D
- What Are Algae Blooms? (2019, November 22). Sciencing. https://sciencing.com/algae-blooms-8266246.html
- Why are there so many toxic algae blooms this year (cnbc.com). (2016, July 26). https://www.cnbc.com/2016/07/26/why-are-there-so-many-toxic-algae-blooms-this-year.html
- Zumdahl, S. S. (2024, August 2). Ammonia | Definition & Uses. Encyclopedia Britannica. https://www.britannica.com/science/ammonia
- Wikipedia contributors. (2024, August 6). Thiocarbamate. Wikipedia. https://en.wikipedia.org/wiki/Thiocarbamate
- Wikipedia contributors. (2025a, January 17). Carbamate. Wikipedia. https://en.wikipedia.org/wiki/Carbamate#cite_note-J%C3%A4ger-1
- Wikipedia contributors. (2025b, January 19). Organophosphate. Wikipedia. https://en.wikipedia.org/wiki/Organophosphate
- Wikipedia contributors. (2025c, February 4). Organochlorine chemistry. Wikipedia. https://en.wikipedia.org/wiki/Organochlorine_chemistry
- Cost of constructed wetlands systems - Brown and Caldwell. (2020, August 4). Brown and Caldwell. https://brownandcaldwell.com/papers-and-reports/cost-of-constructed-wetlands-systems/
- Cost of constructed wetlands systems - Brown and Caldwell. (2020, August 4). Brown and Caldwell. https://brownandcaldwell.com/papers-and-reports/cost-of-constructed-wetlands-systems/
- Admin. (2023, June 13). What is Eutrophication? - Definition, Causes, Classification, Effects and FAQs on Eutrophication. BYJUS. https://byjus.com/chemistry/eutrophication
Acknowledgement
I would like to aknowledge Hannah Porter from the University of Calgary who consistently supported me and provided me with feedback throughout the project. Without her knowledge, this would not have been possible. Furthermore, I would also like to thank my teachers, Mrs. Burkell, Mr. Bykovskikh, and Mr. Stranzinger who helped to further refine and improve my project. Finally, I would like to thank my parents who helped me with gathering materials and conducting my experiments.