Development of a Smart Pipeline Inspection Gauge (PIG) for In-Line Navigation & Defect Detection
Aryan Sharma
Queen Elizabeth High School
Grade 10
Presentation
No video provided
Problem
1. Abstract
Municipal water main failures often fail and cause flooding, service outages, and expensive emergency repairs. Many existing inspection methods are either indirect, costly, or difficult to deploy frequently in smaller distribution pipes. This project proposes a low-cost in-pipe inspection robot for water distribution mains using a sealed spherical chassis with active drive to improve mobility through bends and joints. The robot carries stereo cameras and onboard computing to reconstruct the pipe interior using a stereo vision pipeline. A controlled pipe testbed with fittings and modular defect inserts will be used to validate mobility, reconstruction quality, and defect detection/localization against ground truth, along with practical constraints like runtime and total cost.
2. Introduction
2.1 Infrastructure Problem and Failure Consequences
2.1.1 Inspiration: The Calgary Bearspaw Feeder Main Rupture
On June 5th, 2024, and even recently, on December 30th, 2025, many Calgarians came home to their water tap running very slowly, with some not having water pouring out at all. It was an event that came as a shock to residents of the city and bystanders worldwide: how could an area so developed receive such a catastrophic event? The answer to that question is simple: holding off routine pipeline inspections. It might not seem like something you pay much attention to, and in fact, most of the city doesn’t. But, in reality, just like oxygen, pipes are all around us, just in a way we can't normally see them. They run underground, over top of us, in ways we can't even comprehend, and they transport hundreds of unique materials miles across. The water from your tap? The gas you fill up your car with? It all came from a comprehensive underground system that runs throughout your country. Unfortunately, pipes can’t last forever; human interference and nature play a large role in their gradual and unpredictable deterioration. Most of the damage happens underground and out of sight: corrosion, coating failure, joint deterioration, soil movement, and small leaks that grow until the pipe finally gives out. By the time people notice, it’s already a crisis. This stream of “forgetting” routine pipe inspections, partly due to ignorance, mainly due to costs and efficiency, led to such a big rupture to one of Calgary’s main water pipes: the Bearspaw feeder main. The burst caused major flooding, taps running dry around the city, and worst of all, billions of dollars lost in repairs and reparations. We don't see that side of the issue, but the city has to deal with it for centuries to come.
 Figure 1.1: Broken Pipe that caused the Bearspaw Feeder Main Rupture
 Figure 1: Aftermath of the Bearspaw Feeder Main Rupture
2.1.2 The Cost of Failure
The prevalent issue of pipe bursts doesn’t just exist in Calgary; it frequently occurs all over the world. In fact, according to PBS, “In the United States alone, there are roughly 240,000–260,000 water main breaks per year across the network, meaning roughly one break every 2 minutes on average.” When critical water infrastructure fails, it leads to a widespread disruption of essential services. Harms to Public Health, damage to the environment, and increasing the cost of emergency response are all critical assets that are put at risk when pipes fail. For example, in December of 2025, a detrimental water main break in Waterbury, Connecticut left more than 100,000 people without water. This forced hospitals to rely on tanker deliveries, and caused explosive damage to infrastructure. A single pipe failure can impact a multitude of communities and safety services, as evidenced by just one of many examples. Moreover, pipelines in the Gas sector can also cause major fires. Take a look at the 2009 Peace River, Alberta Pipeline Explosion. On July 20, 2009, TransCanada’s Peace River natural gas Mainline, which was built in 1968, ruptured near Peace River, Alberta. It let out about 1.45 million cubic meters of gas that ignited into 50-meter flames. It destroyed two hectares or 20,000 square meters of forest in Dene Tha’s First Nation Territory. Over the long term, this leads to ecological damage, ecosystem disruption, and climate change contributions.
 Figure 3: Aftermath of the Waterbury water main break
2.1.3 The Importance of Pipeline Inspection Gauges (PIGs)
Pipes will inevitably break at some point in time; we haven’t yet created infinitely lasting pipes, and we are a long way from doing so. As pipes are buried underground, they are unpredictable because nature dictates what happens to them next. So what if there was a robot to inspect it, quickly and cost-efficiently, in a way that helps the city make sure they don't get another burst, by telling them when one could happen? This reason introduced a vital industry to the market: Pipeline Inspection Gauges (PIG). As the name suggests, these tools can examine the condition of a pipe and guage the probability of defects. These robotic instruments use a multitude of sensing mechanisms, can perform in various unique envrionemnts, and provide a clear picture to officials to where repairs need to be made. Pipe inspection is important because most failures start concealed and small, then they grow to become expensive and destructive. Traditional human fixes to pipe damage can involve fire and explosion risk, non-oxygen atmospheres, and long shutdowns in order to make the space safer, which then means inspections are expensive and usually get delayed until it is “really needed” which is usually too late. However, current inspection methods have proven to be extremely costly and hard to insert, which makes many cities undermine it’s need for routine inspections. Instead of waiting for a budget increase, why don’t we attempt to make a more cost-effective and efficient version of these critical assets? This initial exposure to the issue sparked my interest in environmental stewardship, fueling my passion to do something to solve the problems that I was seeing in my community.
2.2 Project objectives
In response to this urgent threat, I plan to create PipeSentinel, an innovative, low-cost, and efficient pipe inspection robot that can go into and survey water mains, and let city officials know where leaks are occurring. This robot flags early warning signs such as visual corrosion, cracks, and joint issues to alert the proper authorities. The device is designed to be quick to deploy, able to navigate autonomously through a defined pipe segment, and simple to retrieve, minimizing crew time and making routine inspection more realistic. In the end, my practical benefit is that early detection leaks to targeted raptors, which in turn leads to fewer spills, emergency excavation, and far less environmental damage.
-
Cost Current methods are deterred most of the time because of the cost and the resources needed for one simple inspection. Opening up hydrants and valves can take a considerable amount of effort, and I wanted to make that much easier with my project. PipeSentinel is intended to be affordable and has a budget constraint of $500 to make it easily replicable with off-the-shelf components so that the system can be easily replicated in other settings. The intention is to make the current hindrance to routine inspection (cost and logistics) something that can be done proactively and not just when it fails.
How I Will Test This: * Bill of Materials (BOM) details, Receipts, and Total Cost Breakdown * Build Guide and Maintenance Checklist (How Quickly Parts Can Be Replaced) * Deployment practicality test: time to deploy, time to retrieve, and number of personnel required 2. Accuracy The second success factor is the performance of detection. PipeSentinel should have the capability to indicate early warning signs that are linked to actual failures. These warning signs include leak indications (acoustic/vibration), visual corrosion or cracks, misalignment, and intrusion.
How I will test this: * Controlled test environment which consists of pipe sections (PVC), including joints, bends, and debris areas * Simulated Leak Module: a controlled seepage environment via a valve to allow me to turn leaking on/off and know where “ground truth” is * Repeatability testing: Test the robot on the same test setup several times to see if it identifies the same defect each time * False positives: Conduct clean pipe tests to evaluate the frequency of marking nothing as a problem * Performance Reporting: Detection Rate, False Alarm Rate, and Effect of Noise, Curves, and 3. Navigation and inspection reliability Thirdly, PipeSentinel has to be able to survive and function properly within realistic pipe environments (bends, corners, sediment, slippery surfaces), and it has to give useful inspection video footage.
How I will test this: * I create obstacle course runs with bends, simulated debris, and joint transitions. * Completion rate (% of runs completed without intervention) * Retrieval test (worst-case stuck scenario): Can I retrieve it safely and quickly
2.2.1 Research Question
How can I design and construct a low-cost, accessible, and reliable Pipeline Inspection Gauge robot that detects leaks in dry/wet pipelines?
3. Background and Related Work
3.1 Main failure modes/defect types
- Leaks
- Caused by corrosion, joint failures, or cracks that let pressurized fluids escape within the thinned or damaged walls. The United States EPA (Environmental Protection Agency) mentions that when pipes corrode, the walls slowly lose their protective layer and thickness, therefore creating pits and weakened spots where water leaks through before a full break occurs.
- Bursts
- Caused by excessive internal pressure on already weakened and deteriorated pipes. A large North American study conducted on water main ruptures in the US and Canada notes that corrosion, pipe age, unfavorable soil conditions, and fluctuations in pressure all contribute to a higher rate of sudden failures in metallic water mains. Under these pressure surges, minor defects can expand into bigger, full circumferential or longitudinal ruptures.
- Corrosion
- Caused by moisture and chemicals in the surrounding soil and water which reacts with the pipe materials, causing it to corrode. In metallic pipes like cast iron and ductile iron, corrosive soil, high moisture, and highly reactive ions like chloride and sulfate increase the rate at which the walls thin out. This in turn significantly increases water main break rates compared to pipes in less corrosive environments.
- Joint failures
- Caused by mechanical and sealing problems at the connections between pipe segments. These segments include things like couplings, elbows, and T-joints. Over time, ground movement, thermal expansion & contraction, cycles of pressure, and gasket’s aging can loosen or misalign joints. This allows small leaks to form along those connection lines that eventually grow into bigger cracks and separations if they’re not repaired.
3.2 Inspection approaches
Several technologies have been developed and implemented for pipeline inspection/monitoring. Below is a high-level overview of the main technologies
1) Acoustics
- Leaks in pipes cause hissing noises which can be detected at certain frequencies by hydrophones. (These devices essentially listen to the water.)
- Tools used to detect leaks in water pipes
- Listening sticks: Pipe vibration
- Correlators: sensors listen for leak noise, get it at different times, and use that math do detect the exact position of a leak
- Remote loggers: long-term acoustic monitors
- Transient waves: Pressure waves released, checked for reflections, etc.
- Sonar profiling: conceptually similar to an underwater ultrasonic sensor looking for anomalies. No flowing water required
- Impact echo: unlike the other methods, you strike the pipe surface and see the vibration frequencies.
2) Visual Techniques
- Using AI detection methods such as CNN’s to identify certain types of cracks.
- Using laser scanning techniques via technologies like LiDAR.
3) Electromagnetic Techniques
-
Used to detect defects mainly in metal pipes, including carbon steel, cast iron, and ductile iron
-
Magnetic Flux Leakage
- Non-destructive sensing: This technique, used in ferromagnetic pipes (things that attract magnets), detects things like corrosion and wall thinning.
- Pulsed Eddy current
- A device sends a short electromagnetic pulse into a metal pipe and observes how the eddy currents decay over time.
- Visualizes with a PEC diagram using a short EM pulse - Works through insulation and coatings - Detects corrosion and wall thinning - Can see deep defects
- Broadband electromagnetic
- Looks at the pipe pretty much the same way as PEC and RFEC, but this time, with multiple frequencies.
- High frequency → Innerwall/surface
- Low frequency → Outer wall
- Analyzes wall thickness, depth of metal loss, and distribution of corrosion.
- Limitations: complexity, lower spatial resolution than MFL, sensitive to noise and calibration. Mostly used for condition assessment, not pinpointing cracks.
4) Ground Penetrating Radar
- Subsurface sensing method: NOT a direct (in-line) inspection tool. GPR sends short EM waves (across the spectrum) and records reflections.
- Leaks in water pipes cause wet soil zones (disturbance), and a GPR can detect that. You call this a dielectric contrast.
- Limitations: Time consuming, performance degrades in wet or clay soils. Indirect leak localization.
5) Ultrasonic Techniques
- Guided Wave Ultrasound.
- The collar (ring transducer) excites the pipe wall with ultrasound at selected frequencies modes
- The waves propagate through the wall
- Any deformities cause partial reflections
- ToF (Time of Flight) finds distance to defect
- Limitations: complexity; one sensor can run through hundreds of meters of pipe in one run.
- Discrete ultrasound
- Essentially how arduino ultrasonic sensors work.
- Slow for long pipes, not long range in a short time, unlike guided wave ultrasound or GWU (1)
- Resolution IS high, however, compared to GWU.
- Phased array ultrasound
- A much better/precise alternative to discrete ultrasound: while (1) hits one beam, one angle, one point in time, (2) has many small ultrasonic elements in a probe, all firing with a slight delay (with different angles and depths).
- It does have more complex hardware and data. Still local.
6) Indirect monitoring/corrosion
- Soil characterization
- An indirect monitoring technique that looks at soil samples
- Soil controls how fast pipes corrode, leak, and how well inspection signals travel
- PROPERTIES:
- Soil resistivity: How easily electrical current can flow through the soil
- Low resistance = high corrosion risk
- High resistance = low corrosion risk
- Moisture content: Higher moisture = more aggressive corrosion
- Soil chemistry (pH, ions) - Acidic soil accelerates corrosion.
- Soil type (for example, clay is more prone to causing pipe failures)
- Soil resistivity: How easily electrical current can flow through the soil
- Close internal survey
- Calculates the voltage between the pipe and the surrounding soil. If very negative, that is good. Used to see how well the cathodic protection is working
- Linear polarization resistance
- LPR works by producing a tiny electrical current on a pipe surface. If it is actively corroding, electron-transfer reactions respond strongly, producing a large current response.
(7) FIDO AI
- A software-based method
- You already have the acoustic files, vibration data, and sensor logs. You upload them to this service, and AI compares the before vs after and gives a leak likelihood and confidence score
- Problems lie when one needs to actually find the leak source inside the pipe
(8) RAMP
- A Research concept that adds onto existing robot systems, but it improves localization with RFID. Radio-frequency identification (RFID) uses electromagnetic fields to identify and track tags attached to objects automatically.
3.3 Understanding state-of-the-art static systems Water Pipeline Monitoring Systems
- Pipe NET
- Sensors include:
- Pressure - hydraulic changes
- Accelerometers - vibration
- pH sensors - water quality
- Collects lots of data, very fast
- Problems: Power hungry, low communication underground, hard to scale.
- Sensors include:
- LeakFinder
- Real-world mature system
- Just like how correlators work, it finds leaks via hydrophones
- Industry gold standard
- Permalog / PermaNET
- Small acoustic loggers on valves/hydrants
- They listen mostly at night
- Due to it being quiet and high pressure
- Problems: struggles with plastic pipes
- They are durable and robust, and specifically designed for easy installation in more challenging areas.
- Smart Pipe
- Non-intrusive pressure monitoring system that sits on the outer edges of the pipe
- When the pressure of the pipe changes, it deforms slightly, and this detects that
- Easy installation, no pipe access required
- PROBLEM: Indirect measurement
3.4 Understanding state-of-the-art dynamic Water Pipeline Monitoring Systems
- PipeProbe
- A capsule (“sensor droplet”) that floats with the water flow to map the 3D layout of pipes (“hidden”)
- Insert the capsule into pipeline
- Pressure sensor records height - Pressure increases when lower
- The accelerometer detects motion/orientation, and the robot infers turns and geometry
- 3D profile is created! But accelerometers can’t detect cracks and leaks here, only the general geometry of the pipes.
- A capsule (“sensor droplet”) that floats with the water flow to map the 3D layout of pipes (“hidden”)
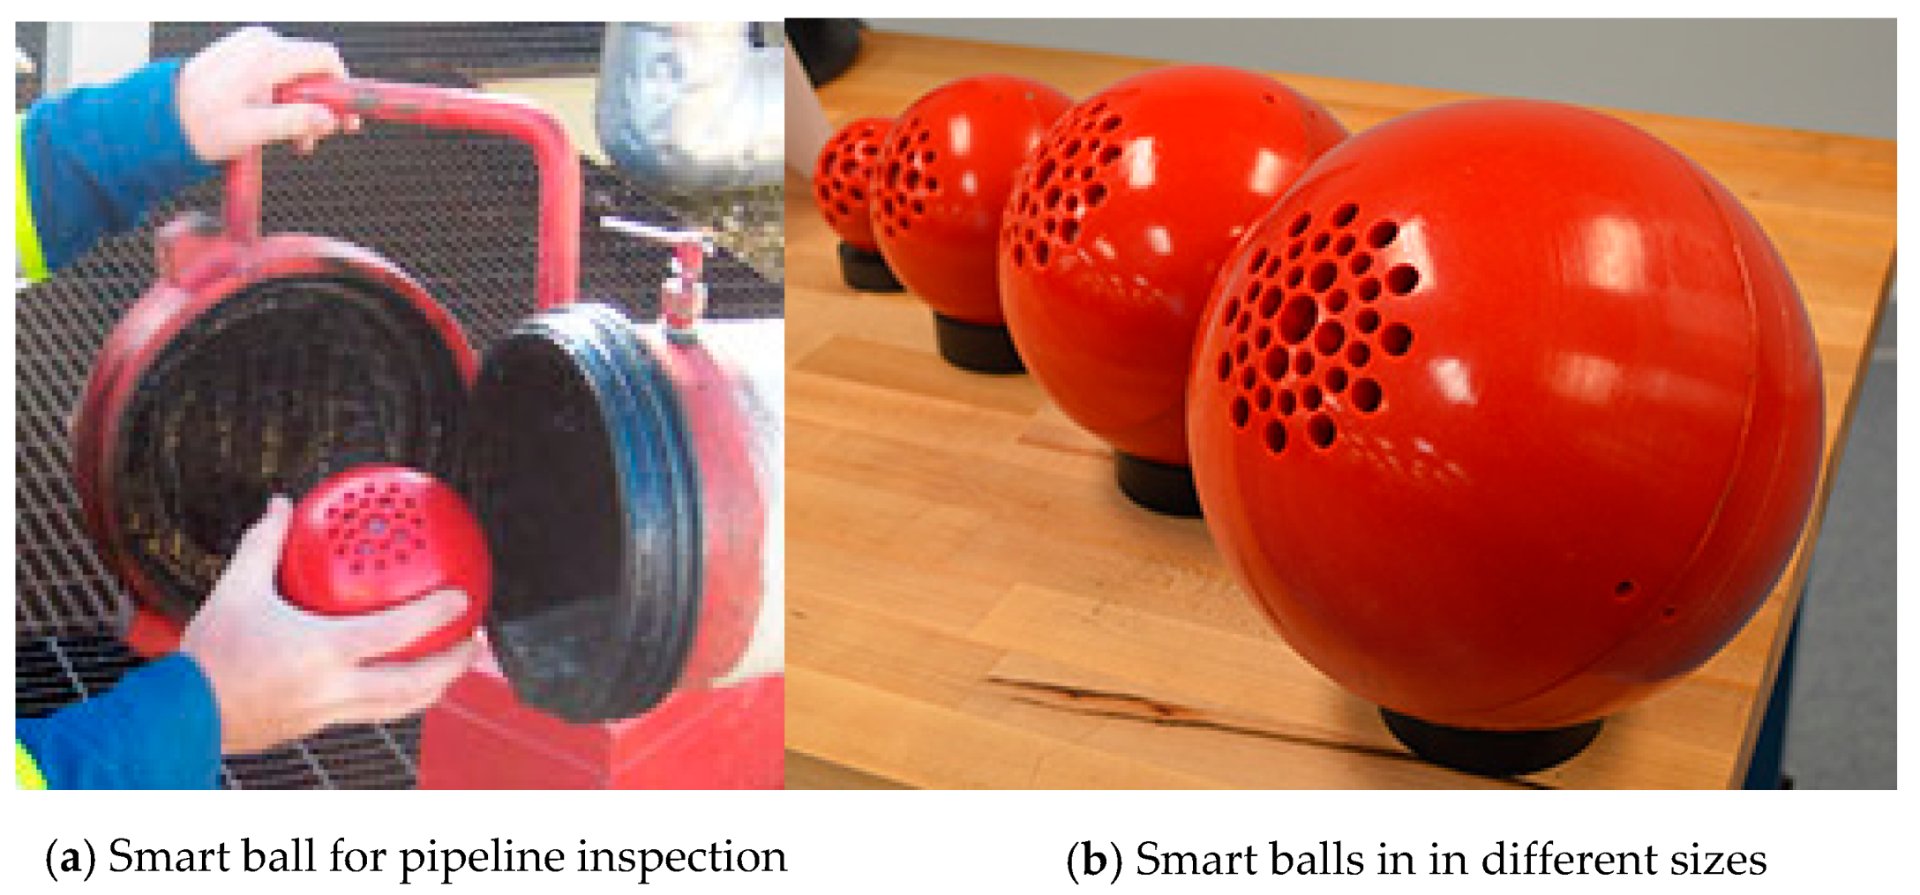
- SmartBall
- Free swimming foam ball with sensors inside
- Uses acoustic sensors, which detect leaks and gas pockets
- Gyroscopic + magnetic - leak location and pipeline mapping
- Temperature sensing
- Accelerometer
- Periodically emits “pings” for above-ground tracking/localization
- Can detect pipes with a diameter of 8 inches or greater
- Works in all different types of pipes
- Needs extra things (such as motors) to inspect lengthy pipelines.
- Sahara - Pure technologies / Xylem
- A tethered inline inspection tool
- Has a hydrophone and a camera and is pulled and controlled through pressurized mains.
- Can only run 1 mile (1.6km) at a time
- TriopusNet
- Essentially a deployment and replacement system for sensor nodes
- So, say you had a dead node inside the pipe:
- First, you insert a fresh node in the pipe
- Then, using a pressure + gyroscope, this fresh node localizes and finds the dead node.
- Then once it finds it, it uses built-in motorized mechanical arms to attach beside it and start working
- Interesting note: dead sensor nodes aren’t just like cut off and removed, they just leave them there because it would be too “complex” to do all that
Method
4. Design Requirements
4.1 Target pipe class and environment assumptions
In this project I considered gas, sewer, and oil pipelines. However, I finally focused on Municipal Water distribution mains. Gas would be extremely hard to test and raises risk issues, sewers are biohazards and have messy conditions that would make it hard for me to prototype, and oil makes for a very hard inspection approach as the liquid is murky. Water distribution was the best because it is a high impact infrastructure affecting millions of people and is still realistic to prototype. My target diameter is 6 to 12 in pipes. Not only is this the highest volume diameter of pipes installed in a city, but also has the highest failure rate of pipe. One survey-based breakdown shows 3–8 inch is \~67% of total pipe length and 10–12 inch is \~18%, meaning most mains are in the “small-to-mid diameter” range. A separate break-rate study also reports distribution mains (≤12") make up most of the network and fail far more often than large transmission mains. Material scope: field pipes can be ductile iron, PVC, steel, concrete, HDPE, etc. For safety and cost reasons, my testbed uses PVC because it is easy to source and inspect. It is also the most widely used pipe material in the 21st century. This robot shall access the mains themselves through valve chambers, fire hydrants, and openings through maintenance.
5. System Design
5.1 Mechanical design (CAD, sealing, drive, bend handling)
My initial designs for this robot did not start with a sphere right away. I progressed through three main mechanical designs over the span of months. Water pipes are complex: they have joints, diameter changes, and tees. Moreover, the fact that they are live and flowing means that a robot can't take its time traversing through the pipeline. My first design mechanism was a worm-like robot, my second one stemming from a screw design (which I called the “Vortex”), and my final design was a smart ball-inspired sphere with an active drive mechanism.
5.1.1 Mechanical Design A: The Worm
My first mechanical design stemmed from biology. Because the pipes I was targeting consisted of complex geometries, I wanted to see if there was a biologically equivalent species that could traverse well in such conditions. Many animals were analyzed, such as eels, geckos and even spiders. I ultimately chose a design inspired by how a worm moves. The Locomotion of a worm is known to be one of the cleanest biological mechanisms for moving through tight and constrained spaces. Many research papers back this claim up, and through my research, I saw that many papers used an inchworm style motion because it generates traction without wheels slipping. Here is how it was planned to work:
- The robot would be built in 2-3 segments.
- Just like a worm, it would follow the following movement pattern (kind of like anchoring and extending)
- (a) Front segment expands radially to grip the pipe wall (anchor).
- (b) The middle actuator extends the body forward.
- (c) Rear segment anchors, front releases, and the cycle repeats.
For the actuation, I decided that pneumatic chambers would be the best fit for the robot.
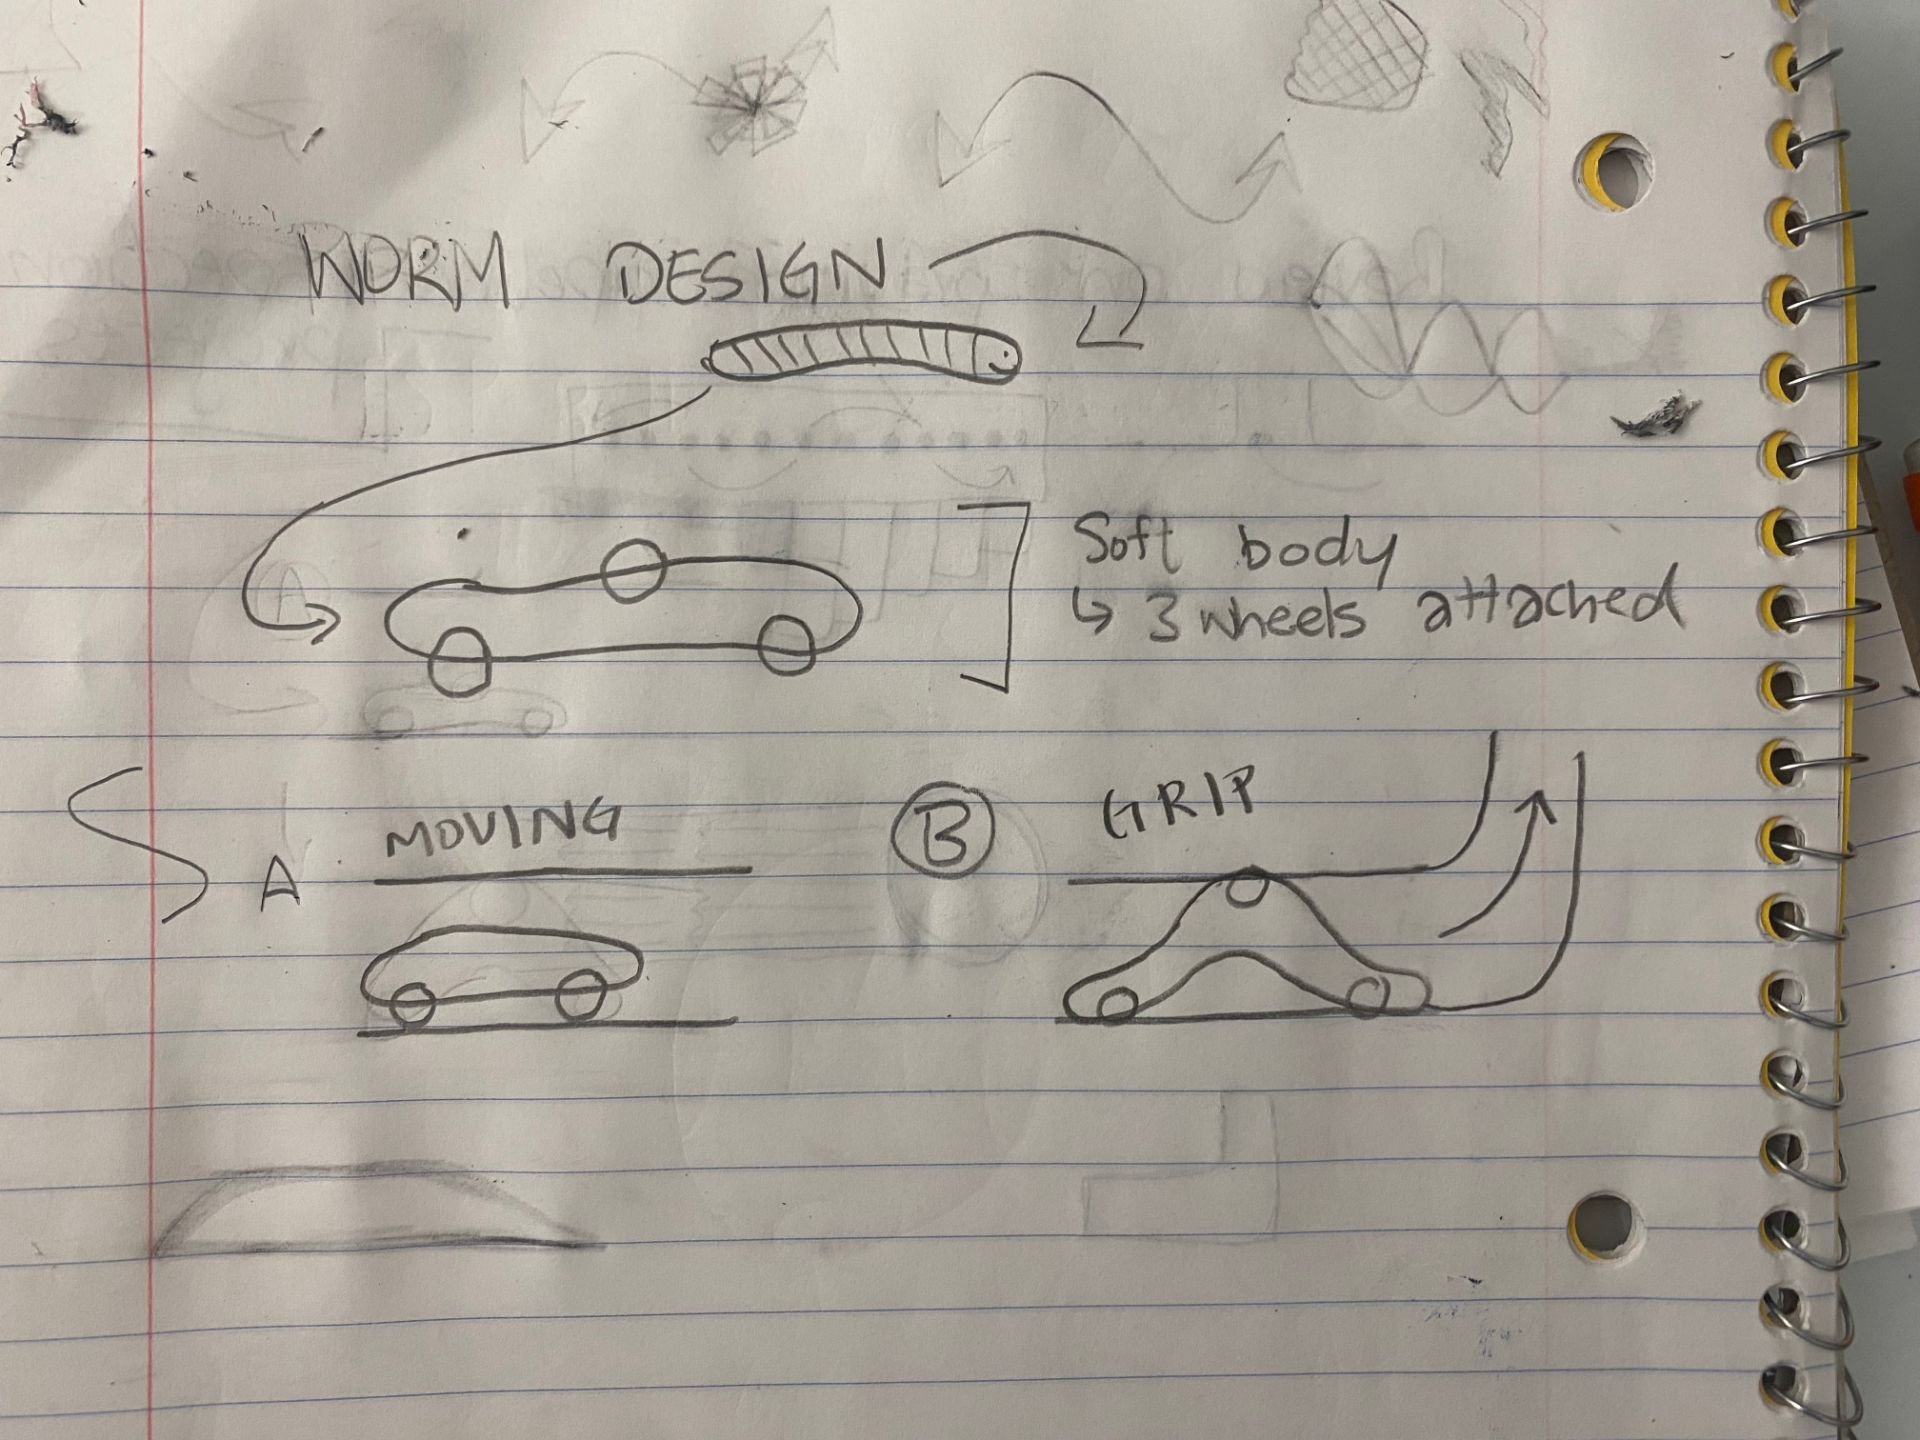
 Design ideas (paper and CAD)
However, this design had a few key issues which forced me to put it on hold and open up the design board for new solutions.
- It had an extremely slow operational speed. Because of how worms incrementally move (the body has to move up and down to maintain movement), this results in a low velocity. Because live water means pushing water extremely fast, this inspection robot would not be able to keep up.
- Its single degree of freedom would only allow it to move forward and backward, hindering it from accessing complex pipe designs.
- Once you add sensors, waterproofing, and put that all in different segments, it makes sensing accuracy drop significantly, and the engineering becomes much more complicated than it needs to be.
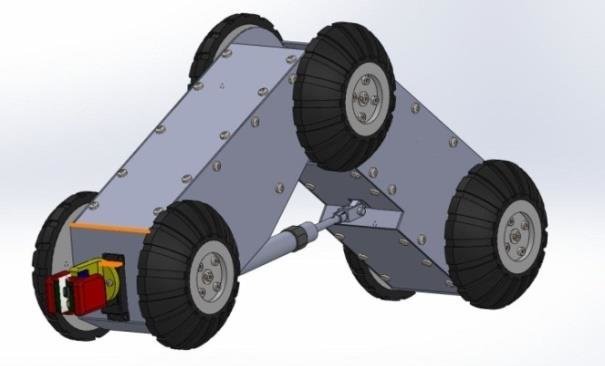
5.1.2 Mechanical Design B: The “Vortex”
My second main mechanical design was inspired by some industry standard pipe taxonomies.
I wanted to improve on their design ideologies by making it so sensors were placed directly adjacent to the pipeline rather than being in the middle of the chassis. I would make it into a screw-like design, which was planned to be fast, using the power of gravity to stay upright. Here is how it was planned to work:
- (a) Helical contact surfaces press against the pipe wall.
- (b) A motor spins the omni wheel-based helical assembly. This converts rotation into forward motion (like a screw moving through a nut, except the pipe wall provides the reaction force).
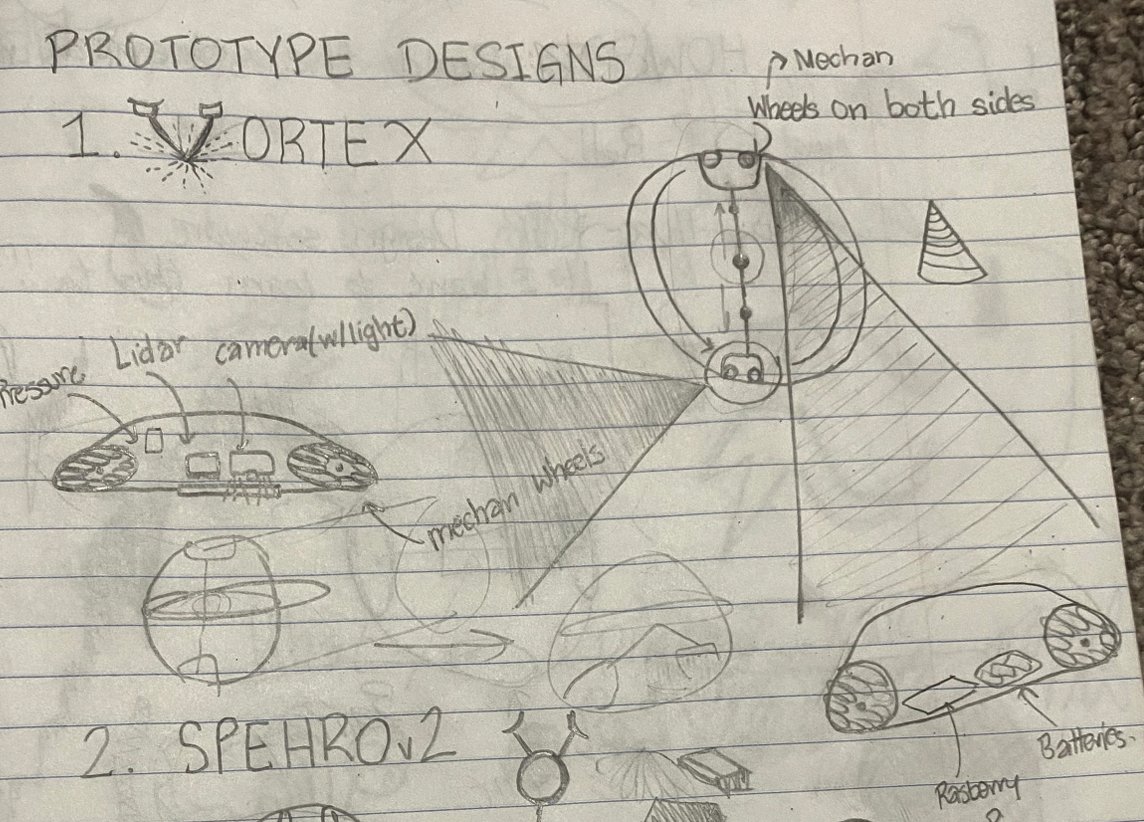
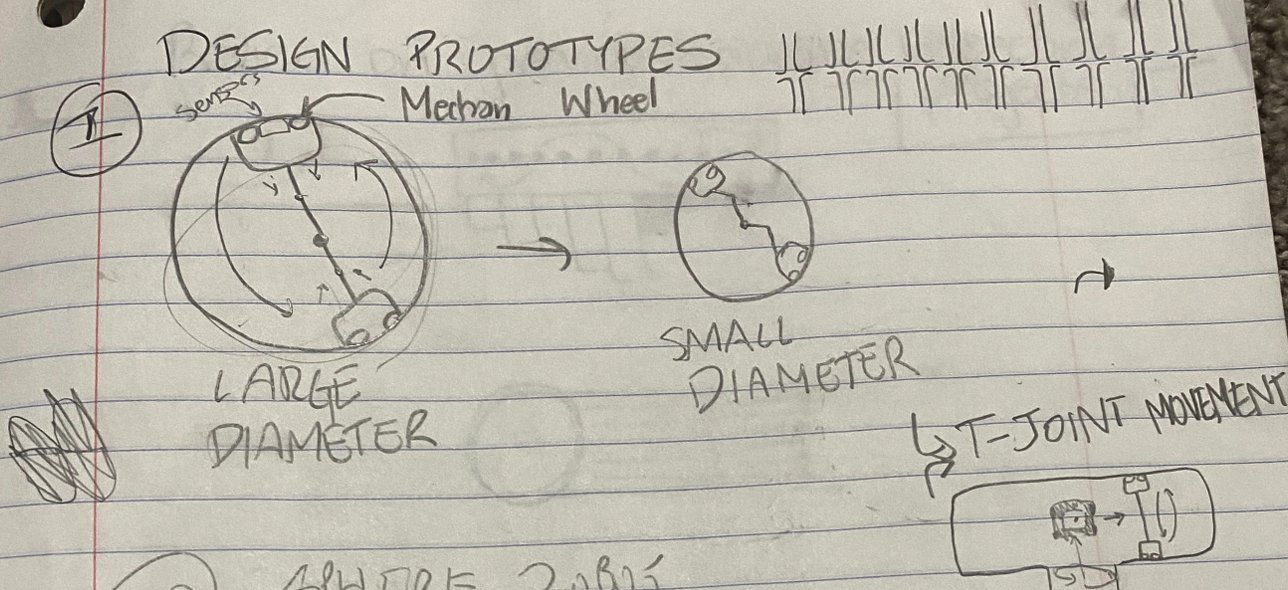 Some design ideas drawn in my notebook
However, like before, this design had a few key issues which forced me to put it on hold and open up the design board for new solutions:
- The robot was a mechanically complex one, meaning it would be difficult for teams to insert it into a pipe and recover it at the same time. Moreover, because this screw-like design needs a very specific contact force against the wall(too little and the robot slips, but too much and the pipe could burst), it would be hard to calibrate the proper adjustments in real-time.
- Many water piping systems include a component called a gate valve (which allows water flow to be stopped temporarily).
 What a gate valve looks like
However, as the Vortex was planned to be attached to both sides of the pipe (with a wire going through them in the middle), it would snag onto a gate valve while traversing. I tried to mitigate this issue by designing a rotation algorithm that would have the robot conform to a “V” type shape. However, the force conditions would not necessarily allow this to happen.
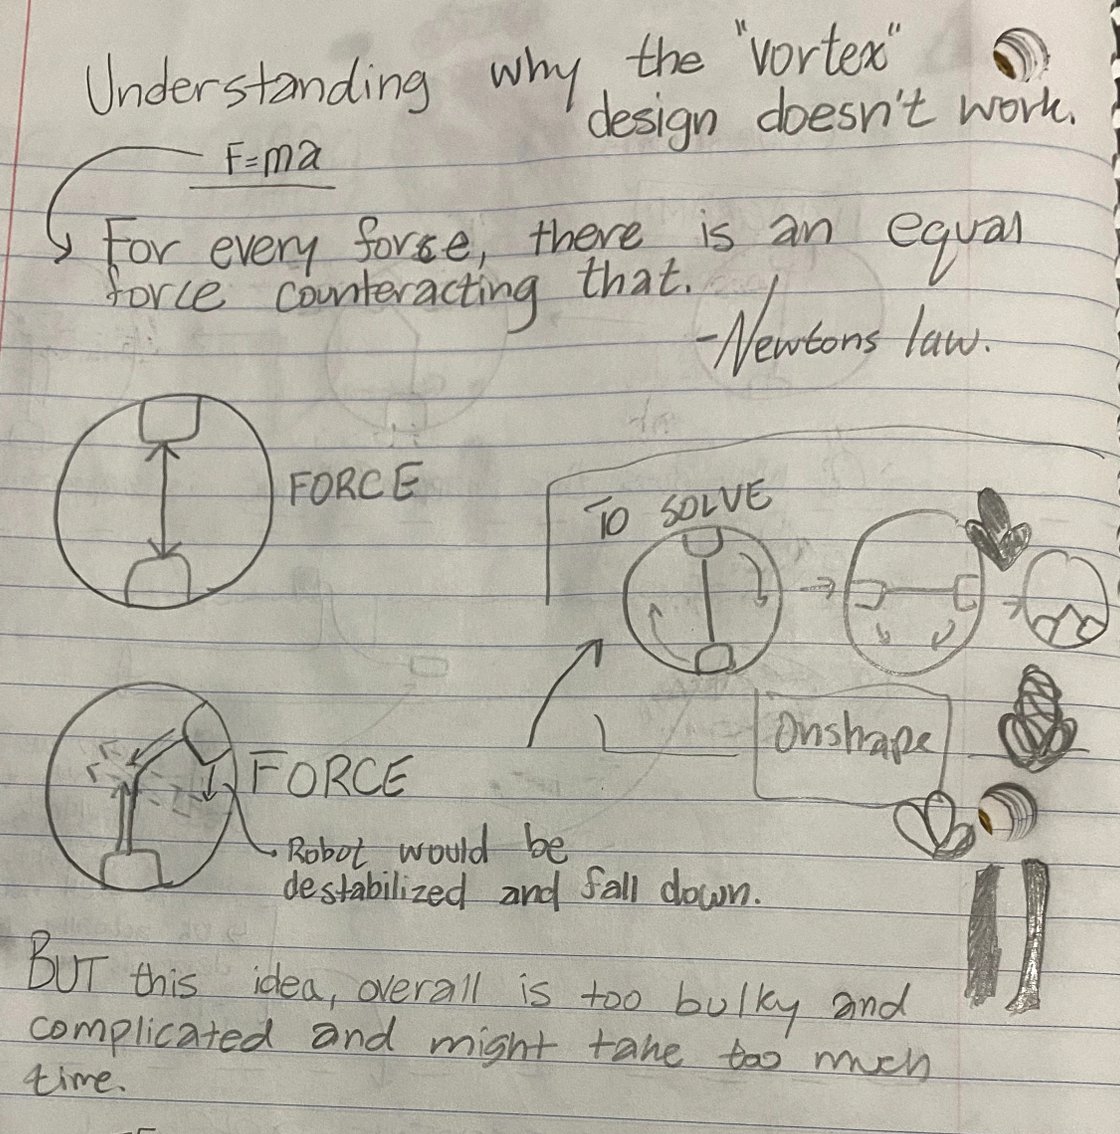 An explanation as to why this design did not work as planned
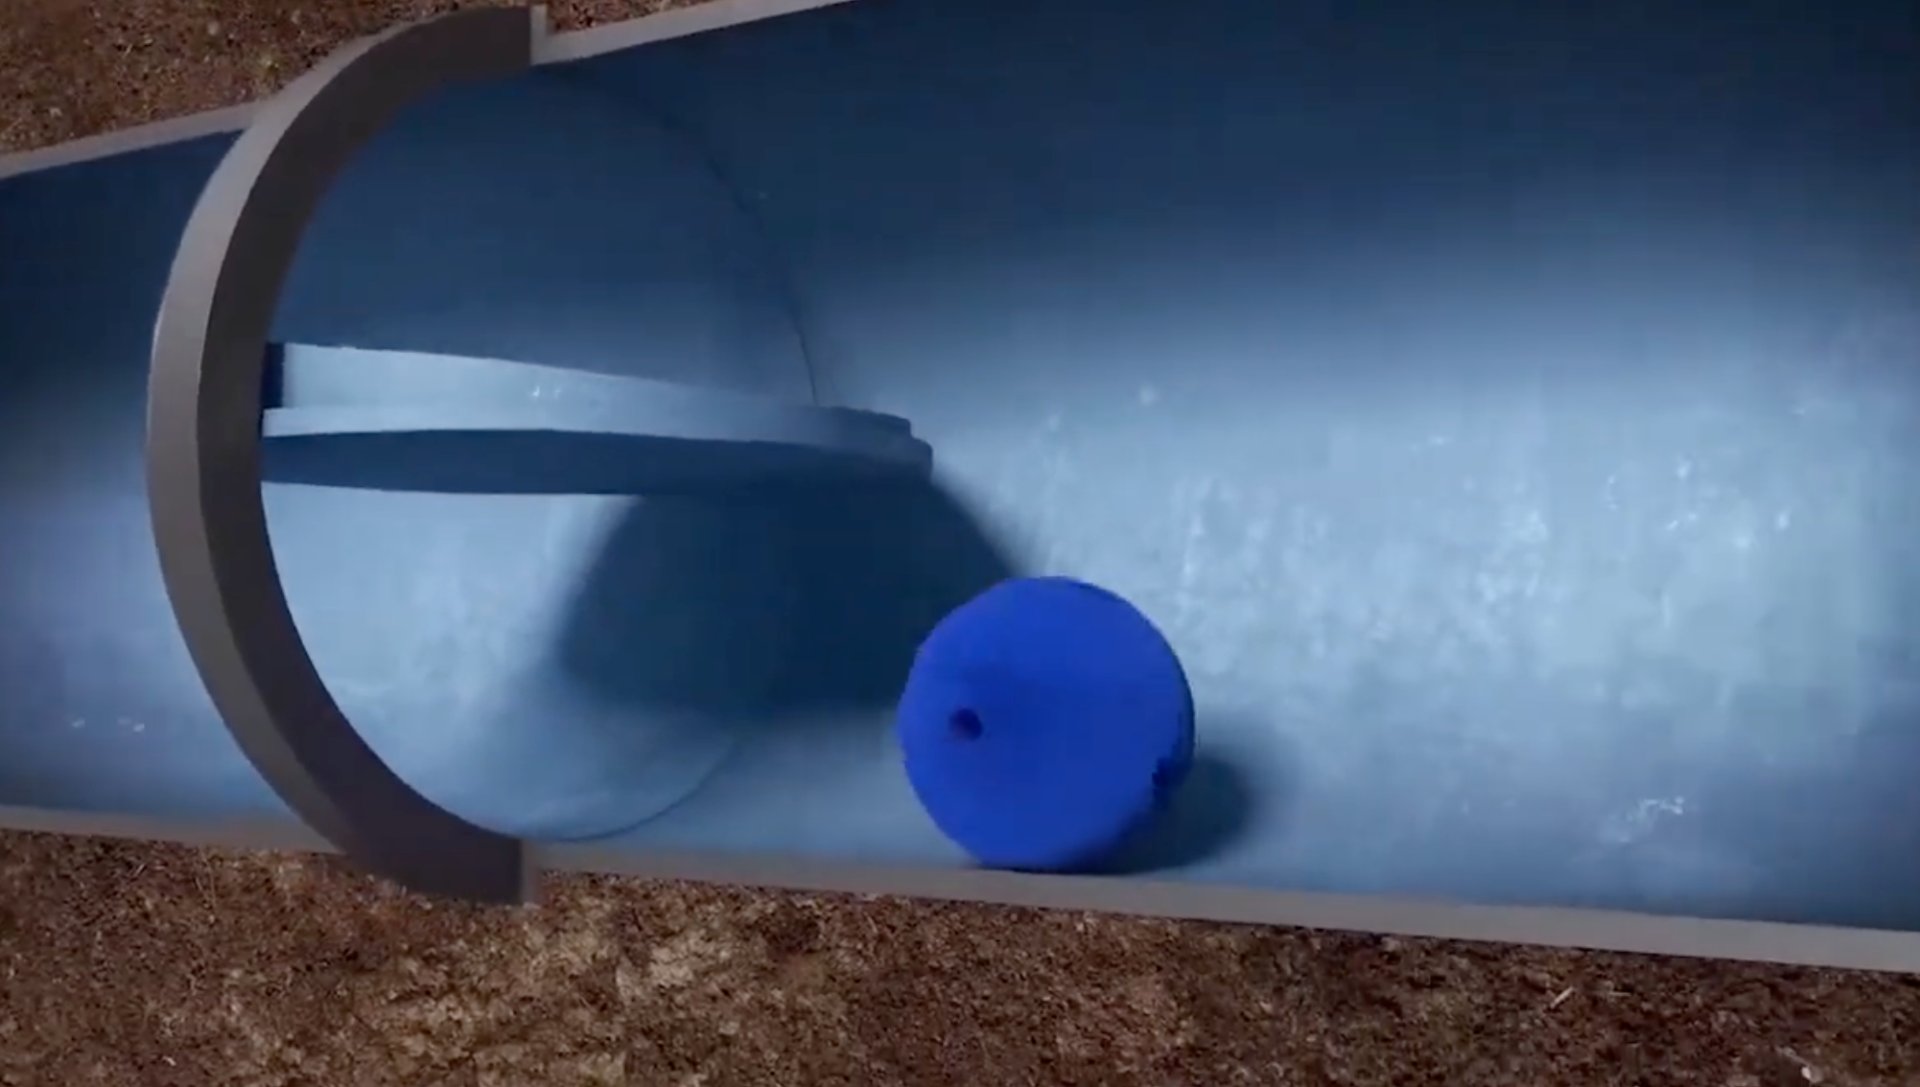
5.1.3 Mechanical Design C - Final: SmartBall V2
My final design was inspired by a very simple, but industry-leading product: The SmartBall. As the name suggests, the whole robot is a sphere, designed for easy insertion and retrieval. It traverses complicated pipe geometries due to its mechanical design, simply rolling through the surface.
However, I noticed some key flaws in this design, which helped me create its “second version”. Firstly, the ball could not be controlled when it came to navigating T-sections or going to a specific pipe section; it followed the flow of the water.
I wanted to solve this critical issue by attaching motors and wheels to the robot. These will be stabilized by an inertial measurement unit (IMU) to properly assess the condition and traverse a pipe. The pipe environment I am testing for is made up of multiple 90-degree joints and bends, and therefore, it was crucial to make this mechanism to allow for live transmission pipe monitoring, instead of having to de-water a section. Here is a more detailed description of the mechanical design:
- (a) Drivetrain
- You could imagine this as a hamster ball-like driving mechanism. For my casing, I am using an approximately 6-inch plastic and transparent sphere (found an old fillable ornament shell). There are two main driving wheels with four non-motorized stabilization wheels. The two driving wheels are pressed against the inner wall of the shell, and so when they spin, they spin the shell, and the robot rolls along the pipe. That movement is more crucial for dewatered pipes, but for live mains, these wheels allow for the ball to move in the left/right direction to access certain sections. This design stays very mechanically simple: no long chassis or articulated joints, and nothing that can snag on pipe features.
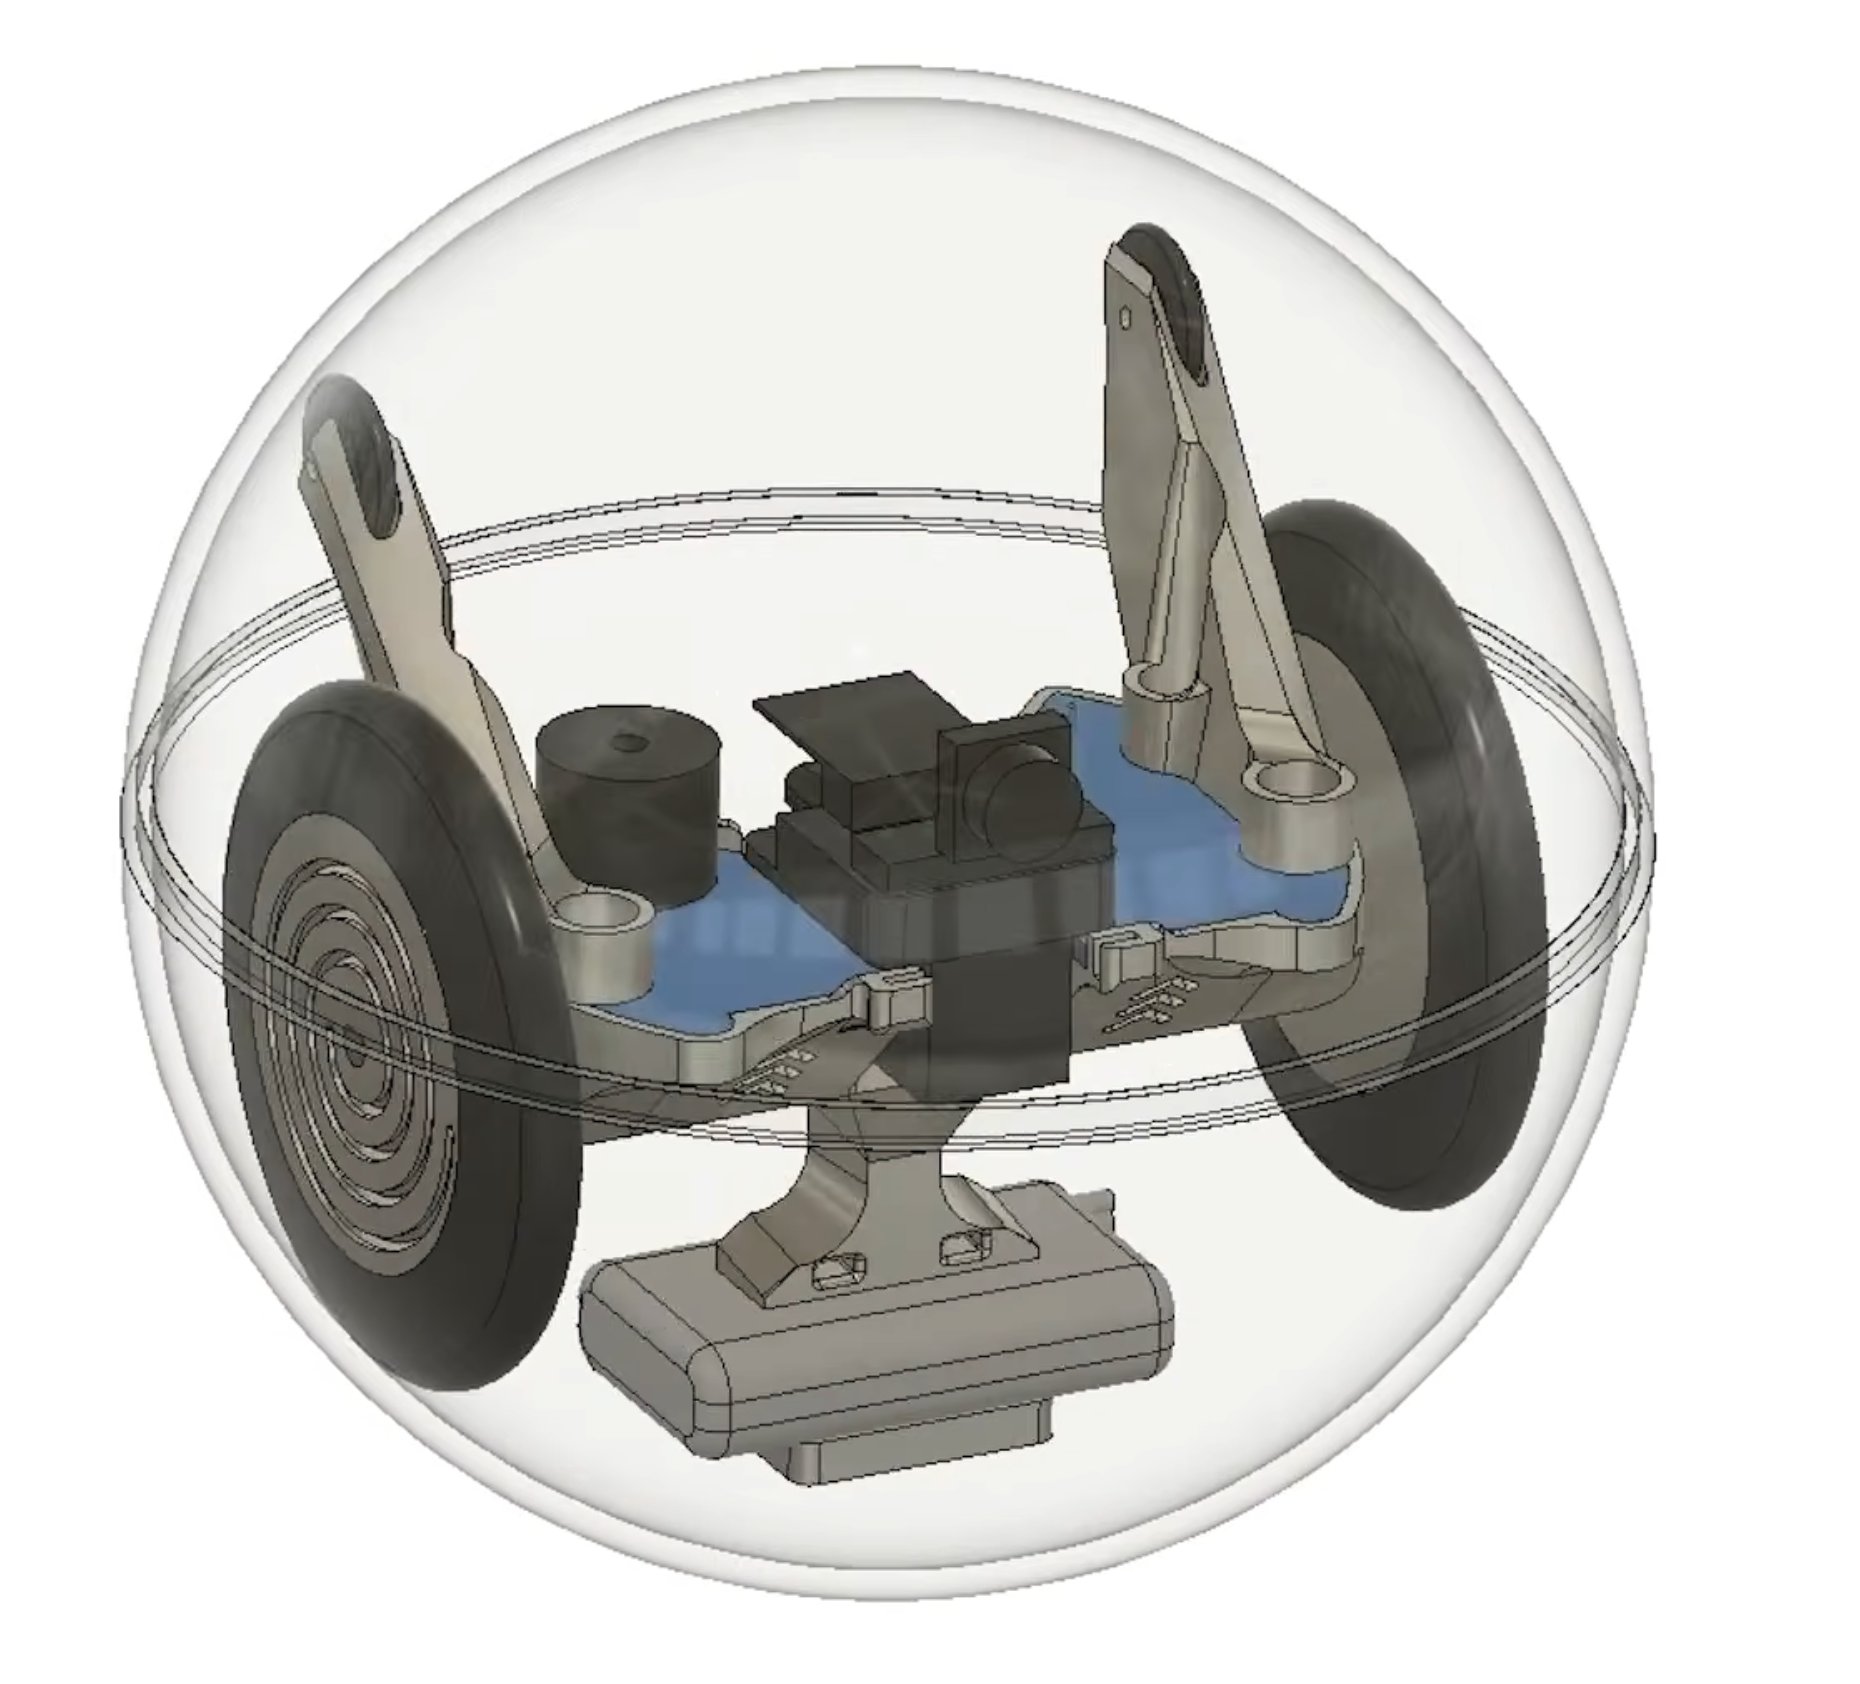 Example design of this robot
- (b) Wheel design
- My initial thought of adding a normal, flat wheel on the curved sphere surface was soon taken down after I analyzed how this wheel would grip onto the edge. In a real inspection situation, this sphere would face vibrations, and so I had to re-engineer the wheel to make it more effective at gripping the shell casing. My final design was to make the contact be curved so it fits the sphere's geometry:
- The tread is shaped like a rounded ridge, so it self-centers on the sphere surface instead of riding on an edge
- I printed the wheel as a rigid hub (PLA) with a high-grip tread (TPU) so it can grip the sphere without shredding or slipping.
- (c) Motors Torque
- My first set of motors came from my school's robotics lab. They were simple to use and seemed powerful. However, I quickly learned that these motors faced a large problem when it came to controlling the sphere properly in a pipe: their torque. These motors had a high RPM but weak torque (unless they were geared down). Because my robot had to overcome obstacles such as friction against the pipe wall and drivetrain, and trying to accelerate with such heavy loads inside of it from rest, a high RPM motor would not work. After some research on gear ratios, I landed on a high gear reduction approach (50:1). This trades speed for torque and makes the robot reliable. The wiring and control details will be in the next section.
- (d) Sealing
- To seal this robot, I used an o-ring at the sphere split line to make for a seamless and airtight connection from the water on the outside to the electronics on the inside. I also avoided using any cables to control this robot. Not only would it be hard to add a cable in the first place, but it can also get tangled in debris (and would add to the complexity of the robot). The solution to this will be explained in more detail in the sections coming, but at a high level, this robot stores its information locally, and once it is connected externally, it can relay the information it received.
5.2 Sensors
Throughout the iteration process, I went through 3 main sensing mechanisms. My initial idea led me to create prototypes for 3D-Mapping for defect detection, accompanied by AI for a sensor fusion-based approach. My first sensing mechanism prototype attempted to use the LiDAR sensing technology for accurate 3D point clouds of a pipe's interior. This technology uses the time of flight method - with light beams emitted by the sensor - to measure the distance to a single point.
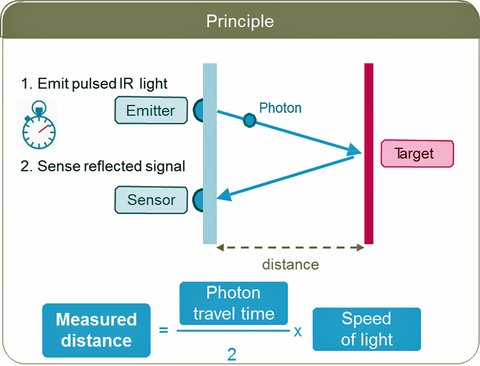 How LiDAR technology works
Coupled with a stepper motor, I could make these rotations 360 degrees, capturing all parts of the cylindrical surface. Not only are these sensors highly accurate, but also very cheap, which made them seem like a very suitable solution at the time. However, after more research into the science behind this solution, I realized that in my use case(water pipelines), because these sensors emit light, that means it will probably get refracted or absorbed before it ever comes back to the sensors' receiving end. To combat this issue, as I didn’t want to switch from the general idea space of these types of transducing/receiving sensors, I decided to find an alternative that could work underwater. This led me to discover the world of sonar sensors (which use sound to detect distance) - used in ship expeditions, all the way to mapping ocean floors.
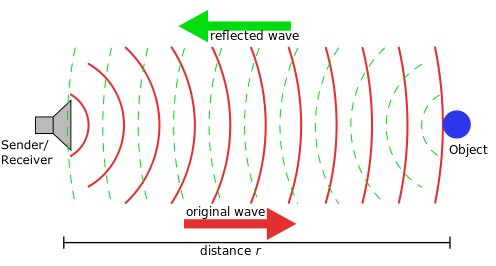 How Sonar technology works
Again, these sensors were cheap and versatile for my use case, and it seemed like the inevitable option. However, again, after looking at the science behind these sensors, although they do work underwater, because they use sound instead of light, their accuracy significantly decreases. I learned that because sound pulses in waves (instead of beams like light), they would only be able to find large cracks - but at that point, cities would already know the pipe is bursting. After I learned and reflected on the setbacks of these two sensor solutions, my mindset shifted from trying to solve problems with my current solutions to instead trying to solve the core problem in the first place. Before, I was focused on trying to optimize the emission/transducing sensors, but then, I realized that I wasn’t focusing on the core issue - pipe inspection, and I could look into a whole different realm of sensing materials that could do the job at a much more efficient level. As a computer vision/deep learning enthusiast and having experience in the field, I decided to dive deep into that realm to see if it had potential in this use case. I soon came across the multi-camera-based approach of stereoscopic vision. This sensing technique is inspired by the ways our eyes work, and two cameras are positioned like them to detect the depth of a 3D space. Here is how the stereo pipeline creates a 3D point cloud, which is used for defect detection.
5.2.1 The stereo pipeline: how two images become a 3D point cloud

Step 1 — Capture synchronized left & right images
During each frame (in my case, 60fps), the robot grabs a Left image from Camera A, and a Right image from Camera B. These are taken at the same time so motion doesn’t ruin the geometry. This results in two slightly different viewes of the same pipe wall.

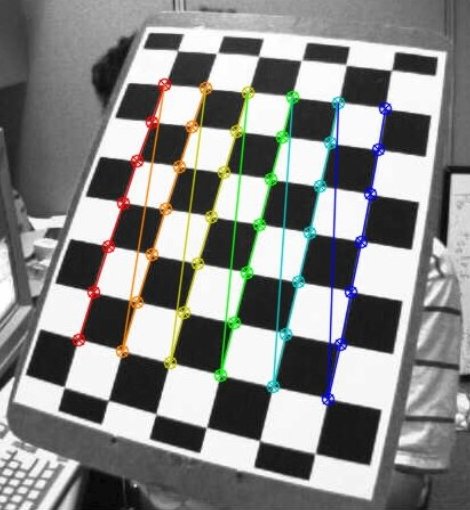
Step 2 — Calibrate the cameras
The next step is to calibrate the cameras. To create an accurate depth map, the system needs to know its geometry. It first needs to know its intrinsics(such as focal length, optical center, lens distortion) and then extrinsics(the exact rotation/translation between the two cameras). This calibration can be performed using a method called checkerboard calibration (as seen below). The two cameras see the same checkerboard from multiple angles, and because the checkerboard's geometry is perfect, the cameras have a good “ground truth” mechanism to learn from. Without needed calibration, depth numbers will be wrong and could drift.
Step 3 — Compute the Disparity
Now, the system finds the same feature in both images. This is a snapshot of the thousands it’s doing per seocnd. If a feature appears at x_L in the left image, and x_R in the right image, then the disparity is: d = x_L − x_R. The key idea here is that closer points shift more between the two images, which results in a larger d, and the father point shift less, resulting in a smaller d. This creates a raw disparity map (as seen below):
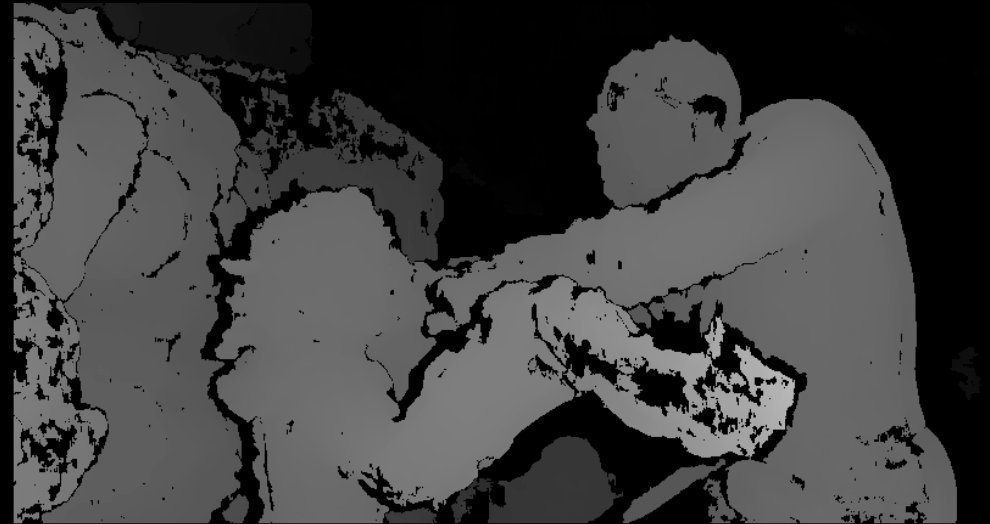
Step 4 — Clean the Disparity Map and Add Depth
Now, depth is computed from the standard stereo equation:
- Z = (f × B) / d
Where:
- Z = depth (distance to the surface)
- f = focal length (from calibration)
- B = baseline (distance between the two cameras)
- d = disparity from Step 3
This means that:
- Large disparity (big d) = small Z (closer wall)
- Small disparity (small d) = large Z (farther wall)
The final output is a depth map.

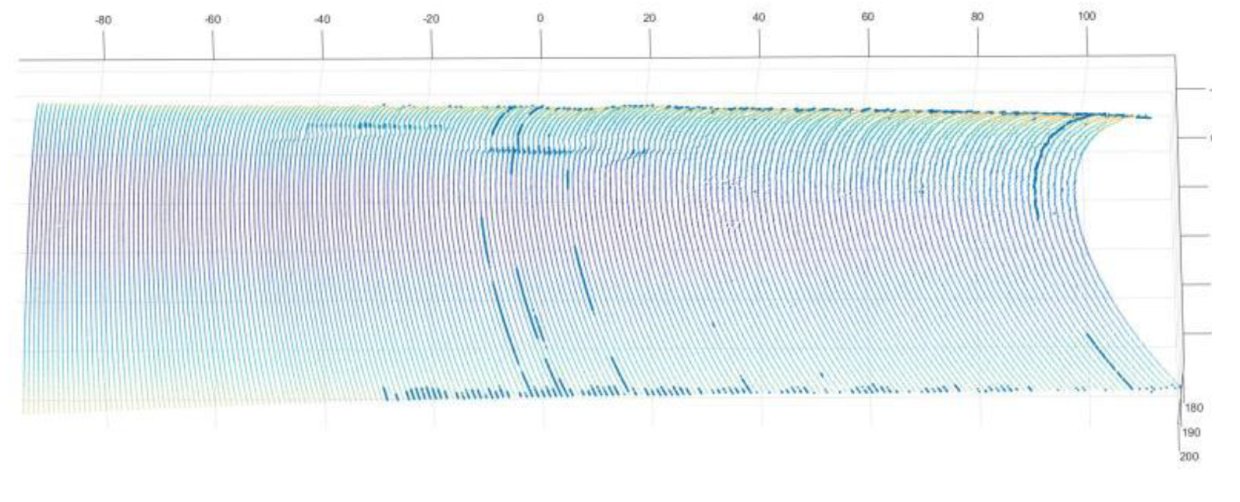
Step 5 - Convert depth map into a 3D point cloud
As you can see, the depth map is still a 3D image. However, because it has depth, we can now turn it into a 3D geometry. For each pixel (u, v) with depth Z, the system converts it into a 3D point (X, Y, Z) using the camera calibration parameters. We finally have a 3D point cloud similar to the one below!
5.3 Electronics, Power, and Communication
- Electronics
This robot uses a two-processor architecture, one for real-time motor control(microcontroller), and the other for heavy Vision computing power. Although I could do both on one board, it makes control very laggy or vision hard to render.
- Real-time control processor - Teensy 4.1 Microcontroller
- reads the IMU data (such as orientation, angular velocity, acceleration)
- runs the control loop (PID)
- outputs motor commands (PWM) to the motor drivers
- logs time-stamped motion data (so I can align it later with the vision data)
To come to this conclusion took a considerable amount of time and effort. I began by testing my robot on the Arduino Uno and ESP32. While they worked, both were slow at communicating and did not provide me with a sufficient number of pins to connect other sensors. The Teesny’s 600 MHz Cortex-M7 and the number of I/O pins far surpassed these microcontrollers.
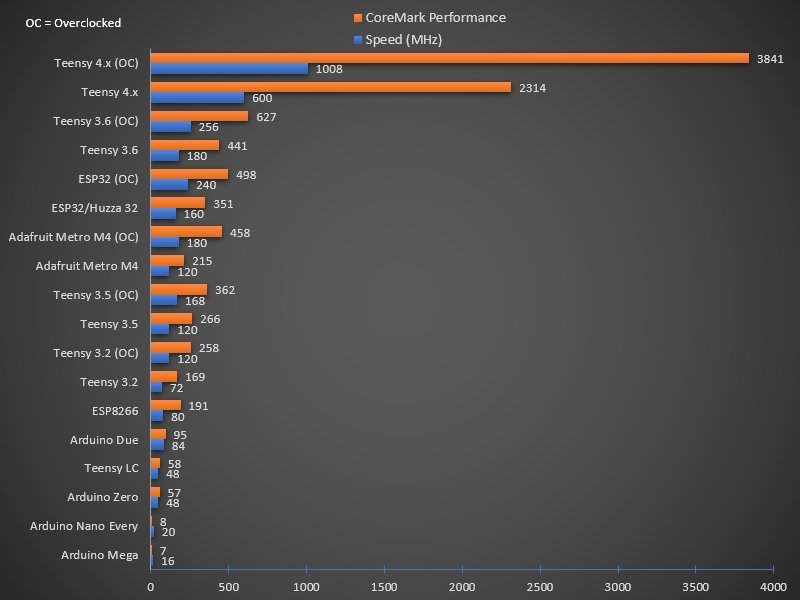 Teensy's performance in comparison to other microcontrollers
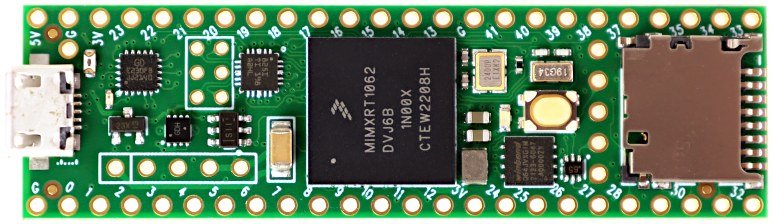 The Teensy 4.1
- Vision Processer: Jetson Orin Nano
- Because I was running a stereoscopic vision algorithm (two different camera streams), I needed a heavy compute processor. Moreover, because this device has a built-in 256 GB SD Card, videos can be saved, to be used for further review.
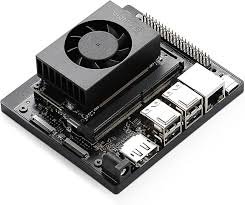 The Jetson Orin Nano
2. Communication For testing purposes (in a home lab), this robot will use Wi-Fi for quick remote control and easier iteration. However, in a real-world situation, Wi-Fi becomes unreliable. This is because both soil and water absorb 2.4 GHz (the same band Wi-Fi uses). If deployed in an underground pipeline, this robot would store its data locally (the Teensy and Jetson log data onto the microSD). After retrieving the robot, logs can be analyzed, and the proper next steps can be taken. 3. Power My first Power iteration utilized two separate battery systems to power each processing component. One battery system was just to power the microcontroller, which then powered the IMU and motors. The other battery system was solely for the Jetson or a nano and its vision system. However, this approach adds unnecessary weight and charging complexity that a user would not appreciate. It also makes the robot harder to troubleshoot. To overcome this issue, I made a one-battery system that feeds power into each component. I branched the voltage down into the rails each subsystem needs through a buck:
- (a) Motor rail (6V): My motors are 6V 50:1 micro metal gear motors, so the drivetrain needs a stable 6V supply. I run the motors through the TB6612FNG motor driver, so the motor supply line is regulated down to 6V before it reaches the driver.
- (b) Jetson rail: The Jetson Orin Nano needs a steady supply as it uses lots of power, like the motors. This is powered directly from the battery.
- (c) Logic rail (5V/3.3V): The Teensy 4.1 and IMU run on low-voltage logic, so I step the battery down to 5V and then regulate as needed for 3.3V sensors.
The battery itself is a 4S LiPo (14.8V nominal) around 5000 mAh, because it gives decent energy while also being able to deliver high current without voltage dropping badly under load. Using a 4S 5000 mAh LiPo, battery energy is: E = V × Ah = 14.8 × 5 = 74 Wh. If the typical draw is about: P ≈ (15 W Jetson + 2 W cameras + 6 W motors + 0.6 W control) / 0.85 ≈ 27.8 W, then the runtime is: t = E / P ≈ 74 / 27.8 ≈ 2.7 hours (closer to \~1.5–2 hours under heavier load).
Analysis
6. Analysis
6.1 Testbed design
Before I begin the robots' field deployment, I will build an in-home controlled test environment that stimulates common failures in a municipal water main. The following are details:
- A transparent PVC pipe shall be used so the robot's motion and sensor outputs can be visually verified.
- Primary diameter: 6-12 inches, because my robot is sized for that class.
- Test sections will include straight runs, 90° elbow and 45° elbows, and T-junctions
Defect simulation: I will simulate defects using swappable inserts so the same defect can be tested across multiple trials:
- Joint misalignment: small internal ridge insert (at a known height)
- Dents/deformation: controlled inward deformation on a flexible liner
- Cracks: A narrow groove will be cut longitudinally and latitudinally
Environment
- Phase 1 testing will be on dry/shallow water pipes. This simulates de-watered pipes and proves the robot can work in any pipe that does not have any contents in it.
- Later tests will add flow using a small pump and a controlled flow rate
6.2 Data collection protocol
To ensure this robot is robust, I will be conducting repeatable trials and making sure all components are reliable.
Trial structure
- For each pipe feature (straight, bend, T-junction, defect section), I will run N = 5 trials minimum per condition. The starting position and battery level are consistent, and I will record an external video for verification and post-analysis.
- What is being recorded in each run
- Time to traverse a fixed distance, where speed can be calculated
- Whether it completes the segment
- IMU stream (orientation, rotation, acceleration)
- Stereo outputs
- Motor commands
6.3 Analysis Methods
These metrics help solidify whether my objectives were met or not:
- Mobility metrics: I will be testing the robot's completion rate (% runs that finish without stuck events), average speed (m/s), and stall events per meter (count)
- Perception metrics (for stereo camera sensing): I will be testing depth error - the mean absolute error between measured depth and true depth, the point cloud completeness (% of pipe wall visible in the reconstruction), and defect detectability.
Once these main tests are finished, I will be able to report on whether I have fulfilled all my original objectives. These tests are a work in progress, and they will be finished by the in-person fair. To get an up-to-date report on this project, please look through this Google document.
Conclusion
8. Conclusion
8.1 Concluding statement
This project proposed and prototyped a low-cost, pipeline in-line inspection robot designed for 6 to 12 inch diameter municipal water mains. Using a combination of stereoscopic vision for sensing and IMU for motor stabilization, powered by a comprehensive processing network, and a sealed spherical robot chassis with an active dry mechanism, it has significantly improved deployability while collecting useful inspection data that can be used after retrieval. In the coming month, the project will be focused on validating its design on a controlled pipe test bed: analyzing its mobility and the quality of its stereoscopic wall constructions.
8.2 Failure modes and mitigations (also show how you are working on mitigating these challenges/how you could)
Failure mode 1: Leakage, which leads to electronics damage
- This could happen because of changing pipe pressures and condensation that builds on the chassis. To mitigate this, I plan to incorporate a more roust gasket/O-ring seam, and add a silicone sealing to the edge of the capsule. I will also find a reasonable but robust transparent robot casing, that can withstand high pressures and pressure surges/drops.
Failure mode 2: Battery limits reduce mission length
- This could happen because the combined computing and motor power drains the battery fairly quickly. Although my calculations suggest a 1.5-hour runtime, this could be shorter due to unforeseen circumstances. To plan and mitigate this, I will run the Jetson in lower power mode when possible, record locally instead of streaming, and use duty cycling (only compute depth when moving).
Citations
APA 7 Reference List
- Bradski, G., & Kaehler, A. (2008). Learning OpenCV: Computer vision with the OpenCV library. O’Reilly Media.
- Digi-Key Electronics. (n.d.). TB6612FNG motor driver IC (product page). Retrieved March 4, 2026, from https://www.digikey.com/en/products/detail/toshiba-semiconductor-and-storage/TB6612FNG-C-8-EL/1027355
- Folkman, S. (2018, March). Water main break rates in the USA and Canada: A comprehensive study. Utah State University, Buried Structures Laboratory. Retrieved March 4, 2026, from https://digitalcommons.usu.edu/cgi/viewcontent.cgi?article=1109&context=mae_facpub
- Hartley, R., & Zisserman, A. (2004). Multiple view geometry in computer vision (2nd ed.). Cambridge University Press.
- Hickey, H. (2008). Water supply systems and evaluation methods: Volume II—Water distribution systems. United States Fire Administration. Retrieved March 4, 2026, from https://firedoc.nist.gov/fire_research_detail.cfm?search_id=20689
- Hirschmüller, H. (2008). Stereo processing by semiglobal matching and mutual information. IEEE Transactions on Pattern Analysis and Machine Intelligence, 30(2), 328–341. https://doi.org/10.1109/TPAMI.2007.1166
- JM Eagle. (n.d.). Water main break rates in the USA and Canada: A comprehensive study (summary page). Retrieved March 4, 2026, from https://jmeagle.com/water-main-break-rates-in-the-usa-and-canada/
- National Research Council. (2006). Drinking water distribution systems: Assessing and reducing risks. The National Academies Press. https://doi.org/10.17226/11728
- NVIDIA. (n.d.). Jetson Orin Nano developer kit (product info). Retrieved March 4, 2026, from https://developer.nvidia.com/embedded/jetson-orin-nano-developer-kit
- OpenCV. (n.d.). Camera calibration and 3D reconstruction (calib3d module documentation). Retrieved March 4, 2026, from https://docs.opencv.org/4.x/d9/d0c/group__calib3d.html
- OpenCV. (n.d.). Depth map from stereo images (Python tutorial). Retrieved March 4, 2026, from https://docs.opencv.org/4.x/dd/d53/tutorial_py_depthmap.html
- Pololu Corporation. (n.d.). Micro metal gearmotors (product category). Retrieved March 4, 2026, from https://www.pololu.com/category/60/micro-metal-gearmotors
- Rusu, R. B., & Cousins, S. (2011). 3D is here: Point Cloud Library (PCL). In 2011 IEEE International Conference on Robotics and Automation (ICRA) (pp. 1–4). IEEE. https://doi.org/10.1109/ICRA.2011.5980567
- Scharstein, D., & Szeliski, R. (2002). A taxonomy and evaluation of dense two-frame stereo correspondence algorithms. International Journal of Computer Vision, 47(1–3), 7–42. https://doi.org/10.1023/A:1014573219977
- Toshiba Electronic Devices & Storage Corporation. (n.d.). TB6612FNG dual DC motor driver IC. Retrieved March 4, 2026, from https://toshiba.semicon-storage.com/
- U.S. Environmental Protection Agency. (n.d.). Drinking water distribution systems (background resources). Retrieved March 4, 2026, from https://www.epa.gov/dwreginfo
- Vuran, M. C., & Akyildiz, I. F. (2010). Channel model and analysis for wireless underground sensor networks in soil medium. Physical Communication, 3(4), 245–254. https://doi.org/10.1016/j.phycom.2010.07.001
- Xylem. (n.d.). SmartBall® in-line leak detection (product page / brochure hub). Retrieved March 4, 2026, from https://www.xylem.com/en-us/brand/pure-technologies/Products-and-Services/Leak-Detection/SmartBall/
- Zhang, Z. (2000). A flexible new technique for camera calibration. IEEE Transactions on Pattern Analysis and Machine Intelligence, 22(11), 1330–1334. https://doi.org/10.1109/34.888718
Acknowledgement
I would like to thank my school science fair coordinator, Mr. Bobby Lahoda, for supporting the submission of my project to this prestigious event. I would also like to thank my mentor, Luke Ryan, who has supported me in designing my project and provided feedback throughout the iterative process. Finally, I would like to thank all the organizers at the Calgary Youth Science Fair who work hard to make this incredible opportunity possible, and for supporting youth like myself in pursuing their dreams as young scientists.