Purifying Plants
Julie Hay
R. T. Alderman School
Grade 6
Presentation
Hypothesis
If six different household plants are tested over the time frame of twenty four hours, then the spider plant will absorb the most CO2 during the day because it has the most leaves, and the most green color. This means that it might have more chloroplasts to help with photosynthesis. The Aloe vera will absorb the most CO2 at night because it is the only Crassulacean Acid Metabolism (CAM) plant out of all of the six plants that were purchased.
Research
Carbon Dioxide
Carbon dioxide (CO2) is one part carbon and two parts oxygen. It is a colorless gas that is produced by mammals when they exhale. It can also be released by plants when they decay (from decomposers in the soil) and from volcanoes. Humans also produce carbon dioxide when they burn fossil fuels. CO2 can be absorbed from the atmosphere by natural processes like photosynthesis and weathering, or by human processes like carbon capturing and storing. This all makes up the carbon cycle, which determines how much CO2 is in the atmosphere at a certain point in time.
Carbon dioxide can be measured in parts per million (ppm). The normal outdoor air CO2 levels are around 400 ppm. Indoor CO2 levels are usually between 400-1000 ppm. If indoor CO2 levels go higher than 1000 ppm then it becomes unhealthy. It can cause headaches, dizziness, difficulty breathing, tiredness, increased heart rate, elevated blood pressure or even tingling!
The amount of CO2 being released into the atmosphere has been increasing at an alarming rate, which is disrupting the carbon cycle. The CO2 concentration in the atmosphere was around 280 ppm in 1750, and it was more than 415 ppm in 2021. Increased CO2 in the atmosphere is causing global warming, which leads to climate change.
Photosynthesis
Plants naturally remove CO2 from the air by the process of photosynthesis. Photosynthesis is the process in which plants (and even cyanobacteria) use sunlight, water and carbon dioxide to create oxygen and energy in the form of sugar.
Photosynthesis happens in the chloroplasts. The chloroplast is a structure inside the plant’s cell. It contains chlorophyll. Chlorophyll is a light absorbing pigment that helps with the production of glucose in the process of photosynthesis. With photosynthesis, chlorophyll absorbs energy from blue and red light waves and reflects green light waves. That’s why the plant appears green!
Cellular Respiration
Cellular respiration is the process in which the cells of all living things (including plants) break down glucose to make energy for the cells to work and do their job.
Cellular respiration is actually the chemical reaction where glucose is broken down because of the presence of oxygen. It causes the waste products of carbon dioxide and water to form in the process, and it releases energy for the cell in the form of adenosine triphosphate (ATP). It happens in three steps: glycolysis, the Krebs cycle (or citric acid cycle) and the electron transport chain. Glycolysis does not require oxygen. It splits glucose into 2 molecules of pyruvate and produces 2 molecules of ATP. The Krebs cycle requires oxygen and uses the pyruvate from glycolysis to make 2 more ATP molecules as well as other molecules that will be used by the electron transport chain. The electron transport chain requires oxygen and uses the molecules from the Krebs cycle to make 32 molecules of ATP.
Household plants in this experiment
| Aloe Vera | Has a special way of photosynthesizing called Crassulacean Acid Metabolism (CAM). This means that instead of performing photosynthesis in the daylight, it photosynthesizes at night. It is a desert plant, meaning that it is adapted to a very hot climate. It closes its stomata (small pores used for gas exchange between carbon dioxide and oxygen) in the day to conserve water and opens its stomata at night when it’s less hot. |
|---|---|
| Dracaena | Photosynthesizes in the daylight, making it like the more common plants. |
| Spider Plant | Photosynthesizes in the daylight, making it like the more common plants. |
| Chinese Evergreen | Photosynthesizes in the daylight, making it like the more common plants. It has short regular sized leaves that have a pink inside and a dark green outside that gives it an appealing look. |
| Weeping Fig | Photosynthesizes in the daylight, making it like the more common plants. |
| Areca Palm | Photosynthesizes in the daylight, making it like the more common plants. |
Variables
| Manipulated variable | Species of plant |
|---|---|
| Controlled variables | Pot type and size, amount and type of soil, amount of water, light intensity, how long the light stays on, times the CO2 values are measured, plant dome, CO2 meter, measuring cup, scale, temperature and humidity as best as possible |
| Responding variable | Amount of CO2 (ppm) inside the plant dome |
Procedure
Materials:
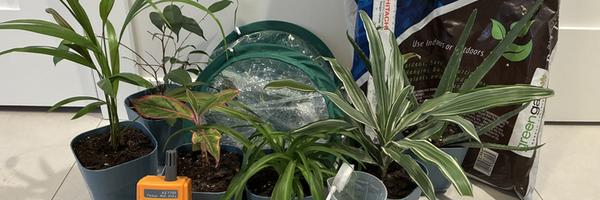
- 6 household plants (Spider plant (Chlorophytum Comosum), Aloe Vera (Aloe Barbadensis Miller), Chinese evergreen (Aglaonema), Dracaena (Dracaena Deremensis), Areca palm (Dypsis Lutescens), Weeping fig (Ficus Benjamina))
- Plant dome
- Clear packing tape
- Camera
- Grow lamp
- Ruler
- Lux meter
- Scale
- 7 identical flower pots
- Soil (Green Gate all purpose potting mix)
- Measuring cup
- Water
- CO2 meter(also measures temperature and humidity)
Procedure:
- Gather materials - when buying the plants, make sure all of the pot sizes they come in are the same
- Choose a room where the temperature can stay consistent and where the door can stay closed.
- Set up the plant dome, cut out the bottom of the dome and then seal the zipper on both sides with clear packing tape. Also, tape the top and bottom of the dome with clear packing tape to make sure it is sealed.
- Set up the grow lamp to the correct height above the dome so the light intensity is the same - check to make sure it is the same height above the top of each plant or the top of the pot for just the soil
- Weigh an empty pot. Put 4 cups of soil into that pot and weigh it again. Add 150 mL of water to the soil and weigh again. Then put the pot of soil into the plant dome, along with the CO2 meter, and turn the CO2 meter on the proper setting so it won’t turn off on it’s own. Tape all around the bottom of the dome and attach to the floor with tape.
- Turn on the grow lamp and set the 12 hour timer on the lamp so it stays on from 8am to 8pm. Record CO2 value, temperature and humidity every 2 hours starting at 8:00 a.m. (right after the CO2 meter and lamp have been turned on) and ending 24 hours later.
- Prepare plants. Gently remove as much old soil from the roots as possible and repot the plant that will be tested first.
- Weigh the empty pot. Put 4 cups of soil with the plant into the pot and weigh again. Add 150mL of water to the plant right before placing it in the plant dome and weigh that too.
- Place plant into the plant dome along with the CO2 meter and follow the same steps as above. Record CO2 value, temperature and humidity every 2 hours starting at 8:00 a.m. (right after the meter and lamp have been turned on) and ending 24 hours later
- Repeat these steps with all the other plants for three trials
Observations
Qualitative Observations:
| Aloe Vera | Tall, green stems with small spikes. Slightly squishy stems. Small white dots along the stems of the Aloe vera. |
|---|---|
| Dracaena | White stripes along the outer edge of the leaf, tall stems that almost look criss crossed like a banana tree. |
| Spider Plant | Long slightly curled leaves. Lots of green color to the leaves. The plant is very close to the ground. |
| Chinese Evergreen | Pink stem with leaves that have a darker pink outline to them. The leaves have a green inside, medium sized leaves with an almost curled look to them. |
| Weeping Fig | Tall brown stems that look like bark. Dark green leaves that are short and wide. The stems are thin and long. |
| Areca Palm | Tall stems with a slightly yellow tinge to them with tiny brown freckles. Long leaves that reach up to the sky. Long green leaves. |
Qualitative Observations:
Pictures of the stomata from 6 different plants from under the microscope are in the logbook.
Quantitative Observations (sample calculations for the tables are in the logbook):
Plant leaf surface area: calculations are in the logbook
Table 1. Average CO2 in the plant dome over 24 hours from trials 1-3
| Time | Soil | Aloe Vera | Dracaena | Chinese Evergreen | Spider Plant | Weeping Fig | Areca Palm |
|---|---|---|---|---|---|---|---|
| 8:00 AM | 576.7 | 677.3 | 651.7 | 619.0 | 606.3 | 578.7 | 610.7 |
| 10:00 AM | 927.7 | 983.3 | 968.7 | 959.7 | 865.7 | 862.3 | 882.7 |
| 12:00 PM | 944.0 | 1010.7 | 944.7 | 928.0 | 915.3 | 857.3 | 864.7 |
| 2:00 PM | 882.3 | 984.7 | 900.0 | 854.7 | 901.0 | 785.3 | 807.3 |
| 4:00 PM | 831.0 | 947.7 | 855.7 | 784.7 | 860.3 | 771.0 | 754.7 |
| 6:00 PM | 831.3 | 954.0 | 854.0 | 778.7 | 842.0 | 762.0 | 720.3 |
| 8:00 PM | 815.0 | 970.0 | 853.3 | 757.0 | 798.0 | 748.3 | 691.3 |
| 10:00 PM | 780.7 | 927.0 | 884.3 | 745.7 | 846.3 | 767.7 | 719.7 |
| 12:00 AM | 773.7 | 883.0 | 941.3 | 715.3 | 894.7 | 813.0 | 742.0 |
| 2:00 AM | 753.0 | 866.0 | 951.3 | 700.3 | 905.7 | 819.7 | 734.3 |
| 4:00 AM | 705.7 | 839.7 | 931.7 | 686.0 | 892.0 | 795.3 | 712.3 |
| 6:00 AM | 665.7 | 803.3 | 902.3 | 667.0 | 872.0 | 766.3 | 699.0 |
| 8:00 AM | 688.3 | 813.3 | 925.0 | 665.7 | 865.3 | 780.7 | 723.0 |
Table 2. Average change in CO2 in the plant dome over 24 hours from trials 1-3
| Time | Soil | Aloe Vera - soil | Dracaena - soil | Chinese Evergreen - soil | Spider Plant - soil | Weeping Fig - soil | Areca Palm - soil |
|---|---|---|---|---|---|---|---|
| 8:00 AM | 0 | 0 | 0 | 0 | 0 | 0 | 0 |
| 10:00 AM | 351.0 | -45.0 | -34.0 | -10.3 | -91.6 | -67.4 | -79 |
| 12:00 PM | 367.3 | -33.9 | -74.3 | -58.3 | -58.3 | -88.7 | -113.3 |
| 2:00 PM | 305.6 | 1.8 | -57.3 | -69.9 | -10.9 | -99 | -109.0 |
| 4:00 PM | 254.3 | 16.1 | -50.3 | -88.6 | -0.3 | -62 | -110.3 |
| 6:00 PM | 254.6 | 22.1 | -52.3 | -94.9 | -18.9 | -71.3 | -145.0 |
| 8:00 PM | 238.3 | 54.4 | -36.7 | -100.3 | -46.6 | -68.7 | -157.7 |
| 10:00 PM | 204.0 | 45.7 | 28.6 | -77.3 | 36.0 | -15 | -95.0 |
| 12:00 AM | 197.0 | 8.7 | 92.6 | -100.7 | 91.4 | 37.3 | -65.7 |
| 2:00 AM | 176.3 | 12.4 | 123.3 | -95.0 | 123.1 | 64.7 | -52.7 |
| 4:00 AM | 129.0 | 33.4 | 151.0 | -62.0 | 156.7 | 87.6 | -27.4 |
| 6:00 AM | 89.0 | 37.0 | 161.6 | -41.0 | 176.7 | 98.6 | -0.7 |
| 8:00 AM | 111.6 | 24.4 | 161.7 | -64.9 | 147.4 | 90.4 | 0.7 |
Table 3. Average change in CO2/gram of the plant in the plant dome over 24 hours from trials 1-3
| Time | Aloe Vera - soil | Dracena - soil | Chinese Evergreen - soil | Spider Plant - soil | Weeping Fig - soil | Areca Palm - soil |
|---|---|---|---|---|---|---|
| 8:00 AM | 0 | 0 | 0 | 0 | 0 | 0 |
| 10:00 AM | -0.166 | -0.418 | -0.368 | -1.858 | -1.685 | -2.753 |
| 12:00 PM | -0.125 | -0.914 | -2.082 | -1.183 | -2.218 | -3.348 |
| 2:00 PM | 0.007 | -0.705 | -2.496 | -0.221 | -2.475 | -3.798 |
| 4:00 PM | 0.059 | -0.619 | -3.164 | -0.006 | -1.550 | -3.843 |
| 6:00 PM | 0.081 | -0.643 | -3.389 | -0.383 | -1.783 | -5.052 |
| 8:00 PM | 0.201 | -0.451 | -3.582 | -0.945 | -1.718 | -5.495 |
| 10:00 PM | 0.168 | 0.352 | -2.761 | 0.730 | -0.375 | -3.310 |
| 12:00 AM | 0.032 | 1.139 | -3.596 | 1.854 | 0.933 | -2.289 |
| 2:00 AM | 0.046 | 1.517 | -3.393 | 2.497 | 1.618 | -1.836 |
| 4:00 AM | 0.123 | 1.857 | -2.214 | 3.178 | 2.190 | -0.955 |
| 6:00 AM | 0.136 | 1.988 | -1.464 | 3.584 | 2.465 | -0.024 |
| 8:00 AM | 0.090 | 1.989 | -2.318 | 2.990 | 2.260 | 0.024 |
Graphs:


Analysis
Based on the data that was collected during the experiment, the Areca palm showed the best results in the daylight, while the Chinese evergreen showed the best results during the nighttime.
From the data, the Areca palm showed the best results in the light, letting the plant have a higher absorption rate up until 8:00pm. The Weeping fig came second for the plants in the light, staying the closest to the Areca palm until around 4:00pm. The Chinese evergreen came in third for the daylight plants, coming in third behind the Weeping fig until absorbing more than the Areca palm around 6:00 pm. Coming in fourth, the Dracaena absorbed worse than the weeping fig all the way until 8:00pm but showed improvement when the light was turned off. The Spider plant came fifth, barely absorbing by around 2:00pm and then absorbing more around the 8:00pm mark. Coming in last was the Aloe vera. Being a CAM plant, the Aloe vera likely closed its stomata at around 2:00pm, and was releasing more CO2 around 8:00pm which was surprising. As the control, the soil released much more CO2 than the plants. After 12.00pm, the soil started to release less CO2, meaning that there could have been some organisms photosynthesizing in the soil or the soil was respiring less. At around 4:00pm, the soil started to respire less, making the CO2 go down slightly.
From the data that was collected during the night, the plant with the best results was the Chinese evergreen. The Chinese evergreen came in first place all the way to the end of the time frame. Coming in second place was the Areca palm, getting ahead of the Chinese evergreen at 10:00 pm but doing worse than the Chinese evergreen at 12:00 pm. Coming in third place was the Aloe vera. Being a CAM plant, the Aloe vera should have done better than the other two but it didn’t, which was surprising. Coming in fourth place was the Weeping fig, which did better then the Aloe vera at 10:00 pm but then did worse than the Aloe vera at 12:00 am. At fifth place, the Spider plant showed some of the worst results out of all of the plants according to the data. At 2:00 am, the Spider plant had a much higher respiration rate than the other plants, doing worse than the Dracaena at 6:00 am but absorbing more CO2 at 8:00 am. In last place came the Dracaena. The Dracaena was doing quite well until 4:00 am when it started to respire more than the other plants, coming in very close to the Spider plant. The soil did the worst until 4:00 am when the Spider plant and Dracaena started their respiration cycle. At 8:00 am, the soil started to respire more, still doing better than the Dracaena and Spider plant.
The Areca palm had the best results in the light, which might have been due to the plant’s wider leaf span and more densely packed stomata. It had the third largest leaf surface area from all the plant leaves that were tested and the second most densely packed stomata. The Dracaena had the largest leaf surface area, but it had the second least densely packed stomata. The Aloe vera had the second largest leaf surface area but the least densely packed stomata. It is also a CAM plant, so it closes it's stomata during the day. Since the Areca palm had the third largest leaf surface area, but more densely packed stomata than the Aloe vera and Dracaena, that's likely why the palm had a higher photosynthesis rate. Since the graph that showed CO2 absorption/gram of household plants wasn’t much different from the first graph, the mass didn’t seem to affect how the plant absorbed CO2. The Areca palm and Chinese evergreen actually ended up weighing the least of all of the plants, so the heaviest plants did not photosynthesize the best.
The Chinese evergreen showed the best results with no light. Knowing that the Chinese evergreen is not a CAM plant, meaning that it releases CO2 at night, made the results confusing. With the Aloe vera being a CAM plant, it should have in theory done the best at night, because that’s when it’s stomata open, though by the third trial, the leaves were looking more droopy, which might have lead to poor results at the end of trial three. The Chinese evergreen may have also been under stress, causing it to act a bit different in the dark than it normally would.
Conclusion
My hypothesis was proven incorrect. The Areca palm worked the best in the light, not the spider plant. The Areca palm has broader and longer leaves, which gives it a higher leaf surface area, and it also has more densely packed stomata (for more gas exchange). This is likely why it photosynthesized more than some of the other plants. The Chinese Evergreen absorbed the most CO2 in the dark, not the Aloe vera, which was surprising. The Aloe leaves were looking a bit more droopy by the end, probably from all of the repotting, so that may be part of the reason it didn’t do as well.
I also learned that because soil actually respires, the amount of CO2 absorbed by all of the household plants wasn’t enough to lower the CO2 level in the dome (Figure 1). The soil actually released more CO2 than the plants absorbed. This means that small household plants don’t seem to make a difference in a small room, meaning that for them to actually help, something needs to be done to stop the soil from releasing CO2 into the air. This could possibly be solved by having some type of a soil cover, or trying to grow plants in something other than soil.
Application
Applications:
- When you’re in a stuffy space with a lot of people, the CO2 levels can become high. In theory, if there are enough plants around, the air around you should become cleaner and healthier, because the plants will photosynthesize, leaving behind more oxygen and less CO2.
- In the winter, CO2 levels build up more easily because we don’t want to open our windows. That’s when CO2 absorbing plants would be especially helpful.
- Figuring out which types of trees would absorb the most CO2 when thinking about replanting trees after a forest fire or just when planting more trees in general could potentially help with the greenhouse effect and climate change.
- Studying the density of the stomata of different plant species can help identify which species would be better at gas exchange and absorb more CO2. This could help to see if genetically modifying plants so that they have more stomata would help fight climate change.
- Each of us has a carbon footprint. By covering the soil over our household plants without causing root rot, or findings ways to grow household plants without soil, it will help decrease our carbon footprint and improve the air quality around us at the same time.
- Make green roofs and green walls that use hydroponics or other growing media (that don’t release a lot of CO2) instead of soil for sustainable infrastructure.
- Find ways to reduce open areas of soil out in nature by using renewable resources like plants and trees to fill in those areas. Also make sure good techniques are used to try and control soil erosion when farming.
Next Steps:
- Test different forest trees to see which ones absorb the most CO2, possibly in a bigger space like a greenhouse.
- Test different covers to put over top of the soil of potted plants (like beads, cloth, mulch, stones, etc.) to see which covering would release the least amount of CO2 from respiration of the soil into the air without suffocating the roots. That way a plant could make more of a difference in a small space when trying to decrease CO2 levels in the air.
- Experiment on ways plants can be grown without soil so that they can still photosynthesize but have less CO2 released from soil respiration, like hydroponics.
- Test the same plant with different temperatures or humidity or different light wavelengths and intensities to see what the best conditions for photosynthesis and CO2 absorption would be for that plant.
- Test plants being used for sustainable infrastructure in a closed space to see which plants absorb the most CO2 and also to make sure that the soil or media being used to grow them in isn’t releasing a lot of CO2.
- Look at the stomata of many different species of plants to see which species might be best at gas exchange.
Sources Of Error
- The plants were only tested for 24 hours. If there had been more time, testing each plant for more than a day may have produced more reliable results.
- Surface area, shapes and heights of plants were not the same because they were all different species
- Some soil had more twigs. This might have affected the weight and how much the soil respired.
- The humidity wasn’t exactly the same for every plant (even though each plant was given the exact same amount of water right before being put into the plant dome). This could have affected how the plant photosynthesized.
- The plant dome may not have been fully sealed (even though every seam on it was taped, and it was taped to the floor). This would have let in some outside air.
- The temperature was close, but never exactly the same for each plant. Even though the dome was in the most controlled room in the house (the basement bathroom away from ventilation), the temperature would still change a bit when the house temperature changed.
- The plants were probably under stress from being repotted 3 times, which could have caused poorer results from the plants themselves.
Citations
Lemon, M. (2025, July 8). NASA compiles list of best plants to Clean Indoor Air. CO2 Meter. https://www.co2meter.com/en-ca/blogs/news/nasa-compiles-list-of-best-plants-to-clean-indoor-air?srsltid=AfmBOor3rUvczw-Vtux36wur6-CvmWQM62vHQh2lAQxaBAGTkmqF_uNL Plant - photosynthesis\, chloroplasts\, light | britannica. (n.d.). https://www.britannica.com/plant/plant/Photosynthesis Carbon dioxide. Wisconsin Department of Health Services. (2025, January 8). https://www.dhs.wisconsin.gov/chemical/carbondioxide.htm#:~:text=Exposure%20to%20carbon%20dioxide%20can,coma%2C%20asphyxia%2C%20and%20convulsions Professor Dave Explains (n.d) YouTube. https://www.youtube.com/watch?v=8oodcy8SEBk&t=24s Photosynthesis. Education. (n.d.). https://education.nationalgeographic.org/resource/photosynthesis/ Amoeba sisters (n.d.-a). YouTube. https://www.youtube.com/watch?v=eJ9Zjc-jdys Photosynthesis: Uses of glucose in plants. Study Mind. (2024, July 12). https://studymind.co.uk/notes/photosynthesis-uses-for-glucose/ Mukherjee, S. (2020, April 21). Photosynthesis – definition, steps, and formula with diagram. Science Facts. https://www.sciencefacts.net/photosynthesis.html Dhali, D. (2021, November 26). Cellular respiration - definition, types, equations & steps. Science Facts. https://www.sciencefacts.net/cellular-respiration.html What is carbon capture and storage? | natural history museum. (n.d.-b). https://www.nhm.ac.uk/discover/quick-questions/what-is-carbon-capture-and-storage.html Carbon cycle. Understanding Global Change. (2020, September 10). https://ugc.berkeley.edu/background-content/carbon-cycle/#heading1 Lebling, K., & Denvir, A. (2026, February 4). 6 ways to remove carbon pollution from the atmosphere. World Resources Institute. https://www.wri.org/insights/6-ways-remove-carbon-pollution-sky#:~:text=Plants%20remove%20carbon%20dioxide%20from,tree%20cover%20in%20urban%20areas Lehman, C. (2022, March 24). How can plants be a renewable resource?. Sciencing. https://www.sciencing.com/can-plants-renewable-resource-6328837/
Acknowledgement
I would like to acknowledge my mom, who helped me with things in my experiment when I needed an extra hand. I would also like to acknowledge Mr. Bykovskikh, who encouraged me to keep looking deeper into my science fair project.