My CAR broke down! Bone marrow biomarkers predicts patient response to CAR T-cell therapy
Grade 10
Presentation
Hypothesis
|
If gene expression is measured in BM of patients before recieiving CAR T-cell therapy, then there will be differently expressed genes between CR and nonresponding patients because the BM environment effects the success of CAR T-cell therapy. |
Research
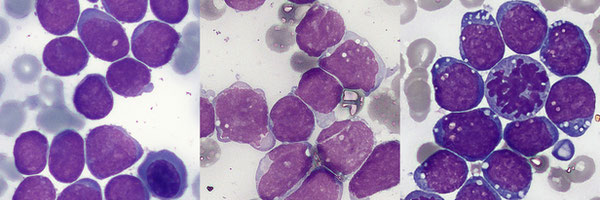
Acute Lymphoblastic Leukemia
Acute lymphoblastic leukemia (ALL) is a cancer characterized by large amounts of poorly differentiated white blood cells in the blood. ALL is most common in children, who make up 80% of ALL cases, and around the age of 50. While ALL makes up only 1% of cancers worldwide, it is the most common cancer that affects children and makes up 30% of all pediatric cancers. Most cases affect children from 2-5 years of age. However, approximately 3000 children under the age of 20 are diagnosed every year. Early signs of ALL include fatigue, easy bruising or bleeding, anemia, shortness of breath, frequent infections, and weight loss.
ALL is caused by the accumulation of poorly differentiated lymphoid cells in bone marrow (BM). All immune cells start from stem cells, cells that can turn into any cell type. Lymphoid cells are a type of stem cell that differentiates into B cells and T cells. In ALL, genetic mutations in the cells prevent them from maturing and instead causes them to multiply uncontrollably, crowding out healthy cells and spreading throughout the body. The two main types of ALL are T cell and B cell ALL. B cell ALL is the most common type of ALL, making up 80% of cases. ALL is diagnosed with a complete blood count, peripheral blood smear, and bone marrow examination. A diagnosis is made when the lymphoid cells make up 90% of the white blood cell count and when 25% or more of the cells in the bone marrow are lymphoids (they typically make up 10-20% of cells in healthy bone marrow). Complete remission (CR) is achieved when there are no signs of leukemia cells in the blood or bone marrow after treatment, and less than 5% of lymphoids are found in the bone marrow. Chemotherapy is the main treatment for ALL and involves the use of anti-cancer drugs to destroy fast-growing cells. Chemotherapy is generally given in three phases; induction, consolidation and maintenance, over a 2 to 3 year period. The induction phase achieves complete remission and restores blood cell production. Common medications include vincristine and corticosteroids. However, chemotherapy has limitations against genetic abnormalities in patients like Philadelphia chromosome, when less than 40% of patients are cured with chemotherapy. Chemotherapy is also ineffective against patients with several relapses and those with refractory ALL (ALL that doesn’t respond to initial medication).
The 5-year net survival rate for ALL is 51%. This means 51% of all people diagnosed with ALL will survive for at least 5 years after diagnosis. One of the biggest barriers to ALL treatment is the potential to relapse after chemotherapy, whose regimens present poor prognosis rates and high mortality rates.
Chimeric antigen receptor (CAR) t-cell therapy has emerged as a promising therapy in the last few decades to avoid chemotherapy resistance. For example, the cancer remission rate for patients prior to receiving CAR t-cell therapy ranges from 10-70%, with CAR t-cells the rate is 70-94%.
Chimeric antigen receptor (CAR) T-cell therapy
CD19 CAR t-cells are t-lymphocytes (t-cells) genetically engineered to express CD19 CAR receptors on their surface.
T lymphocytes play a major role in the adaptive immune system, regulate immune-related responses, and prevent diseases. T-cells develop from bone marrow, and can be broadly grouped into CD4+ and CD8+ cells. T-cells recognize antigens on the surface of cells with the T-cell receptor (TCR). Once recognized, T-cells undergo the process of killing infected cells and regulating the immune response. In contrast to the TCR, a Chimeric Antigen Receptor (CAR) is a synthetic receptor designed to recognize specific antigens. Typically, CAR T-cells target antigens that are upregulated (occur more often) in cancer cells or only found in cancer cells. The CAR T-cell recognizes and binds to the specific antigen, triggering a signaling cascade within the cell. Similar to the process of a normal T-cell, the CAR T-cell then kills the target cell with cytokines (signaling proteins) or with the help of other immune cells such as natural killer cells. CD19 CAR T-cells target the CD19 antigen by binding to the antigen recognition domain (scFvs), it has shown efficacy in treating ALL as CD19 is highly expressed among B-cells.
The process of producing CAR T-cells can be divided into two parts, the manufacturing stage and the administration stage. To manufacture CAR T-cells, either type of T-cell is isolated from the patient's blood by using a centrifuge or leukapheresis (a procedure in which T-cells are separated from red blood cells, plasma, and platelets, the latter of which is returned to the patient). After being enriched, T-cells are genetically modified with a viral or nonviral approach. Viral approaches are more common, and use lentivirus or retroviruses to introduce new DNA into the cell. Non-viral approaches include the use of plasmids. Both methods integrate modified DNA into the T-cell. The cell then uses the modified genetic material to produce CARs on its surface.
After manufacturing, around 108 T-cells () are infused into the patients in a healthcare facility. A few days before infusion, patients go through lymphodepleting conditioning, a type of chemotherapy that reduces the number of immune cells.
All current CAR T cell therapies are autologous, meaning cells are supplied from the patient. Patients need to wait for the long and costly manufacturing process, those eligible for CAR T-cell therapy often have advanced malignancies that quickly deteriorate their health.
CAR t-cell therapy is not the first line of defense, due to the potential toxicities associated with it. For example, cytokine release syndrome (CRS) results when T-cells become extremely activated and release large amounts of cytokines. Symptoms include fatigue, headaches, rashes, diarrhea, and in severe cases multiorgan failure, respiratory failure, renal failure, and possible death. 46% of ALL patients develop severe CRS. Neurotoxicity is common and occurs in 67% of ALL patients, and can cause confusion, word-finding difficulties, cerebral edema, coma, and seizures. There is no approved treatment for either CRS or neurotoxicity. This makes it important to optimize CAR t-cell therapy and increase the chances of a successful response.
Nonresponse
10-20% of ALL patients treated with CAR T-cell therapy are nonresponders; patients who do not achieve measurable remission 63 days after cell infusion. The two main causes are poor cell expansion and lack of CAR T-cell persistence. Nonresponse is a concerning phenomenon due to the lack of current mitigation strategies.
Bone marrow microenvironment
Some studies have shown that the gene expression of BM impacts the success of CAR t-cell therapy and that there is a clear difference between the BM of patients in CR and nonresponders. These findings suggest that BM has the potential to indicate CAR t-cell therapy outcomes in patients.
Zhang et al performed RNA sequencing on the BM of 4 ALL patients before receiving CAR t-cell therapy. They found that the patient who had no response to the therapy expressed different genes compared to those who had a successful response in the BM even prior to treatment. Most notably, they found that the no-response patient had fewer CD8+ t-cells and genes relating to the activity of CD8+ t-cells had much lower expression levels. The absence of t-cells in nonresponders may be associated with poor outcomes for the patient. NRBP1, a gene responsible for a tumor suppressor in cell death regulation, was upregulated in patients in remission, while indicators of poor prognosis, JCHAIN, and TCL1A were downregulated.
Anil et al found that the BM of nonresponders had significantly more severe BM fibrosis (BM scar tissue) prior to therapy compared to those in CR. Fibrosis can impair the ability of CAR T-cells to physically engage with tumor cells, fibrosis may also alter signals that CAR T-cells rely on for survival. Supporting this, they found that genes relating to extracellular matrix development (EMD) were upregulated in nonresponders (for example, ACAN and COLA11A1). Fibrosis is characterized by increased EMD.
Identifying nonresponding patients before treatment can spare them the toxicities of CAR T cell therapy and its cost, and allow clinicians to select alternative therapies. Additionally, the determinants of remission are largely unknown. It is important to determine the biomarkers of successful therapy responses to inform clinicians of which patients will respond favorably and which will not. Biomarkers of bone marrow can also inform strategies to increase the chance of success of CAR T-cell therapy. Studies in the past have looked at biomarkers of therapy success in CAR T-cells themselves, however, few studies have looked at the bone marrow environment prior to therapy. The objective of this project is to use statistical methods to determine differently expressed genes in the bone marrow of patients with a successful response to CAR t-cell therapy when treating ALL compared to nonresponders.
Variables
|
Responding: genes and pathways expressed in BM microenvironment |
|
Manipulated: Patient outcome to therapy, CR or nonresponder |
|
Constant:
|
|
I do not have a control group, because neither group is a healthy control. My group of interest is nonresponders. |
Procedure
I used RNA-sequencing data collected from the BM of 27 ALL patients before receiving CAR t-cell therapy. I first accessed the dataset using ascension number GSE153670 on the Gene Expression Omnibus database. The data was then downloaded as a .csv file and I imported it into R on RStudio. The DESeq package was used to identify differently expressed genes, and the enrichGO package was used to identify differently expressed pathways. To annotate the function of significant genes, I used the National Library of Medicine gene database.
RNA-Sequencing
RNA-sequencing tells us which genes are active in cells, and how much they are transcribed. RNA is first extracted from cells and broken into sequencing reads, shorter segments of RNA. This is done because RNA strands are thousands of bases long, but the sequencing machine can only read a few hundred bases at once. The RNA reads are matched up with DNA to determine the gene expressed. Counts are the number of RNA fragments that match up to one gene. If there are more count reads for a gene, the gene is expressed more because it has more RNA fragments matching up to it. The dataset I used has the gene name in the index and participant samples in the columns with count reads in the matrix. “CR” refers to a CR patient, and “NR” refers to a nonresponder. Read counts are normalized, meaning they are increased or decreased based on the read count of other cells. Normalization is important because some genes might have lower read counts due to external factors, one sample might have a lot of low-quality discarded reads or may have a higher concentration of reads from the production process.

Image of gene expression data. The first column is the gene names, the following columns are the sequencing results from patients. The matrix is the read counts.
Deseq2 and Wald’s Test
The goal of Deseq2 is to identify differently expressed genes, genes that have a statistically significant difference in expression between CR and nonresponders. Deseq2 uses Wald’s Test (a statistical test similar to the T-test) to compare read counts between the two groups. The null hypothesis is that there are no differently expressed genes, the alternative hypothesis is that there are differently expressed genes. Wald’s Test outputs a p-value. A p-value below 0.05 proves the alternative hypothesis (if the p-value for a gene is below 0.05, the gene is differently expressed). Statistical significance is important because it indicates whether the observed effect is due to a real world effect or random chance.
Deseq2 reports both adjusted p-value and unadjusted p-values for each gene. Adjusted p-value is a better option for gene expression analysis than normal p-value because of false positives. A cut-off point for the p-value indicates 1% of tests done are false positives, or 1% of genes that are statistically significant actually are not. Gene expression analysis tests hundreds of thousands of genes, so looking at normal p-value means a large number of genes would be declared differently expressed when in actuality they are not. To combat this, p-values are raised to become adjusted p-values, decreasing the amount of significant genes and the amount of false positives.
Another criterion I used to determine significance was log 2 fold change (log2FC). A gene being statistically significant does not mean it is clinically significant or has a real impact. log2FC indicates the magnitude of the difference in gene expression between the two groups. log2FC shows if a gene is upregulated (expressed more in the CR group) or downregulated (expressed less often in the CR group). log2FC > 0 indicates upregulation and log2FC < 0 indicates downregulation. The absolute cut-off value for significance I used was 1.5, the absolute value of log2FC needs to be greater than 1.5 to be considered significant.
Gene ontology
Gene ontology (GO) is used to determine the function of sets of genes. GO finds the biological process implicated by differentially expressed genes . The GO database contains genes and the function associated with them. enrichGO will find that given a set of significant genes, which GO terms are overrepresented or under-represented. The output for enrichGO is the GO annotation and adj p-value. I used the same criteria for significant pathways (adj p<0.05) as I did for significant genes.
Observations
Most upregulated genes in BM of CR patients
|
Gene Name |
Adj p-value |
log2FC |
Functions |
|
MIPOL1 |
0.00009 |
5.9 |
|
|
IRX2 |
0.0002 |
5.94 |
|
|
TRPC6 |
0.01 |
4.31 |
|
|
GDF10 |
0.04 |
4.08 |
|
Most downregulated genes in BM of CR patients
|
Gene Name |
Adj p-value |
log2FC |
Functions |
|
IGF2BP1 |
8.2E-20 |
-11.78 |
|
|
BIRC7 |
9.7E-20 |
-8.45 |
|
|
KLF15 |
0.0002 |
-5.27 |
|
|
KIF26B |
0.0002 |
-5.21 |
|
|
SRRM3 |
8.16E-5 |
-5.16 |
|
|
BRINP2 |
0.04 |
-5.03 |
|
Most significant pathways enriched in CR patients
|
Pathway |
Fold Enrichment |
Adj p-value |
|
Chronic inflammatory response |
20.24 |
0.02 |
|
Regulation of complement activation |
18.4 |
0.02 |
|
Negative Regulation of Interleukin-10 production |
17 |
0.02 |
|
Regulatory t-cell differentiation |
13.49 |
0.01 |
|
Positive regulation of TGF-beta signaling pathway |
12.88 |
0.04 |
Most significant pathways enriched in nonresponding patients
|
Pathway |
Fold Enrichment |
Adj p-value |
|
Membrane depolarization during cardiac muscle action potential |
22.3 |
0.03 |
|
Regulation of heart rate by cardiac conduction |
16.36 |
0.02 |
|
Cardiac muscle cell action potential involved in contraction |
10.5 |
0.04 |
|
Embryonic skeletal system development |
9.77 |
0.001 |
Analysis
I analyzed BM gene expression in 27 ALL patients before receiving CAR t-cell therapy. 8 patients were nonresponders to therapy and 19 patients were in CR. I found 284 differently expressed genes. 148 genes were upregulated and 136 genes were downregulated in CR patients (my hypothesis was correct). I also found 104 enriched pathways in CR patients and 27 in nonresponders. Even prior to receiving CAR t-cell therapy, the BM of patients that would have a successful response to the therapy express different genes than in patients who would have no response.
- The most upregulated genes in CR patients have functions like regulation of Transforming Growth Factor Beta (TGF-beta) proteins (adjp=0.04), tumor suppression (adjp<0.01), and vertebrate embryo formation (adjp<0.01).
- The most downregulated genes in CR patients have functions like mRNA binding (adj p<0.01), and DNA binding (adj p<0.01) and are implicated in cancer (adj p <0.05).
- The most enriched pathways in CR patients were related to inflammation (adj p<0.05 ), complement activation (adj p<0.05), and Interleukin-10 regulation (adj p<0.05).
- The most enriched pathways in nonresponders were related to cardiac function (adj p <0.05) and embryonic development (adj p <0.05)
- My results are supported by current research. One of the most significant pathways in CR patients is the Negative regulation of Interleukin-10 (IL-10)
Negative regulation of IL-10 means that IL-10 is suppressed in the BM of CR patients. IL-10 is an immune cytokine that inhibits the function of immune cells, dampens immune response and is secreted by various types of immune cells. Cytokines regulate the antigen sensitivity of t-cells.
Smith et al (2018) infected mice with lymphocytic choriomeningitis virus (LCMV), a strain of virus. Some mice were infected with a LCMV strain that encouraged IL-10 production, and some were given a strain that didn’t. Both groups were also given CD8+ t-cells. The researchers found that t-cells in mice infected with the IL-10 promoting virus were less sensitive to the virus compared to mice infected with the normal strain. T-cells in the IL-10 promoting mice needed a higher concentration of viral peptides to induce an immune response compared to t-cells in the normal mice. T-cells harvested from the IL-10 promoting mice had a reduced ability to kill cells coated with low concentrations of peptide, but their function was restored when IL-10 was removed. This suggests that IL-10 makes t-cells less sensitive to antigens and reduces their efficacy.
Negative regulation of IL-10 in BM of CR patients could have an impact on therapy success. The observations Smith found of t-cells could also apply to CAR t-cells in my project as well. Reducing levels of IL-10 makes t-cells more efficient and possibly makes it easier for CAR t-cells to kill leukemia cells, increasing the chances of remission and therapy success. This suggests that levels of IL-10 in BM can create a friendly or hostile microenvironment, and that IL-10 is a potential therapeutic target.
The results of enriched pathways in nonresponders were surprising. I expected enriched pathways to be related to immune response or tumors, but I found the pathways to be related to cardiac cell action potential instead. This may be related to ion channels in cardiac cells and T-cells. Action potentials are generated in cardiac cells by selectively permeable ion channels (ie Na and Ca channels). Ca and Na channels also play a critical role in t-cell function. For example, Orai-STIM is a Ca channel found in most immune cells that increase levels of intracellular Ca, critical to the activation of cytokines like Interleukin-2 and Interleukin-6. Patients with dysfunctional Orai1 or STIM1 have reduced numbers of regulatory t-cells and dysfunctions in t-cell activation, production of cytokines, leading to immunodeficiency. Given the connection between ion channels and the functionality of t-cells, it could be that enrichment of cardiac activation potential leads to dysfunction of immune cell ion channels, thus leading to a greater risk of t-cell dysfunction and nonresponse to therapy. I would like to conduct further exploration of the connection between cardiac signaling in the BM environment and therapy outcomes in the future.
In summary, my project identified biomarkers before CAR t-cell therapy that are associated with a better clinical response. The statistically significant genetic differences between the two groups suggest that the state of BM before therapy has an impact on its outcome, and that the BM microenvironment is a potential predictor of patient response.
Conclusion
- My hypothesis was correct, I found 148 upregulated genes that are potential biomarkers for CR in the BM of ALL patients prior to receiving CAR t-cell therapy
- I also found 136 downregulated genes as potential biomarkers for CR
- I found 104 enriched pathways that are potential biomarkers for CR
- I found 27 enriched pathways that are potential biomarkers for nonresponse
- My findings suggest that IL-10 plays a role in CAR t-cell success, and that decreasing IL-10 levels before therapy can increase the chance of CR (eg. gene editing, medication that can reduce IL-10 levels)
- BM microenvironment can influence and predict patient response, and is something that needs to be researched more in the future
Future areas of study
- I would like to look closer into the impact of IL-10 on the success of CAR t-cell therapy. My analysis found negative regulation of IL-10 to be significant, but does not provide data on the actual amount of IL-10 in BM of patients. I am curious to see if there is a significant difference in IL-10 levels between CR and nonresponders
- I found over a hundred significant biomarkers, but not all of them are predictively significant. I would like to use machine learning (ie random forest prediction models) to identify which subset of genes actually predict patient response and have potential to be used in the real world.
- I would like to look more into the significance of the enriched pathways I found in nonresponding patients. Cardiac action potential is an unexpected result, and I would like to learn more about its connection to CAR t-cell therapy
Application
- Patient screening - The biomarkers I have identified can be used by clinicians to screen patients before proceeding with CAR T-cell therapy. Identifying biomarkers associated with nonresponse in patients can prompt clinicians to find other avenues of treatment or to improve BM environment before continuing.
- Targets for BM microenvironment - the upregulated genes and enriched pathways I found in CR patients could be further studied as a therapeutic target to reach. They also give insight into what factors make BM a hostile vs friendly microenvironment to CAR t-cells (ie IL-10 levels)
Sources Of Error
- I wasn’t able to use demographic data like age and gender and cancer severity because the dataset didn’t provide it due to patient privacy concerns. This may have an impact on my results because the success of CAR t-cell therapy also depends on cancer severity and prior treatments the patient received. In the future, I would like to either formally request demographic data or use a different dataset with demographic data
- My sample size of 27 patients is relatively small and may have caused bias in the results. Using a larger sample size across a large geographic area (all patients were from large cities in America only) would give a more accurate picture of gene expression in BM in all ALL patients.
Citations
- D. Tariman, Joseph, and Casey J. Weaver. Multiple Myeloma. 2017.
- ‘Acute Lymphoblastic Leukemia (ALL)’. Cleveland Clinic, https://my.clevelandclinic.org/health/diseases/21564-acute-lymphocytic-leukemia. Accessed 20 Mar. 2025.
- ‘Acute Lymphoblastic Leukemia (ALL) - Hematology and Oncology’. Merck Manual Professional Edition, https://www.merckmanuals.com/en-ca/professional/hematology-and-oncology/leukemias/acute-lymphoblastic-leukemia-all. Accessed 20 Mar. 2025.
- Acute Lymphoblastic Leukemia Treatment - NCI. 28 Feb. 2025, https://www.cancer.gov/types/leukemia/patient/adult-all-treatment-pdq.
- Alnefaie, Alaa, et al. ‘Chimeric Antigen Receptor T-Cells: An Overview of Concepts, Applications, Limitations, and Proposed Solutions’. Frontiers in Bioengineering and Biotechnology, vol. 10, June 2022, p. 797440. PubMed Central, https://doi.org/10.3389/fbioe.2022.797440.
- Anil, Joshua, et al. ‘Bone Marrow Fibrosis Is Associated with Non‐response to CD19 CAR T ‐cell Therapy in B ‐acute Lymphoblastic Leukemia’. American Journal of Hematology, vol. 98, no. 12, Dec. 2023, pp. 1888–97. DOI.org (Crossref), https://doi.org/10.1002/ajh.27098.
- Aparicio-Pérez, Clara, et al. ‘Failure of ALL Recognition by CAR T Cells: A Review of CD 19-Negative Relapses after Anti-CD 19 CAR-T Treatment in B-ALL’. Frontiers in Immunology, vol. 14, Apr. 2023. Frontiers, https://doi.org/10.3389/fimmu.2023.1165870.
- Bai, Zhiliang, et al. ‘Single-Cell Antigen-Specific Landscape of CAR T Infusion Product Identifies Determinants of CD19-Positive Relapse in Patients with ALL’. Science Advances, vol. 8, no. 23, June 2022, p. eabj2820. DOI.org (Crossref), https://doi.org/10.1126/sciadv.abj2820.
- cancer, Canadian Cancer Society /. Société canadienne du. ‘Autologous’. Canadian Cancer Society, https://cancer.ca/en/cancer-information/resources/glossary/a/autologous. Accessed 20 Mar. 2025.
- ---. ‘Survival Statistics for Acute Lymphoblastic Leukemia’. Canadian Cancer Society, https://cancer.ca/en/cancer-information/cancer-types/acute-lymphoblastic-leukemia-all/prognosis-and-survival/survival-statistics. Accessed 20 Mar. 2025.
- Childhood Acute Lymphoblastic Leukemia Treatment (PDQ®) - NCI. 28 Feb. 2025, https://www.cancer.gov/types/leukemia/hp/child-all-treatment-pdq.
- De Marco, Rodrigo C., et al. ‘CAR T Cell Therapy: A Versatile Living Drug’. International Journal of Molecular Sciences, vol. 24, no. 7, Mar. 2023, p. 6300. PubMed Central, https://doi.org/10.3390/ijms24076300.
- Differential Gene Expression. https://biocorecrg.github.io/CRG_Bioinformatics_for_Biologists/differential_gene_expression.html. Accessed 20 Mar. 2025.
- du Plessis, Louis, et al. ‘The What, Where, How and Why of Gene Ontology—a Primer for Bioinformaticians’. Briefings in Bioinformatics, vol. 12, no. 6, Nov. 2011, pp. 723–35. PubMed Central, https://doi.org/10.1093/bib/bbr002.
- Grant, Augustus O. ‘Cardiac Ion Channels’. Circulation: Arrhythmia and Electrophysiology, vol. 2, no. 2, Apr. 2009, pp. 185–94. DOI.org (Crossref), https://doi.org/10.1161/CIRCEP.108.789081.
- Https://Www.Lls.Org/Leukemia/Acute-Lymphoblastic-Leukemia/Childhood-All/Diagnosis. https://www.lls.org/leukemia/acute-lymphoblastic-leukemia/childhood-all/diagnosis. Accessed 20 Mar. 2025.
- Huang, Fang-Liang, et al. ‘Pathogenesis of Pediatric B-Cell Acute Lymphoblastic Leukemia: Molecular Pathways and Disease Treatments’. Oncology Letters, vol. 20, no. 1, July 2020, pp. 448–54. PubMed Central, https://doi.org/10.3892/ol.2020.11583.
- Jafari, Mohieddin, and Naser Ansari-Pour. ‘Why, When and How to Adjust Your P Values?’ Cell Journal (Yakhteh), vol. 20, no. 4, 2019, pp. 604–07. PubMed Central, https://doi.org/10.22074/cellj.2019.5992.
- ‘Leukapheresis: Procedure, Uses Types & What It Is’. Cleveland Clinic, https://my.clevelandclinic.org/health/treatments/22926-leukapheresis. Accessed 20 Mar. 2025.
- Manolios, Nicholas, et al. ‘The Role of Ion Channels in T Cell Function and Disease’. Frontiers in Immunology, vol. 14, Aug. 2023, p. 1238171. PubMed Central, https://doi.org/10.3389/fimmu.2023.1238171.
- Mishra, Archana, et al. ‘Antigen Loss Following CAR-T Cell Therapy: Mechanisms, Implications, and Potential Solutions’. European Journal of Haematology, vol. 112, no. 2, Feb. 2024, pp. 211–22. PubMed, https://doi.org/10.1111/ejh.14101.
- Novartis Pharmaceuticals. A Phase II, Single Arm, Multicenter Trial to Determine the Efficacy and Safety of CTL019 in Pediatric Patients With Relapsed and Refractory B-Cell Acute Lymphoblastic Leukemia. Clinical trial registration, NCT02228096, clinicaltrials.gov, 29 Oct. 2020. clinicaltrials.gov, https://clinicaltrials.gov/study/NCT02228096.
- ---. A Phase II, Single Arm, Multicenter Trial to Determine the Efficacy and Safety of CTL019 in Pediatric Patients With Relapsed and Refractory B-Cell Acute Lymphoblastic Leukemia. Clinical trial registration, NCT02435849, clinicaltrials.gov, 18 Jan. 2024. clinicaltrials.gov, https://clinicaltrials.gov/study/NCT02435849.
- Puckett, Yana, and Onyee Chan. ‘Acute Lymphocytic Leukemia’. StatPearls, StatPearls Publishing, 2025. PubMed, http://www.ncbi.nlm.nih.gov/books/NBK459149/.
- Relapse in Acute Lymphoblastic Leukaemia. https://media.leukaemiacare.org.uk/wp-content/uploads/Relapse-in-Acute-Lymphoblastic-Leukaemia-ALL-Web-Version.pdf.
- Rizk, Samia Hassan. ‘Bone Marrow Lymphocytes’ Development and Dynamics’. Lymphatic System - From Human Anatomy to Clinical Practice, IntechOpen, 2023. www.intechopen.com, https://doi.org/10.5772/intechopen.1002915.
- Shao, Lipei, et al. ‘Identification of Genomic Signatures in Bone Marrow Associated with Clinical Response of CD19 CAR T-Cell Therapy’. Scientific Reports, vol. 12, no. 1, Feb. 2022, p. 2830. www.nature.com, https://doi.org/10.1038/s41598-022-06830-3.
- Sheykhhasan, Mohsen, et al. ‘Use of CAR T-Cell for Acute Lymphoblastic Leukemia (ALL) Treatment: A Review Study’. Cancer Gene Therapy, vol. 29, no. 8, Aug. 2022, pp. 1080–96. www.nature.com, https://doi.org/10.1038/s41417-021-00418-1.
- Sterner, Robert C., and Rosalie M. Sterner. ‘CAR-T Cell Therapy: Current Limitations and Potential Strategies’. Blood Cancer Journal, vol. 11, no. 4, Apr. 2021, pp. 1–11. www.nature.com, https://doi.org/10.1038/s41408-021-00459-7.
- Sun, Dahua, et al. ‘CAR‑T Cell Therapy: A Breakthrough in Traditional Cancer Treatment Strategies (Review)’. Molecular Medicine Reports, vol. 29, no. 3, Jan. 2024, p. 47. PubMed Central, https://doi.org/10.3892/mmr.2024.13171.
- Sun, Lina, et al. ‘T Cells in Health and Disease’. Signal Transduction and Targeted Therapy, vol. 8, no. 1, June 2023, pp. 1–50. www.nature.com, https://doi.org/10.1038/s41392-023-01471-y.
- Terwilliger, T., and M. Abdul-Hay. ‘Acute Lymphoblastic Leukemia: A Comprehensive Review and 2017 Update’. Blood Cancer Journal, vol. 7, no. 6, June 2017, p. e577. PubMed Central, https://doi.org/10.1038/bcj.2017.53.
- ‘What Is Gene Ontology (GO)’. Advaita Bioinformatics, https://advaitabio.com/faq-items/understanding-gene-ontology/. Accessed 20 Mar. 2025.
- Wight, Thomas N., and Susan Potter-Perigo. ‘The Extracellular Matrix: An Active or Passive Player in Fibrosis?’ American Journal of Physiology - Gastrointestinal and Liver Physiology, vol. 301, no. 6, Dec. 2011, pp. G950–55. PubMed Central, https://doi.org/10.1152/ajpgi.00132.2011.
- Zhang, Qiong, et al. ‘Transcriptome and Regulatory Network Analyses of CD19-CAR-T Immunotherapy for B-ALL’. Genomics, Proteomics & Bioinformatics, vol. 17, no. 2, Apr. 2019, pp. 190–200. DOI.org (Crossref), https://doi.org/10.1016/j.gpb.2018.12.008.
- Zhang, Xiaokang, et al. ‘Machine Learning Approaches for Biomarker Discovery Using Gene Expression Data’. Bioinformatics, edited by Nakaya Helder I. , Exon Publications, 2021. PubMed, http://www.ncbi.nlm.nih.gov/books/NBK569564/.
Acknowledgement
I would like to thank Dr Ryan Morin and Joshua Chow for providing feedback, and my parents and Sylvan Zheng for their support. Shoutouts also go to Dr Garcia and Ms Ghanem