
Simulating Proteinuria: A Model of Renal Failure
Zenia Saxena
Westmount Mid/High School
Grade 9
Presentation
Hypothesis
Hypothesis for the Urinalysis Dipstick Test
If increasing amounts of protein are added to artificial urine to simulate progressive kidney damage, then the protein pad on a urinalysis test strip will show a measurable and systematic increase in colour intensity and positive reading, because kidney failure causes damage to the glomerular filtration barrier, allowing usually retained proteins such as albumin to leak into urine. Since urinalysis strips detect protein through a dye-binding chemical reaction that responds proportionally to protein concentration, higher protein levels should produce more substantial colour changes. This experiment therefore predicts a clear relationship between protein concentration and test strip response, demonstrating how proteinuria serves as a biochemical indicator of kidney failure and how urine dipsticks function as diagnostic screening tools.
Hypothesis for the Homemade Test
If the amount of egg-white protein in the artificial urine base increases, then the mass of protein precipitated after adding 99% isopropyl alcohol will increase, because a higher protein concentration provides more material to aggregate and precipitate, thereby indicating the amount of protein present.
Research
Parts of the Kidneys The kidneys are two fist-sized organs that rest on either side of the spinal cord. They cleanse blood and are a part of the urinary system. Every day, the kidneys filter about 200 quarts of fluid, enough to fill an entire bathtub. Of the 200 quarts, 2 quarts are excreted in the form of urine, and the body reuses the other 198 quarts. Additionally, each kidney helps balance electrolytes and body fluids. Electrolytes are vital nutrients that include sodium and potassium. As mentioned above, the kidneys help filter out your blood. A lot of the waste they filter out is in the form of nitrogen (urea) and creatine (muscle) waste, as well as acids. Below is the process of filtration:
- Through the renal artery, the blood flows to the kidneys.
- Small capillaries in the kidney filter out this blood
- The newly filtered blood flows back to the bloodstream via the renal vein.
- In the ureter, urine passes to the bladder.
- The bladder eventually releases the urine when you excrete waste.
The kidneys also do the following:
- Balances the pH of the blood and guarantees it doesn’t drop or rise
- Makes glucose if the blood is lacking it
- Creates renin to raise blood pressure if needed
- Creates calcitrol and Erythropoietin
Calcitrol is a form of Vitamin D that aids in the absorption of calcium, while Erythropoietin aids in the production of red blood cells. In terms of filtration and the exact process, the kidneys create millions of filtering units known as nephrons. Every nephron consists of a glomerulus, which is a group of small blood vessels that perform the first stage of glomerular filtration. This is later passed on to the renal tubules. Renal tubules are tiny tubes that reabsorb water, nutrients, and minerals, returning them to the parts of the body that need them. The tubules also remove waste products, like excess acids or fluids. As noted previously, the waste passes through these tubules and is excreted in urine. The parts of the kidney consist of:
- Renal Capsule
- Renal Artery
- Renal Cortex
- Renal Medulla
- Renal Papilla
- Renal Pelvis
- Renal Vein
The renal capsule is a three-layered connective tissue structure that covers the kidney. It protects the kidney from external injury and connects it to the surrounding organs and abdominal structures. The renal artery is a significant source of blood supply to the kidney. It controls blood flow, and at rest, blood vessels deliver approximately 1.2 litres of blood to the kidneys per minute. The renal cortex is the outer layer of the kidney, where the blood-filtering units (nephrons) begin. This part of the kidney creates Erythropoietin. The inner part of the kidney, the renal medulla, contains most nephrons, as well as glomeruli and renal tubules. The renal papilla is a pyramid-shaped structure that drains urine into the ureters. Unfortunately, certain medications and dehydration can damage this part of the kidney. The renal pelvis, a funnel-shaped structure, collects urine and conveys it to the ureters, serving as a conduit. Lastly, the renal vein carries filtered blood back to the heart, so each kidney has one. In case it is unclear, the ureter is a part of the kidney that connects to the bladder, preventing urine from backing up into the kidney.
The kidneys are reddish-brown and kidney bean-shaped. Each kidney is approximately 4-5 inches in length. Interestingly, kidney weight differs between individuals. Factors that determine kidney weight include height, weight, age, and body mass index (BMI). Each kidney also has an adrenal gland that secretes hormones, including cortisol, which supports the stress response.
Kidney Failure The kidneys are strong organs that our bodies depend on for survival. If there is a kidney issue, a variety of problems will arise. One of the most common problems that causes the kidneys to “malfunction” is renal failure. Renal failure can occur in two forms: acute and chronic. If severe enough, it can lead to end-stage kidney disease (ESKD), which is lethal without treatment. Treatment might vary depending on the severity, but it is most commonly medication if not too severe, and if severe, then dialysis or a transplant may be needed. Diabetes and Hypertension are the most common causes of renal failure. Unmanaged diabetes can lead to hyperglycemia, which not only damages the kidneys but could potentially damage other organs as well. Hypertension (High Blood pressure) forcefully pushes blood through blood vessels; if it gradually declines, it can lead to irreversible damage to kidney tissue and other organs. Although less frequent, other conditions may also fulfill a role in potential renal failure. Listed below are some:
- Polycystic Kidney Disease can be inherited, leading to cysts developing within the kidney. This may disrupt the filtration process and cause difficulties in everyday life.
- Glomerular Disease is a condition that affects the kidneys' filtration function.
- Autoimmune diseases can also affect the kidneys. One of the most common ones is Lupus, which causes rashes, joint pain, fever, and, in some cases, organ damage.
In Acute Renal Failure, the kidneys suddenly stop working. In many cases, it is temporary, but some of the reasons that can occur include:
- Severe Dehydration
- Certain Medications
- Untreated Systemic Diseases
- Urinary Tract Obstruction
The treatment for this can vary depending on the cause, but for the most part, it is treatable if caught early.
Glomerular Filtration Rate The Glomerular Filtration Rate (GFR) is a test that measures kidney function. It explicitly measures the amount of blood that passes through the glomeruli per minute. As mentioned above, glomeruli are tiny filters in the kidneys that remove waste from the blood. To perform the test, a blood sample is required. This sample is extracted from the patient and sent off to the lab for testing. It is there that they test for the amount of creatine present. Along with several other factors, the lab specialist combines them to determine the patient's GFR. The formula typically includes the following factors:
- Age
- Blood Creatine Measurement
- Sex
- Weight
- Height
Once the results are available, they are returned to the patient, who then consults their physician or a specialist. Depending on the results, the healthcare provider may recommend lifestyle changes or other indicated treatments.
Protein In the Urine Trace amounts of protein in the urine are normal, but elevated levels usually indicate a renal problem. Protein is typically found in the blood, with albumin as the main protein. Protein is essential for the body, as it helps build muscle and bone, prevents infection, and regulates blood volume. If it is beneficial for the body, why is it harmful in the urine? Well, that’s because healthy kidneys remove excess fluid and waste products from the blood, converting them into urine. They do not remove essential nutrients or proteins from the blood. When the kidneys are damaged, they may allow this protein to leak into the urine, leading to elevated protein levels in the urine. Treatment may differ depending on the reason the protein was initially present. For example, if the reason is diabetes, the healthcare provider may recommend lifestyle changes, such as regular blood glucose monitoring, taking certain medications, avoiding or limiting certain foods, and exercising as often as possible.
Urinalysis Strip Detection Urinalysis Strips detect protein in urine by assessing the appearance, content, and concentration of the urine through a chemical process known as the bromophenol blue reaction. When dipped into or mixed with urine, it changes colour if protein is detected. It is then compared to a colour chart to determine the amounts of protein present. Depending on the results, subsequent steps will vary.
Protein error of the pH principle This phenomenon is characterized by a change in the colour of a pH indicator in the presence of protein, despite a constant pH. It is based on the binding of protein molecules (specifically amino acids) to the indicator dye. This sudden binding releases hydrogen ions (H+) into the protein, altering the indicator's equilibrium and causing a colour change that indicates the presence of protein(s).
Artificial Urine Base In this experiment, I will use artificial, simulated urine because real urine is considered a biohazard and is prohibited under CYSF ethics. There can be blood, viruses, bacteria, medications, hormonal waste products, or toxins that could be present, putting not just me at risk, but also other people who come in contact with the urine. In professional workplaces, laboratories typically handle urine using protective equipment such as gloves and goggles, along with disinfectants to protect laboratory personnel. Additionally, real urine can vary from person to person due to factors, particularly hydration, diet, time of day, and health conditions (if any). Hence, for this project, I will simulate urine using water, salt, and food colouring, and then add measured amounts of protein. This will simulate proteinuria in a safe, ethical manner.
Alcohol-Induced Protein Precipitation Proteins typically stay dissolved in water because they interact strongly with surrounding water molecules. These contacts form a protective layer, often called a hydration shell, that keeps protein molecules separated and prevents them from sticking together. In fluids such as urine, proteins like albumin remain soluble under normal conditions because their hydration shells stabilize their structure. When a high-concentration alcohol, such as 99% isopropyl alcohol, is added to a protein-containing solution, the solution's environment changes. Alcohol is less polar than water, which reduces the ability of water molecules to surround and stabilize proteins. As a result, the hydration shell around the protein weakens. Without this stabilizing layer, protein molecules begin to interact more strongly with each other rather than with the surrounding liquid. This causes the proteins to clump together, yielding visible particles or cloudiness. This process is known as protein precipitation. Protein precipitation with alcohol is a well-known chemical process commonly used in laboratory settings to separate and concentrate proteins. The effect does not depend on a specific protein but instead on general protein properties such as structure, surface charge, and concentration. Albumin, the main protein found in urine during proteinuria, is affected by these changes in solvent conditions in a similar way. Therefore, proteins present in real urine can also precipitate when exposed to high concentrations of alcohol. However, in modern medical practice, alcohol precipitation is not routinely used to detect proteinuria. Instead, healthcare providers rely on urine dipstick tests and measurements such as the urine albumin-to-creatinine ratio, which are much faster and way more specific. However, older laboratory methods for detecting urinary protein relied on precipitation and cloudiness, demonstrating that protein aggregation is a real and measurable property. These past methods indicate that precipitation-based testing reflects genuine protein behaviour, even though more advanced techniques are now preferred. By keeping the alcohol concentration constant and gradually increasing the amount of protein, this experiment allows quantitative measurement of protein precipitation. Collecting and weighing the precipitated protein provides clear evidence of how protein concentration influences precipitation. This approach models the core chemical principles underlying protein detection and explains how proteinuria can be identified through changes in protein solubility.
Variables
Urinalysis Dipstick Test Variables
Independent Variable (What I changed)
- The amounts of protein in the simulated urine. In this case, it would range from very low to very high.
Dependent Variable (What I measured)
- The result of the amount of protein detected from the urine test strips. This includes the reading and the colour.
Controlled Variables (What was kept the same)
- Same artificial urine
- Same brand of test strips
- Same amount of liquid in every sample
- Same dip time for each strip
- Same wait time before the reading
- Same room temperature, as well as lighting
- Same person (me) determining the colour of the test strip.
Variables for the Homemade Test
Independent Variable
- The volume of egg white added (protein concentration)
Dependent Variable
- The mass of the dried protein precipitate collected on a filter is measured in grams.
Controlled Variables (What I kept the same)
- The volume of alcohol added (10.0 mL)
- The alcohol concentration (99%)
- The total volume of the mixture
- The salt concentration
- The mixing time
- The waiting time before filtering
- The filter type
- The drying time
- The room temperature
Procedure
Procedure for Urinalysis Dipstick Test
1. Make the Artificial Urine using:
- 500 mL of water
- 1/2 of a teaspoon of table salt, while stirring until it is completely dissolved
- Potentially using 1-2 drops of yellow food colouring, continuing to stir.
- Labelling solution, and indicating no presence of protein
2. Preparing the Protein Stock using:
- 10 mL of egg whites
- 90 mL of water in a separate cup while stirring
- Labelling the solution "protein stock".
3. Preparing the Different Protein Levels using:
- 5 cups each labelled A, B, C, D and E
- Measuring the protein stock and artificial urine, pouring them into the cups in the following pattern, and mixing each cup gently. A = 0 mL of protein, B = 2 mL of protein, C = 4 mL of protein, D = 8 mL of protein, E = 16 mL of protein. Each cup will contain 100 mL of artificial urine, including protein.
4. Testing
- With gloves on, one fresh test strip will be dipped into the cups for approximately 2 seconds, then removed and wiped to remove any excess drops, while waiting for the time indicated on the test strip box.
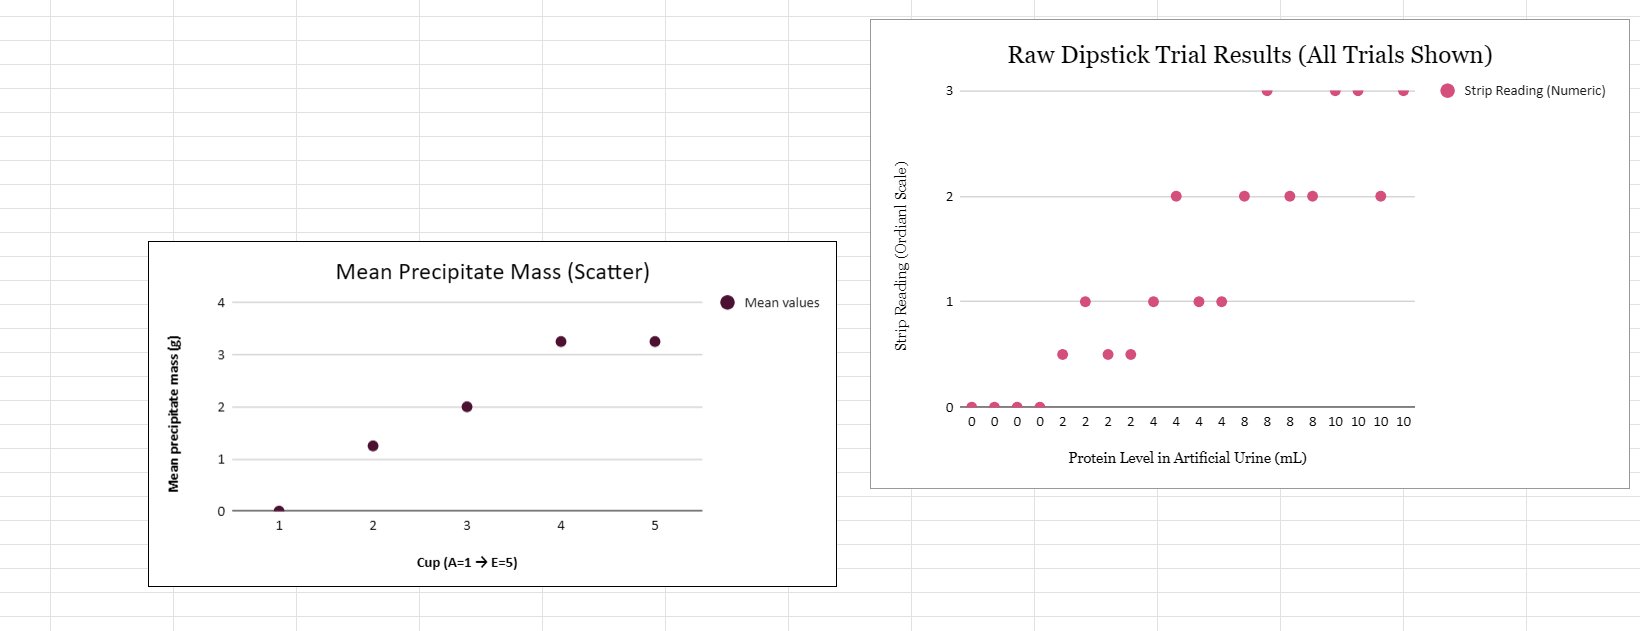
- For the protein pad, comparisons with the colour chart will be made, and results (Negative, Trace, 1+, 2+, 3+) will be recorded. A colour score between 1 and 5 will be assigned, and the process will be repeated twice more to ensure reliable results. This will happen for every cup.
5. Analysis
- All results will be put into a table, which will have five columns: Cup A-E, Protein level, Trial number, Strip reading and colour score.
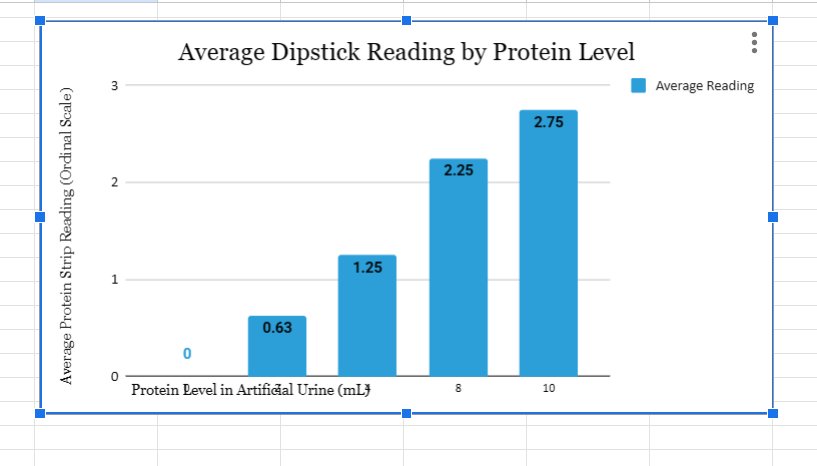
- The average colour score across the three trials will be calculated, and a graph will be constructed.
- The X-axis will look for the protein level, while the Y-axis will look for the average colour score. After that, conclusions will be drawn.
Procedure for Homemade Test
- Prepare salt water by dissolving 0.9 g of salt in 100 mL of water.
- Label five cups as 1×, 2×, 3×, 4×, and 5×.
- Prepare protein mixtures as listed below (10.0 mL total each):
- 1×: 0.5 mL egg white + 9.5 mL salt water
- 2×: 1.0 mL egg white + 9.0 mL salt water
- 3×: 1.5 mL egg white + 8.5 mL salt water
- 4×: 2.0 mL egg white + 8.0 mL salt water
- 5×: 2.5 mL egg white + 7.5 mL salt water
- Add exactly 10.0 mL of 99% isopropyl alcohol to each cup.
- Gently mix each cup for 5 seconds.
- Allow the mixtures to sit for 2 minutes to allow precipitation.
- Weigh a dry coffee filter and record its mass (m₁).
- Filter each mixture through the coffee filter.
- Dip the precipitate in 5 mL of water.
- Allow both the filter and precipitate to dry completely.
- Measure both the dried filter and precipitate (m₂).
-
Calculate precipitate mass using:
Protein mass = m₂ − m₁
Observations
Observations for the Urinalysis Dipstick Test
During the experiment, I set aside an area on my table for the cup and strip to ensure consistent readings. Unexpectedly, when I moved a strip and viewed it from a different angle, the colour of the urinalysis strip appeared to change. This was surprising because I had already eliminated external light sources, such as sunlight and room lighting. On reflection, I realized that the blue-light coating on my glasses might have contributed to this apparent colour change. After repeating the test on that sample, I obtained different results, indicating that my initial observation was inaccurate. I observed that the control samples with 0 mL of protein consistently showed negative protein readings across all four trials. No colour change was observed, and the colour score was recorded as 0. This indicated that the artificial urine base did not interfere with the urinalysis strips or produce false-positive results. The consistent control outcomes provided a reliable baseline for comparing the protein-containing samples. It confirmed that any observed colour changes were due to the added protein rather than the testing method or solution. As the protein concentration in the simulated urine increased from 2 mL to 10 mL, the colour changes on the strips appeared more evident. At 4 mL, most trials yielded readings of 0.3 or higher, while one trial yielded 1.0 or higher. Higher protein levels generally resulted in higher urinalysis strip readings. Although the overall trend remained consistent, I observed minor differences across trials at the same protein concentrations, especially at higher concentrations. Those variations were minimal and shown in the calculated error bars. Even though the environment was controlled, slight variations occurred between trials at the same protein level. At specific concentrations, one trial sometimes yielded a strip reading higher or lower than the others. This variation was visible in the calculated error bars and was more pronounced at higher protein levels, with some strips showing higher readings and others slightly lower. This variation is expected in colourmetric tests and illustrates the importance of multiple trials to account for experimental error.
Observations for the Homemade test
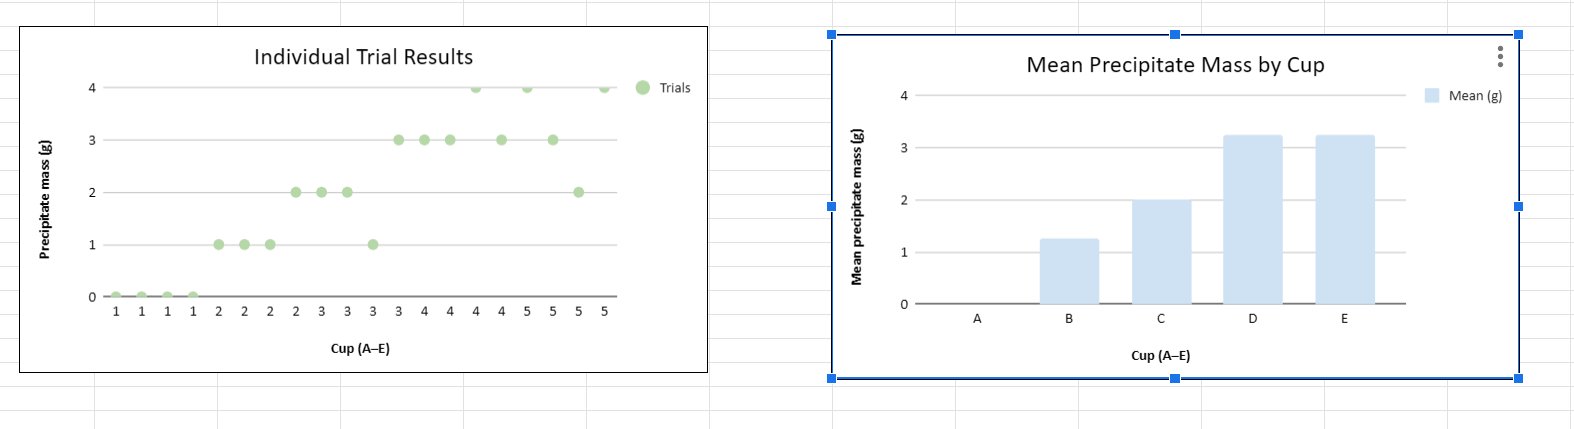
When I added 99% isopropyl alcohol to the samples, I could see changes almost immediately in the cups containing egg white protein. The ones with barely any protein just stayed clear, but the cups with more protein started turning cloudy really fast. Within about 2 minutes, I saw white clumps forming in the cups with medium- to high-protein levels, a clear sign that the protein was precipitating from the solution. The control sample (Cup A) with no egg white didn’t change at all—there were no clumps, and nothing showed up after filtering. For Cup B, which had a low protein concentration, there were only a few tiny, faint clumps, and truthfully, they were kind of tricky to collect because they spread out when I poured the cup into the filter. However, as I worked my way up to Cups C, D, and E, the clumps got easier to see, felt denser, and were much easier to catch with the filter since they didn’t spread out as much. When I started filtering the mixtures, I noticed the samples with more protein drained more slowly and left way more solid stuff on the filter paper. Once everything was dry, the leftover bits looked white or kind of off-white. Each time I increased the protein, I got more dried residue, which matched exactly what I expected. There were a few minor differences from trial to trial, especially with the higher-protein samples, but overall, the pattern was clear: more protein led to more precipitate each time.
Analysis
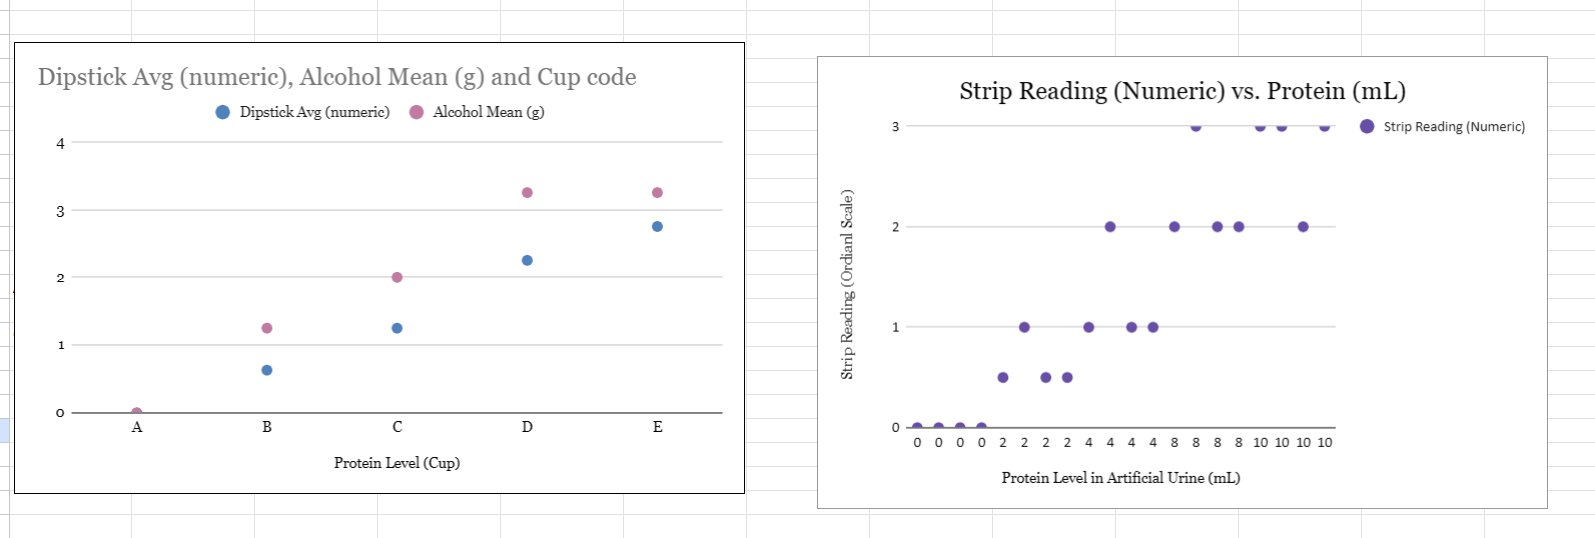
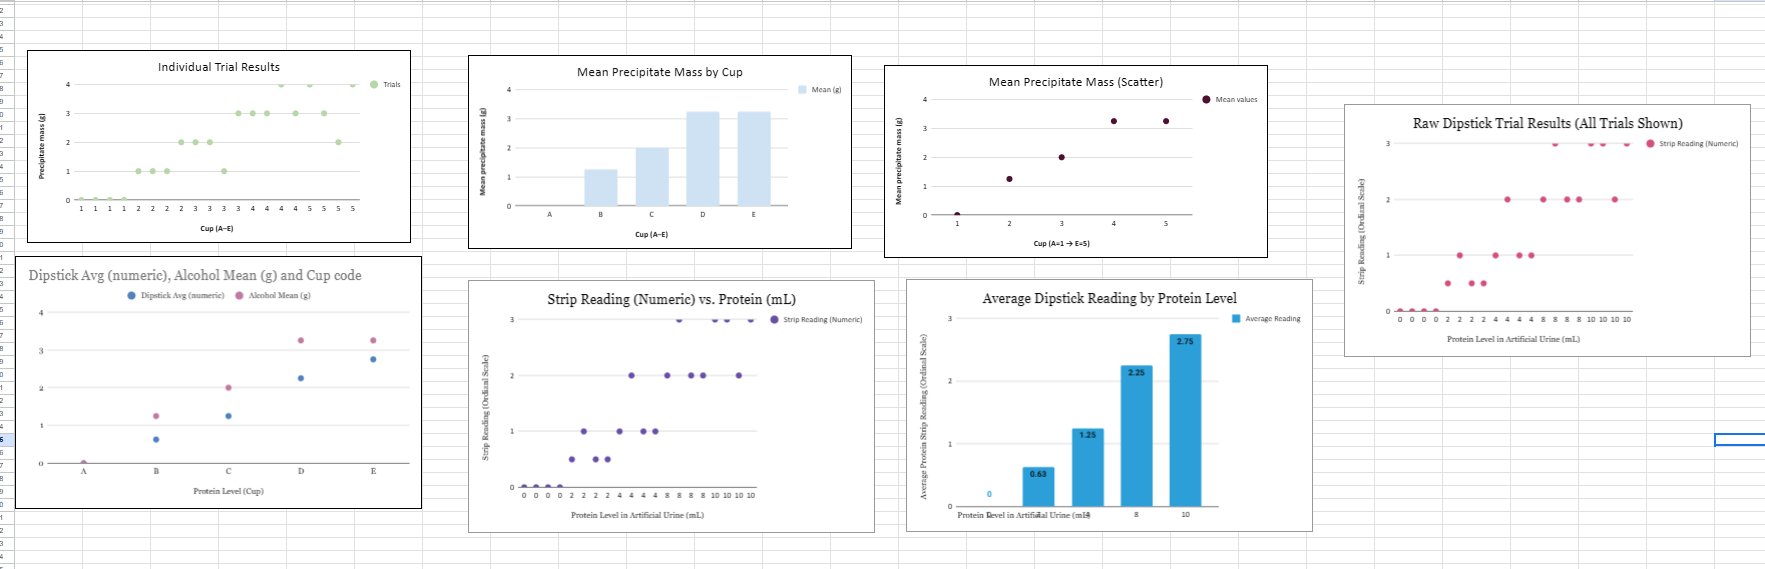
Looking at my results, I noticed a clear, steady pattern in both experiments: as I increased the protein concentration, both the urinalysis dipstick readings and the amount of protein precipitated with alcohol increased. With the dipsticks, higher protein levels made the colour changes much more apparent. I converted these colours into numbers, averaged them for each trial, and it was cool to see the scores keep rising as I added more protein. Even though reading the colours is a bit subjective, doing multiple trials helped make the results more trustworthy and showed that this increase wasn’t just a coincidence.
The alcohol precipitation experiment really backed this up with solid numbers. When I added more protein to the samples, I got more solid protein after adding isopropyl alcohol. If there was no protein, nothing came out, but the more I added, the bigger the mass of dried protein clumps I found. There were a few differences between trials, especially at higher concentrations—maybe because of small losses during filtering or not all the clumps drying the same way—but the general trend stayed the same: more protein in, more protein out.
When I graphed my data, most of the points clustered around the averages, leading me to believe the results were reliable. I used different types of graphs (bar graphs, scatter plots, box-and-whisker plots) to show not only the averages but also the extent of variation across trials. When I combined the data from both experiments into one graph, it was actually really satisfying to see that both methods matched up. The samples with the highest dipstick readings also had the most precipitated protein, indicating that the test strips correctly reflected the actual protein amount. Error bars represent the variation in repeated measurements. In this project, they show how much individual trial results varied from the average. Larger error bars indicate greater variability, while smaller error bars indicate more consistent results. Error bars represent the fluctuations in repeated measurements. In this project, they show how much individual trial results varied from the average.
Conclusion
When it comes to accuracy, I feel like the alcohol test gave me a better understanding of what was really going on in the "urine." Unlike urinalysis strips, which mainly depend on how I interpret colour changes (which can be pretty subjective), the alcohol method lets me measure protein levels by weighing them. This makes the results more reliable, since numbers on a scale are a lot less open to personal bias than judging colours. In my experiment, using weight to estimate protein amount helped reduce errors and made the data feel more solid. This project really opened my eyes to how science can be both simple and powerful. By testing how increasing protein concentration affects dipstick readings and the mass of protein that comes out with alcohol, I saw a clear pattern: more protein meant both a stronger dipstick reading and a bigger pile of precipitated protein. It was interesting to see two different methods—one quick and visual, the other more precise—line up so well. That agreement made me feel confident that the results were real and not just a fluke. What I loved about this experiment is how it shows that you don’t always need fancy, expensive equipment to get meaningful results. Dipsticks are fast and super affordable for screening, and the precipitation method lets you actually measure the protein. Together, they model how real-life diagnostic tools work, using materials anyone can get. It was pretty amazing to realize that introductory chemistry can help us understand and even help solve real medical problems.
Application
The main application I see this project presenting is an overall benefit to citizens and the government of a society. Millions of dollars are spent on both sides to facilitate tests that sometimes aren’t necessary. Additionally, overtesting for issues in patients can cause other problems to arise, which wouldn’t have happened if the tests hadn’t been performed in the first place. For example, some tests may require radiation to visualize internal body structures. Research across the globe has shown that long-term radiation exposure can markedly increase one’s chance of developing cancer, which can unintentionally happen if someone gets too many tests performed.
Furthermore, it can flag unimportant or irrelevant issues, which may bring about unnecessary health anxiety and effectively reduce the quality of someone’s life. The main point is that these tests are expensive, so they are better used only when necessary. The results of this project can show that household objects can serve as a way to test for these subtle suspicions, causing a discussion with a qualified healthcare provider.
Sources Of Error
1. Human Colour Interpretation: The colour may look different to certain people\, meaning there's potential for incorrect scoring 2. Timing Errors: If the strip is read too late or too early\, the colour may not be accurate\, causing a significant problem in the overall project 3. Uneven mixing of the egg white: The egg white might clump or foam\, and the protein could rest on the bottom of the cups. This may result in inconsistent results. 4. Variations in dipping technique: Dipping too fast or too long could lead to a difference in the absorption of the samples. 5. The quality and age of the strip: If the strips are old or exposed to air\, it can lead to an issue in the strength of the reaction. 6. Temperature differences: If one of the samples is colder or warmer than the other\, it can lead to a difference in the reaction time. 7. Contamination between cups: If I use the same stirring rod for multiple different cups\, it can lead to residue transferring between samples. 8. Food Colouring and Sample Cloudiness: This may make it difficult to read the actual colour. 9. Measurement Inaccuracies: Small measurement errors can lead to samples not being exact. 10. Lighting: The lighting in the room may change the results\, leading to colour score inconsistencies.
Citations
Works Cited
Cleveland Clinic. (n.d.). *Kidney*. https://my.clevelandclinic.org/health/body/21824-kidney Cleveland Clinic. (n.d.). *Kidney failure*. https://my.clevelandclinic.org/health/diseases/17689-kidney-failure MedlinePlus. (n.d.). *Kidney diseases*. https://medlineplus.gov/ency/article/007305.htm National Kidney Foundation. (n.d.). *Protein in urine*. https://www.kidneyfund.org/all-about-kidneys/other-kidney-problems/protein-urine Mayo Clinic. (n.d.). *Urinalysis*. https://www.mayoclinic.org/tests-procedures/urinalysis/about/pac-20384907 Shoskes, D. A., & Radeva, M. K. (2007). Urinary protein excretion and progression of chronic kidney disease: The role of diabetes. *PubMed*. https://pubmed.ncbi.nlm.nih.gov/17575359/ Grammarly, Inc. (n.d.). *Grammarly*. https://www.grammarly.com/ National Institute of Diabetes and Digestive and Kidney Diseases. (2023). Your kidneys & how they work. https://www.niddk.nih.gov/health-information/kidney-disease/kidneys-how-they-work National Kidney Foundation. (2023). Proteinuria (protein in urine). https://www.kidney.org/kidney-topics/proteinuria MedlinePlus. (2022). Urinalysis. U.S. National Library of Medicine. https://medlineplus.gov/lab-tests/urinalysis/ McPherson, R. A., & Pincus, M. R. (2017). Henry’s clinical diagnosis and management by laboratory methods (23rd ed.). Elsevier. Pagana, K. D., Pagana, T. J., & Pagana, T. N. (2021). Mosby’s diagnostic and laboratory test reference (15th ed.). Elsevier. Centers for Disease Control and Prevention. (2023). Chronic kidney disease basics. https://www.cdc.gov/kidneydisease/basics.html Abcam. (n.d.). Protein precipitation: Principles and methods. Abcam.
https://www.abcam.com/protocols/protein-precipitation Haider, M. Z. (2023). Proteinuria. In StatPearls. StatPearls Publishing.
https://www.ncbi.nlm.nih.gov/books/NBK564390/ Kramer, R. M., Shende, V. R., Motl, N., Pace, C. N., & Scholtz, J. M. (2012). Toward a molecular understanding of protein solubility. Biochemistry, 51(6), 1160–1169.
https://doi.org/10.1021/bi201531y National Kidney Foundation. (n.d.). Urine albumin-to-creatinine ratio (uACR).
https://www.kidney.org/kidney-topics/urine-albumin-creatinine-ratio-uacr Nelson, D. L., & Cox, M. M. (2017). Lehninger principles of biochemistry (7th ed.). W. H. Freeman and Company. Kenhub. (n.d.). Kidneys. In Kenhub Library: Anatomy. Retrieved January 4, 2026, from https://www.kenhub.com/en/library/anatomy/kidneys BYJU’S. (n.d.). Kidney: Structure, function and related diseases. Retrieved January 4, 2026, from https://byjus.com/biology/kidney-structure-function-and-related-diseases/ Shutterstock. (n.d.). Kidney failure diagram [Stock images]. Retrieved January 4, 2026, from https://www.shutterstock.com/search/kidney-failure-diagram The Curbsiders. (2022, May 4). 112: The renal truth behind proteinuria [Podcast episode]. The Cribsiders. https://thecurbsiders.com/cribsiders-podcast/112-the-renal-truth-behind-proteinuria National Institute of Diabetes and Digestive and Kidney Diseases. (n.d.). Albuminuria (albumin in the urine). Retrieved January 4, 2026, from https://www.niddk.nih.gov/health-information/kidney-disease/chronic-kidney-disease-ckd/tests-diagnosis/albuminuria-albumin-urine
Acknowledgement
I acknowledge my parents, who provided me with a loving and supportive environment in which to complete this project. They gave me knowledge on the subject, financial aid, and fueled my passion for science. I also acknowledge my peers, who helped me work around my schedule to make time for this project. Finally, I realize that my teachers, who helped me learn about everyday life, planted this idea in my head.