The Effects of Caffeine on Candida Growth
Grade 9
Presentation
Hypothesis
If different concentrations of caffeine including 0g, 1g, 5g, 8g are mixed into a yeast, sugar, and water solution, then the amount of carbon dioxide produced will decrease indicating less growth, as the concentration of caffeine increases, because caffeine blocks the effects of adenosine which is necessary for the cells to reproduce and increase in number.
Research
What is Yeast?
Yeast is a type of fungi. Fungi are eukaryotic and can be single or multicellular mildews, molds, mushrooms, and yeasts, are all types of fungi. Yeast in particular is a single celled organism and commonly reproduces asexually through a process called budding. Budding takes place when a bump emerges from a parent cell, once the bump is mature it detaches itself and becomes its own cell. In nature, yeasts and fungi break down plant material and release oxygen, nitrogen, carbon, and phosphorus back into the soil. Humans regularly use yeast to make baked goods and beer. Lastly yeast is present all over the human body in small amounts, from your skin to your digestive tract.
Cellular Respiration in Yeast?
All living things including yeast produce adenosine triphosphate (ATP), it is the universal energy source for living cells. ATP produces energy to carry out energy-dependent cellular functions, including DNA and RNA synthesis, metabolic processes, and cellular division. Cellular respiration is how ATP is produced. Cellular respiration can either take place anaerobically, without oxygen, or aerobically, with oxygen. In yeast cellular respiration can be either. In the presence of oxygen, cellular respiration is when glucose is broken down, releasing energy which is captured by ATP molecules. The majority of this process takes place within the mitochondria. Water and carbon dioxide are the end result of cellular respiration.
Anaerobic respiration in yeast is known as fermentation. Fermentation is the process by which sugar is broken down by enzymes in the absence of oxygen. In the case of yeast, this enzyme is called zymase, it catalyzes the breakdown of sugar producing energy. Similar to aerobic respiration the end result is carbon dioxide but instead of water it produces ethanol. Both forms of respiration are required for growth.
How does the AMP/ATP ratio regulate yeast metabolism and growth?
The amount of adenosine monophosphate (AMP) compared to adenosine triphosphate (ATP) communicates with the cell how much energy the cell has . In yeast a protein kinase called Snf1 is activated in the presence of AMP. When energy is low there is a high AMP to low ATP ratio, Snf1 senses this and signals the yeast to use different sources of energy instead of sugar until the environment is more stable. Without energy, growth is put to a halt as more energy is focused on being conserved. When the cells have high energy represented by a low AMP to high ATP ratio, Snd1 is not activated allowing the cells to create proteins, fats, ribosomes, and rapid cell division.
How does Andenosine dicate Yeast's stress response?
Yeast is highly adaptable to many environments and generally performs well under stress. Within the cell, specific conditions are required to carry out cellular functions, meaning that maintaining those conditions while the outside environment changes is important. In high stress situations such as nutrient depletion, heat shock, oxidative stress, and osmotic stress, the most popular defense mechanism is burning fat as a source of energy rather than glucose.
In yeast adenosine also dictates how it will react to stress. A receptor-like protein called G-protein coupled receptors (GPRCs) sends signals to the cell to start certain processes when they sense adenosine and its derivatives. For example when GPRCs sense a buildup of adenosine monophosphate (AMP), it indicates that the yeast is experiencing high amounts of stress due to unfavourable conditions. The GPRCs respond and signal the cells to conserve energy.
Yeast (Candida) in the human body
Yeast is naturally found in the human body including the skin, digestive system, mouth, and the vagina for anyone who has one. The yeast that is found in the body is called Candida, and is harmless at the right amounts. Healthy bacteria in the body control the balance of Candida. When the balance is off, the yeast overgrows and causes an infection called candidiasis. Depending on the location of the overgrowth it can be referred to by different names including thrush (mouth), vaginal yeast infection, and invasive candidiasis (blood).
What is caffeine?
Caffeine is a naturally occurring drug, found in coffee beans, leaves and fruit of guarana, green tea, and energy drinks, to name a few. The stimulant category is where the caffeine drug falls. Stimulants can increase the speed between the messages the brain sends to the nerves. This increased speed of messaging between the brain and the body leads to reduced drowsiness and fatigue. Negative effects of consuming caffeine can include increased dehydration, dizziness, and trembling/tremors. In some cases, caffeine can have the opposite intended effect and increase fatigue.
How does caffeine work?
Caffeine works to increase your alertness by blocking the effects of adenosine and increasing norepinephrine. Adenosine triphosphate (ATP) is a compound broken down by your body to release energy and adenosine as a byproduct. The brain consumes the most ATP, and it builds up in the space between cells. It is believed that when you stay awake for too long, adenosine buildup affects parts of the brain associated with alertness kicking in the body’s sleep drive (the urge to sleep). Since caffeine blocks the effects of adenosine, you feel more awake and alert, and the need to sleep is relieved.
Variables
|
Manipulated |
-Different concentration of caffeine |
|
Controlled |
-Amount of yeast -Amount of water in graduated cylinder -Amount of sugar -Amount of water in the dishpan -Person doing the testing -Amount of time for CO2 collection |
|
Responding |
-The amount of CO2 produced |
Procedure
Materials
- Caffeine pills
-
Instant quick rise yeast
-
2x 100mL graduated cylinders
-
¼ inch inside diameter vinyl tubing 5 feet long
-
Thermometer
-
Long shallow container
-
Sharpie
-
Scotch tape
-
Distilled water
-
Saran wrap
-
½ tsp measuring spoons
-
1 tsp
-
White granulated sugar
-
Pyrex glass measuring cup
-
Fork
-
Scissors
-
Cup
-
Packing tape
Procedure 1: Constructing the CO2 Collection Apparatus
- Gather all materials
- Label each 250mL squeeze bottle with the different concentrations of caffeine, 1g, 5g, 8g, as well as “control”.
- Remove the cap of the squeeze bottle and push the 5’ vinyl tube onto the top of the 250mL squeeze bottle.
- Fill the plastic container ⅓ full with water.
- Fill the graduated cylinder with 100 mL of water.
- Cut a piece of saranwap large enough to cover the opening of the graduated cylinder. Poke a small hole with a pair of scissors into the saran wrap and push one end of the 5’ vinyl tubing through. Cover the opening of the graduated cylinder with the saran wrap.
- Place your hand over the opening of the graduated cylinder and quickly invert the cylinder into the container. Then peel away the saran wrap.
- Add a piece of packing tape to the graduated cylinder to attach it to the container.
- To test the apparatus remove the vinyl tube from the top of the 250mL squeeze bottle and slowly blow into it; check for water displacement. Bubbles and a decreasing water level should be visible.
- If there is visible water displacement, steps 1-7 will need to be repeated before testing can begin.
Procedure 2: Conducting the Experiment
- Label each 250mL squeeze bottle with the different concentrations of caffeine, 1g, 5g, 8g, as well as “control”.
- Microwave 250mL of distilled water for 30 second intervals until it reaches 40 degrees celsius.
- Add 1 teaspoon of sugar to the warm water and stir until fully dissolved.
- Once the sugar has dissolved add ½ a teaspoon of yeast to the warm water. Briefly stir the yeast mixture with a fork and pour into the “control” squeeze bottle. Repeat with the other squeeze bottles.
- Cap the bottle tightly with the free end of the vinyl tubing. The end of the collection tube(vinyl tubing) should be under the inverted graduated cylinder in the dishpan.
- Start a timer for 25 minutes. After 5-10 minutes the yeast should start foaming, and bubbles should be seen in the graduated cylinder. Record the time you first start seeing bubbles in the graduated cylinder.
- Continue collecting carbon dioxide until the timer goes off.
- Wash out the collecting tube and squeeze bottle. Re-set the inverted graduated cylinder (refer to steps 3-7 in “Procedure 1”). Repeat steps 2-6 from “Procedure 2” (1) more times with the “control” and other concentration when repeating.
- Read the amount of grams of caffeine on the back of the pill package. Open the capsules and collect the amount of powder to have 1 gram of caffeine (or 5 and 8g when repeating).
- Microwave 250mL of distilled water in 30 second intervals until it reaches 40 degrees celsius. Add 1 tsp. of sugar and the caffeine powder and wait until everything fully dissolves.
- To the water, caffeine, and sugar solution, add ½ tsp of yeast. Pour the mixture into the appropriate squeeze bottle and repeat steps 5-8
- Repeat steps 7-10 with all the other concentrations.
Observations
Trial 1
Concentration: 0g
| Trial Number | Observations | CO2 Collected |
| 1 |
0 minutes: The yeast solutions is a pale beige colour and opaque. Solutions is warm when touced through the squeeze bottle. A portion of the yeast is settled a the bottom of the squeeze bottle. 5 minutes: Yeast is starting to bloom on the bottom and surface of the solution. Little bubbles of foam float to the surface of the water. 10 minutes: Yeast is flowing through the CO2 collection tube. CO2 bubbles are exiting the collection tube into the graduated cylinder, relativley slowly, approximately every 5 seconds. 15 mintues: CO2 bubbles are exiting the collection tube quicker, approximately every 3 seconds. One elongated bubble will exit the collection tube, followed quickly by a few small bubbles. Yeast foam in the collection tube increased. 20 minutes: Yeast foam in the collection tube has significantly increased. CO2 bubbles were exiting the collection tube at a consistent rate. There was no change in colour of the yeast solution. 25 minutes: The temperature of the solution is cooler than its starting temperature. The yeast foam in the collection tube has inscreased slightly. The colour did not change from the starting colour. |
22 mL |
| 2 |
0 minutes: Majority of the yeast was settled on the bottom of the squeeze bottle. The colour of the solution was a pale beige, and opaque. The solution was warm to the touch when felt through the squeeze bottle. 5 minutes: No yeast foam present in the collection tube. Yeast was blooming at the bottom of the squeeze bottle, appoximately 2 cm in height. 10 minutes: Bubbles started to exit the collection tube. Bloomed yeast from the bottom of the squeeze bottle started to bubble to the surface of the solution. 15 minutes: There was no yeast foam present in the CO2 collection tube. CO2 bubbles continued to exit the collection tube, approximately every 5 seconds. 20 minutes: The yeast foam was present in the CO2 collection tube. CO2 bubbles started to exit the collection tube at a slower rate, apporximately every 8 seconds. There was less bloomed yeast on the bottom of the squeeze bottle, compared to that seen on the surface of the solution. 25 minutes: The yeast foam in the CO2 collection tube doubled. The solution was cooler than its starting temperature. A change in colour was not visible. Yeast blooms present on the bottom of the squeeze bottle reduced. |
18 mL |
Concentration 1g
| Test Number | Observations | CO2 Collected |
| 1 |
0 minutes: The yeast solution was pale beige in colour, and opaque. Majority of the yeas was settled on the bottom of the squeeze bottle. The solution felt warm through the squeeze bottle. 5 minutes: At the bottom of the squeeze bottle, the yeast blooms increased in height. No bubbles are forming at the end of the CO2 collection tube. Small clumps of the yeast blooms from the bottom of the squeeze bottle, bubble to the surface of the solution. 10 minutes: There was no bubbles forming at the end of the CO2 collection tube (collection tube). No yeast foam was present in the collection tube. Yeast blooms at the bottom of the squeeze bottle slightly increased in height. 15 minutes: There was no visible change from the last time interval. The yeast bloom height was the same, and there were no bubbles in the collection tube. No change in colour. 20 minutes: There was no change in colour, or height of the yeast blooms. Bubbles in the yeast blooms appeared more pronounced. In between 20-25 minutes: Bubbles started forming and exiting the collection tube rapidly. 25 minutes: There was minimal water displacement. No change in colour or yeast bloom height was visible. Yeast foam was present in the collection tube. From the starting temperature, the solution has cooled. Bubbles were exiting the collection in intervals, a few would exit rapidly followed by a pause, and then rapidly again. |
8mL |
| 2 |
0 minutes: The solution was a pale beige colour and opaque. Yeast blooms that were settled at the bottom were small in height. When felt through the squeeze bottle, the solution was warm to the touch. 5 minutes: Yeast blooms setltled on the bottom of the squeeze bottle increased in height. No bubbles were exiting the collection tube. Yeast bloom clumps started to bubble to the surface of the solution. 10 minutes: Yeast blooms settled on the bottom of the squeeze bottle increased in height. There was no visible change in colour. No bubbles were exiting the collection tube. A thin layer of yeast bloom was visible on the surface of the solution. 15 minutes: Both the yeast blooms on the surface and bottom of the squeeze bottle increased in height. No bubbles exited the collection tube. Bubbles in yeast bloom at the bottom of the squeeze bottle appeared more defined. 20 minutes: There was no increase in the height of the surface and bottom yeast bloomds. Bubbles started to exit the collection tube. 25 minutes: The bubbles exiting the collection tube were elongated. Yeast foam was present in the collection tube. |
8mL |
Concentration: 5g
| Test Number | Observations | CO2 Collected |
| 1 |
0 minutes: The yeast bloom on the bottom of the squeeze bottle were larger compared to other tests. The solution was a pale beige, opaque, and warm to the touch. 5 minutes: More distincition between the yeast and the caffeine. At the surface of the solution, there was no visible yeast blooms. Leaking of the solution did start. 10 minutes: There was no bubbles exiting the collection tube. The yeast blooms were growing and increased in height. The leaking stopped. 15 minutes: Bubbling of yeast bloom clumps from the bottom to the surface began. The colour of the solution does not have as much of a yellow undertone compared to the othe tests, it is more like a whiter cream colour. No bubbles were forming or exiting the collection tube. 20 minutes: Yeast bloom became visible on the surface of the solution. At the bottom of the squeeze bottle, yeast blooms had increased in height. No bubbles were exiting the collection tube. 25 minutes: No bubbles had exited the collection tube. The solution was cooler than its starting temperature. Yeast blooms present at the bottom of the squeeze bottle had slightly increased in height. |
0mL |
| 2 |
0 minutes: The solution was a pale cream colour and opaque. Majority of the caffeine was settled on the bottom of the squeeze bottle. When felt through the squeeze bottle the solution was warm to the touch. 5 minutes: The layer of yeast bloom on top of the caffeine was more apparent. No bubbles were exiting the collection tube. 10 minutes: Yeast blooms had increased in height, approximately 3 cm. No bubbles exited the collection tube. Not much visible change since the last time interval. 15 minutes: A small layer of yeast bloom on the surface of the solution became visible. Bubbling of yeast clumps from the bottom to the surface began. No bubbles exited the tube. No yeast foam entered the collection tube. Yeast blooms on the base of the squeeze bottle slightly increased in height. 20 minutes: There was no visible change since the last time interval. Bubbling of yeast clumps from the bottom to the surface continued. No increases in height of yeast blooms. No bubbles exiting the collection tube. No yeast foam in the collection tube. 25 minutes: Temperautre of solution is cooler than the starting temperature. The colour was the same as it was at the beginng of the timed testing. Bubbling of yeast from the bottom to the surface of the solution continues. Yeast foam was present in the cap of the squeeze bottle , but not in the collection tube. Base yeast growth was slightly taller. 2-3 bubbles exited the collection tube,1 was particularly elongated approximately 5 cm. |
1mL |
Concentration: 8g
| Test Number | Observations | CO2 Collected |
| 1 |
0 minutes: The solution was warm to the touch. A thick approximately 2cm layer of caffeine was settled on the bottom of the squeeze bottle. On top of the caffeine layer a thin layer of yeast was visible. The colour of the solution was a light cream. 5 minutes: Yeast blooms on the bottom of the squeeze bottle showed no height increase. A thin layer of yeast was visible on the surface of the solution. No bubbles had formed or exited the collection tube. No yeast foam was present in the tube. 10 minutes: The yeast blooms on the bottom of the squeeze bottle increased in height. No bubbles were forming or exiting the collection tube. No yeast foam was in the collection tube. The layer of yeast on the surface of the solution was thicker. 15 minutes: There was no visible increase in height from the bottom yeast bloom. The surface yeast bloom appears to be entering the cap of the squeeze bottle. No bubbles had formed or exited the collection tube. 20 minutes: Yeast growth on the bottom of the squeeze bottle increased in height slighlty. 25 minutes: No apparent change in the height of the yeast blooms. No foam was in the collection tube. Bubbles had not formed or exited the collection tube. The colour of the solution appeared to be lighter than the starting colour. |
0 mL |
| 2 |
0 minutes: The solution was a pale cream colour and opaque. Mostly the settled caffeine is visible. 5 minutes: A thin layer of yeast bloom was visible on top of the caffeine layer. No yeast growth was visible at the surface of the solution. 10 minutes: Yeast gorwth on the bottom of the squeeze bottle doubled in height. There was no foam entering the collection tube, and there was no bubbles exiting. 15 minutes: The yeast blooms on the bottom of the squeeze bottle grew to be the same thickiness as the caffeine. No surface yeast growth. No bubble exiting the collection tube, and no foam entering. 20 minutes: Not much visible change since the last time interval. There was no visible growth in the bottom yeast bloom. No surface yeast growth. No foam entering the tubing. or bubbles exiting the collection tube. 25 minutes: There was a slight increase in the height of the yeast growth on the bottom of the squeeze bottle. Temperature was slightly cooler than it was at the starting time. |
0 mL |
Trial 2
Concentration: 0g
| Test Number | Observations | CO2 Collected |
| 1 |
0 minutes: The solution is a dark beige colour. There was a layer of yeast settled on the bottom of the squeeze bottle. White foam was present on the surface of the solution. 5 minutes: No bubbles exited the collection tube. Foam on the surface of the solution started to increase. 10 minutes: Yeast foam on the bottom of the squeeze bottle increased in height. In the collection tube, yeast foam became present. Bubbles started to exit the collection tube slowly. 15 minutes: The yeast foam in the collection tube increased. Bubbles consitently exited the collection tube 20 minutes: Bubbles started to exit the collection tube more frequently. The yeast foam in the collection tube is travelling down further. 25 minutes: One large bubble would travel to the end of the collection tube and stay there. Smaller bubbles would then be released from the "parent" bubble. |
21 mL |
| 2 |
0 minutes: The solution was a pale beige colour. Yeast was settled on the bottom of the squeeze bottle. 5 minutes: White foam was present on the surface of the solution. The height of the yeast blooms on the bottom of the squeeze bottle increased in height. 10 minutes: Bubbles started to exit the collection tube, displaying the "parent" system. No yeast foam was in the collection tube. Yeast growth on the bottom of the squeeze bottle increased in height. Yeast clumps from the bottom growth, started to bubble to the surface. 15 minutes: Yeast growth entered the collection tube. Bubbles exiting the collection tube become more consistent. The water in between the bottom and surface yeast growth is lighter than the starting colour. 20 minutes: Yeast growth entering the collection tube consistently. Bubbles began exiting the collection tube quicker. 25 minutes: Yeast growth in the collection tube had travelled down further. |
23 mL |
Concentration: 1g
| Test Number | Observations | CO2 Collected |
| 1 |
0 minutes: The solution was a taupe colour with a deep yellow undertone. White foam present on the surface of the solution. Yeast growth visible on the bottom of the squeeze bottle. 5 minutes: Yeast blooms on the bottom of the squeeze bottle increased in height. No yeast foam had entered the collection tube. 10 minutes: The height of the yeast foam on the bottom of the squeeze bottle, had increased. The solution was lighter and more of a light grey colour and less yellow. No bubbles had exited the collection tube. 15 minutes: Yeast growth on the bottom of the squeeze bottle steadily increased in height. No bubbles had exited the collection tube. 20 minutes: The yeast growth on the bottom of the squeeze bottle, no longer increased. White foam on the surface of the solution had increased. No bubbles had exited the collection tube (this started at 23 minutes). 25 minutes: After accidentally leaving it overnight all the water had been displaced by the morning.
|
1 mL |
| 2 |
0 minutes: Yeast growth was present on the bottom of the squeeze bottle. The solution was a light cream colour and opaque. 5 minutes: Yeast growth on the bottom of the squeeze bottle increased in height. Clumps of the bottom yeast growth started bubbling to the surface of the solution. 10 minutes: A cream coloured foam on the surface of the solution became visible. The bottom yeast growth was around 2 cm in height, and then a large clump bubbled to the surface of the solution. 15 minutes: Yeast growth on the surface of the solution increased. Little air bubbles became visible in the bottom yeast growth. 20 minutes: Bubbles exited the collection tube at a consitent pace. Both the bottom and the surface yeast growth increased in height. 25 minutes: The surface yeast growth appear less dense, and more airy. Bubbles continued to exit the colletction tube. The yeast growth on the bottom of the squeeze bottle, formed these little clumps, that rested on top of the main growth. |
9 mL |
Concentration: 5g
| Test Number | Observations | CO2 Collected |
| 1 |
0 minutes: The solution is a dark cream colour. A distinct variation between settled caffeine and yeast was visible. White foam was present on the surface of the solution. 5 minutes: Caffeine was settled on the bottom of the squeeze bottle, with the yeast growth on top. There was no visible colour change, or bubbling of yeast from the bottom to the surface. 10 minutes: The variation between the caffeine and yeast became clearer. A hole formed in the caffeine and yeast layer settled on the bottom of the squeeze bottle. 15 minutes: Clumps of the bottom yeast growth started to bubble to the surface. The bottom yeast growth increased. 20 minutes: The bottom yeast growth, continues to increase, and bubble to the surface of the solution. The white foam present on the surface of the solution increased. 25 minutes: No bubbles had exited the collection tube. Both the surface and botttom yeast growth had increased. |
0 mL |
| 2 |
0 minutes: The solution was lukewarm. Caffeine settlement, with a thin layer of yeast settled on top was visible. A light white foam was visible on the surface. 5 minutes: The solution began to leak from the squeeze bottle. Variation between the caffeine and yeast growth became visible. The white foam on the surface had grown into the cap of the squeeze bottle. 10 minutes: The yeast growth on the bottom of the squeeze bottle, increased in height. The white foam on the surface was no longer visible. 15 minutes: The bottom yeast growth greatly increased in height. There was no bubbling of yeast to the surface or, bubbles exiting the collection tube. 20 minutes: Clumps of the bottom yeast growth began to bubble to the surface. The white foam that was previously not visible, became visible again. No bubbles exited the collection tube. 25 minutes: The white foam on the surface of the solution increased. The bubbling of yeast clumps to the surface continued. No bubbles exited the collection tube.
|
0 mL |
Concentration: 8g
| Test Number | Observations | CO2 Collected |
| 1 |
0 minutes: A thick layer of caffeine was visible on the bottom of the squeeze bottle. It formed these clould like structures. The solution was light beige in colour. 5 minutes: The yeast appeared to be forming around the cloud like caffeine. White foam was visible on the surface of the solution. 10 minutes: The yeast growth on the bottom of the squeeze bottle increased in height. There was no bubbling of yeast clumps to the surface. 15 minutes: Bubbles started to exit the collection tube sporadically. The white foam on the surface increased. Clumps of the bottom yeast growth, began to bubble to the surface. 20 minutes: Yeast started to enter the collection tube. Bubbling of yeast clumps to the surface stopped. No bubbles exited the collection tube. 25 minutes: Yeast foam in the collection tube increased. The caffeine appears to be stuck to the walls of the squeeze bottle. |
8 mL |
| 2 |
0 minutes: A thick layer of caffiene on the bottom of the squeeze bottle was present. There is white foam present on the surface of the solution. The solution was a taupe colour. 5 minutes: The yeast layer settled on top of the caffeine was more visible. There was no yeast in the collection tube. 10 minutes: The yeast settled on top of the caffeine became more leveled. No bubbles exiting the collection tube, or clumps of yeast bubbling to the surface. 15 minutes: The surface yeast growth began to enter the cap of the squeeze bottle. Distinction between the caffeine and yeast layers became more clear. 20 minutes: No bubbles exiting the collection, change in colour or yeast growth. 25 minutes: The yeast appeared to increase in height slightly. The colour of the solution appeared to be slightly lighter than the starting colour.
|
0 mL |
Analysis
Trial 1
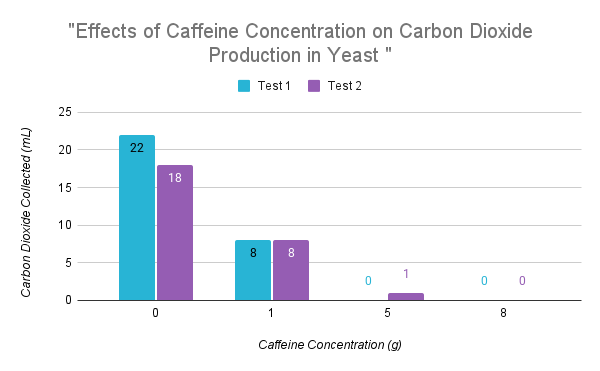
From the data, the test that produced the most CO2 was “Concentration 0g test 1 (Con.0gT1)”. The tests that produced the least CO2 were “Concentration 8g test 1 and 2 (Con.8gT1 and Con.8gT2)” and “Concentration 5g test 1 (Con.5gT1)”. “Con.0gT1” producing the highest amount of CO2 and “Con.8gT1 and 2” producing the lowest was expected, but “Con.5gT1” also produced 0mL of CO2 which wasn’t. 0mL of CO2 being produced for any test is unlikely, the data appearing this way is likely due to errors in the experiment's design. The experiment allowed each test 25 minutes to produce and collect CO2. Since the CO2 was produced anaerobically through fermentation, as the caffeine concentration increases, 25 minutes isn’t enough time for the yeast to metabolize the total sugar. In the case of “Con.5gT1” and “Con.8gT1 and 2”, this shows that caffeine slows the rate yeast metabolizes sugar, therefore decreasing the rate CO2 is produced. This is proved as “Con.0gT1 and T2” produced and collected 22 and 18mL of CO2 in 25 minutes. Even then, the “Control” tests still are not the most accurate representation of the total amount of CO2 produced. An experiment done by the University of Waterloo where 20g of white sugar and 7g of Quick-Rise yeast were mixed in 100mL of 43 degrees Celsius water, showed the solution steadily produced CO2 for 700 minutes (11.7 hours). After 700 minutes CO2 was produced at a slower rate for 300 minutes at 1000 minutes, 16 hours, CO2 production evened out but the line was still on an upward trend; the graph ended at 1000 minutes. Based on the data collected from their experiment, it could be up to 490 minutes, 8 hours, of steady increased CO2 production. After 490 minutes CO2 production would still last for hours more at a slower rate. This number is only for the control tests, meaning the tests with caffeine would produce at a slower rate increasing the overall time. Thus proving the amount of time allotted to the tests to collect CO2 a major flaw in this experiment. If the time had been adjusted to 24 hours the results would be different, and overall more accurate.
Another reason for the inaccuracy of the data collected potentially comes from the design of the collection apparatus. The collection tube that was connected to the squeeze bottle containing the yeast solution(s) and placed in the graduated cylinder was 5 feet in length, which was potentially too long. 5 feet is a long distance for a small amount of CO2 to travel. When higher amounts of CO2 are produced at a faster rate such as the “control” tests there is more pressure in the tube, moving the CO2. During “Con.5gT2” and “Con.8gT1 and T2” it is likely the opposite occurred ; a small amount of CO2 produced at a slow rate doesn’t create the pressure needed to push it through the 5 foot tube. In terms of “Con.5gT1” CO2 bubbles were present at 24 minutes, this could mean they were created earlier but 24 minutes is when they successfully traveled through the tube. The solution for this would be reducing the length of the tube. When considering the length, it needs to be long enough to be in the graduated cylinder to a minimum height of 50mL, as well as, still bend and attach to the squeeze bottle. Due to these requirements a length no shorter than 1.5’ or longer than 2’ would be suitable.
Trial 2

After running the experiment again, certain test produced simmilar results as in "Trial 1", others produced vastly different results. In "Trial 2" 0g concentration, 21mL of CO2 was collected for test 1, and 23mL for test 2. This is comparable to the CO2 collected in the "Trial 1" 0g concentration, which was 22mL for test 1 and 18mL for test 2.
In "Trial 2", two greatley different results were produced in the 1g concentration. In test 1, 1mL of CO2 was collected. This is inconsistent with the 8mL collected in "Trial 1" test 1 and 2, and the 9mL collected in "Trial 2" test 2. When comparing observations between the tests and the trials, a key detail takes place at 20 minutes. At 20 minutes in "Trial 1" (1g) test 1, there was no visible height increase of the yeast blooms on the bottom of the squezze bottle, but more pronounced air bubbles in the blooms was noted. Although, there was no visible growth, the bubbles indicate otherwise. This was also observed in "Trial 1" (1g) test 2, there was no visible height increase in yeast bloom height, but bubbles started to exit the collection tube at 20 minutes. Prior to this, at 15 minutes more pronounced air bubbles were noticed in the yeast blooms. In "Trial 2" (1g) test 2, bubbles were exiting the collection tube at 20 minutes, and had been since 3 minutes prior. As well as, both the bottom and surface yeast growth continued to increase in height. In "Trial 2" (1g) test 1, at 20 minutes, there was no visible increase in height for both the surface and bottom yeast blooms. No other indicators of growth were observerd. It was not until 23 minutes when bubbles started exiting the collection tube. Throughout the obersvations one trend is apparent, at 20 minutes all the tests of the 1g concentration had signs of growth, besides "Trial 2" test 1. The other tests had been more active, and for longer periods of time, producing more CO2 in the time alloted. Test 1 "Trial 2" showed no visible signs of growth at 20 minutes, and started having bubbles exit the collection tube at 23 minutes, allowing for only 2 minutes of collection time. The reason for the lack of yeast activity is unclear, as the procedure for this test was conducted the same, and no sources of error were made.
"Trial 2" 5g concentration test 1 and 2 produced comparable results to "Trial 1" test 1 and 2. In "Trial 1" (5g) test 2, 1mL of CO2 was collected, which is more than the other tests, but not extremley different. When looking at the observations, at 15 minutes it was noticed that the bubbles in the yeast growth were more pronounced, which was not noticed in the other tests. Still, the variation is minor.
"Trial 2" (8g) test 1, has a noticeable outlier. With all the other 8g tests having 0mL of CO2 collected, and "Trial 2" test 1 had 8mL collected. One difference between this test ("Trial 2", 8g, test 1) and the others, is a source of human error. When mixing the solution for this test, the stirring step of the caffeine was missesd. The caffeine had been added to squeeze bottle, followed by the sugar and yeast water. This was done to ensure the full caffeine amount was in the bottle, as other tests had been overflowing when pouring the yeast, caffeine, and sugar solution. In doing so, trying to solve the issue, of not all the caffeine being in the squezze bottle, caused inconsistencies later on. As a result, the caffeine was not mixed throughout the water, and the yeast had minimal contact with it. If this had not been done, the results would likely be the same as the other 8g concentration tests. The observations are not comparabable, as the issue started before the timed testing.
Changes to the Experiment in the Future
The biggest changes I would make to this experiment in the furture, would be in the design of the apparatus. As mentioned previously, the length of the collection tube should be shortened to 2 feet minimum, and no shorter than 1.5 feet. This would allow for more accuracy in the data as the CO2 produced, would not have to travel a long distance. Second, the 100mL graduated cylinder should be replaced by one with more volume, between 250-500 mL. This would allow for a longer period of examination, without all the water being displaced. Third, changing the consturction of the apparatus, so that the collection tube could be straight, and not coiled. By elevating the container to be at the height of the squeeze bottle, the collection tube could be straight. Gas travels in a straight line until it hits something, by straightening out the collection tube, the idea is there will be less curves for the gas to bounce off of, allowing for the CO2 to travel quicker through the tube and provide more accurate results. Lastly, as for the design of the apparatus, squeeze bottle with a slightly larger volume than 250mL should be used. This would allow for more yeast growth within the bottle before it enters the collection tube and, for all the caffeine to be present in the squeeze bottle without overflow. One change that should be maade to the design of the experiment, would be to increase the the collection period from 25 minutes, to 24 hours. This allows the CO2 more time to be made and collected, which would give more comparable, and accurate results.
Conclusion
In conclusion, the hypothesis was incorrect. This is because the hypothesis predicts that as caffeine concentration increases, overall CO2 production will decrease, not the rate which is what was seen in the tests. Based on the data collected, this experiment proves that caffeine decreases the rate CO2 is produced. In terms of the overall CO2 collected there was not enough time for the tests with caffeine to produce CO2. Although, the outlier in "Trial 2" 8g concentration test 1 challenges all of these ideas, and it is unkown if the result is completley due to human error. By making the changes suggested in the analysis, more accurate and comparable data would be collected, allowing for a final, confident verdict on the hypothesis.
Application
Worldwide 1 in 3 people suffer from an overgrowth of Candida fungus, which includes but is not limited to thrush, vaginal candidiasis, and invasive candidiasis. Although Candida overgrowth isn’t inherently severe for healthy people it can pose a huge risk to people with compromised immune systems from cancer, HIV, diabetes, anemia, young children, and people over the age of 65. Furthermore the rise of antifungal and antibiotic resistance, means the medications prescribed to treat the infection are becoming less effective. Without proper treatment the relatively mild and easy to treat Candida overgrowth can turn into the acute condition, invasive candidiasis.
Invasive candidiasis is a major fungal infection that can become life-threatening without the proper diagnosis and treatment. It develops when Candida enters the bloodstream, this is called candidemia, and spreads to other parts of the body such as the bones, central nervous system, liver, and heart. Candidemia is one of the most common healthcare-associated infections, putting people receiving treatment at hospitals for other conditions at risk. Among hospital patients, premature babies, illegal drug users/abusers, people with vein catheters, people of colour, and anyone with a weakened immune system are at risk of Candidemia. Symptoms of invasive candidiasis include abdominal pain, chills or fevers, low blood pressure, muscle aches, skin rashes, and weakness or fatigue. Depending on the location symptoms can vary. For example, invasive candidiasis in the eye can produce symptoms such as blurred vision and sensitivity to light. These symptoms make the condition difficult to diagnose, as the majority of people developing the condition are recovering or simultaneously have illnesses that present the same symptoms. In 2015 the mortality rate for invasive candidiasis was 30-60%, per the National Health Institute.
One issue that could be worsened by invasive candidiasis is leaky gut syndrome. Leaky gut syndrome is a hypothetical condition, as there is still debate and not enough information to determine whether it is a symptom or its own condition. Everyone's gut is semi permeable and designed to absorb water and nutrients from consumed food. Leaky gut syndrome is the result of increased permeability or hyperpermeability, resulting in the gut absorbing more than water and nutrients. Because it causes hyperpermeability it is easily susceptible to bacteria and fungi in the bloodstream such as invasive candidiasis. Without treatment invasive candidiasis will spread everywhere including the gut, but leaky gut syndrome could increase the rate Candida is absorbed and spread.
Caffeine could be used as a topical treatment to treat Candida. Caffeine molecules are small enough to penetrate the skin. Within five minutes caffeine can penetrate the epidermis layer of the skin. For caffeine to be used as a topical treatment for Candida, the concentration would need to be higher than what was used in this test. A 2022 study conducted by the Scientific Research Department at Imam Abdulrahman Bin Faisal University, found that caffeine inhibited the growth of Candida biofilms on dentures after 24-48 hours. They found the most effective concentration to be 60 mg/mL. Although caffeine has not been used as a topical antifungal for skin Candida, their experiment confirmed its antifungal properties, and this experiment confirmed that it slows the rate of growth. Between both experiments, caffeine could be an antifungal treatment or additive in the future.
Caffeine is also significantly cheaper than current prescription antifungals. Worldwide it is estimated that 3.8 million people died due to fungal infections, in 2023. This is more than how many people died (630,000) from AIDS related illnesses, in 2023. If caffeine ever developed into its own topical antifungal treatment, it could make antifungal treatment more accessible to impoverished communities. As an additive, it could allow for less of the main active ingredient to be used, also lowering the costs.
Sources Of Error
- When pouring from the graduated cylinder into the Pyrex cup some water splashed out, since an unspecified amount came out it could not be replaced (Concentration 0g test 2 "Trial 1").
- When opening one of the caffeine capsules it exploded and some of the powder could not be collected (5g caffeine collection).
- When pouring the 5g solutions into the squeeze bottles from the Pyrex cup, there was a multitude of caffeine that had to be scraped out, so the entire 5 grams was not in the squeeze bottle.
- During the 5g concentration test 2 ("Trial 1"), there was some leaking that occurred from the top of the squeeze bottle for about 5 minutes.
- When carrying the squeeze bottle for concentration 8g test 1 ("Trial 1") some solution spilled out (approximately 5mL) as it was very full.
Citations
AlEraky, D. M., Abuohashish, H. M., Gad, M. M., Alshuyukh, M. H., Amr Bugshan, Almulhim, K. S., & Mahmoud, M. (2022). The Antifungal and Antibiofilm Activities of Caffeine against Candida albicans on Polymethyl Methacrylate Denture Base Material. Biomedicines, 10(9), 2078–2078. https://doi.org/10.3390/biomedicines10092078
Bergland, C. (2022, November 4). What Is ATP? Verywell Health. https://www.verywellhealth.com/atp-6374347
CDC. (2024, May 16). Antimicrobial-Resistant Fungal Diseases. Fungal Diseases. https://www.cdc.gov/fungal/antimicrobial-resistant-fungi/index.html
Cleveland Clinic. (2018). Thrush. Cleveland Clinic. https://my.clevelandclinic.org/health/diseases/10956-thrush
Cleveland Clinic. (2022a). Candida Albicans: Infections, Symptoms & Treatments. Cleveland Clinic; Cleveland Clinic. https://my.clevelandclinic.org/health/diseases/22961-candida-albicans
Cleveland Clinic. (2022b, January 27). Invasive Candidiasis: Causes, Symptoms & Treatment. Cleveland Clinic. https://my.clevelandclinic.org/health/diseases/22308-invasive-candidiasis
Cleveland Clinic. (2022c, June 6). Candidiasis Fungal Infection: Causes & Treatment. Cleveland Clinic. https://my.clevelandclinic.org/health/diseases/23198-candidiasis
Denning, D. W. (2024). Global incidence and mortality of severe fungal disease. The Lancet Infectious Diseases, 24(7). https://doi.org/10.1016/S1473-3099(23)00692-8
Evans, J., Battisti, A. S., & Richards, J. R. (2024, May 29). Caffeine. National Library of Medicine; StatPearls Publishing. https://www.ncbi.nlm.nih.gov/books/NBK519490/
HSU, C. (2020, July 13). Meet baker’s yeast. Www.buffalo.edu. https://www.buffalo.edu/ubnow/stories/2020/07/yeast.html
Leaky gut syndrome. (2022, April 6). Cleveland Clinic. https://my.clevelandclinic.org/health/diseases/22724-leaky-gut-syndrome
Moore, D., & Ahmadjian, V. (2019). Fungus. In Encyclopædia Britannica. https://www.britannica.com/science/fungus
Summer, J. (2022, June 7). Adenosine and Sleep. Sleep Foundation. https://www.sleepfoundation.org/how-sleep-works/adenosine-and-sleep
What is Candida Overgrowth? (n.d.). Mitchell Medical Group. Retrieved June 1, 2023, from https://www.mitchellmedicalgroup.com/services/candida/about-candida/
Yeast Stress Responses. (2002). In S. Hohmann & W. H. Mager (Eds.), Topics in Current Genetics. Springer Berlin Heidelberg. https://doi.org/10.1007/3-540-45611-2
Acknowledgement
I acknowledge my gratitude towards my science teacher, and science fair cordinator Ms. Burkell. Her help, feedback, and dedication has been invaluable. I also thank Mr. Bykovskikh and his fiance, aswell as Ms. Burkell for helping me pivot when challenges arose in designing my experiment. I also thank Dr. Rose for his feedback, and mentorship. Lastly, I thank my family for asking questions, providing suggestions and encouragement. All the support I have received has made my project better, aswell as made me a better scientist.