SILENCED BY METHYLATION: DNA Methylation patterns as biomarkers for breast cancer
Helli Chalishajar
Fairview School
Grade 9
Presentation
Problem
PROBLEM
The Growing Burden of Breast Cancer
Breast cancer remains a leading cause of cancer mortality worldwide, with over 500,000 to 670,000+ deaths estimated annually in recent years. This is not just a statistic, but instead reflects the lives lost because cancer is often discovered only after it has already advanced. Despite improvements in awareness, screening, and treatment, late detection continues to drive poor outcomes and increased treatment burden.
Breast cancer is a disease in which abnormal cells in the breast grow uncontrollably, forming tumours that can invade nearby tissue and spread, or metastasize, to other parts of the body. It most commonly begins in the milk ducts or lobules. While researchers have identified risk factors such as hormonal influences, lifestyle factors, and environmental exposures, the exact cause of most breast cancers is not fully understood. Not everyone with risk factors develops cancer, and some individuals with no clear risk factors still do, suggesting that breast cancer develops through a complex interaction between genetic susceptibility and environmental influences over time.
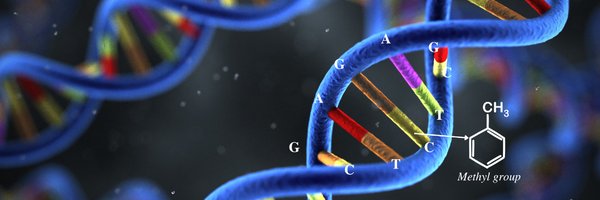
At the cellular level, breast cancer begins when changes occur in DNA within breast cells. DNA is the molecule that carries hereditary information in a sequence of four nucleotide bases: adenine, thymine, cytosine, and guanine. The order of these bases forms the genetic code that regulates cell growth, division, and programmed cell death. In healthy breast tissue, cells grow in a controlled manner, mature into specialized ductal or lobular cells, and undergo apoptosis if damaged. They remain organized and respond to normal growth signals. In contrast, cancerous breast cells divide uncontrollably, evade programmed cell death, lose specialization, and invade surrounding tissue. These differences explain why cancer becomes increasingly dangerous as it progresses.
The Need for Early Detection
The stage at which breast cancer is diagnosed strongly predicts survival.
- Stage I: approximately 100 percent five-year survival
- Stage II: about 92 percent
- Stage III: about 74 percent
- Stage IV: roughly 23 percent
Early detection identifies cancer before it spreads, when treatments such as surgery, radiation, or targeted therapies are significantly more effective. As tumours grow and metastasize, treatment becomes more aggressive and the physical, emotional, and financial burdens increase greatly.
Limitations of Current Detection Methods
Mammography is the standard screening tool and uses low dose X rays to detect masses and microcalcifications. While it has reduced mortality in population screening programs, its sensitivity averages around 79 percent and can drop significantly in younger women or those with dense breast tissue. Mammograms miss approximately one in eight breast cancers and may provide false reassurance. Specificity also varies, meaning many women receive false positive results. Over a ten year screening period, up to half of women may experience at least one false positive mammogram, leading to additional imaging or biopsies that ultimately find no cancer.
Biopsies, while diagnostically definitive, are invasive procedures that involve tissue removal and microscopic examination. Core needle biopsy is the most common approach. These procedures can be painful, anxiety inducing, and costly. For many patients, the diagnostic pathway becomes physically and emotionally taxing.
Furthermore, detection challenges are even greater in women with dense breast tissue. Dense tissue appears white on mammograms, the same colour as many tumours, creating a masking effect. In dense breasts, sensitivity can fall as low as 30 to 48 percent. Younger women are more likely to have dense tissue, making early detection even more difficult in this population.
Detecting cancer before it becomes visible
These limitations highlight a critical gap in current breast cancer detection.
Cancer begins with molecular and regulatory disruptions long before a tumour becomes visible on imaging. By the time structural changes such as masses or calcifications are detectable, biological progression may already be well underway. There is a clear need for diagnostic approaches that identify cancer at its earliest molecular stages rather than waiting for visible abnormalities to appear.
Cancer has traditionally been associated with genetic mutations, which are permanent changes in the DNA sequence. Mutations alter the actual letters of DNA and may occur due to replication errors, radiation exposure, carcinogens, or inherited factors. Once a mutation occurs, it becomes part of the genome and is copied every time the cell divides. However, cancer development is not driven solely by mutations. Changes in gene regulation can also occur without rewriting the DNA sequence itself.
DNA Methylation
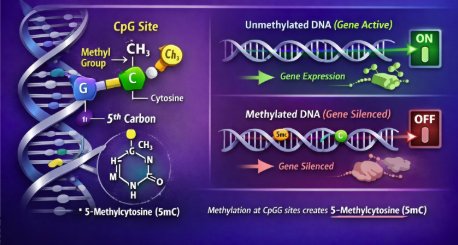
DNA methylation is one of the most important epigenetic mechanisms involved in gene regulation. It modifies DNA without changing the underlying genetic code. The order of bases A, T, C, and G remains the same, but the way the DNA is interpreted and expressed by the cell can change. In this process, a methyl group, CH₃, is added to a cytosine base, most commonly at CpG sites where cytosine and guanine are linked together. When methylation occurs at promoter regions, it can make genes harder to read and often silence them. Unmethylated promoters allow genes to remain active.
In healthy cells, methylation patterns are carefully regulated to maintain proper gene expression. Tumour suppressor genes remain active so they can control cell growth and prevent uncontrolled division. In cancer, this regulatory balance becomes disrupted. Promoter CpG islands near tumour suppressor genes can become hypermethylated and silenced, while large regions of the genome may become hypomethylated, contributing to genomic instability and abnormal gene activation. Importantly, these methylation alterations can occur early in cancer development, sometimes before significant mutations develop or before a tumour is visible.

DNA methylation patterns therefore represent strong biomarker candidates. They form distinct, disease-specific signatures that can differentiate healthy tissue from cancer. Since these regulatory changes may arise earlier than visible tumour formation, they present an opportunity to detect cancer sooner and potentially improve patient outcomes.
This leads to the central question driving my project:
Can specific DNA methylation patterns be used to detect early-stage breast cancer, and how practical and efficient could this approach be in today’s healthcare system?
HYPOTHESIS
I hypothesize that if specific DNA methylation patterns in key breast cancer-associated genes are identified and analyzed using a machine learning model, then they can be used as reliable biomarkers for the early detection of breast cancer, because abnormal methylation can silence tumour suppressor genes or activate oncogenes, which are among the earliest changes in cancer development. By training a classifier on genome-wide CpG methylation data, the model can learn the distinct “methylation fingerprint” of tumour versus normal tissue and highlight the most informative CpG sites linked to cancer related genes and regions. By studying these methylation patterns, it may be possible to detect breast cancer before symptoms appear, enabling earlier intervention and treatment. Furthermore, analyzing the efficiency of this approach within the healthcare system could demonstrate how integrating methylation-based screening supported by machine learning might improve diagnostic accuracy, reduce unnecessary procedures, and optimize patient care.
Method
PROJECT METHODOLOGY
I began this project with an in-depth literature review to build a strong foundation on breast cancer biology. I researched what breast cancer is, how it develops at the cellular level, and the major differences between normal breast cells and cancer cells, while also learning the key subtypes and risk factors. I also reviewed why early detection matters so much for outcomes and how current screening and diagnostic pathways work. This helped me identify major limitations in today’s methods and reinforced the need for more precise diagnostic tools that can detect cancer earlier.
Next, I focused on genetics and epigenetics, with most of my attention going toward DNA methylation. I studied what DNA methylation is, how it functions in normal gene regulation, and why it is considered a strong biomarker. I then explored normal versus abnormal methylation patterns, including promoter hypermethylation and global hypomethylation, and how these changes contribute to cancer development. I also looked into breast cancer-specific methylation signatures to understand what patterns are most relevant to my research question. Throughout this research stage, I used scientific sources from PubMed, Google Scholar, NCBI, and The Cancer Genome Atlas to make sure the information I was using was accurate and clinically relevant.
After building my background knowledge, I moved into the computational part of the project and learned the basics of supervised machine learning and classification. I then began developing my model using Kaggle as my coding software and a publicly available DNA methylation dataset from NCBI. I organized the dataset so that CpG sites acted as features and each sample was labelled as tumour or normal. I prepared the data for modelling, separated it into training and testing sets, and trained a classifier to learn the relationship between methylation patterns and tissue type. Finally, I evaluated performance on unseen data to see how well methylation patterns could distinguish tumour tissue from normal tissue and whether the results supported methylation as a practical biomarker for early detection.
MY CODE METHODOLOGY
ORIGINALLY:
I initially attempted this analysis using Google Colab because it provides an accessible Python environment. However, due to the large size of the DNA methylation dataset (hundreds of thousands of CpG sites) and restrictions on file handling and storage, I encountered repeated issues with file uploads, session stability, and much more. These limitations made it difficult to reliably parse and process the data. As a result, I transitioned to Kaggle, which offered a more stable environment for handling large biological datasets and allowed me to complete the analysis efficiently.
STEP 1: DATASET SELECTION
I used the publicly available GEO dataset GSE66695, which contains genome-wide DNA methylation data from breast cancer tumour tissue and normal breast tissue. DNA methylation was measured using the Illumina HumanMethylation450 BeadChip, which interrogates over 450,000 CpG sites across the genome. This dataset is well-suited for machine learning because it has a large number of features (CpG sites) and a clear biological distinction between sample groups.
STEP 2: PARSING AND LOADING THE SERIES MATRIX FILE
The raw data was stored in a GEO “series matrix” text file, which includes both metadata and methylation values. I programmatically identified the start and end of the methylation table using GEO-specific markers, rather than manually extracting the data. This ensured the correct portion of the file was read and avoided human error. The result was a matrix where each row represents a CpG site, and each column represents a biological sample.
STEP 3: DATA CLEANING AND QUALITY CONTROL
CpG sites with excessive missing values were removed, since incomplete data can introduce bias in machine learning models. For the remaining CpGs, missing methylation values were filled using the median value for that CpG across samples. After cleaning, the dataset still retained hundreds of thousands of CpG sites, maintaining genome-wide coverage.
STEP 4: DATA TRANSFORMATION FOR ML
The methylation matrix was transposed so that each row corresponds to a single biological sample and each column corresponds to a CpG site. This orientation is required because machine learning models treat rows as observations and columns as features. At this stage, each sample is represented by hundreds of thousands of methylation measurements.
STEP 5: LABEL EXTRACTION
I pulled the sample labels (Tumour vs Normal) from the dataset’s metadata. Then I cleaned the labels so they were written consistently (for example, no extra spaces or different capitalization). Next, I matched each label to the correct sample column in the methylation data so nothing was mixed up. Finally, I double-checked that the number of labels equalled the number of samples and confirmed the group counts (80 tumour, 40 normal).
STEP 6: HIGH-DIMENSIONAL FEATURE REDUCTION
Since the dataset has hundreds of thousands of CpG sites but only 120 samples, the model could easily “memorize” the training data instead of learning real patterns. To prevent that, I removed CpG sites that barely change across samples (low variance), since they don’t help separate tumours from normal. Then, I used a statistical test (ANOVA F-test) to find CpGs that differ the most between the two groups. I kept the top 2,000 most informative CpGs and removed the rest. This keeps the strongest biological signal while making the model more reliable.
STEP 7: MODEL SELECTION AND TRAINING
I trained a logistic regression model to predict whether a sample is tumour or normal based on its methylation pattern. Logistic regression is a good choice because it provides a clear “weight” for each CpG, so we can tell which CpGs are pushing the prediction toward tumour or normal. I used L1 regularization, which forces the model to keep only the most important CpGs and sets the rest to zero. This is helpful because it prevents the model from relying on thousands of weak signals and instead focuses on a smaller, stronger set of CpGs. I also balanced class weights so the model treats tumour and normal samples fairly, even though there are more tumours.
Analysis
Model Performance
On my initial held-out test set, the logistic regression classifier achieved a ROC AUC of 1.0 and a PR AUC of 1.0, meaning it completely separated tumour and normal samples on that split. The confusion matrix showed zero mistakes, with the model correctly classifying 10 out of 10 normal samples and 20 out of 20 tumour samples in the test set.
Since perfect performance can sometimes happen by chance, especially with smaller test sets, I wanted to confirm that this result was not caused by overfitting or a lucky split. To validate the model more rigorously, I performed nested cross-validation, which repeats training and testing multiple times while keeping feature selection inside each fold to prevent leakage. Across five folds, performance stayed extremely high, with a mean ROC AUC of approximately 0.995 ± 0.009 and a mean PR AUC of approximately 0.998 ± 0.005. One fold dipped slightly to around 0.977, which is normal and actually makes the results more believable, but the overall performance remained consistently strong.
To further confirm that the model was learning true biological signal rather than memorizing patterns, I also ran permutation testing. In this step, I randomly shuffled the tumour and normal labels while keeping the methylation data the same, then retrained the full modelling pipeline multiple times. After permutation, performance dropped to near-random levels. This showed that the classifier’s accuracy depends on the correct biological labels and supports the idea that it is learning meaningful methylation patterns rather than noise.
Biological Interpretation
One strength of logistic regression is that it does not just classify samples, it also provides coefficients that show which CpG sites are pushing predictions toward tumour or normal. In my model, the sign of each coefficient reflects the direction of methylation change linked to tumour classification. Positive coefficients represent CpG sites where higher methylation increases the likelihood of a tumour prediction, while negative coefficients represent CpG sites where lower methylation is associated with tumour samples.
When I looked at my strongest CpGs, many had large positive coefficients, suggesting tumour-specific hypermethylation. This matches a well known cancer pattern, where promoter hypermethylation can silence genes that normally help control cell growth and regulation
Key CpG's
To connect my results back to my research, I annotated the most influential CpGs using the Illumina 450K annotation file. I then categorized CpG sites based on genomic location, including promoter regions, gene bodies, and intergenic regions. Promoter-associated CpGs are especially important because methylation in promoters can directly reduce gene expression and silence genes.
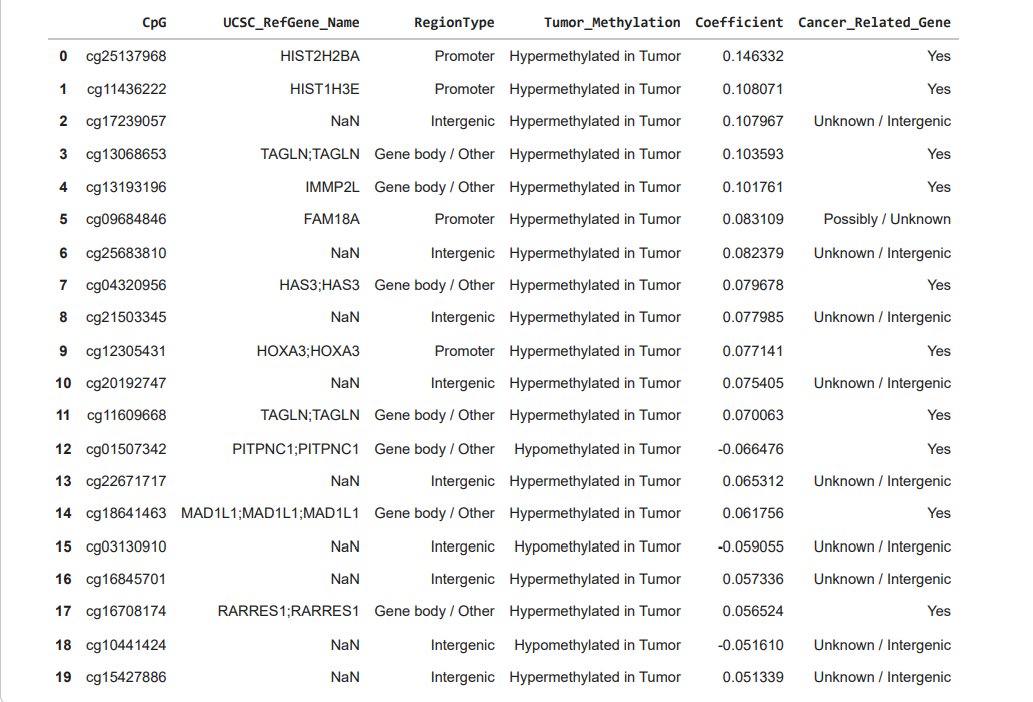
From my top 20 CpGs, I found that 4 were located in promoter regions, 7 were in gene bodies or related regions, and 9 were intergenic. Intergenic CpGs are still meaningful in methylation studies because they can fall in enhancers or other regulatory DNA that affects gene expression even if it is not located directly within a gene.
When I labelled CpGs as hypermethylated or hypomethylated in tumour samples using the sign of the coefficients, a large proportion of my top CpGs were hypermethylated in tumours. This aligns with cancer mechanisms where tumour suppressor genes or regulatory genes can be turned off when they should remain active. Many of the genes linked to my strongest CpGs were involved in transcriptional control, chromatin remodelling, histone related structure, and cell cycle regulation, which are all processes commonly disrupted in cancer.
One example from my results was cg25137968, which had the largest absolute coefficient and mapped to the promoter region of HIST2H2BA. This CpG was hypermethylated in tumour samples and had a positive coefficient of +0.146332, meaning higher methylation at this site strongly pushed the model toward tumour classification. Since it is located in a promoter region, this is especially relevant because promoter methylation is linked to changes in gene activity.
Visual Evidence
To visualize how well these CpGs separated the groups, I generated a heatmap using the top features. The heatmap showed clear clustering of tumour samples together and normal samples together, with strong colour differences between the two groups. This just further proved my quantitative results and strengthened the results that tumour and normal tissue have distinct methylation signatures.

Conclusion
MY CONCLUSION
Cancer is often thought of as a disease caused only by changes in DNA, but cells can also change how genes are used without changing the DNA itself. One of the most important ways this happens is through DNA methylation, where small chemical tags are added to DNA and act like switches that turn genes on or off. In this project, I showed that breast cancer tissue has a very different methylation pattern compared to normal tissue. By analyzing these patterns across hundreds of thousands of CpG sites, my model learned a clear and consistent “methylation fingerprint” that distinguishes tumour samples from normal samples.
What makes this project meaningful is that the model did more than just make predictions; it helped explain where and how these differences appear. Even though the original data contained nearly half a million CpG sites, the final model relied on only a small set of the most informative ones. Many of these CpGs were linked to genes and regions of DNA known to be involved in gene regulation and cancer-related processes. I also used strong validation techniques, including nested cross-validation and permutation testing, to make sure the results were not due to chance.
From a real-world perspective, my project highlights why methylation-based screening is so promising for early cancer detection. Changes in DNA methylation often happen early in cancer development, sometimes before a tumour is visible on imaging or causes symptoms. If a small panel of CpG sites can reliably indicate cancer-related changes, it could be used as a screening tool to catch the disease earlier, when treatment is more effective. Because methylation can be measured from very small samples, and potentially even from blood, this kind of screening could improve existing diagnostic methods.
Another important advantage of this approach is that it could help reduce invasive medical procedures. Today, many patients undergo biopsies or repeated imaging tests when cancer is suspected, even when the results are ultimately negative. A reliable methylation-based test could act as an initial filter, helping doctors decide when invasive follow-up tests are truly necessary. This could reduce patient stress, lower medical risks, and make the diagnostic process more efficient.
Overall, this project shows that tumours and normal tissue have different DNA methylation patterns that a model can learn and recognize. I made sure the model wasn’t just “getting lucky” by validating it in stronger ways and by checking what CpG sites it relied on. The end result is not just a prediction, but a small list of methylation signals that help explain the difference between tumour and normal. With more data, this idea could support earlier cancer detection and reduce the need for invasive testing in some cases.
NEXT STEPS
With more time and resources, I would expand this project by training the model on larger and more diverse DNA methylation datasets, including additional GEO studies or TCGA breast cancer methylation data. A larger sample size would make the model more stable and reduce the chance that results depend on one specific dataset. I would also focus on building a model that goes beyond tumour versus normal classification by using methylation patterns to distinguish between breast cancer subtypes, such as hormone receptor-positive, HER2-positive, and triple-negative cancers. This is realistic because many public datasets include subtype labels, which would let me train a multi-class classifier and compare which CpG patterns are shared across all breast cancers versus subtype-specific signatures.
Another potential next step could be testing whether methylation patterns shift with disease severity by comparing early-stage and later-stage samples. If consistent differences appear, the model could eventually be used not only to detect cancer but also to support risk stratification. I would also validate my findings by repeating the full pipeline on independent datasets to confirm that the same CpGs and overall performance trends appear again, which is one of the most important steps for showing that a model generalizes.
Citations
- Almeid, B. (2019, March 12). Roadmap of DNA methylation in breast cancer identifies novel prognostic biomarkers. Pub Med. https://pubmed.ncbi.nlm.nih.gov/30866861/
- Bediaga, N. (2010, September 29). DNA methylation epigenotypes in breast cancer molecular subtypes. Springer Nature Link. https://link.springer.com/article/10.1186/bcr2721
- Belcic, I. (n.d.). What is Classification in Machine Learning? IBM. https://www.ibm.com/think/topics/classification-machine-learning
- Bergmann, D. (n.d.). What is Machine Learning? IBM. https://www.ibm.com/think/topics/machine-learning
- Bradford, T. (2021, November 15). Cancer Cells vs. Normal Cells: What's the Difference? Cancer Treatment Centers of America. https://www.cancercenter.com/cancer-cells-vs-normal-cells
- Canadian Cancer Society. (n.d.). What is breast cancer? Canadian Cancer Society. https://cancer.ca/en/cancer-information/cancer-types/breast/what-is-breast-cancer
- Canadian Cancer Society. (2023, June). Stages of breast cancer. Canadian Cancer Society. https://cancer.ca/en/cancer-information/cancer-types/breast/staging
- Canadian Cancer Society. (2023, August N.D). Survival statistics for breast cancer. Canadian Cancer Society. https://cancer.ca/en/cancer-information/cancer-types/breast/prognosis-and-survival/survival-statistics
- CancerQuest. (N.D). Cancer Epigenetics. CancerQuest. https://cancerquest.org/cancer-biology/cancer-epigenetics
- Discovery and validation of cell-free DNA methylation markers for specific diagnosis, differentiation from benign tumors, and prognosis of breast cancer. (2025, June 16). Springer Nature Link. https://link.springer.com/article/10.1186/s13058-025-02066-x
- Donia, A. (2021, February 10). DNA Methylation in Cancer. AZoLifeSciences. https://www.azolifesciences.com/article/DNA-Methylation-in-Cancer.aspx
- Hum, M. (2025, April 23). DNA methylation in breast cancer: early detection and biomarker discovery through current and emerging approaches. NIH National Library of Medicine. https://pubmed.ncbi.nlm.nih.gov/40269936/
- J, W. (2015, March 11). Genome-wide Scan for Methylation Profiles in Breast Cancer. NCBI GEO. https://www.ncbi.nlm.nih.gov/geo/query/acc.cgi?acc=GSE66695
- Kit, A. H. (2012, Novemeber). DNA methylation based biomarkers: practical considerations and applications. Pub Med. https://pubmed.ncbi.nlm.nih.gov/22847185/
- Li, J. (2020, September 26). Non-Invasive Biomarkers for Early Detection of Breast Cancer. MDPI. https://www.mdpi.com/2072-6694/12/10/2767
- Liu. (2020, June 31). Sensitive and specific multi-cancer detection and localization using methylation signatures in cell-free DNA - PubMed. PubMed. https://pubmed.ncbi.nlm.nih.gov/33506766/
- Liu, J. (2021, February 19). Genome-wide cell-free DNA methylation analyses improve accuracy of non-invasive diagnostic imaging for early-stage breast cancer. Pub Med. https://pubmed.ncbi.nlm.nih.gov/33608029/
- Mayo Clinic. (2025, July 26). Breast cancer - Symptoms and causes. Mayo Clinic. https://www.mayoclinic.org/diseases-conditions/breast-cancer/symptoms-causes/syc-20352470
- Statistics Canada. (2023, January 19). When caught at the first stage, five-year survival exceeds 90% for four of the five most common cancers in Canada. https://www.statcan.gc.ca/o1/en/plus/2773-when-caught-first-stage-five-year-survival-exceeds-90-four-five-most-common-cancers
Acknowledgement
I am grateful to everyone that has supported me in this amazing journey of research.
Firstly, thank you to the Calgary Youth Science Fair for providing me with this awesome opportunity to showcase my project. My sincere gratitude goes to Mr. DeGelder, my CYSF coordinator, and Fairview School for their continuous encouragement and support of my academic efforts. Finally, I would like to express heartfelt appreciation to my family and friends for their unwavering guidance, encouragement, and support throughout this project.
This project would not have been possible without each of these individuals.