
The Silent 10 Project
Naqeeyah Karachiwala, Vasundhara Joshi
Sir Winston Churchill High School
Grade 11
Presentation
No video provided
Problem
Polycystic Ovary Syndrome (PCOS) is a common hormonal disorder that affects many women of reproductive age, yet it remains widely underdiagnosed. Research indicates that PCOS is associated with a combination of factors such as irregular menstrual cycles, hormonal imbalances, insulin resistance, and increased body mass index (BMI). However, these symptoms do not appear the same way in every individual, which makes diagnosis challenging. Many of the signs of PCOS also overlap with other health conditions, meaning that individuals may go years without a clear diagnosis or access to appropriate treatment. As a result, delayed diagnosis can increase the risk of long-term complications, including metabolic disorders and fertility-related issues. This highlights the need for tools that can help identify individuals who may be at higher risk earlier in the diagnostic process. The problem this project addresses is whether machine learning models can analyze existing clinical and lifestyle data to estimate PCOS risk and identify which factors play the most significant role in those predictions. By investigating this question, the project explores how data-driven approaches could support healthcare professionals in recognizing patterns associated with PCOS, while emphasizing that such models are intended to assist medical decision-making rather than replace clinical judgment.
Question: How do different machine learning models compare in their ability to predict PCOS risk, and what biological features are most influential in each model’s predictions?
Hypothesis: Random Forest models will outperform logistic regression in predicting PCOS risk because PCOS is influenced by multiple hormonal and metabolic factors that interact in complex, non-linear ways, which Random Forest models are better suited to capture than linear models.
Background Research:
PCOS Poly-Cystic Ovarian Syndrome
- Fluid-filled cysts develop on the outside of the ovary
- Cysts contain oocytes encapsulated by follicles that fail to release the gamete
- Excess amounts of androgen in the female body
- High results of androgen cause hirsutism ( excess facial/body hair and acne), in some cases male pattern baldness
- Cause is unknown
Factors that could affect the cause:
Insulin Resistance:
- If the body begins to resist the hormone insulin, your blood sugar increases, thus increasing insulin levels
- This increase in insulin can potentially cause your body to secrete an excess amount of androgen( male hormone)
- Causes difficulties with ovulation
- Signs of insulin resistance include dark patches of skin, larger appetite, and gaining weight
Low-grade inflammation
- WBC make a precipitate in response to an invasion of the body
- Called low-grade inflammation
- Females diagnosed with PCOS have long-term low-grade inflammation
- Also causes heart and vascular issues
Heredity
- Research has suggested that certain gene sequences could be directly related to PCOS
Diagnosed:
- Irregular periods
- Periods that are excessively long
- Larger ovaries that don't function normally ( Covered in cysts
Complications/Symptoms:
- Painful Periods
- Irregular periods
- Longer periods
- Painful Acne
- Fertility issues
- Common Miscarriages
- Eating disorders
- Hormonal imbalances such as anxiety and depression
- Sleep Apnea
- Obesity- Can worsen symptoms
- Possible result in diabetes mellitus
- Uterine Cancer
- Lack of ovulation leads to excessive estrogen secretion without balancing it out with progesterone - Causes the uterine lining to become abnormally thick( hyperplasia) Polycystic ovary syndrome (PCOS) - Symptoms and causes. (n.d.). Mayo Clinic. https://www.mayoclinic.org/diseases-conditions/pcos/symptoms-causes/syc-20353439
Treatment ( Current)
- Regular exercise
- Healthy, balanced diet
- Controlling Weight
- Prescribing Birth Control to manage painful periods and regulate one’s menstrual cycle
- Fertility medicine to help getting pregnant by increasing progesterone levels
- Managing insulin resistance
( Prescribing Metformin)
- Ovulation induction
( Prescribing clomiphene helps develop the eggs, Letrozole has a similar function) HealthPartners. (2025, October 31). Treatment options for polycystic ovary syndrome (PCOS) – from self-care to medications. HealthPartners Blog. https://www.healthpartners.com/blog/treatment-for-pcos/
- Prescribing spironolactone to reduce androgen levels in the body
Children’s Hospital Colorado. (2023). Spironolactone for PCOS symptoms. https://www.childrenscolorado.org/globalassets/departments/gynecology/informational-pdfs/options-for-managing-pcos-symptoms-spironolactone.pdf
- Hair removal for Body-Image and improving self-love and self-confidence through laser hair removal, waxing, plucking, epilating, and shaving
Polycystic Ovary Syndrome (PCOS) | HealthLink BC. (n.d.). https://www.healthlinkbc.ca/healthwise/polycystic-ovary-syndrome-pcos-0#:~:text=Regular%20exercise%2C%20healthy%20foods%2C%20and%20weight%20control,symptoms%20and%20help%20prevent%20long%2Dterm%20health%20problems. PCOS Pathway: Review your treatment, management, and prevention options. (n.d.). https://myhealth.alberta.ca/pcos-pathway/review-your-treatment-management-and-prevention-options
- Laparoscopic Ovarian Drilling:
- Minimally invasive procedure where a specialist uses a highly precise laser/cauterizer to destroy parts of the ovary - Destroys androgen-producing tissue in an attempt to restore hormonal balance Risks include: adhesions, scar tissue, internal bleeding Nayak, P., Agrawal, S., & Mitra, S. (2015). Laparoscopic ovarian drilling: An alternative but not the ultimate in the management of polycystic ovary syndrome. Journal of Natural Science Biology and Medicine, 6(1), 40. https://doi.org/10.4103/0976-9668.149076
Question: How can we use AI technology to determine PCOS risks?
Purpose:
Hypothesis: If AI technology is applied using a specifically coded algorithm, then a pattern of PCOS risk can be established therefore providing evidence as to what signs to look out for when determining reproductive health risks in women.
Background Research (go very in depth and provide me citations plz!) Menstrual Cycle
- Average Length: 28 Days, however cycles ranging from 21-35 days is still regular
- Most cycles are never 28 days due to stress, use of contraception, hormonal imbalances, and reproductive disorders
- Adolescent: Cycle can range from 20-45 days - Adult: Cycle can range from 25-38 days** Due to the decrease in hormone secretion over time Professional, C. C. M. (2025, December 8). Menstrual cycle. Cleveland Clinic. https://my.clevelandclinic.org/health/articles/10132-menstrual-cycle
Events that can also affect cycle length and period flow:
- Menarche- The first period a female has
- Perimenopause- As a female reaches menopause, her ovaries decrease in hormone secretion
- Postpartum/Pregnancy- Estrogen/Progesterone spikes and drops can drastically affect a woman’s cycle
- Miscarriage/Abortion- Can cause temporary changes in the menstrual cycle becuase the body needs to rebuild the endometrial lining and hormone levels need to return to pre-pregnancy levels
Msn, E. L., RN. (2025, April 29). Why is my menstrual cycle length changing? Why Is My Menstrual Cycle Length Changing? https://helloclue.com/articles/cycle-a-z/why-do-menstrual-cycles-vary#:~:text=Menstrual%20cycles%20naturally%20vary%2C%20and,when%20to%20seek%20medical%20advice
The contingencies to the length of a woman’s cycle will affect the length of each phase of the menstrual cycle:
Symptoms that may occur even before a woman gets her period Since estrogen and progesterone levels begin to drop approximately 10 days prior to flow phase, the following symptoms may occur
- Tender Breasts
- Mood Swings
- Acne
- Fluid Retention ( Bloating, Weight Gain, Feet Swelling)
- Anxiety
- Symptoms/feelings of depression
- Fatigue
Menstrual Cycle Basics – Your Period. (n.d.). https://www.yourperiod.ca/normal-periods/menstrual-cycle-basics/#:~:text=What%20is%20normal%20bleeding?,When%20am%20I%20ovulating?
All about periods (for teens). (n.d.). Nemours KidsHealth. https://kidshealth.org/en/teens/menstruation.html#:~:text=What%20Is%20PMS?,few%20days%20of%20a%20period .
-
Flow Phase ( Days 1-5)
-
Shedding of the endometrial layer of the uterus ( inner lining of the uterus)
- Women can bleed up to 8 days
- Bleeding occurs through vagina
- Heaviest bleeding usually occurs from days 1-2
- Symptoms include:
- Dysmenorrhea ( Cramps) - Usually Primary Dysmenorrhea\, starting from a woman’s first period and continuing on throughout her lifespan - Contractions of the uterus often coupled with nausea and headaches as a result of hormonal drop - Prostaglandins control the contractions of the uterus - Occurs in the abdomen\, but pain can also radiate down thighs\, and in the lower back - Tenderness of the breasts - Lower back pain - Unregulated Emotions - Mood Swings - Feelings of anxiety/and or depression Whelan, C. (2022, February 4). 10 signs your period is about to start. Healthline. https://www.healthline.com/health/womens-health/period-signs#what-is-a-normal-menstrual-cycl e
- Follicular Phase ( Days 1-13)
Not relevant to the harms or development of PCOS
-
Ovulation ( Day 14)
-
LH level is high ( luteinizing hormone)
-
Developed follicle bursts and releases the ovum
- Fimbriae sweep the ovum into the oviduct where the egg is viable for fertilization
- If egg is not fertilized, it will burrow into the endometrium and then the lining will shed during menstruation
A typical sign of ovulation is increased cervical mucus that resembles egg whites ( discharge becomes whiter and stretchier) Holesh, J. E., Bass, A. N., & Lord, M. (2023, May 1). Physiology, ovulation. StatPearls - NCBI Bookshelf. https://www.ncbi.nlm.nih.gov/books/NBK441996/
-
Luteal Phase( Day 15)
-
Empty follicle after release of ovum develops corpus luteum
- Secretes estrogen and progesterone ( thickens endometrial lining and maintains thickness)
- If egg is fertilized, corpus luteum eventually becomes placenta
- If no fertilization occurs, then corpus luteum degenerates and hormone levels drop, transitioning back into flow phase
- Corpus Luteum gives uterus time to rebuild the endometrial lining, because if an egg is fertilized, the endometrium needs to be thick enough to sustain the development of the zygote in the early stages of fetal growth before it divides down into the uterus
- If it degenerates too quickly, it could affect health of endometrium
Typical signs of the luteal phase: - Increased basal body temperature - Cervical Mucus becomes thick and pasty Professional, C. C. M. (2026, January 30). Luteal phase. Cleveland Clinic. https://my.clevelandclinic.org/health/articles/24417-luteal-phase

- Estrogen is the one hormone that is prevalent during the entire menstrual cycle, it peaks during the follicular phase as well as the luteal phase
- Estrogen reduces the release of FSH and increases the production of LH towards the end of the follicular phase\, as well as thickens the endometrium
- Majority of the female receptors for estrogen are in the ovaries and uterus, but there are estrogen receptors all over the female body
Main Reproductive Structures
Ovaries
- Female gonad
- Produce, release, and regulate estrogen and progesterone
- Houses the ova and provides nourishment for each ovum;s fluid’filled sac called the follicle until it is ready to be swept into the oviduct
- Follicle comprised of somatic cells: Granulosa ( support growth and development) and Theca ( provide structural support) cells
The ovaries. (n.d.). https://www.macmillan.org.uk/cancer-information-and-support/ovarian-cancer/the-ovaries NCI Dictionary of Cancer Terms. (n.d.). Cancer.gov. https://www.cancer.gov/publications/dictionaries/cancer-terms/def/ovary
Oviduct
- Site of fertilization
- Moves fertilized zygote towards uterus
- Sperm travels up to oviduct to reach ovum
- Additional cells provide nutrients to the ovum through the oviductal fluid
- Divided into sections
Bastos, N. M., Ferst, J. G., Goulart, R. S., & Da Silveira, J. C. (2022). The role of the oviduct and extracellular vesicles during early embryo development in bovine. Animal Reproduction, 19(1), e20220015. https://doi.org/10.1590/1984-3143-ar2022-0015 Uterus
- Site of implantation
- Site of main fetal development
- Also known as the womb
- Is a barrier against infection
- Has reverse peristalsis during parturition
- Expands to accommodate growth
- Manages the monthly menstrual cycle by acting as a target organ for hormonal stimulus
Normal menstrual cycle. (n.d.). https://myhealth.alberta.ca/Health/pages/conditions.aspx?hwid=tn9930#:~:text=Estrogen%20builds%20up%20the%20lining,is%20when%20your%20period%20starts.
Endometrium
- Lining that is shed every month during flow phase when estrogen and progesterone levels drop
- During pregnancy, endometrial lining has to be thick to support placenta
- Placenta burrows into lining to attach to the umbilical cord
- Endometrium also acts as a site for the ovum to burrow into and shed if not fertilized
- Can get up to 18 mm thick
Endometrium. (n.d.). https://myhealth.alberta.ca/Health/pages/conditions.aspx?hwid=ste122117&
Vagina
- Site for parturition, intercourse, and menstrual bleeding
- Acidic ( has a low ph), can destroy sperm as it enters through the vagina
( semen has an alkaline buffer to protect) Du Cancer, C. C. S. /. S. C. (n.d.). The vagina. Canadian Cancer Society. https://cdn.cancer.ca/en/cancer-information/cancer-types/vaginal/what-is-vaginal-cancer/the-vagina
Cervix
- Produces mucus to protect the uterus from bacteria
- As a first line of defense against infection
- Acts as a barrier so fetus stays inside the womb during pregnancy
- Contractions begin when the fetus’s head presses on the cervix
- Opens into the vagina for parturition
Professional, C. C. M. (2026b, February 3). Cervix. Cleveland Clinic. https://my.clevelandclinic.org/health/body/23279-cervix
Fimbraie
- Structure that sweeps ovum into oviduct
- Thin finger-like projections
- During ovulation, these projections contract closer to the ovaries
- Cells are referred to as cilia
Professional, C. C. M. (2026a, January 30). Fimbriae. Cleveland Clinic. https://my.clevelandclinic.org/health/body/24346-fimbriae
Method
Materials:
- Computer or laptop
- Stable Wi-Fi / internet access
- Python programming language (downloaded from python.org)
- IntelliJ IDEA (Integrated Development Environment)
- PCOS dataset downloaded from Kaggle
Procedure:
1. Installing Python
- Python was downloaded from python.org in order to run data analysis and machine learning libraries required for this project.
- Python was installed successfully and verified by running a test script to confirm that the interpreter worked correctly.
2. Installing and Setting Up IntelliJ IDEA
- IntelliJ IDEA was downloaded and installed to serve as the Integrated Development Environment (IDE) for writing and running the Python program.
- Python support was enabled in IntelliJ so that Python files could be created, edited, and executed inside the IDE.
- A new project directory was created in IntelliJ to store both the Python script and the dataset file.
3. Downloading the Dataset
- A Polycystic Ovary Syndrome (PCOS) dataset was downloaded from Kaggle, a public platform that hosts real-world datasets used in medical and data science research.
- The dataset file, named
PCOS_extended_dataset.csv, was placed inside the project folder so that it could be accessed directly by the Python code.
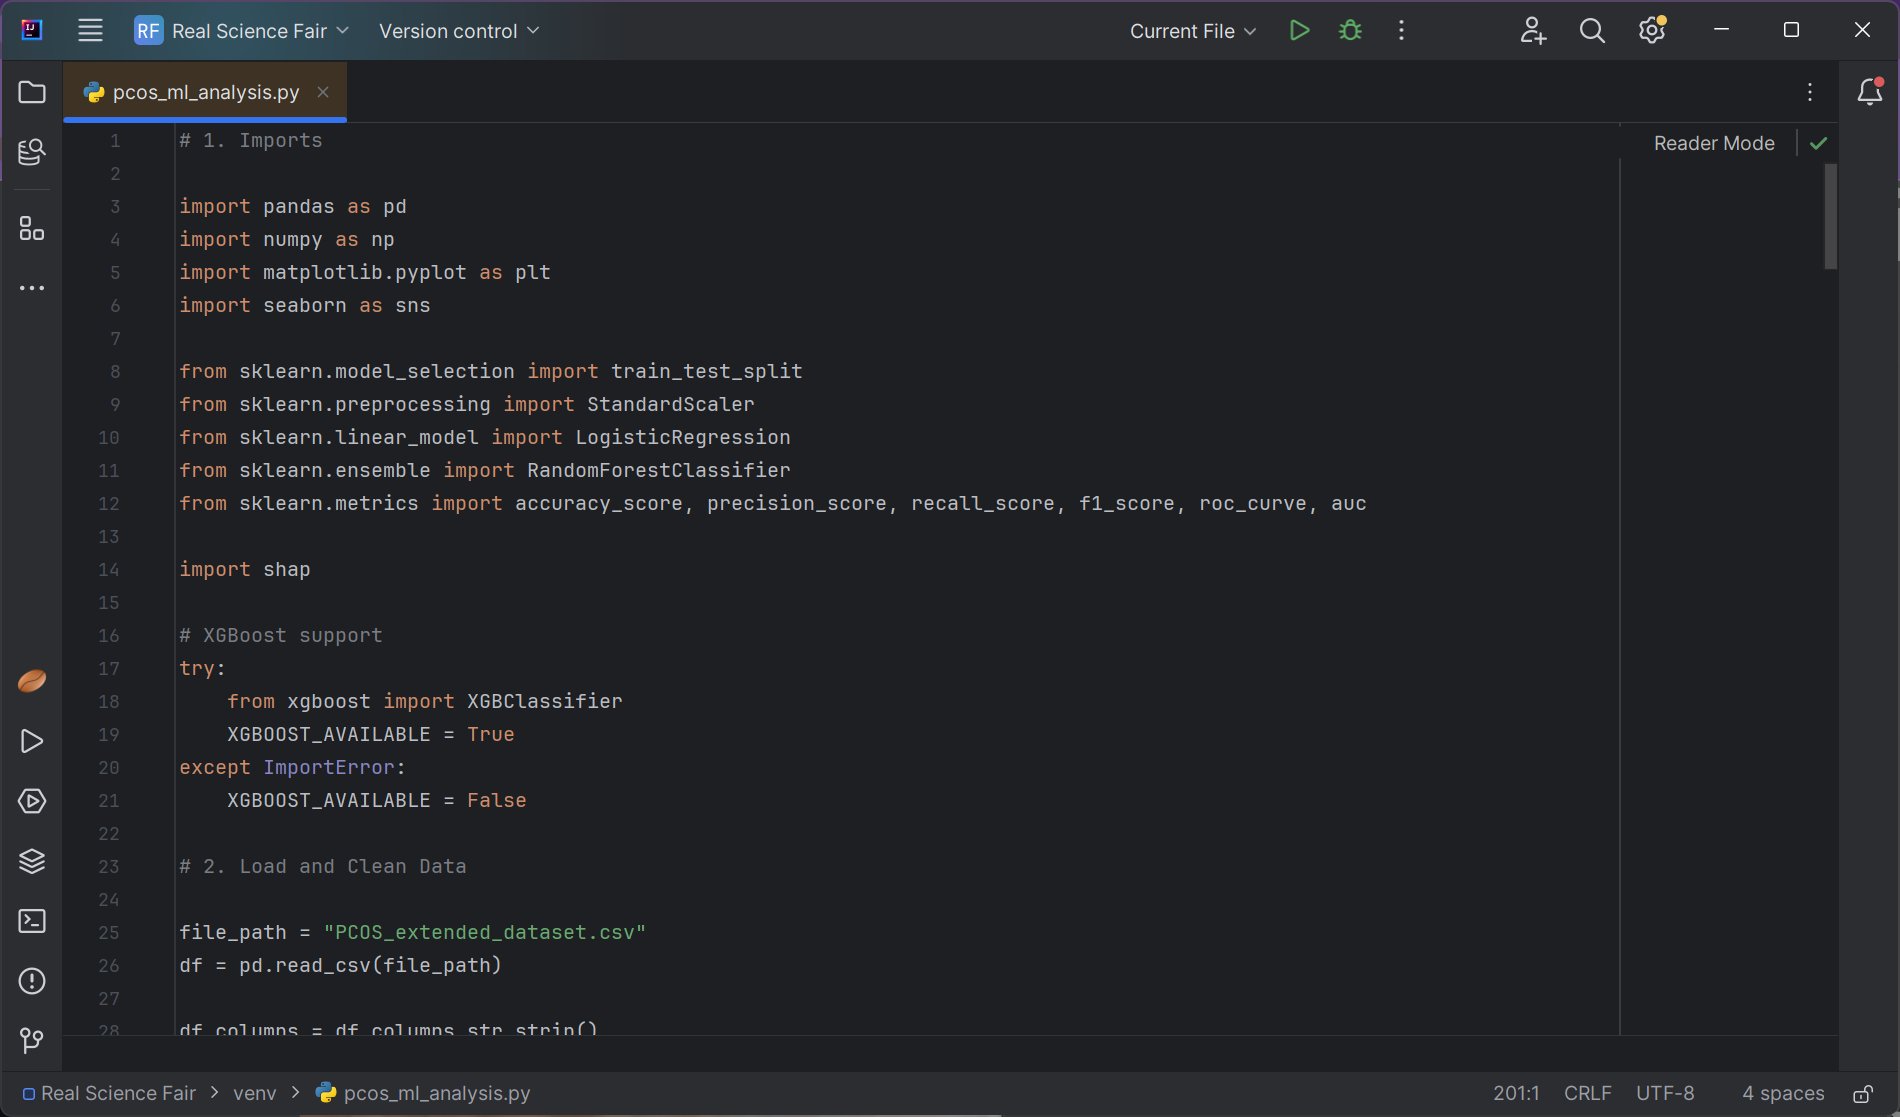
4. Importing Required Python Libraries
- Python libraries were imported to handle data processing, visualization, machine learning, and model explainability.
- The
pandasandnumpylibraries were imported to load and manipulate numerical data. - The
matplotlibandseabornlibraries were imported to create graphs. - The
scikit-learnlibrary was imported to train and evaluate machine learning models. - The
SHAPlibrary was imported to explain how different features influenced predictions.
import pandas as pd
import numpy as np
import matplotlib.pyplot as plt
import seaborn as sns
5. Loading the Dataset
- The dataset was loaded into Python using the
read_csvfunction. - This step converted the CSV file into a structured DataFrame that could be analyzed programmatically.
df = pd.read_csv("PCOS_extended_dataset.csv")
6. Cleaning Column Names
- Extra spaces were removed from column names to prevent referencing errors later in the code.
- This ensured consistent formatting across all column headers.
df.columns = df.columns.str.strip()
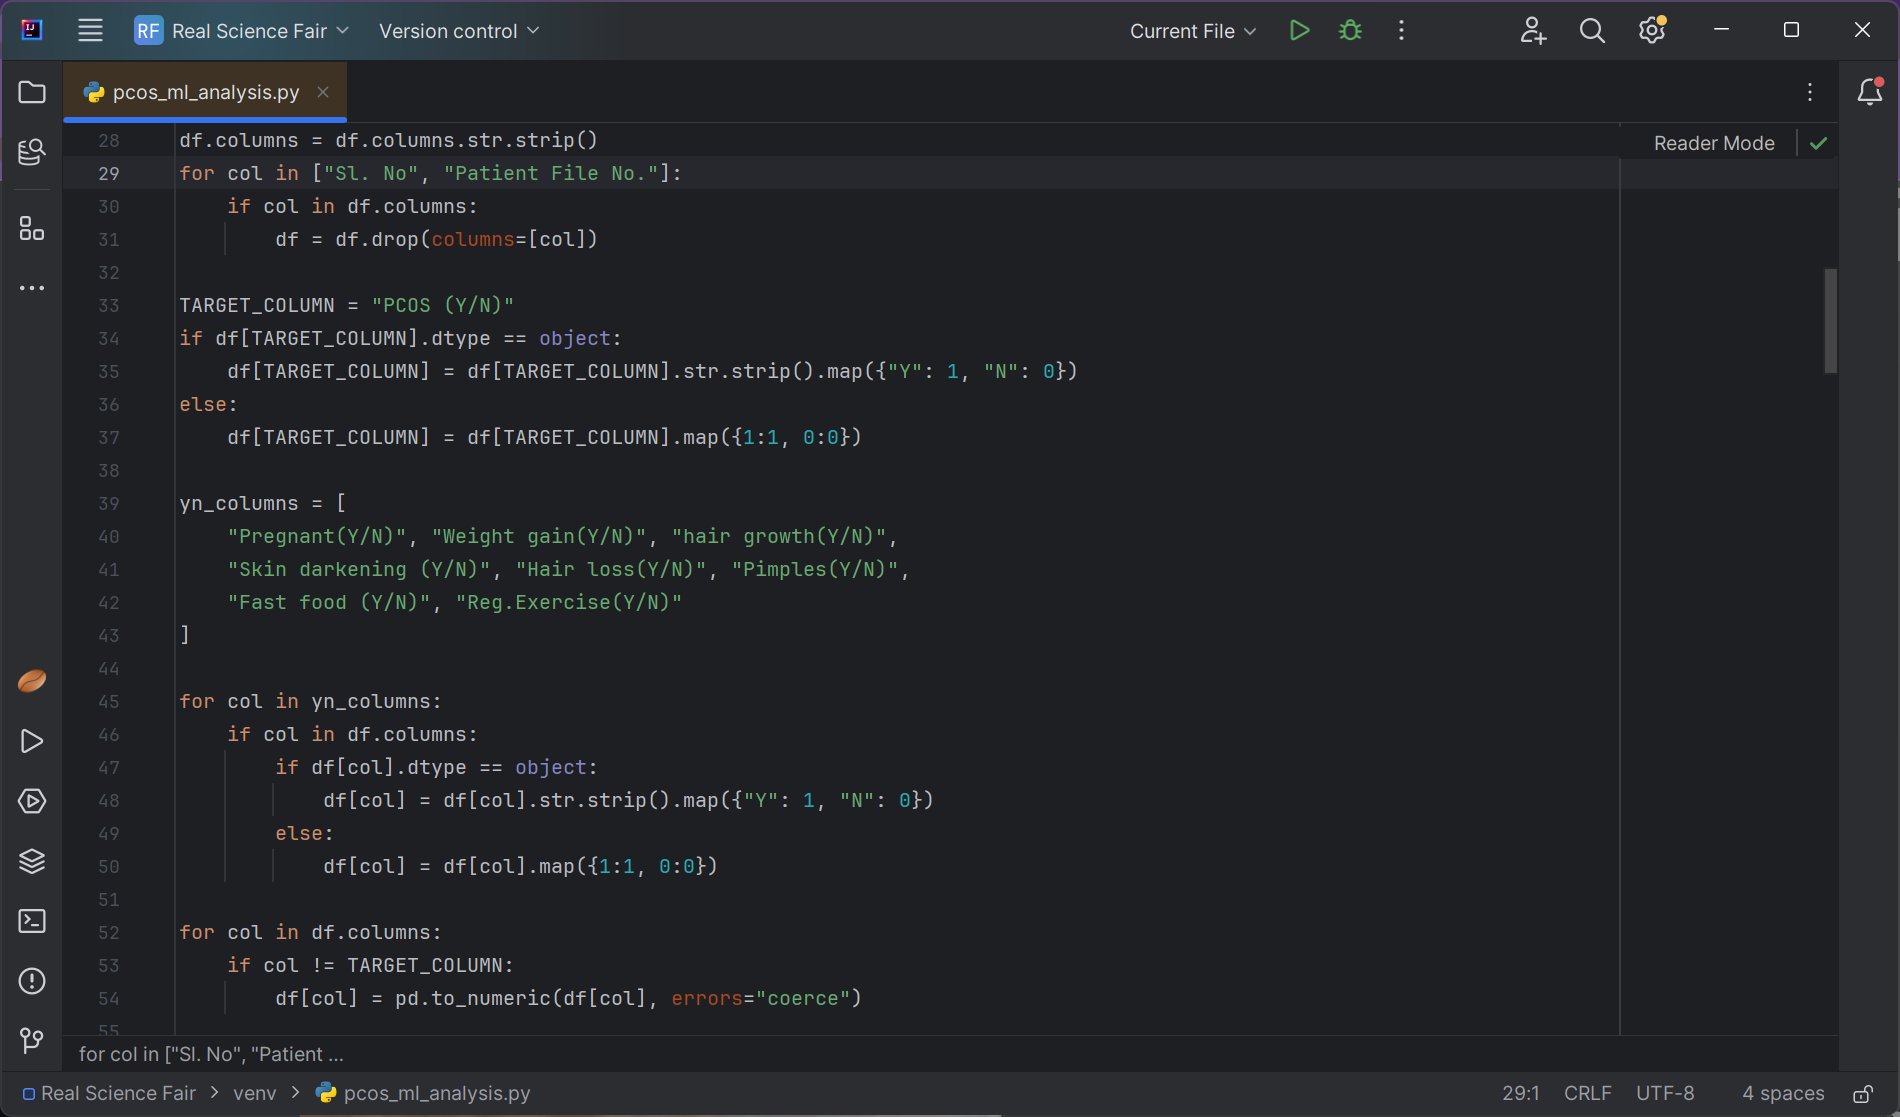
7. Removing Irrelevant Identifier Columns
- Columns containing serial numbers and patient file numbers were removed because they do not contribute to predicting PCOS.
- Removing these columns prevented the model from learning patterns unrelated to medical data.
df = df.drop(columns=["Sl. No", "Patient File No."])
8. Encoding the Target Variable
- The target variable
"PCOS (Y/N)"was identified as the output the model would predict. - All text values were converted into numerical values so the model could process them.
df["PCOS (Y/N)"] = df["PCOS (Y/N)"].map({"Y": 1, "N": 0})
9. Encoding Yes/No Symptom Features
- Symptom-based features such as weight gain, hair growth, and acne were converted from “Yes” and “No” into
1and0. - This conversion allowed these features to be treated as numerical inputs.
df["Weight gain(Y/N)"] = df["Weight gain(Y/N)"].map({"Y": 1, "N": 0})
10. Converting All Features to Numeric Format
- All feature columns were forced into numeric format.
- Any values that could not be converted were marked as missing values.
df[col] = pd.to_numeric(df[col], errors="coerce")
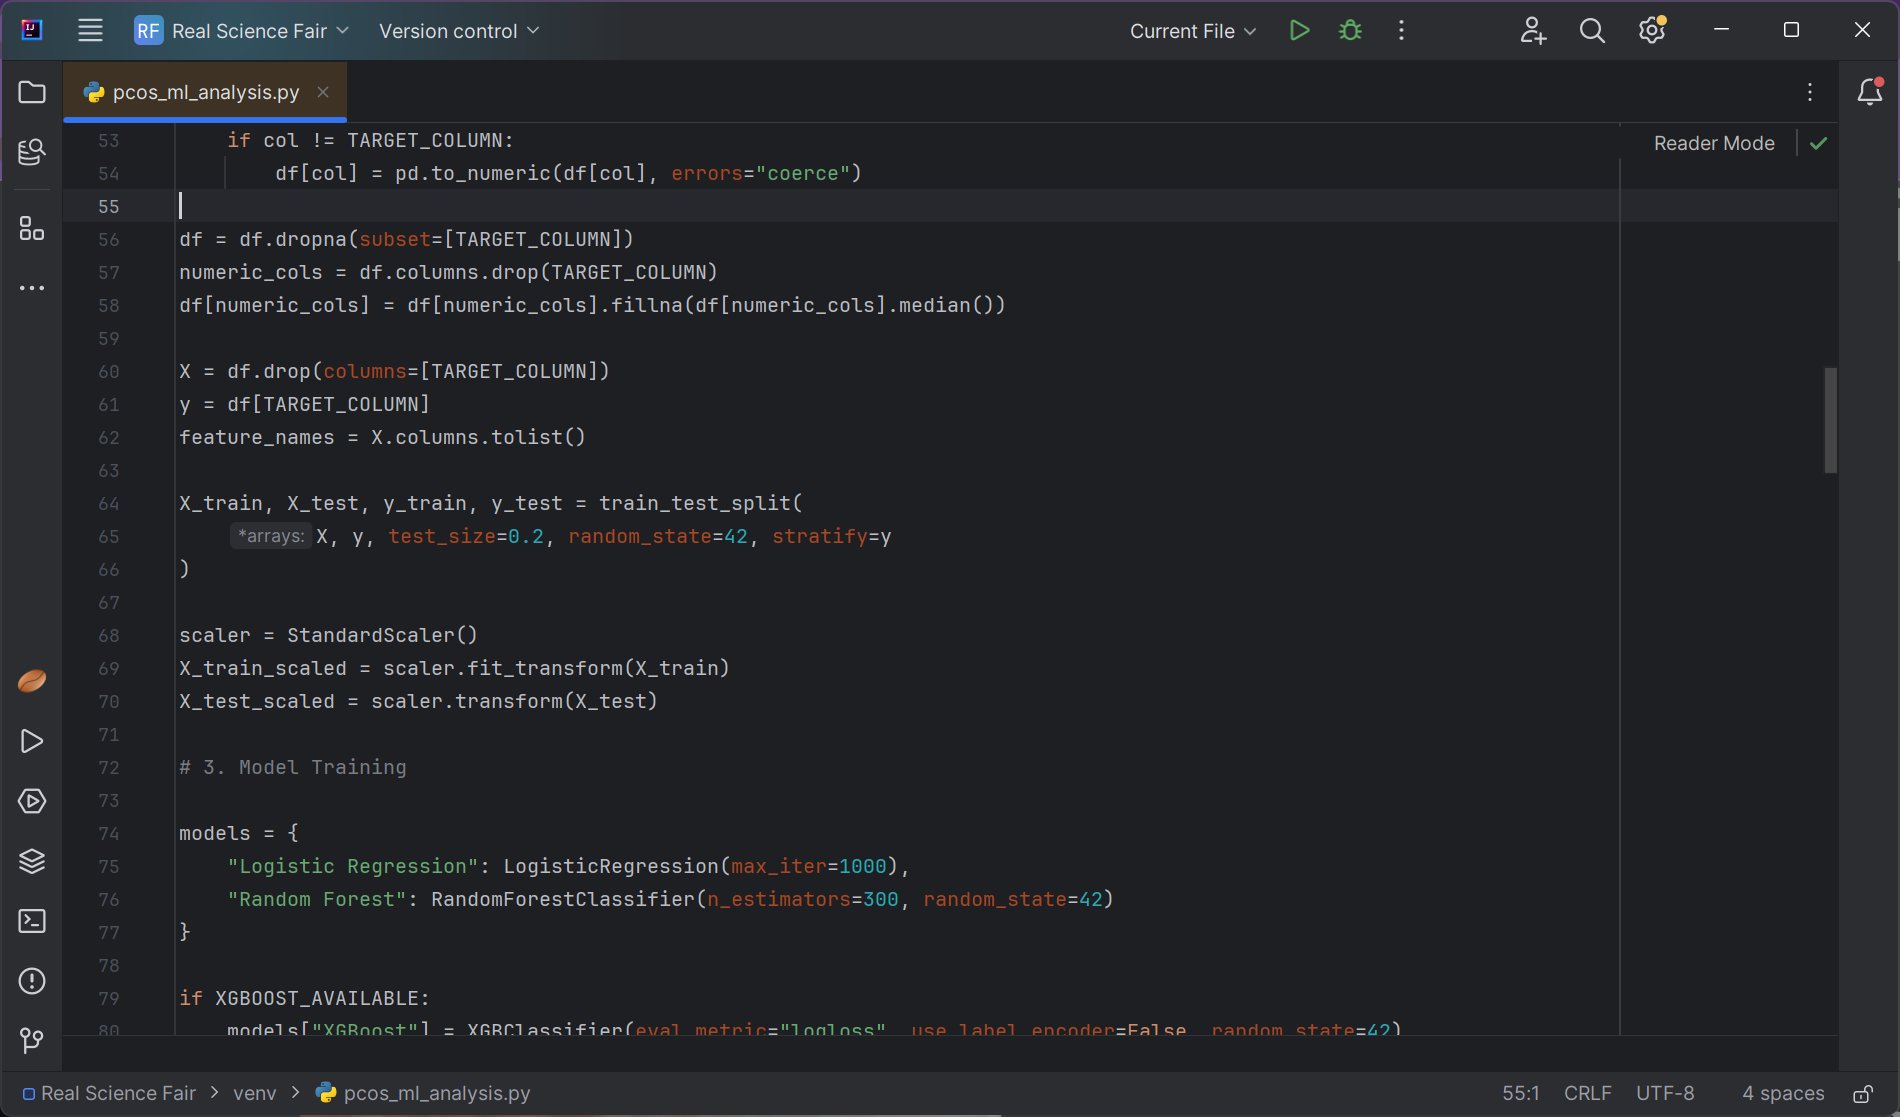
11. Handling Missing Data
- Rows missing a PCOS diagnosis were removed to avoid incorrect labeling.
- Missing values in feature columns were replaced with the median value of that feature.
df = df.dropna(subset=["PCOS (Y/N)"])
df = df.fillna(df.median())
12. Separating Features and Labels
- All medical and lifestyle variables were separated into an input feature matrix.
- The PCOS diagnosis column was separated into an output label vector.
X = df.drop(columns=["PCOS (Y/N)"])
y = df["PCOS (Y/N)"]
13. Splitting the Dataset into Training and Testing Sets
- The dataset was split so that 80% was used for training and 20% was reserved for testing.
- Stratified sampling ensured both sets contained similar PCOS proportions.
from sklearn.model_selection import train_test_split
X_train, X_test, y_train, y_test = train_test_split(
    X, y, test_size=0.2, stratify=y, random_state=42
)
14. Scaling the Data for Logistic Regression
- Feature scaling was applied to standardize all values to the same range.
- Scaling was applied only for Logistic Regression because it is sensitive to feature magnitude.
from sklearn.preprocessing import StandardScaler
scaler = StandardScaler()
X_train_scaled = scaler.fit_transform(X_train)
X_test_scaled = scaler.transform(X_test)
15. Initializing Machine Learning Models
- A Logistic Regression model was initialized as a baseline model.
- A Random Forest model was initialized to capture complex, non-linear patterns.
- An XGBoost model was optionally initialized if available.
LogisticRegression(max_iter=1000)
RandomForestClassifier(n_estimators=300)
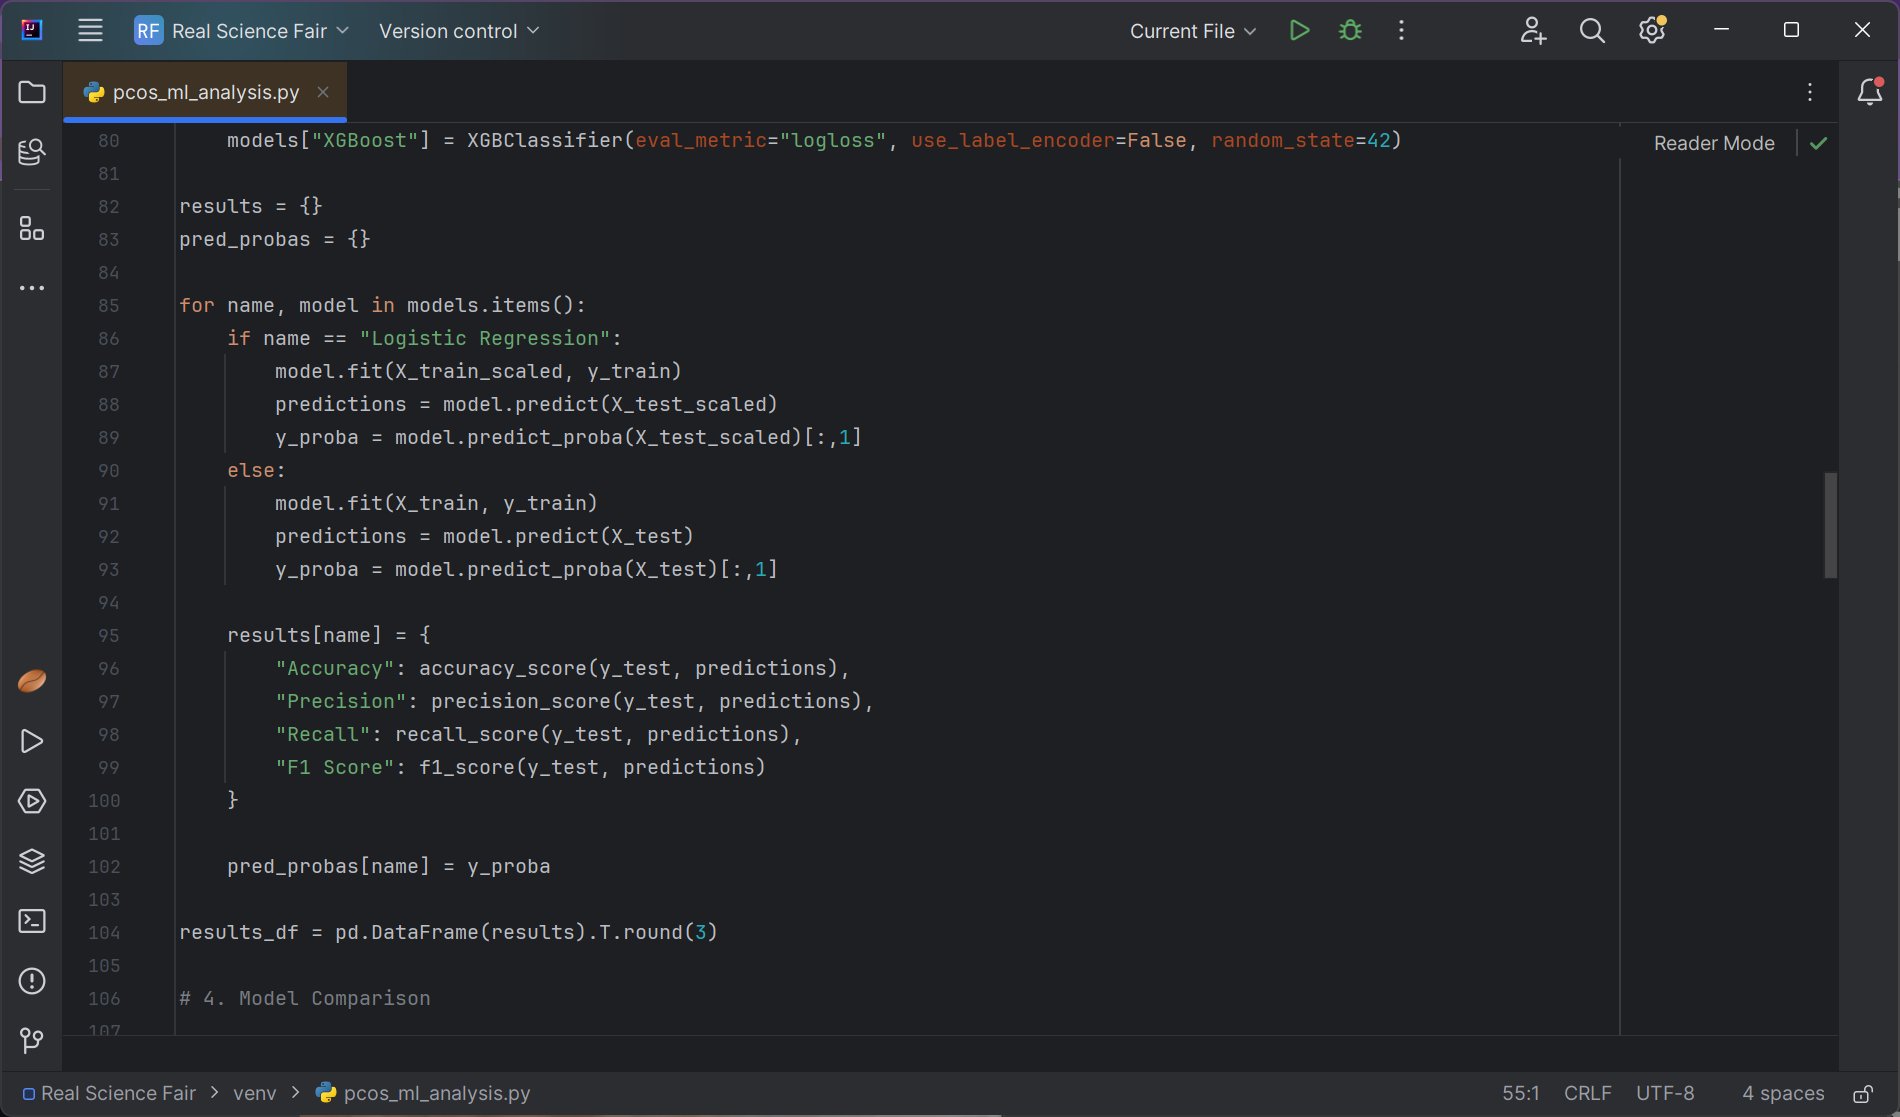
16. Training the Machine Learning Models
- Each model was trained using the training dataset.
- Logistic Regression used scaled data, while Random Forest used unscaled data.
model.fit(X_train, y_train)
17. Generating Predictions and Probabilities
- Each model predicted PCOS classifications for the test dataset.
- Each model also predicted probabilities indicating PCOS risk.
predictions = model.predict(X_test)
probabilities = model.predict_proba(X_test)[:, 1]
18. Evaluating Model Performance
- Model performance was measured using Accuracy, Precision, Recall, and F1 Score.
- These metrics compared predicted results to actual diagnoses.
accuracy_score(y_test, predictions)
f1_score(y_test, predictions)
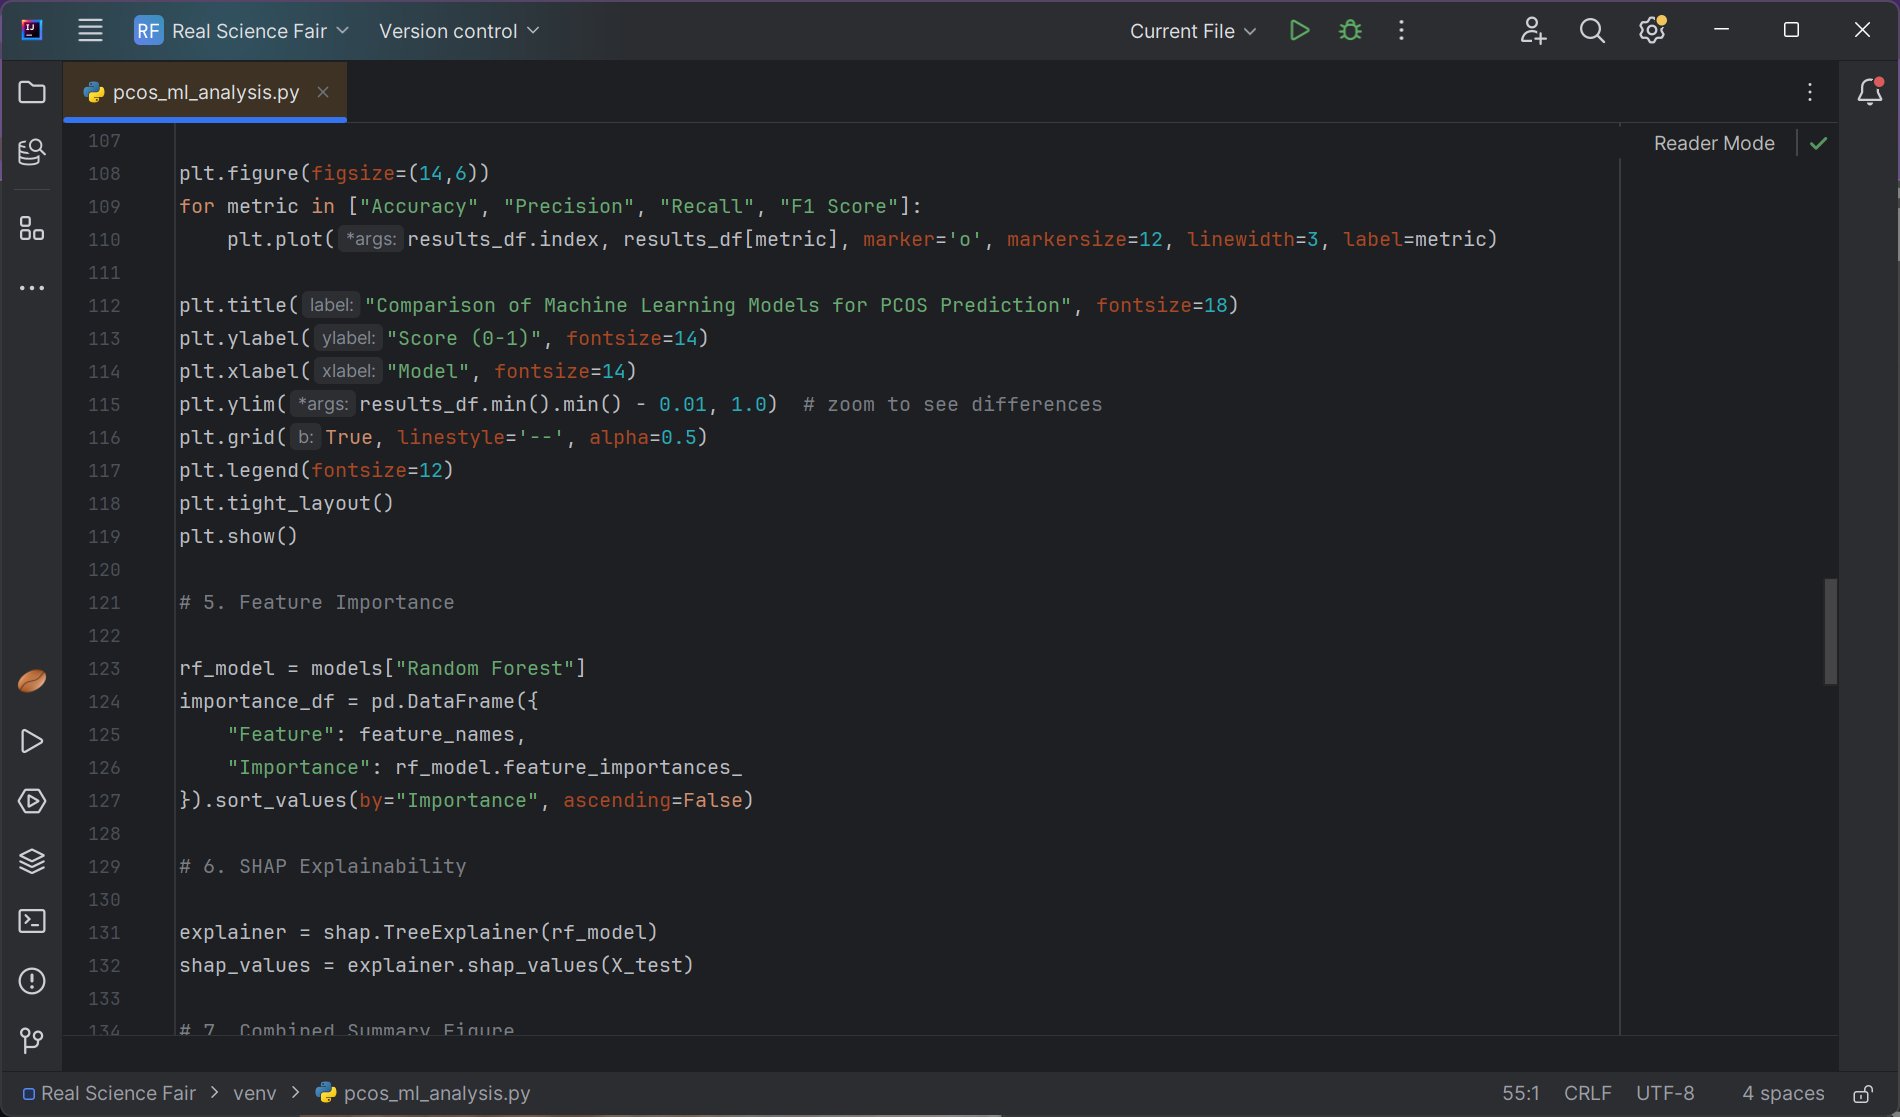
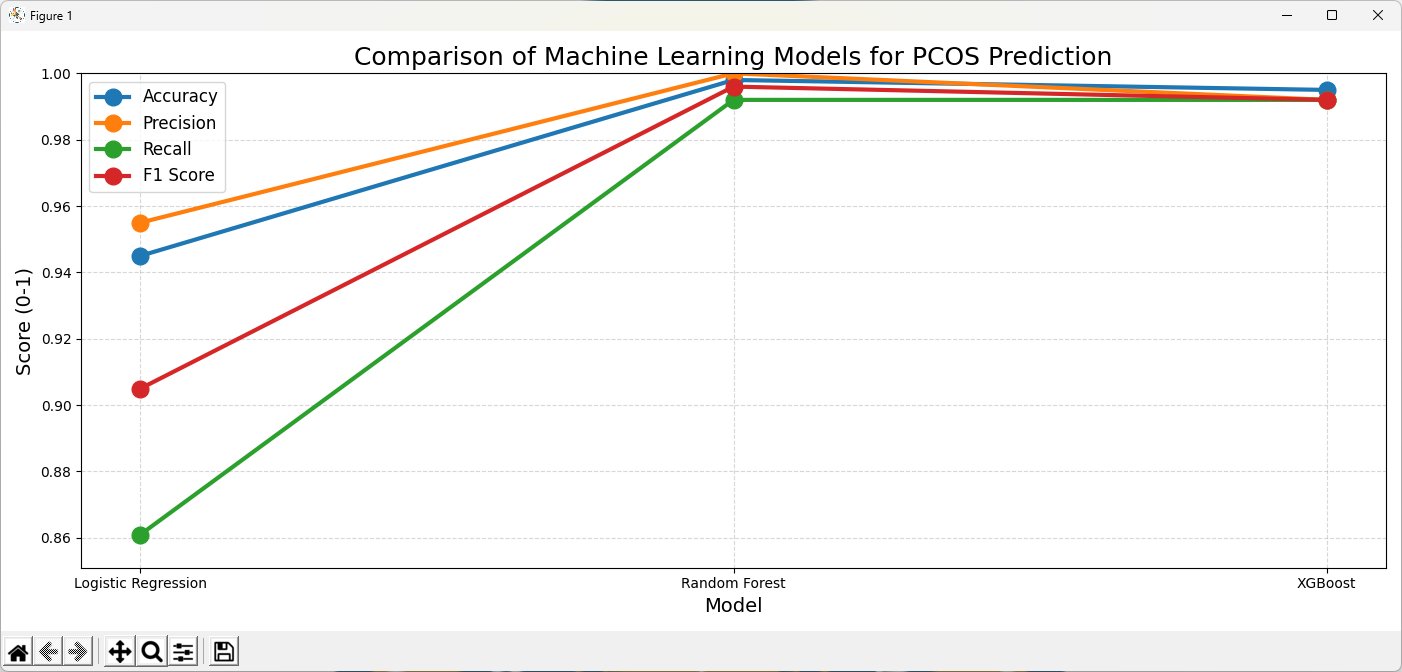
19. Comparing Models Using a Line Graph
- A line graph was created to visually compare model performance across metrics.
- This graph helped identify the best-performing model.
plt.plot(results_df.index, results_df["F1 Score"])
20. Extracting Feature Importance
- Feature importance scores were extracted from the Random Forest model.
- These scores ranked which features influenced predictions the most.
rf_model.feature_importances_
21. Explaining Predictions Using SHAP
- SHAP values were calculated to explain how each feature contributed to predictions.
- This increased transparency and trust in the model.
explainer = shap.TreeExplainer(rf_model)
shap_values = explainer.shap_values(X_test)
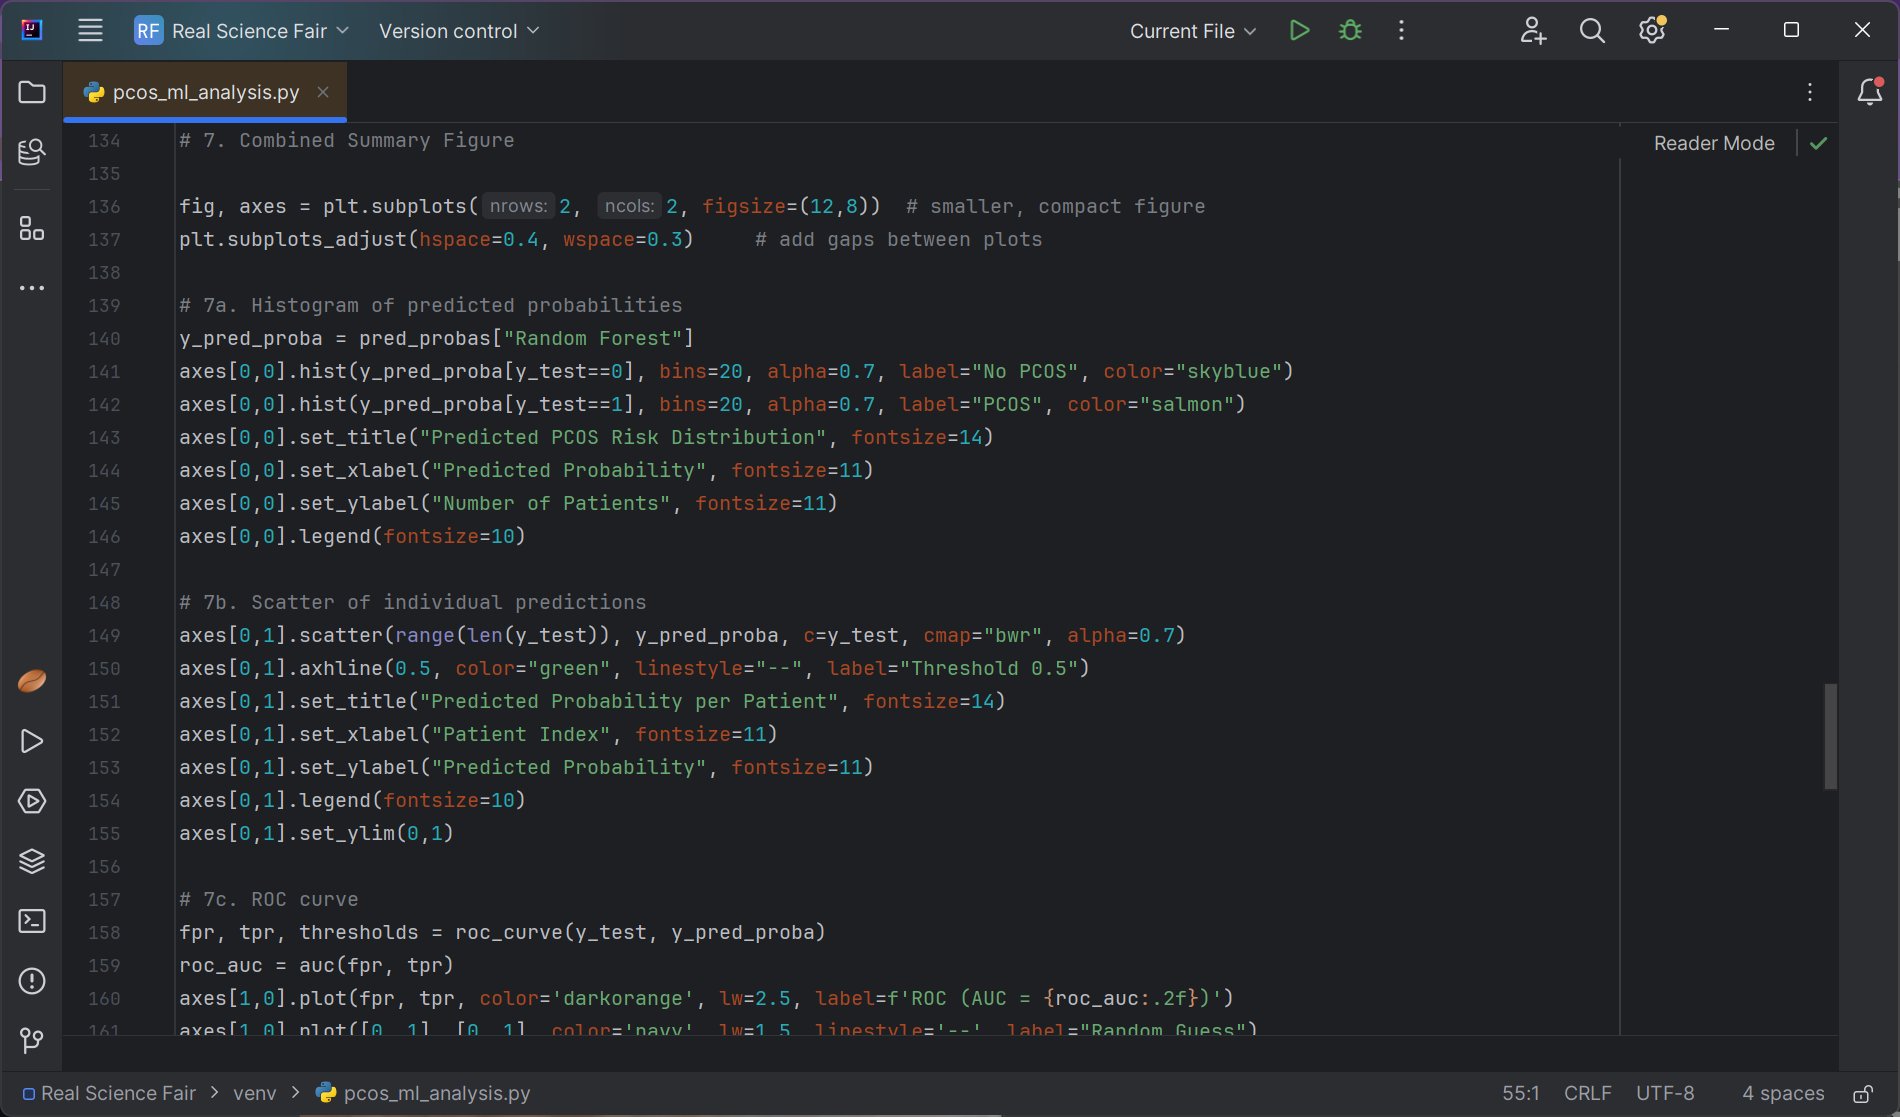
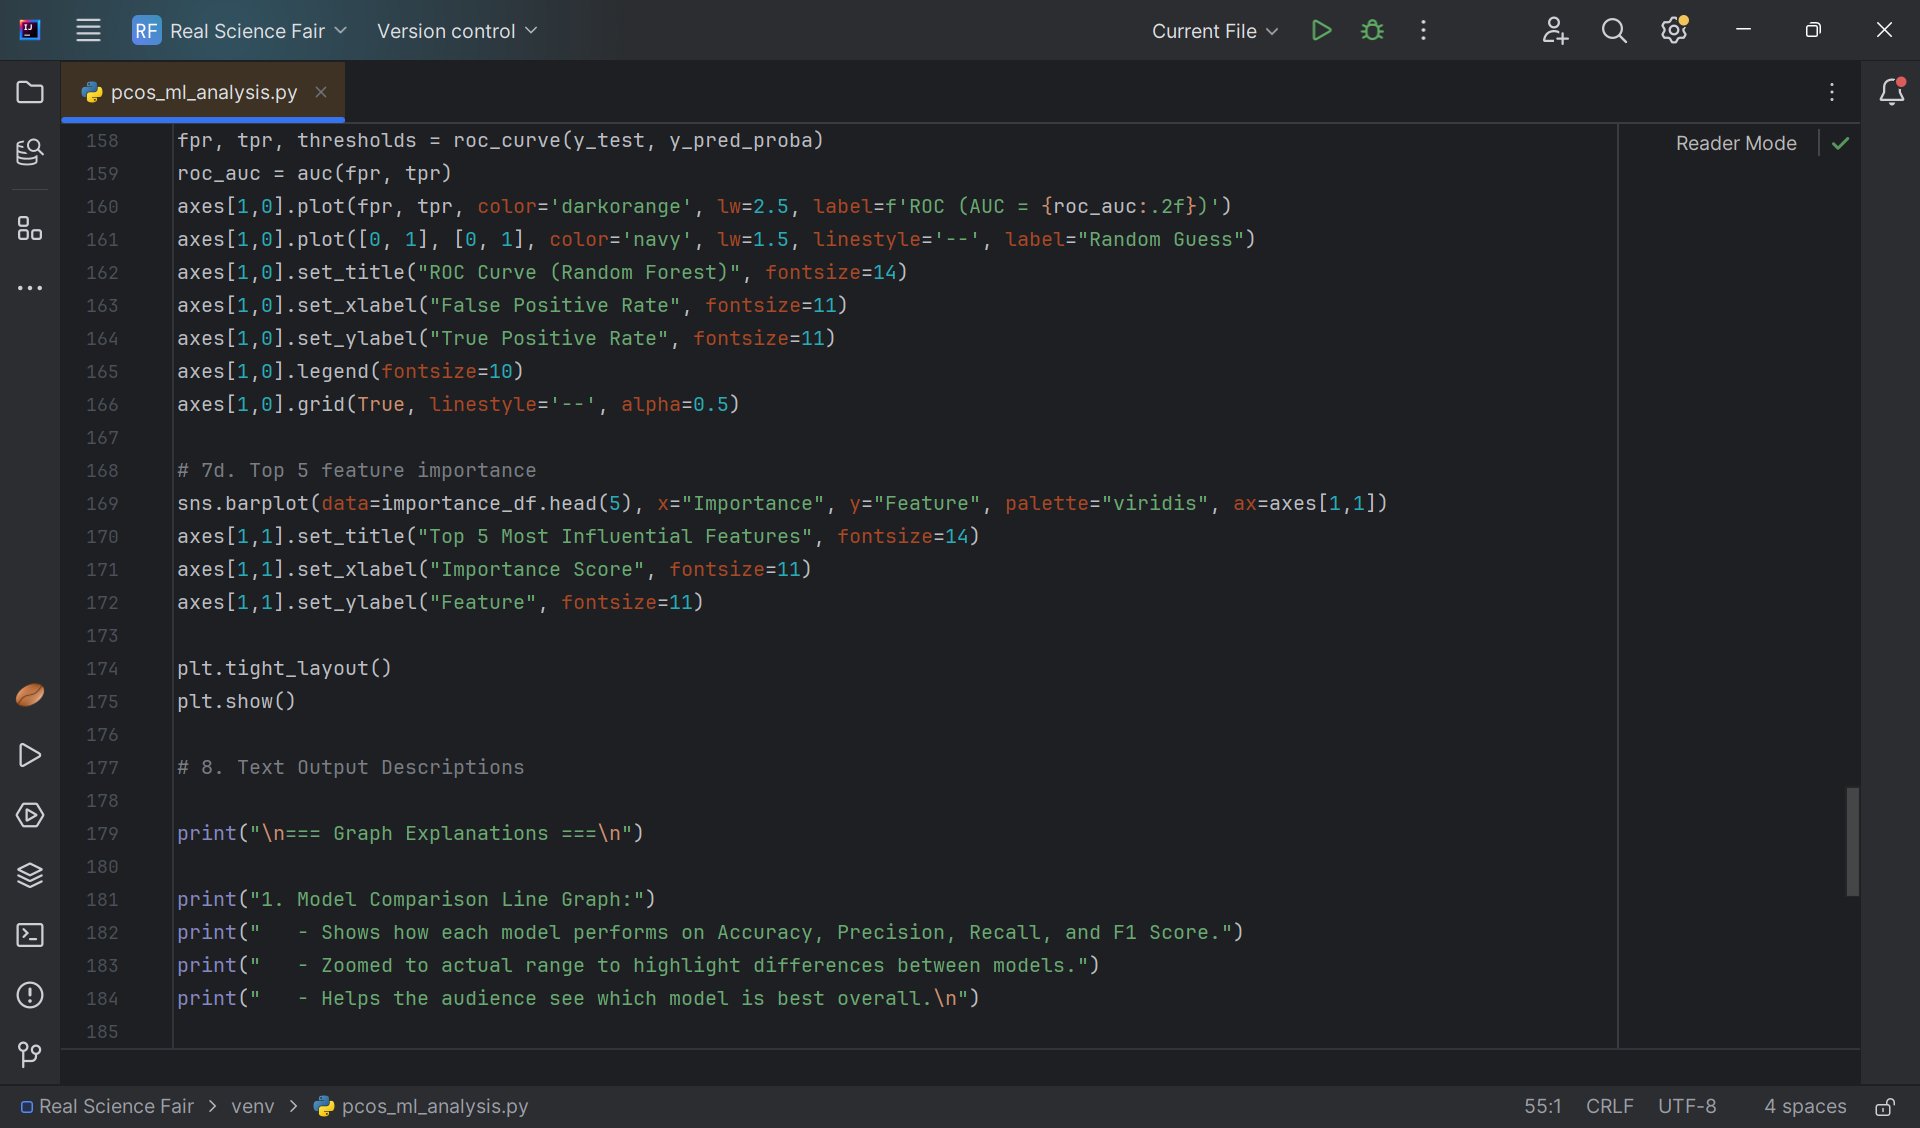
22. Creating Audience-Friendly Visualizations
- Histograms were created to show predicted PCOS risk distributions.
- Scatter plots were used to show individual patient predictions.
- ROC curves were generated to measure classification performance.
- Bar charts were created to display the most influential features.
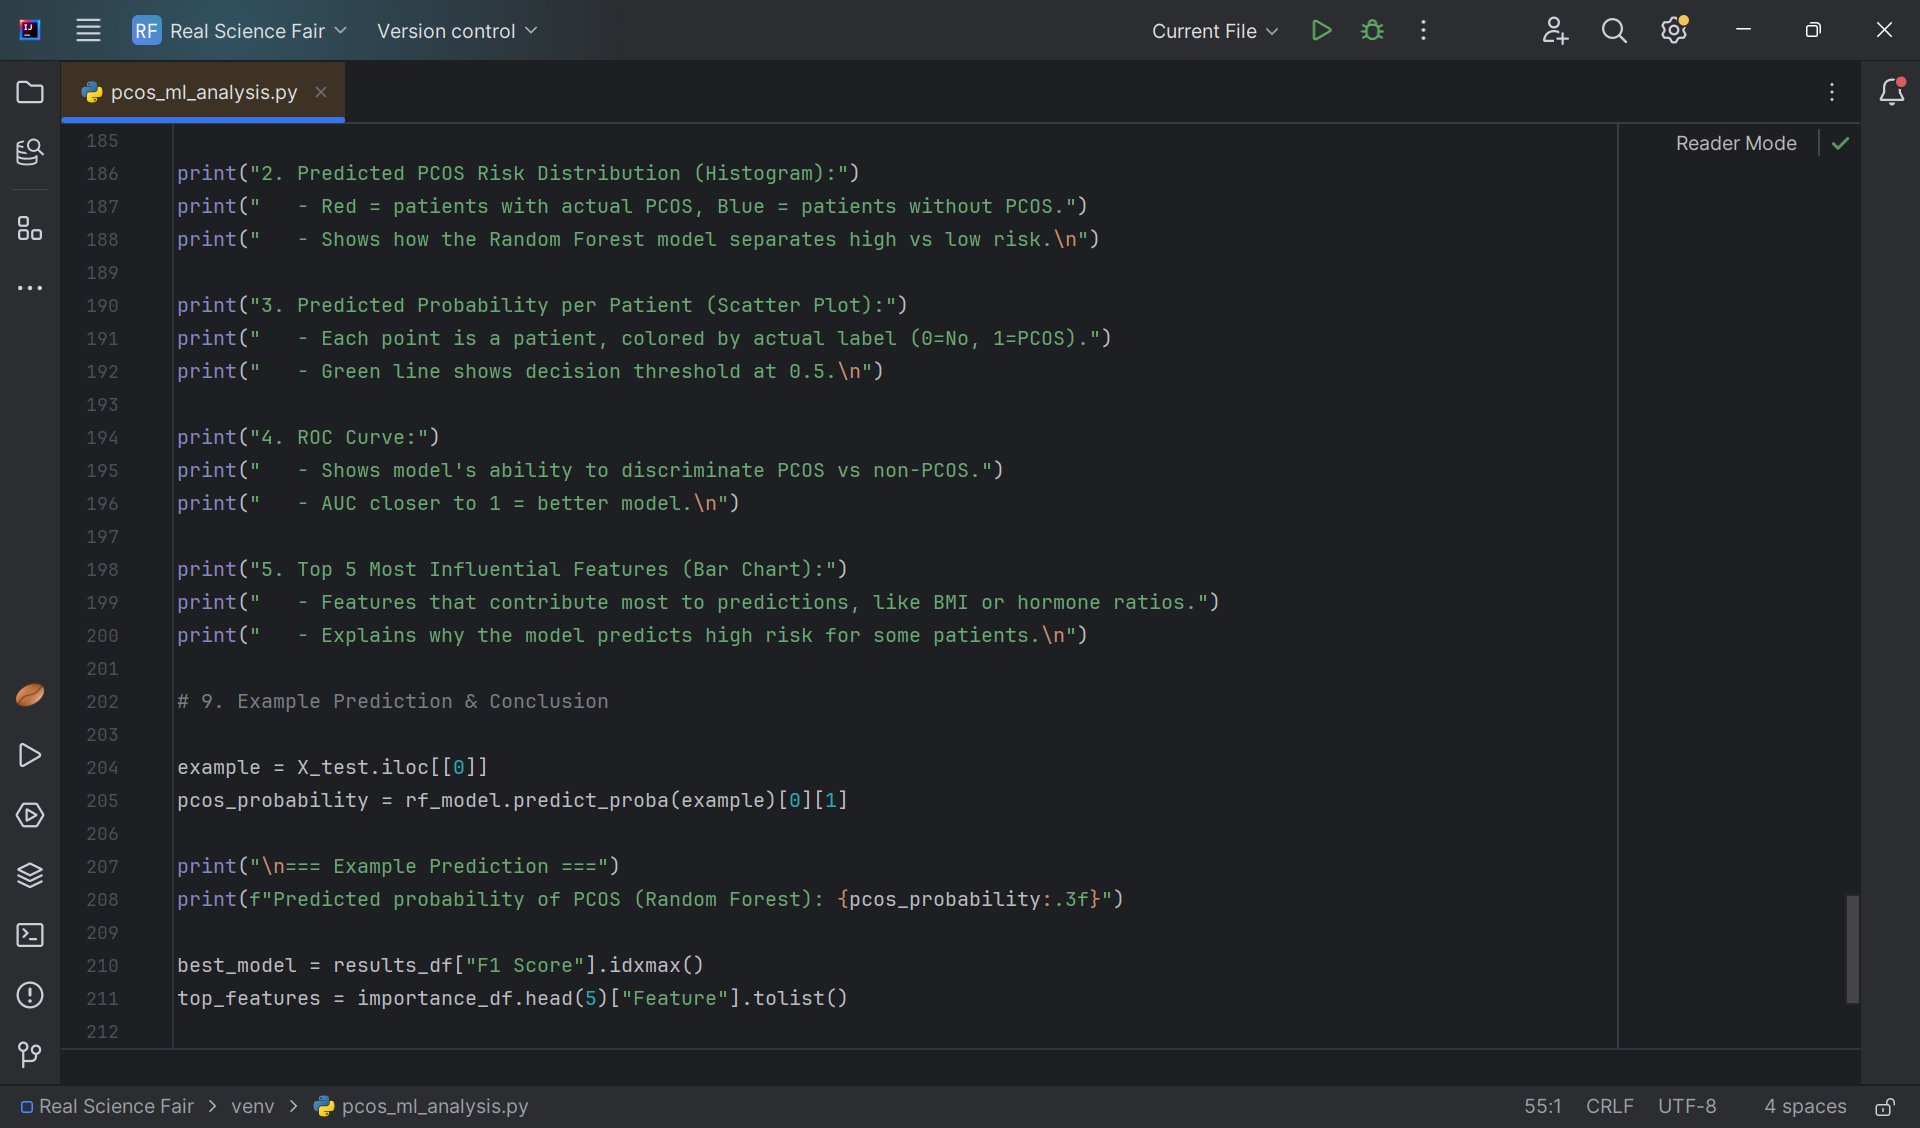
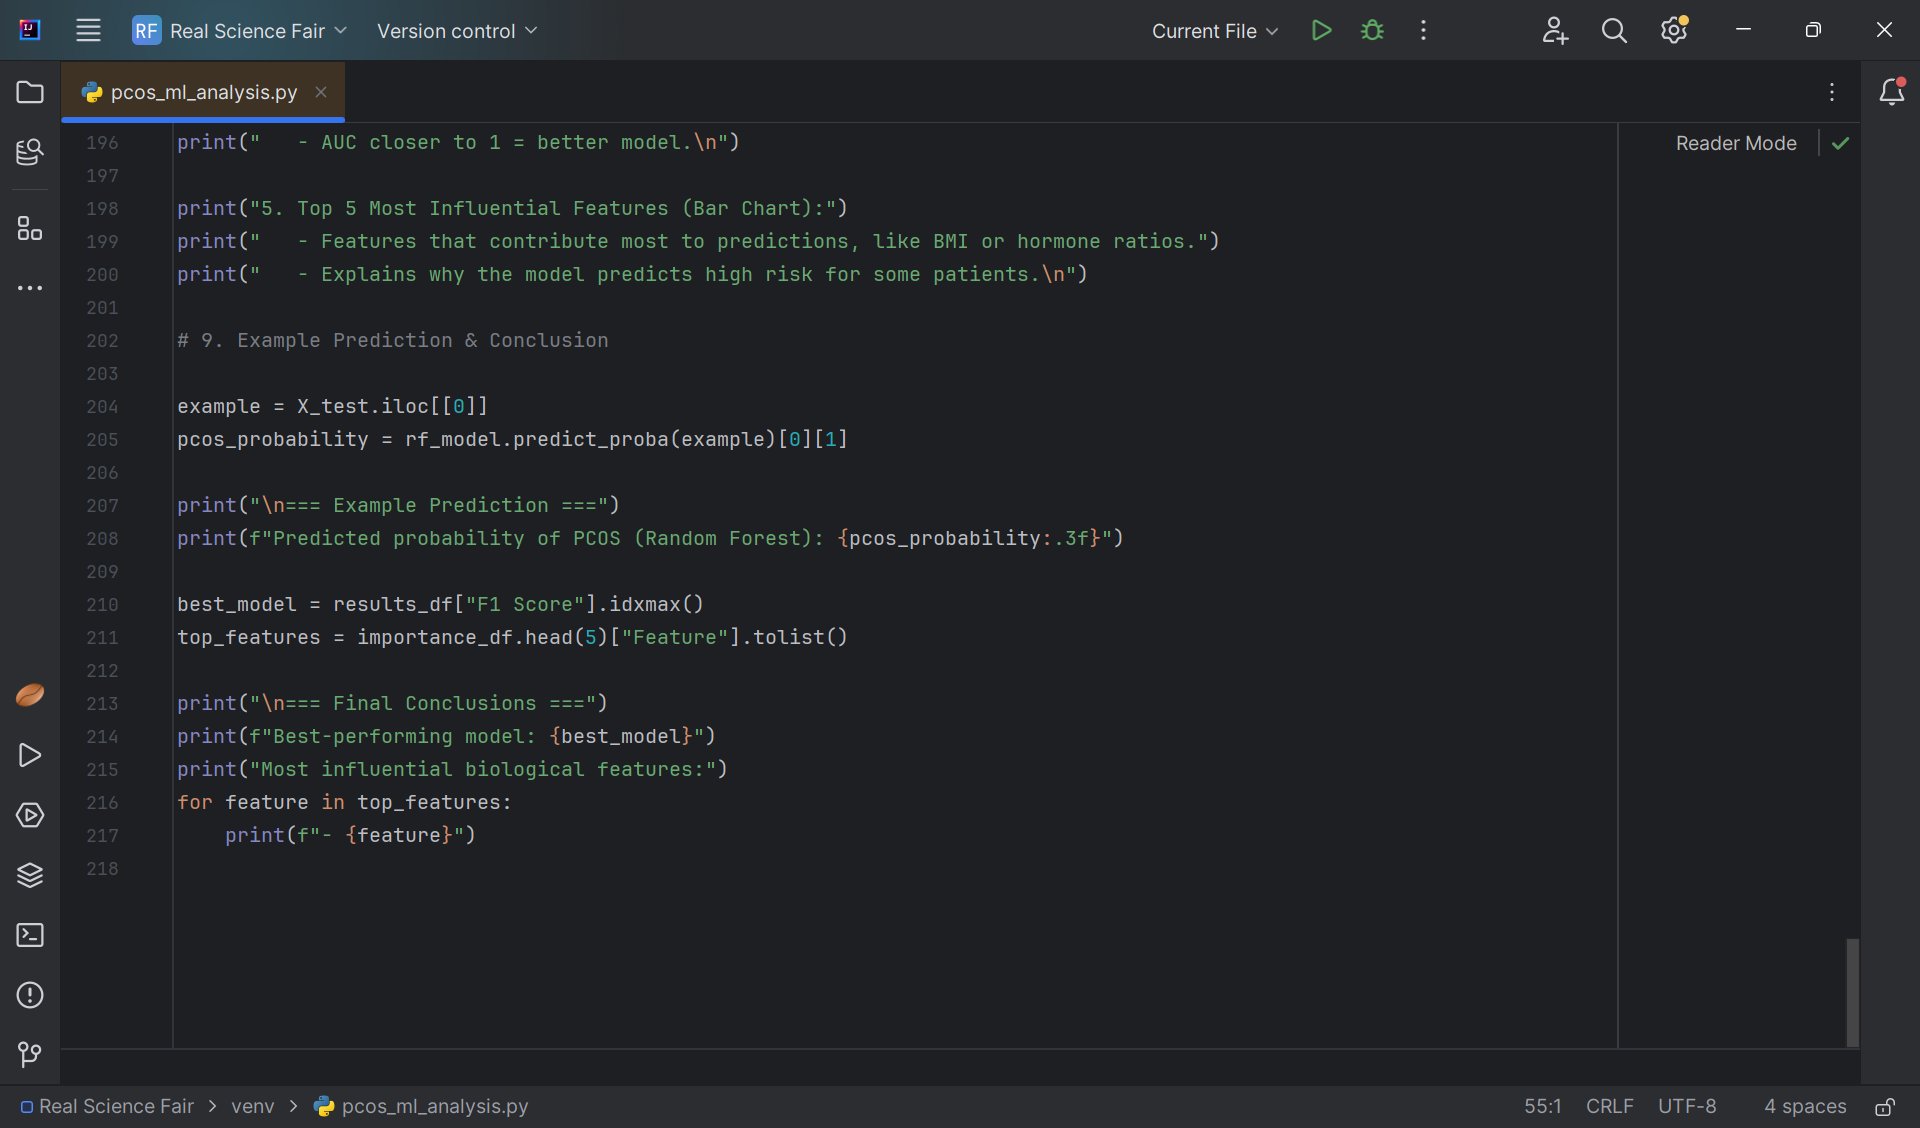
23. Making an Example Prediction
- One patient was selected from the test dataset.
- The model calculated the probability that this patient has PCOS.
example = X_test.iloc[[0]]
rf_model.predict_proba(example)[0][1]
24. Selecting the Best-Performing Model
- The model with the highest F1 Score was selected as the final model.
- The most influential biological features contributing to PCOS risk were reported.
Summary of the code:
This program reads a real PCOS dataset and converts all medical and lifestyle information into numerical values that machine learning models can understand. For example, symptoms recorded as “Yes” or “No” are changed into 1s and 0s, and missing hormone values are replaced with the median of that hormone across patients. The data is then split so that 80% is used to train the models and 20% is kept unseen for testing.
Three different machine learning models are trained and evaluated. Logistic Regression uses scaled data to learn linear relationships between features and PCOS risk, while Random Forest and XGBoost build multiple decision trees that learn complex patterns in the data. The models output probabilities using predict_proba, meaning the result is not just a yes/no answer but a risk percentage. These probabilities are used to create graphs such as histograms, ROC curves, and scatter plots that visually show how well the model separates PCOS and non-PCOS patients.
Finally, the Random Forest model is analyzed to determine which features most strongly influenced predictions. For example, features like BMI or hormone ratios receive higher importance scores because they consistently help the model distinguish between patients with and without PCOS. By combining prediction accuracy with explainability, the code demonstrates how machine learning can be responsibly used to support earlier PCOS risk identification rather than replace medical diagnosis.
Analysis
Our Code:
So from this code we were able to attain the following graphs and data:
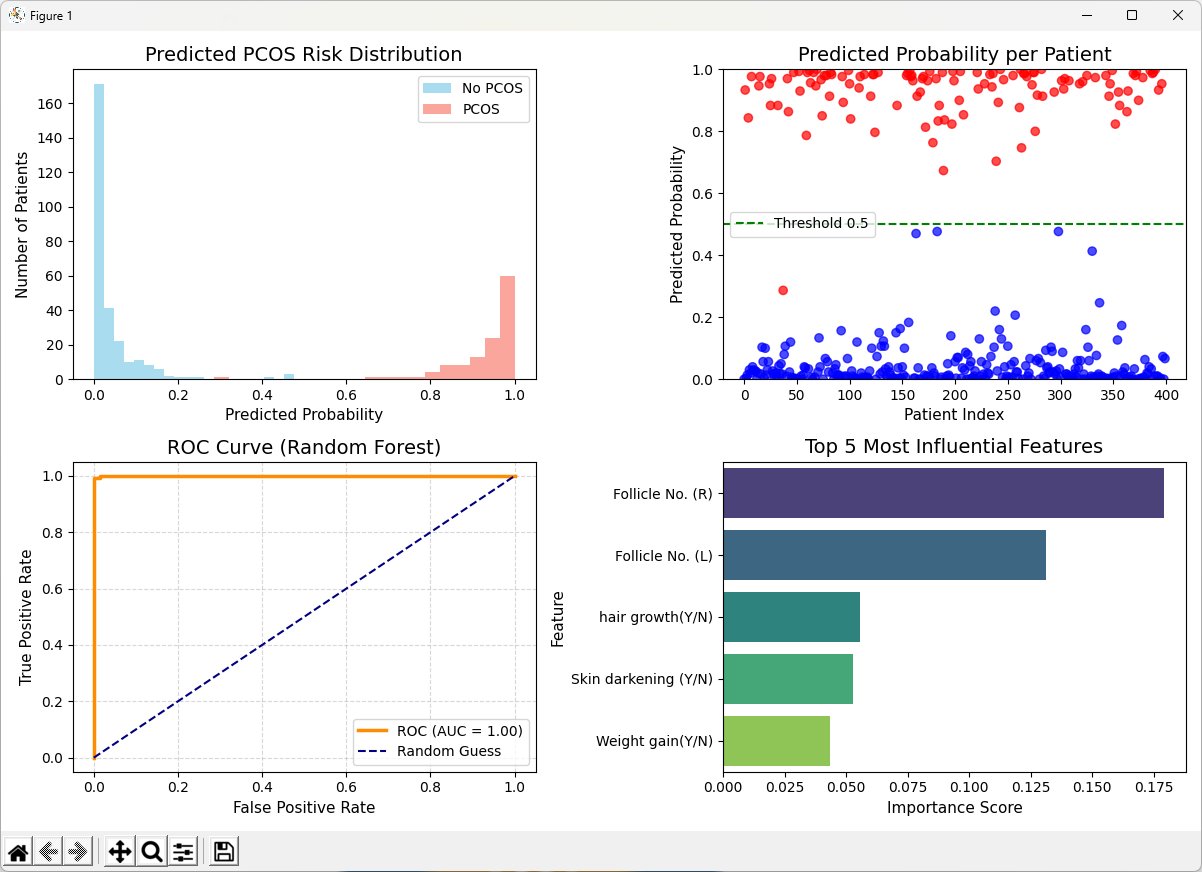
What does this tell us? The first set of graphs provides a complete visual story of how the Random Forest model behaves when predicting PCOS risk. The predicted probability distribution histogram is particularly powerful because it does more than show frequency. It demonstrates how distinctly the model separates patients with PCOS from those without it. On the left side of the graph, nearly all non PCOS patients cluster very tightly near zero. On the right side, almost all PCOS patients cluster close to one. There is minimal overlap between the two groups. This is extremely important. In classification problems, overlap represents uncertainty and potential misclassification. Here, the lack of overlap indicates that the biological and clinical features in the dataset contain strong distinguishing signals. The model is not hesitating between classes. It is identifying consistent patterns that clearly differentiate the two groups. From a medical perspective, this suggests that features such as follicle count, metabolic indicators, and androgen related symptoms create a measurable and separable profile. However, the presence of a few borderline probabilities is realistic and even reassuring. Medicine is rarely binary. Those few intermediate cases likely represent patients whose symptoms are developing, mild, or biologically complex. Rather than being flaws, these points reflect real world variability.
The scatter plot showing predicted probability per patient reinforces this conclusion at an individual level. Instead of looking at grouped distributions, this graph visualizes each patient’s predicted risk as a single point. What stands out immediately is how polarized the predictions are. Most non PCOS patients sit extremely close to zero, while most PCOS patients sit very close to one. The decision threshold of 0.5 is shown as a dashed line, and there is a visible vertical gap between the two classes around this threshold. This gap is crucial because it shows that the classifier is not frequently operating in a zone of uncertainty. In many weaker models, predictions cluster around 0.4 to 0.6, forcing the threshold to determine classification outcomes in a fragile way. Here, even if the threshold were slightly adjusted, classification outcomes would likely remain stable because the probabilities are so extreme. This indicates strong model confidence and robustness. In a clinical application, that robustness matters because screening thresholds may change depending on whether sensitivity or specificity is prioritized. The visual gap suggests that the model could tolerate such adjustments without significant performance loss.
The ROC curve further strengthens the evaluation by analyzing the model across all possible thresholds rather than just one fixed cutoff. The curve rises almost immediately toward the top left corner, and the area under the curve is reported as 1.00. Conceptually, this means that the model perfectly ranks PCOS patients above non PCOS patients in the test set. For any randomly chosen pair consisting of one positive and one negative case, the model assigns a higher probability to the positive case. This is a remarkable result, especially in medical prediction where biological systems are often noisy and overlapping. Such a perfect AUC suggests that the feature space contains extremely strong discriminatory information. At the same time, from a research standpoint, it calls for careful validation. In real world deployment, external validation across different populations would be necessary to confirm that this separation is not specific to a single dataset. Nonetheless, within the context of the current evaluation, the ROC curve demonstrates near ideal tradeoff between sensitivity and specificity.
The feature importance graph adds an essential layer of interpretability. Rather than acting as a black box, the Random Forest model identifies which variables contribute most to its predictions. The highest importance scores belong to follicle count in both ovaries, followed by hair growth, skin darkening, and weight gain. These findings align strongly with established medical knowledge about PCOS. Elevated follicle count is one of the defining diagnostic characteristics of the syndrome. Hair growth and skin darkening reflect androgen excess and insulin resistance, both central components of the disorder. Weight gain is often associated with metabolic dysregulation linked to PCOS. The fact that the model highlights clinically meaningful features increases trust in its reasoning. It indicates that the algorithm is not relying on accidental correlations or irrelevant noise. Instead, it is leveraging biologically plausible predictors. This interpretability is crucial in healthcare AI, where clinicians need to understand and justify algorithmic outputs before incorporating them into practice.
When comparing the three machine learning models, deeper patterns emerge. Logistic Regression performs well, achieving strong accuracy and precision, but its recall is noticeably lower than the ensemble models. Lower recall means that a greater proportion of true PCOS cases are missed. In medical screening, missing a positive case is often more concerning than generating a false positive, because delayed diagnosis can postpone treatment and worsen long term outcomes. Logistic Regression assumes linear relationships between predictors and outcome. However, PCOS is influenced by nonlinear hormonal feedback loops, metabolic interactions, and complex symptom clusters. A linear boundary may capture overall trends but fails to fully model these intricate relationships. That limitation likely explains its comparatively lower recall and F1 score.
Random Forest achieves near perfect performance across all metrics. Its accuracy, precision, recall, and F1 score are all extremely high and closely balanced. This balance is significant because it shows that the model is not sacrificing one metric to improve another. High precision indicates very few false positives, while high recall indicates very few false negatives. Random Forest performs well because it builds many decision trees that each capture different patterns and interactions within the data. By averaging across trees, it reduces overfitting while maintaining the ability to learn complex nonlinear boundaries. In datasets where features interact in layered ways, as hormonal and metabolic indicators often do, this structure is especially effective.
XGBoost also performs at an exceptionally high level, only slightly below Random Forest. XGBoost builds trees sequentially, correcting errors from previous trees, which often allows it to capture subtle patterns. The small difference between XGBoost and Random Forest in this case may reflect dataset size, parameter tuning, or the specific feature structure. Practically speaking, both models demonstrate outstanding predictive power. The minimal gap between them suggests that the signal in the dataset is strong enough that multiple advanced ensemble approaches can exploit it effectively.
Taken together, the visualizations and comparisons suggest that the dataset contains highly informative features capable of clearly distinguishing PCOS from non PCOS patients. The tree based ensemble methods outperform the linear model because they better capture nonlinear biological interactions. The strong separation in probability distributions, the near perfect ROC curve, and the clinically aligned feature importance rankings collectively indicate that the model is not merely memorizing data but identifying structured, meaningful patterns. At the same time, responsible interpretation requires recognizing the need for broader validation before clinical deployment. Within the current evaluation, however, the analysis strongly supports the conclusion that machine learning, particularly ensemble tree methods, can function as a powerful and explainable risk stratification tool for earlier identification of PCOS.
Conclusion
In conclusion, the comparison of machine learning models clearly demonstrates that different algorithms vary in their ability to predict PCOS risk, and that models capable of capturing complex, nonlinear relationships significantly outperform simpler linear approaches. Logistic Regression performed well overall, achieving strong accuracy and precision, but it showed comparatively lower recall. This indicates that while it was effective at identifying many cases correctly, it was more likely to miss true PCOS patients than the ensemble models. In contrast, both Random Forest and XGBoost achieved near perfect performance across accuracy, precision, recall, and F1 score, with Random Forest performing marginally best overall. The ROC curve and probability distributions further confirmed that Random Forest was able to separate PCOS and non PCOS patients with exceptional clarity, producing highly confident and stable predictions.
These findings directly support the original hypothesis that Random Forest models would outperform Logistic Regression in predicting PCOS risk because PCOS is influenced by multiple hormonal and metabolic factors that interact in complex, nonlinear ways. PCOS is not caused by a single variable but by an interplay between follicle development, androgen levels, insulin resistance, weight regulation, and clinical symptoms such as hair growth and skin changes. Logistic Regression assumes a linear relationship between predictors and outcome, meaning it attempts to draw a straight decision boundary. However, biological systems rarely behave linearly. Random Forest, by building multiple decision trees that split on different combinations of features, is able to model threshold effects, feature interactions, and nonlinear dependencies. The results of this project strongly validate that assumption. The ensemble models captured the biological complexity more effectively, resulting in superior recall and overall classification balance. The feature importance analysis also answers the second part of the research question by identifying which biological features were most influential in model predictions. The most important predictors included follicle count in both ovaries, hair growth, skin darkening, and weight gain. These features align closely with established medical knowledge about PCOS. Increased follicle number is a diagnostic hallmark of the condition. Hair growth reflects hyperandrogenism, one of the central hormonal imbalances in PCOS. Skin darkening is often associated with insulin resistance, which plays a major metabolic role in the syndrome. Weight gain is linked to hormonal dysregulation and metabolic feedback loops. The fact that the model identified these features as most influential strengthens its clinical credibility. It suggests that the algorithm is learning biologically meaningful patterns rather than arbitrary statistical correlations. This level of interpretability is essential if machine learning tools are to be responsibly integrated into healthcare.
The implications of these findings are significant for both the present and the future. Today, many individuals with PCOS experience delayed diagnosis, sometimes waiting years before receiving proper evaluation. Symptoms are often dismissed or treated individually rather than recognized as part of a larger pattern. A machine learning based risk prediction tool could assist healthcare providers by flagging high risk patients earlier, especially in primary care settings. Because the model outputs probabilities rather than binary decisions, it can serve as a screening and risk stratification tool rather than a replacement for medical judgment. It could prompt earlier hormonal testing, lifestyle interventions, or specialist referrals, potentially reducing long term complications such as infertility, type 2 diabetes, and cardiovascular disease.
Looking toward the future, several improvements could strengthen and expand this work. First, external validation using datasets from multiple geographic regions and diverse populations would be critical to ensure generalizability. PCOS presentation can vary across ethnic groups and environmental contexts, so broader validation would confirm robustness. Second, hyperparameter tuning and cross validation could further refine model stability. Third, incorporating longitudinal data would allow prediction not only of current risk but of future development of PCOS. Additionally, integrating genetic markers or more detailed metabolic profiles could enhance predictive precision. Finally, exploring explainable AI techniques such as SHAP values could provide patient specific explanations, increasing transparency and clinician trust.
Overall, this project demonstrates that machine learning, particularly ensemble tree based models like Random Forest, is highly effective at predicting PCOS risk because it captures the nonlinear and interactive nature of hormonal and metabolic systems. The results validate the original hypothesis and highlight the importance of selecting models that align with biological complexity. More broadly, this work illustrates how artificial intelligence can be used responsibly in medicine, not to replace physicians, but to support earlier detection, guide decision making, and improve patient outcomes. With continued validation, ethical oversight, and integration into clinical workflows, predictive modeling has the potential to transform how conditions like PCOS are identified and managed, shifting healthcare toward earlier intervention and more personalized care.
Citations
Polycystic ovary syndrome (PCOS) - Symptoms and causes. (n.d.). Mayo Clinic. https://www.mayoclinic.org/diseases-conditions/pcos/symptoms-causes/syc-20353439
HealthPartners. (2025, October 31). Treatment options for polycystic ovary syndrome (PCOS) – from self-care to medications. HealthPartners Blog. https://www.healthpartners.com/blog/treatment-for-pcos/
Children’s Hospital Colorado. (2023). Spironolactone for PCOS symptoms. https://www.childrenscolorado.org/globalassets/departments/gynecology/informational-pdfs/options-for-managing-pcos-symptoms-spironolactone.pdf
Polycystic Ovary Syndrome (PCOS) | HealthLink BC. (n.d.). https://www.healthlinkbc.ca/healthwise/polycystic-ovary-syndrome-pcos-0#:~:text=Regular%20exercise%2C%20healthy%20foods%2C%20and%20weight%20control,symptoms%20and%20help%20prevent%20long%2Dterm%20health%20problems. PCOS Pathway: Review your treatment, management, and prevention options. (n.d.). https://myhealth.alberta.ca/pcos-pathway/review-your-treatment-management-and-prevention-options
Nayak, P., Agrawal, S., & Mitra, S. (2015). Laparoscopic ovarian drilling: An alternative but not the ultimate in the management of polycystic ovary syndrome. Journal of Natural Science Biology and Medicine, 6(1), 40. https://doi.org/10.4103/0976-9668.149076
Professional, C. C. M. (2025, December 8). Menstrual cycle. Cleveland Clinic. https://my.clevelandclinic.org/health/articles/10132-menstrual-cycle
Msn, E. L., RN. (2025, April 29). Why is my menstrual cycle length changing? Why Is My Menstrual Cycle Length Changing? https://helloclue.com/articles/cycle-a-z/why-do-menstrual-cycles-vary#:~:text=Menstrual%20cycles%20naturally%20vary%2C%20and,when%20to%20seek%20medical%20advice
Menstrual Cycle Basics – Your Period. (n.d.). https://www.yourperiod.ca/normal-periods/menstrual-cycle-basics/#:~:text=What%20is%20normal%20bleeding?,When%20am%20I%20ovulating?
All about periods (for teens). (n.d.). Nemours KidsHealth. https://kidshealth.org/en/teens/menstruation.html#:~:text=What%20Is%20PMS?,few%20days%20of%20a%20period
Whelan, C. (2022, February 4). 10 signs your period is about to start. Healthline. https://www.healthline.com/health/womens-health/period-signs#what-is-a-normal-menstrual-cycl
Holesh, J. E., Bass, A. N., & Lord, M. (2023, May 1). Physiology, ovulation. StatPearls - NCBI Bookshelf. https://www.ncbi.nlm.nih.gov/books/NBK441996/
Professional, C. C. M. (2026, January 30). Luteal phase. Cleveland Clinic. https://my.clevelandclinic.org/health/articles/24417-luteal-phase
The ovaries. (n.d.). https://www.macmillan.org.uk/cancer-information-and-support/ovarian-cancer/the-ovaries NCI Dictionary of Cancer Terms. (n.d.). Cancer.gov. https://www.cancer.gov/publications/dictionaries/cancer-terms/def/ovary
Normal menstrual cycle. (n.d.). https://myhealth.alberta.ca/Health/pages/conditions.aspx?hwid=tn9930#:~:text=Estrogen%20builds%20up%20the%20lining,is%20when%20your%20period%20starts.
Endometrium. (n.d.). https://myhealth.alberta.ca/Health/pages/conditions.aspx?hwid=ste122117&
Du Cancer, C. C. S. /. S. C. (n.d.). The vagina. Canadian Cancer Society. https://cdn.cancer.ca/en/cancer-information/cancer-types/vaginal/what-is-vaginal-cancer/the-vagina
Professional, C. C. M. (2026b, February 3). Cervix. Cleveland Clinic. https://my.clevelandclinic.org/health/body/23279-cervix
Professional, C. C. M. (2026a, January 30). Fimbriae. Cleveland Clinic. https://my.clevelandclinic.org/health/body/24346-fimbriae
https://www.kaggle.com/datasets/prasoonkottarathil/polycystic-ovary-syndrome-pcos https://www.google.com/search?q=PCOS+background&sca_esv=ea1a9d6a035ab07d&rlz=1C5GCEA_enCA1195&udm=2&biw=1438&bih=679&sxsrf=ANbL-n6AhoT9exfX6ZTAKiasQaH03MvSeg%3A1770272643877&ei=gzeEab2iNdrl0PEP9ID-wAE&ved=0ahUKEwj979_A28GSAxXaMjQIHXSAHxgQ4dUDCBQ&uact=5&oq=PCOS+background&gs_lp=Egtnd3Mtd2l6LWltZyIPUENPUyBiYWNrZ3JvdW5kMgUQABiABDIFEAAYgAQyBBAAGB4yBhAAGAgYHkimHlAAWJIdcAB4AJABAJgBT6AB8geqAQIxNbgBA8gBAPgBAZgCD6AC4wjCAgcQIxgnGMkCwgIKEAAYgAQYQxiKBcICDRAAGIAEGLEDGEMYigXCAhAQABiABBixAxhDGIMBGIoFwgIHEAAYgAQYCpgDAJIHAjE1oAeLPLIHAjE1uAfjCMIHCDAuMS4xMy4xyAdRgAgA&sclient=gws-wiz-img
Acknowledgement
We would like to sincerely thank Mrs. Heron, our science fair coordinator, for guiding and supporting us throughout our project. She was always willing to answer our questions and help us stay on track. We truly appreciate the time and effort she put into helping us succeed.