A Comparison Study of the Regional Impacts of Extreme El Niño Events on India and Peru in the 1788-1793 and 1982-1983 Episodes
Grade 11
Presentation
Problem
Climate has always had a convoluted relation with the development of human societies. In the past, civilizations flourished and perished because of the change in climate. However as humans entering the modern era, does climate events still have the same effects on the societies now? Addressing this question, the study focused on identifying how extreme weather events affect human societies in the past and future and what mechanisms to reduce the detrimental impacts of future climate/weather events are viable, which led to the research questions that the project aimed to solve.
What were the agricultural, economic, societal, health, and infrastructural impacts of the 1788-1793 and the 1982-1983 El Niño event? Is modern society more resilient to the socio-economic damages caused by climate variability and extreme weather events? What predictions can we make about how future El Niño may affect human societies?
Method
Multi-Proxy Reconstruction of the 1789-1793 and the 1982-1983 El Niño Events
Data Collection
A list of proxy records (e.g. coral reefs; ice cores; tree rings) that was used in previous studies of proxy reconstructions of ENSO (Braganza et al., 2009; Gill et al., 2017; Michaelsen & Thompson, 1992) was selected. These proxy records spanned from at least the late eighteenth century to 1982, encompassing the two El Niño events that this study focused on. Raw proxy data with annual resolution was found and downloaded from the Paleo Data Search powered by the U.S. National Centers for Environmental Information (National Centers for Environmental Information (NCEI), n.d.). The geographic locations of this set of proxy records extended beyond the traditional area in which the previous research showed the effect of El Niño events, and the selected data included proxy records from the western Pacific and Indian Oceans, regions with well-established ENSO teleconnections. The Niño 3.4 SST Index (Niño 3.4), Southern Oscillation Index (SOI), and Multivariate ENSO Index Version 2 (MEI V2) were indices of ENSO that this study used to calculate correlations between proxy data and ENSO. The monthly values of Niño 3.4 from Jan 1871 to Sep 2024, SOI from Jan 1866 to Sep 2024, and MEI V2 from Jan 1979 to Sep 2024 were collected from the NOAA Physical Sciences Laboratory (Home: NOAA Physical Sciences Laboratory, n.d.). The annual averages of the monthly values were calculated for the analysis of the proxy data with annual resolutions.
Proxy Reconstruction of ENSO
The correlation between the collected proxy data and annual average of ENSO instrumental records was calculated by the correlation function in the spreadsheet. A greater absolute value of correlation r suggests a stronger cause-and-effect relation between the proxy record and ENSO. Overall, Niño 3.4 had the most significant correlations with proxy records and was used as the index of the ENSO reconstruction. A correlation with an absolute value above 0.3 was considered as a threshold for the proxy record to be statistically significant and eligible for reconstructing the ENSO cycle. Scatter plots with the proxy data as the x-coordinates and instrumental records in corresponding years as the y-coordinates were created for every proxy record that met the threshold in spreadsheets. Regression lines of the scatter plots were graphed, and the equation for the regression lines was calculated to quantify the statistical or predictive relation between the proxy and ENSO.
The annual values of proxy data were imputed into respective equations of the regression lines. Outputs of the equations were the reconstructed values of Niño 3.4, extending beyond the period of instrumental record that only traced back to 1870. Line graphs of the reconstructed ENSO index were generated, and the anomalies of the 1789-1793 and the 1982-1983 El Niño events were calculated and marked in the graphs.
Measuring Regional Impacts of the 1789-1793 and the 1982-1983 El Niño Events
Peru
Annual series of Peruvian economic data in agriculture and fishery, sectors that were shown to be significantly affected by El Niño events in previous studies, were found and downloaded from the published statistics in the Central Reserve Bank of Peru (Banco Central de Reserva del Perú, n.d.). Series of real percentage changes of GDP in total and by productive sectors (agriculture and fishery) were incorporated in the calculation of correlations between the Peruvian economy and ENSO. Correlations across different time periods (pre-1950s, 1951-1970, 1971-1990, 1991-now) were computed. The impacts of the 1982-1983 El Niño on the fishery, agriculture and economy in Peru was examined by identifying and measuring potential anomalies during 1982 and 1983 based on the trend of the percentage changes of these sectors.
Qualitative and quantitative data of Peruvian agriculture and fishery in the late eighteenth century were explored in historical documents archived in Archivo General de la Nación del Perú (AGN Peru) (Archivo General de la Nación, n.d.). The impacts of the 1789-1793 El Niño in Peru was inspected through the quantitative data that indicated the general trend of the outputs of agriculture and fishery in Peru from 1780 to 1810. Potential anomalies caused by the 1789-1793 El Niño in the data were identified and measured in percentage changes.
The impacts of the two El Niño events on Peru were measured and compared in their respective disruptions of the general trend of agriculture and fishery data collected. The qualitative descriptions of the impacts of the 1789-1793 El Niño was incorporated into the comparison as supplementary evidence.
India
Annual food grain yields and GDP of India from 1950 to 2024 were collected from the Database on Indian Economy of the Reserve Bank of India (Reserve Bank of India, n.d.). The annual percentage growth of food grain yields and GDP was calculated. The correlation r between the annual percentage change of collected economic data and Niño 3.4 across different time periods (1951-1970, 1971-1990, 1991-now) was computed and compared. The impacts of the 1982-1983 El Niño on agriculture and economy in India were investigated through the analysis of the trend and anomalies identified in the economic series.
The impacts of the 1789-1793 El Niño in India was analyzed by the change of grain prices and estimated mortality due to El-Niño incited droughts extracted from historical documents Gazetteer of the Bombay Presidency and Imperial Gazetteer of India and previous studies on this El Niño event (Campbell, 1884a, 1884b; Gazetteer Of The Bombay Presidency Vol-Xxiii (1884), 1884; Grove, 2006; The Clarendon Press, Oxford, 1907). The general trend of the change of grain prices in India from 1780 to 1810 was spotted, and the annual data during the 1789-1793 El Niño was examined for the potential anomalies in agriculture output caused by a strong El Niño event. The estimated mortality rate due to the severe droughts triggered by this El Niño event was calculated based on the reconstructed number of India’s population in the late eighteenth century (McEvedy & Jones, 1978).
The impacts of the two El Niño events on India’s grain production were compared by determining which event caused the greater disruption of the general trend of the economic series collected across a fifteen-year time span before and after the events. The overall difference between the impacts of the two El Niño events was analyzed considering both aspects of the impacts, agriculture and demographics.
Research
The impacts of climate on human societies have a prolonged and convoluted history. Climate (and its geographic environments) determines the distinct characteristics of food production and life (e.g. nomadic/agricultural/maritime civilizations) in human societies. Behind the burgeoning and flourishing of human civilizations, preferable climates with warm temperatures and abundant precipitation played an important role (Fagan, 2008). On the other hand, the demise of many empires, such as the Roman Empire (Harper, 2019) and the Ming Dynasty in China (Zheng et al., 2014), was intimately connected with unfavorable climate events such as drastic temperature and precipitation change, and various extreme climate events which could lead to damage and instabilities in multifarious dimensions including crop failure, fiscal crisis of the ruling administrations, destruction to infrastructure and conflicts with neighboring nations. In summary, the fate of civilizations is closely bonded with climate.
In the twentieth century, advanced technology in geology, meteorology and data analysis allowed climatologists to reconstruct the climate in past centuries using the evidence of temperature and precipitation change recorded in ice cores, tree rings, speleothems and other natural indicators (Braganza et al., 2009; Steiger et al., 2017) combined with historical and documentary data (Grove, 2006a; Prieto & García Herrera, 2009; Quinn et al., 1987). Historians and sociologists utilizing the data of paleoclimatic reconstructions have discovered many correlations between climate and the developments of human societies, providing a new insight into sociology and history. Scholars investigated significant climate anomalies in the past such as the Medieval Warm Period and the Little Ice Age, a period of regional cooling during the fourteenth to nineteenth century (Appleby, 1981; Behringer, 1999; Degroot, 2018; Fagan, 2019; Hunt, 2006). Researchers have studied extensively how these major temperature and precipitation changes influence the concurrent civilizations on economic, demographic, social, and even political scales (Appleby, 1981; Fagan, 2019).
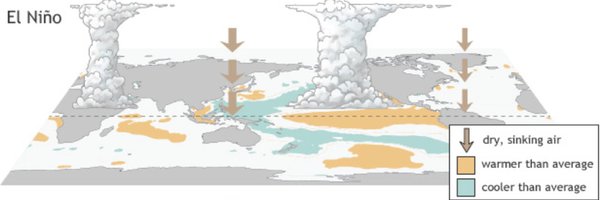
Although climatologists have acquired a general understanding of climate changes and extreme weather events in the twentieth century, the influence of El Niño Southern Oscillation on human civilizations has remained largely unclear until recent decades. El Niño Southern Oscillation (ENSO) is one of the most influential coupled ocean-atmosphere phenomena that fluctuates between three phases: Neutral, El Niño or La Niña (Philander, 1989). It is a naturally occurring climate variability. Its El Niño phase, the main focus of this study, is associated with a higher-than-average Sea Surface Temperature (SST) in the central and east-central equatorial Pacific (Generoso et al., 2020). This warming causes changes in the atmospheric circulation, a higher air pressure in the Western Pacific and lower in the Eastern Pacific (Philander, 1989). The term “El Niño” was first used by Peruvians near the end of the nineteenth century to describe a particularly warm current that moves southward along the coastline in Peru every few years (Carrillo, 1892). This warm current that seasonally appeared along the coast of Peru and Ecuador would linger for months or even years around Christmas time and the SST would rise, leading to pronounced disruptions of the coastal ecosystems and agriculture in Peru and Ecuador (Glantz, 2000). The variations in atmosphere and sea temperature in the Pacific Ocean during El Niño has global climatic teleconnections–significant links of climatic phenomena in widely separated areas on earth. El Niño causes global changes in temperature and rainfall on average every two to seven years (Generoso et al., 2020). For many times in the past, extreme El Niño events brought phenomenal droughts and floods, inducing ecological and economic disasters (Philander, 1989).
The 1972-1973 El Niño and its catastrophic effects on global agriculture and fishery served as a wake-up-call for scientists around the world to examine the past El Niño events and to monitor the ENSO cycle (Fagan, 2009). Currently, ENSO is one of the most thoroughly studied climatic phenomena in the world (Braganza et al., 2009; Cai et al., 2014; Chongyin, 1990; Glantz, 2000; Kovats et al., 2003). Researchers have developed computer methods and climatic models to roughly predict the occurrence and amplitude of El Niño in advance (Fagan, 2009). Proxy records that are sensitive to the ENSO cycle including ice cores, tree rings, and coral reefs are gathered and used to produce indices of the ENSO cycle in the past four centuries (Braganza et al., 2009). Employing the proxy reconstruction of the ENSO cycle, scientists investigate extreme El Niño events in history and dissect their influence on society (Caviedes, 1984; Changnon, 2000; Grove, 2006b). However, the research focusing on socioeconomic effects of El Niño is still developing (Generoso et al., 2020). Given that global warming could play an important role in the rise of extreme weather events related to ENSO (Otto‐Bliesner & Stevenson, 2018; Yeh et al., 2009), better understanding the socio-economic effects of future El Niño events on societies is essential for policy-making. Although there is a lot of research conducted to analyze the socioeconomic effects of El Niño in modern societies after the twentieth century (Berry & Okulicz-Kozaryn, 2008; Glantz, 2000; Kovats et al., 2003; Yeh et al., 2009), few have accounted for factors such as the increasing population, rising global temperature, and the evolving society as humans entered the modern era.
This research study will mainly focus on the comparison of two extreme El Niño events, the 1788-1793 episode and the 1982-1983 episode, and their prolonged global and regional impacts in order to address the lack of study mentioned in the last paragraph. Despite the long time interval in between their occurrences, they are both classified as “very strong” in a reconstruction of El Niño episodes (Quinn et al., 1987), thus relatively comparable in their amplitude. The 1982-1983 El Niño, two centuries apart from the 1788-1793 episode, developed at an average temperature higher than that of the 1788-1793 episode. In 1982, every spectrum of society (e.g. agriculture, infrastructures, health) was buttressed by more advanced infrastructure and robust economy that would presumably soften the blows of extreme weather events. However, the more interdependent global economy, warming climate, and the higher population (from under 1000 million in the 1750s to 4.6 billion in 1982 (International Database, 2024)) introduce more factors that contribute to the socioeconomic impacts that this study is going to examine. Overall, this study aims to analyze the effects of the 1788-1793 El Niño and the 1982-1983 El Niño, two events with similar intensity, on agriculture, economy, human health, infrastructures, and society as a whole in order to inspect the resilience or vulnerability of modern society in a warming climate with denser population and more sophisticated economy compared to societies in the past.
Data
Reconstruction of the ENSO from 1700 to 1990
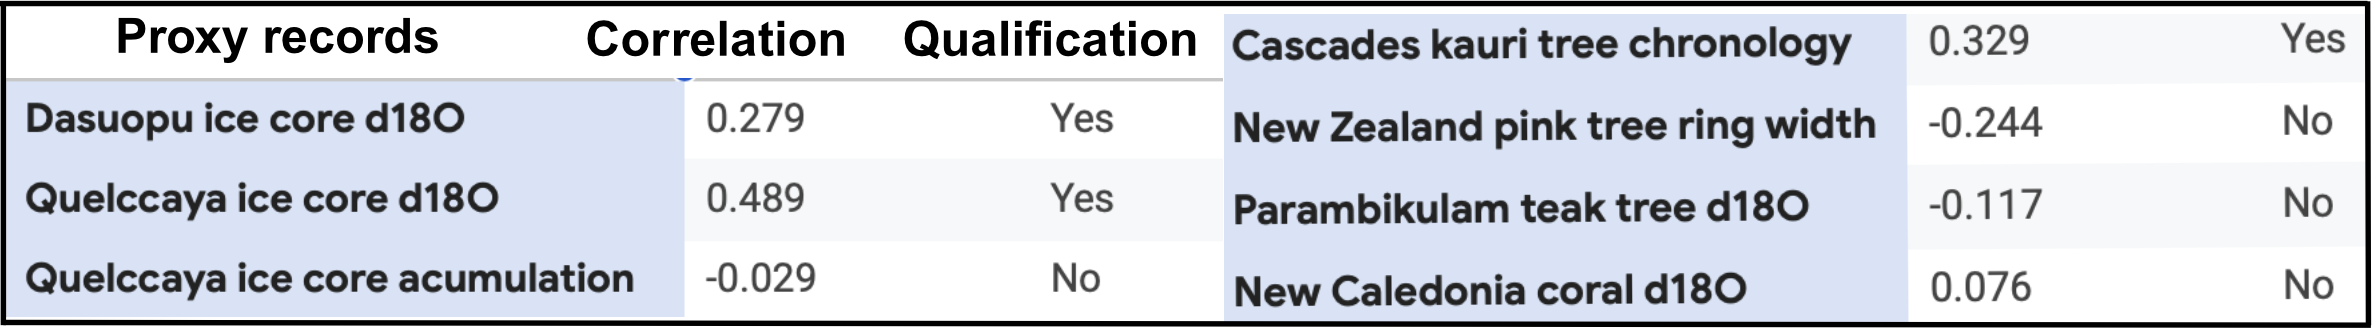
A primary list of proxy seen in the table below was selected from the previous research (Braganza et al., 2009), the raw data of the proxy records was collected from the NOAA Physical Science Laboratory. Correlation between the proxy data and the instrumental record Niño 3.4 was calculated. Proxy records, including Dasuopoice core d18O, Quelccaya ice core d18O, and Cascades kauri tree chronology, that had correlations greater than 0.25 qualified to be used to reconstruct the ENSO.
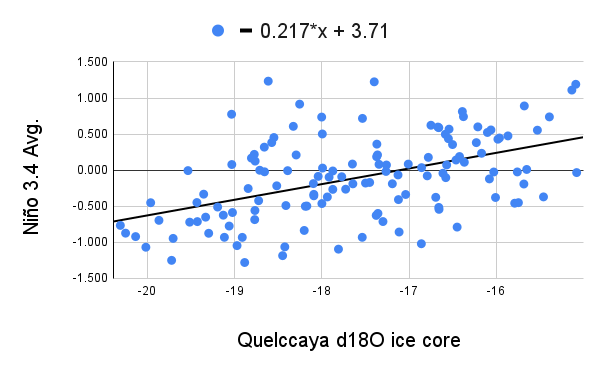
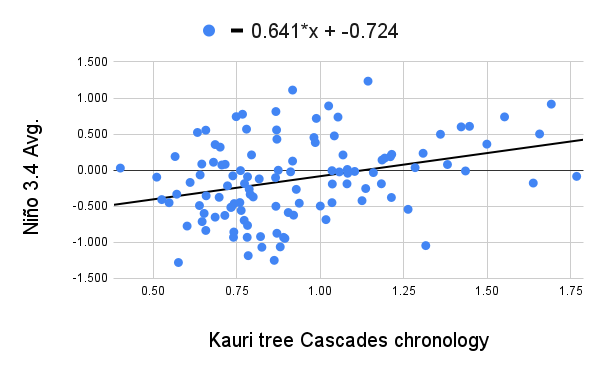
 Scatterplots between the proxy data and Niño 3.4 were created for the three proxy records that qualified for the reconstruction, and regression lines in the scatterplots were drawn as seen in the diagrams below. The equation of these regression lines was calculated by the tools in excel as shown in the legend of the diagrams below.
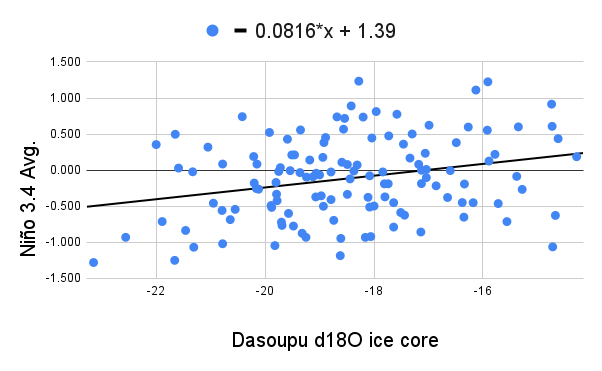
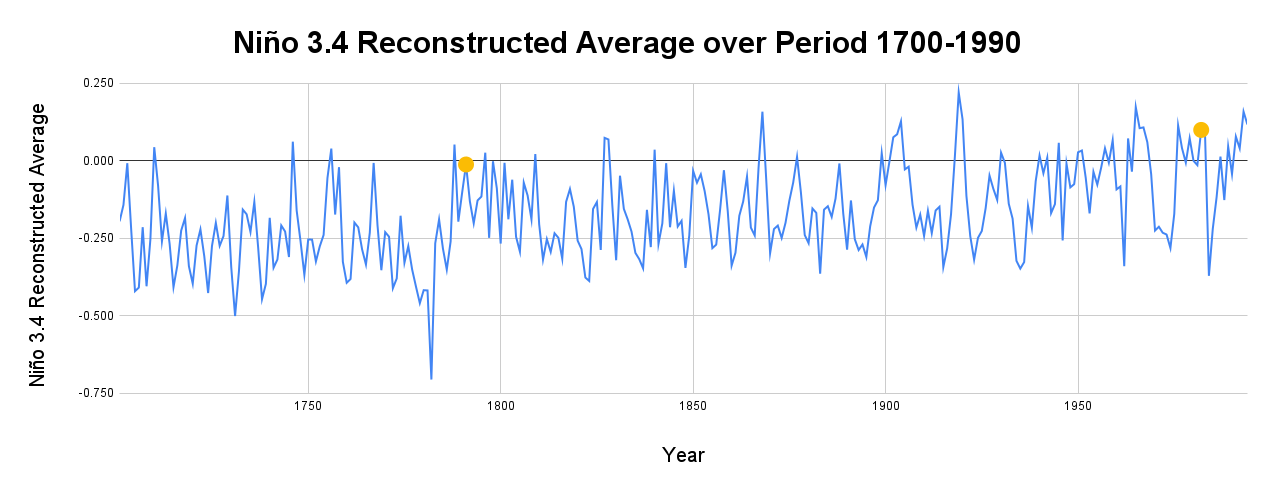
The equation of the regression line represents the relation between the proxy records and Niño 3.4, and by using the equations Niño 3.4 from 1700 to recent decades was reconstructed based on the proxy records. The average for the three independent reconstructed Niño 3.4 was calculated. The two El Niño periods the study focused on were highlighted by yellow dots in the graph below. Consistent results were shown for the similar severity of two El Niño events the study focused on because there were similar values of Niño 3.4 for the two El Niño events. Thus, similar amplitude of weather anomalies caused by the events were expected, which meant the two events were comparable.
Regional Impacts of the 1788-1793 and 1982-1983 El Niño on India and Peru
India
For the 1982-1983 El Niño event, statistics on India's economy, population and agriculture was collected from the Reserve Bank of India. A halt in the trend of increasing food grain production which only increased by 0.29 percent in 1982-1983 was discerned. No abnormal population loss was found during the period of this El Niño. There was no significant fluctuation in India’s GDP or GDP growth in 1982 and 1983.
For the 1789-1793 El Niño, the hisotrical documents of the government records in the most disrupted regions were studied (Campbell, 1884a, 1884b; Gazetteer Of The Bombay Presidency Vol-Xxiii (1884), 1884; The Clarendon Press, Oxford, 1907). It was discovered that the food price spiked, increased by 700% in the most destructed regions. The Skull Famine, resulting in an estimated mortality of 11 million people.
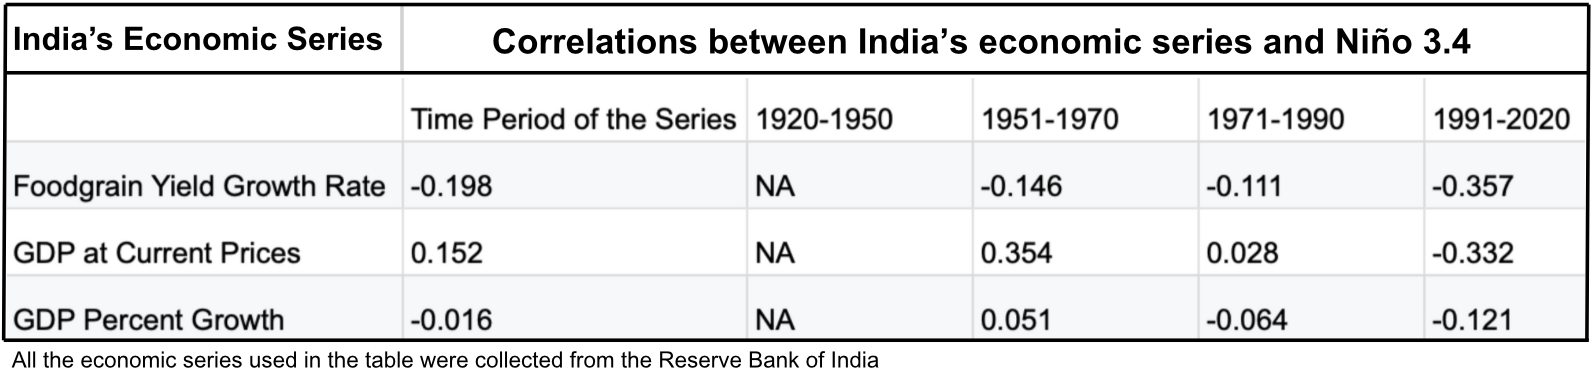
By percentagel, the economic and agricultural destruction caused by the 1982-1983 El Niño event was less disrupted to the trendline compared to the 1789-1793 El Niño. The 1982-1983 El Niño event also had minimal impact on India's population. In order to better grasp of the trends of how the society in India in different time periods responds to the ENSO cycle, time series of India's food grain yield growth, GDP, and GDP growth from 1951 to 2020 were collected. The corrleations for different time periods as shown in the table below were calculated.
Peru
Statistics on Peru's economy, fishery, population and agriculture was collected from Banco Central de Reserva del Perú (the Central Reserve Bank of Peru). During the 1982-1983 El Niño event, fishery growth decreased by 270% and agriculture growth decreased by 550%. An abnormal decrease by -10.4% in Peru’s GDP was identified in 1983. However, no significant change in the population was discerned during the El Niño period.
Only qualitative descriptions were able to be found for the impacts of the 1789-1793 El Niño on Peru. According to the historical records from Archivo General de la Nación del Perú (AGN Peru) (Archivo General de la Nación, n.d.), crop failure due to torrential rain and floods was indicated, and a fishery crisis was documented during 1789-1793.
For the same reason in India, time series of Peru's agricultural output percent change, fishery output percent change and GDP percent change from 1922 to 2019 were collected, and correlations between the series and Niño 3.4 were calculated as shown in the table below.
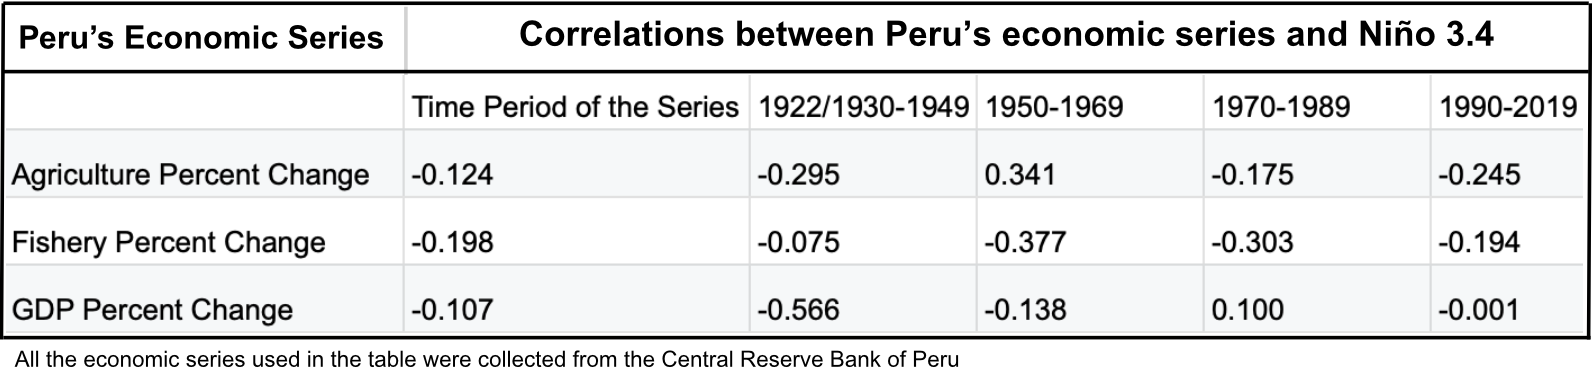
The absolute value of the correlation for the agricultural output generally decreased over time while an increase from 1990 was discerned. The absolute value of the correlation for the fishery output steadily decreased since 1950 when the absolute value of the correlaiton for GDP percent change drastically decreased.
Conclusion
Conclusions
Both El Niño events were disruptive and destructive on the agriculture and fishery in India and Peru while the 1982-1983 El Niño had a minimal effect on the GDP. GDP in both countries and Peru’s fishery output are less dependent on the ENSO cycle over time while agricultural production becomes more dependent on the ENSO cycle. Overall, the collected economic data of India and Peru indicates a higher resilience of modern Peru and India to the weather anomalies caused by El Niño events in comparison to Peru and India in the late eighteenth century while there is an increase of the dependence of El Niño in India's GDP and agriculture of both countries since 1990.
Limitations
There are certain limitations to this resaerch that can be improved in future studies. The access to data in this study is limited by the short period of time that is avaiable for conducting data collection. More proxy data and historical documents can be accessed in the future for a more generalized conclusion. The region of study for this projected is limited in tropical developing countries, and expanding the region of study to more developed countries in temporate areas can be a future direction for this topic.
Future Study
This project is still ongoing. Improvements will be made including using bivariate or multivariate analysis for calculating correlations in order to account for different factors on the proxy data and economic series since the correlations for Niño 3.4 alone were not very strong for some data. These changes will be ready for the city science fair. After science fair, more data in different sectors of economy beyond food production will be gathered and analyzed. In the end of the study, suggestions of methods to mitigate the destructions of future climate/weather events will be proposed.
Citations
Reference List
Appleby, A. Β. (1981). Epidemics and famine in the little ice age. In R. I. Rotberg & T. K. Rabb (Eds.), Climate and History (pp. 63–84). Princeton University Press. https://doi.org/10.1515/9781400854103.63
Archivo General de la Nación. (n.d.). Retrieved February 18, 2025, from https://www.gob.pe/agn
Banco Central de Reserva del Perú. (n.d.). Retrieved February 17, 2025, from https://www.bcrp.gob.pe/en/
Behringer, W. (1999). Climatic change and witch-hunting: the impact of the Little Ice Age on mentalities. Climatic Change, 43(1), 335–351. https://doi.org/10.1023/a:1005554519604
Berry, B. J., & Okulicz-Kozaryn, A. (2008). Are there ENSO signals in the macroeconomy? Ecological Economics, 64(3), 625–633. https://doi.org/10.1016/j.ecolecon.2007.04.009
Braganza, K., Gergis, J. L., & Power, S. B. (2009). A multiproxy index of the El Niño–Southern Oscillation, AD 1525–1982. https://doi.org/10.1029/2008JD010896
Cai, W., Borlace, S., Lengaigne, M., van Rensch, P., Collins, M., Vecchi, G., Timmermann, A., Santoso, A., McPhaden, M. J., Wu, L., England, M. H., Wang, G., Guilyardi, E., & Jin, F.-F. (2014). Increasing frequency of extreme El Niño events due to greenhouse warming. Nature Climate Change, 4(2), 111–116. https://doi.org/10.1038/nclimate2100
Campbell, J. M. (1884a). Gazetteer Of The Bomaby Presidency Volume Xxi Belgaum. https://archive.org/details/in.ernet.dli.2015.35167
Campbell, J. M. (1884b). Gazetteer of the Bombay Presidency Volume XXII Dharwar Under Government Orders. https://archive.org/details/dli.ministry.08152
Caviedes, C. N. (1984). El Nino 1982-83. Geographical Review. https://doi.org/10.2307/214939
Changnon, S. A. (2000). El Niño 1997-1998: The climate event of the century. Oxford University Press. https://books.google.ca/books?hl=en&lr=&id=aMHwVy3ZPpwC&oi=fnd&pg=PR11&dq=el+nino+events&ots=WmFXfOeJGR&sig=Df2iYLEiAkBVtKtu79VJNMo00SM
Chongyin, L. (1990). Interaction between anomalous winter monsoon in East Asia and El Nino events. Advances in Atmospheric Sciences, 7(1), 36–46. https://doi.org/10.1007/bf02919166
Christianson, G. E. (2002). Brian Fagan. The Little Ice Age: How Climate Made History, 1300–1850. xxii + 246 pp., illus., figs., index. New York: Basic Books, 2001. 26, Can 39.50. Isis; an International Review Devoted to the History of Science and Its Cultural Influences, 93(2), 288–289. https://doi.org/10.1086/344976
Degroot, D. (2018). The frigid golden age: Climate change, the little ice age, and the Dutch Republic, 1560–1720. https://core.ac.uk/download/pdf/77103261.pdf
Fagan, B. (2008). The great warming: Climate change and the rise and fall of civilizations. Bloomsbury Publishing Plc. https://books.google.ca/books?hl=en&lr=&id=fDMNTxjepqgC&oi=fnd&pg=PR9&dq=climate+and+civilization&ots=Aoyz4xZvF4&sig=SYp-uaKxfjGayBtpKojyVMY2NpI
Fagan, B. (2009). Floods, famines, and emperors: El Nino and the fate of civilizations. Basic Books. https://books.google.ca/books?hl=en&lr=&id=fFdAjEqG4tcC&oi=fnd&pg=PR9&dq=floods+famines+and+emperors&ots=PGQMiLB9dX&sig=GtKW0x0w95gnMzshLtS5XU8KeS8
Gazetteer Of The Bombay Presidency Vol-xxiii (1884). (1884). https://archive.org/details/dli.ernet.11430
Generoso, Couharde, Damette, & Mohaddes. (2020). The growth effects of El Niño and la Niña: Local weather conditions matter. Annals of Economics and Statistics, 140, 83. https://doi.org/10.15609/annaeconstat2009.140.0083
Gill, E. C., Rajagopalan, B., Molnar, P. H., Kushnir, Y., & Marchitto, T. M. (2017). Reconstruction of Indian summer monsoon winds and precipitation over the past 10,000 years using equatorial pacific SST proxy records. Paleoceanography, 32(2), 195–216. https://doi.org/10.1002/2016pa002971
Glantz, M. H. (2000). Currents of change : impacts of El Niño and La Nina on climate and society: Impacts of El Nino and la Nina on climate and society (2nd ed.). Cambridge University Press. https://books.google.ca/books?hl=en&lr=&id=BpKEDEDYS_wC&oi=fnd&pg=PR9&dq=climate+and+society&ots=nuVeuTuOgx&sig=0gA5CvvHVu5J0zADuUlkuXGNCak
Grove, R. H. (2006a). Revolutionary weather: The climatic and economic crisis of 1788–1795 and the discovery of El Niño. In Sustainability or Collapse? (pp. 151–168). The MIT Press. https://doi.org/10.7551/mitpress/6572.003.0013
Grove, R. H. (2006b). The Great El Niño of 1789–93 and its global consequences: Reconstructing an extreme climate event in world environmental history. The Medieval History Journal, 10(1-2), 75–98. https://doi.org/10.1177/097194580701000203
Harper, K. (2019). The fate of Rome: Climate, disease, and the end of an empire. Princeton University Press. https://doi.org/10.1515/9781400888917
Home: NOAA Physical Sciences Laboratory. (n.d.). Retrieved February 17, 2025, from https://psl.noaa.gov/
Hunt, B. G. (2006). The Medieval Warm Period, the Little Ice Age and simulated climatic variability. Climate Dynamics, 27(7-8), 677–694. https://doi.org/10.1007/s00382-006-0153-5
Kovats, R. S., Bouma, M. J., Hajat, S., Worrall, E., & Haines, A. (2003). El Niño and health. Lancet, 362(9394), 1481–1489. https://doi.org/10.1016/S0140-6736(03)14695-8
McEvedy, C., & Jones, R. (1978). Atlas of world population history. Facts on. https://doi.org/10.5555/19792702472
Michaelsen, J., & Thompson, L. G. (1992). A comparison of proxy records of El Niño/Southern Oscillation. EL Niño. Historical and Paleoclimatic Aspects of the Southern Oscillation, 323–348. https://pascal-francis.inist.fr/vibad/index.php?action=getRecordDetail&idt=6500852
National Centers for Environmental Information (NCEI). (n.d.). Paleo Data Search. Retrieved February 13, 2025, from https://www.ncei.noaa.gov/access/paleo-search/
Otto‐Bliesner, B. L., & Stevenson, S. (2018). ENSO’s changing influence on temperature, precipitation, and wildfire in a warming climate. https://doi.org/10.1029/2018GL079022
Philander, G. (1989). El Niño and La Niña. American Scientist. https://www.jstor.org/stable/27855934
Prieto, M. del R., & García Herrera, R. (2009). Documentary sources from South America: Potential for climate reconstruction. Palaeogeography, Palaeoclimatology, Palaeoecology, 281(3-4), 196–209. https://doi.org/10.1016/j.palaeo.2008.07.026
Quinn, W. H., Neal, V. T., & Antunez De Mayolo, S. E. (1987). El Niño occurrences over the past four and a half centuries. Journal of Geophysical Research, 92(C13), 14449–14461. https://doi.org/10.1029/jc092ic13p14449
Reserve Bank of India. (n.d.). Retrieved February 18, 2025, from https://www.rbi.org.in/
Steiger, N. J., Steig, E. J., Dee, S. G., & Roe, G. H. (2017). Climate reconstruction using data assimilation of water isotope ratios from ice cores. https://doi.org/10.1002/2016JD026011
The Clarendon Press, Oxford. (1907). The Imperial Gazetteer Of India Vol-iii The Indian Empire Economic. https://archive.org/details/in.ernet.dli.2015.207356
Yeh, S.-W., Kug, J.-S., Dewitte, B., Kwon, M.-H., Kirtman, B. P., & Jin, F.-F. (2009). El Niño in a changing climate. Nature, 461(7263), 511–514. https://doi.org/10.1038/nature08316
Zheng, J., Xiao, L., Fang, X., Hao, Z., Ge, Q., & Li, B. (2014). How climate change impacted the collapse of the Ming dynasty. Climatic Change, 127(2), 169–182. https://doi.org/10.1007/s10584-014-1244-7
Acknowledgement
I would like to thank:
Dr. Shawn Marshall, from Environment and Climate Change Canada, for his mentorship and support thus far
Dr. Garcia, from Webber Academy, for her help thourghout the project