An In Silico Approach to Mine Mimotopes from the Gut Microbiome that Trigger Type 1 Diabetes Mellitus
Ashank Chaturvedi Joel Zou
Grade 11
Presentation
Problem
Type 1 Diabetes Mellitus is an autoimmune disorder that is idiopathic, meaning that it currently has no known cause. In recent times, the gut microbiome has become increasingly prevalent in health research, due to the major role that it plays on overall human health. This study aims to make a connection between the bacteria present in the gut microbiome, and the development of Type 1 Diabetes, by investigating the metabolic pathways bacteria in the gut microbiome inhabit, and if they could be producing mimotopes, which are structurally similar or identical epitopes on antigens released by bacteria that mimic the antigens of cells from our body. In this context, this would be mimicking the epitope on the antigen released by pancreatic β-cells. Mimotopes can be the metabolite of a metabolic pathway that these bacteria undertake. We hope to identify the metabolic pathways at play by the bacteria from gut microbiomes of Type 1 Diabetic patients, so that we can identify what pathways are most likely to be involved with its development, and thus discover how it could be mitigated or identified before development.
Method
Fecal samples from children enrolled in the publicly available DIABIMMUNE study conducted in 2016 were utilized for our research project.1 The DIABIMMUNE study analyzed the hygiene hypothesis, which briefly states that increased diseases and detrimental conditions in the immune system have a direct correlation with decreased exposure to microorganisms1. This investigation focused on the portion of the DIABIMMUNE study which looked at the presence of certain bacteria in the gut microbiome of mice and the development of Type 1 Diabetes Mellitus (T1D). For this portion of the study, fecal samples were collected from various children from Estonia and Finland who had a genetic predisposition, and thus, a higher susceptibility to developing T1D.1 Some of the children in the study developed islet autoantibodies, which is referred to as seroconversion, while others did not. The fecal samples were accordingly separated into seroconverted and non-seroconverted. The bacteria present in the fecal samples were grown in a bioreactor that mimics the human gut conditions (“robogut”) and created two bacterial groups: the seroconverted and the non-seroconverted.1 Bacteria from both groups were cultivated on a Petri dish and whole-genome sequencing (WGS) was performed on the bacteria. The genomes of the bacteria were assembled using the Unicycler assembler.1 To infer the metabolic pathways and enzymatic reactions, the Distilled and Refined Annotation of Metabolism (DRAM)2 software was used to assess the difference between both consortia. DRAM produced many output files that were analyzed in this investigation.
To further understand the genetic and metabolic components that differed between the seroconverted and the non-seroconverted designed consortia, the DRAM2 output files were analyzed separately. The DRAM files from the seroconverted consortia were marked by “S” and data files from the non-seroconverted consortia were marked by “NS”. The converted data was in the comma-separated values (CSV) file format with six different CSV files for each sample. The six different files were based on the annotation method done, which included: carbon utilization, rRNA, tRNA, transporters, energy, and organic nitrogen. Additionally, all files had a three-digit sample identifier number, corresponding to the bacterial sample it was from.
A python script coded in Python 3.123 using the JupyterLab IDE4 was generated that takes the output metabolic pathways files as input and then produces a set of files showing the user the differences between the ‘seroconverted’ vs the ‘non-seroconverted’ consortia. The program first prompts the user to enter the local path of the input files for analysis. Then, using the OS module, it identifies the location of the folder and its corresponding files. Following this, regular expressions and the OS module are used to identify every unique Excel file by its three-digit code and NS and S identifiers. Within the Excel files, each tab was split into separate tab-separated value (TSV) files using the PANDAS5 library in Python3. The TSVs were then renamed according to their specific parameter, which refers to which of the original six files for each sample that the data came from, three-digit code, and S vs. NS marker using the PANDAS5 package. Some cells within each TSV file did not have any numerical value, suggesting a lack of identifiable data for that specific reaction or metabolic pathway. To prevent any confounding effect, a “N/A” was placed in all empty cells of the TSV files using the PANDAS5 package.
Following the generation of the TSV files, the PANDAS5 package and the tolist functions were used to identify each unique entry for each parameter, which was then placed into two separate dictionaries (a data structure in Python3 that has items with keys and values), based on whether it came from a seroconverted or non-seroconverted file, and placed into one final, compiled TSV file for each parameter. The key functions as an identifier, for whether the relevant information is for a seroconverted or non-seroconverted file. This allows for quick and efficient data sorting so that the final TSV files require fewer data structures thus optimizing the script.
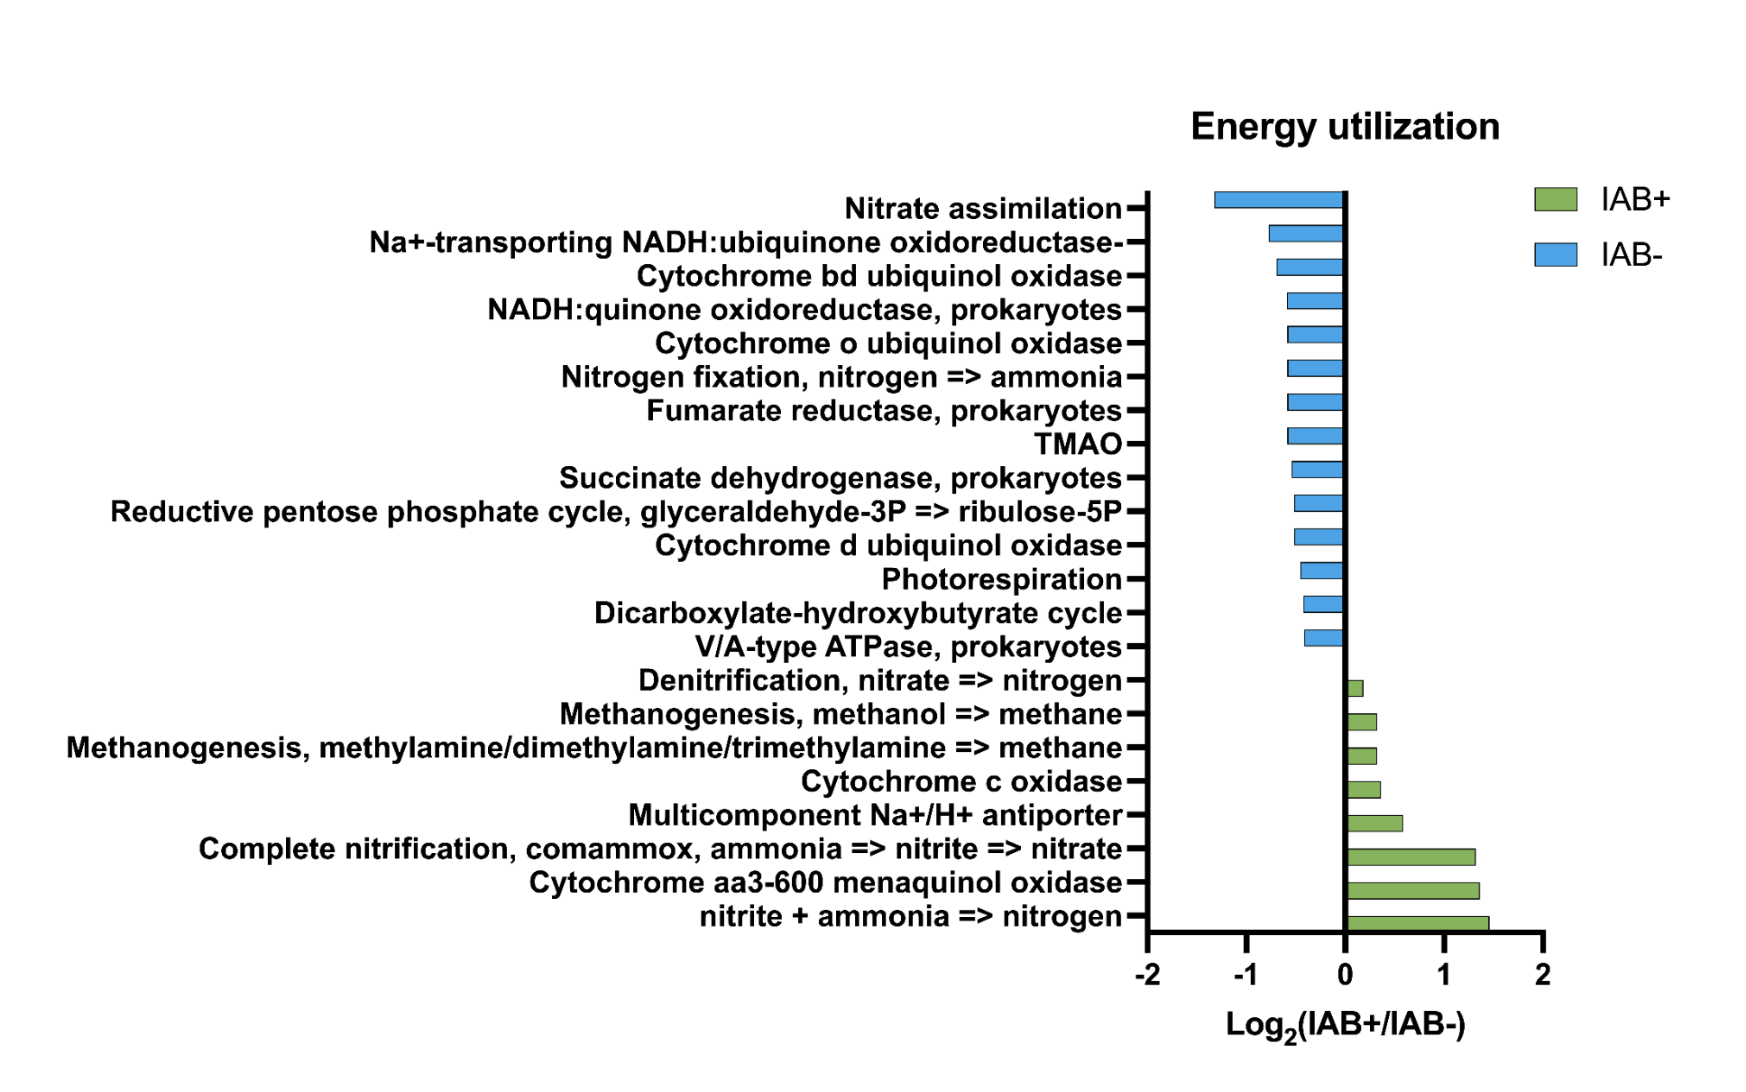
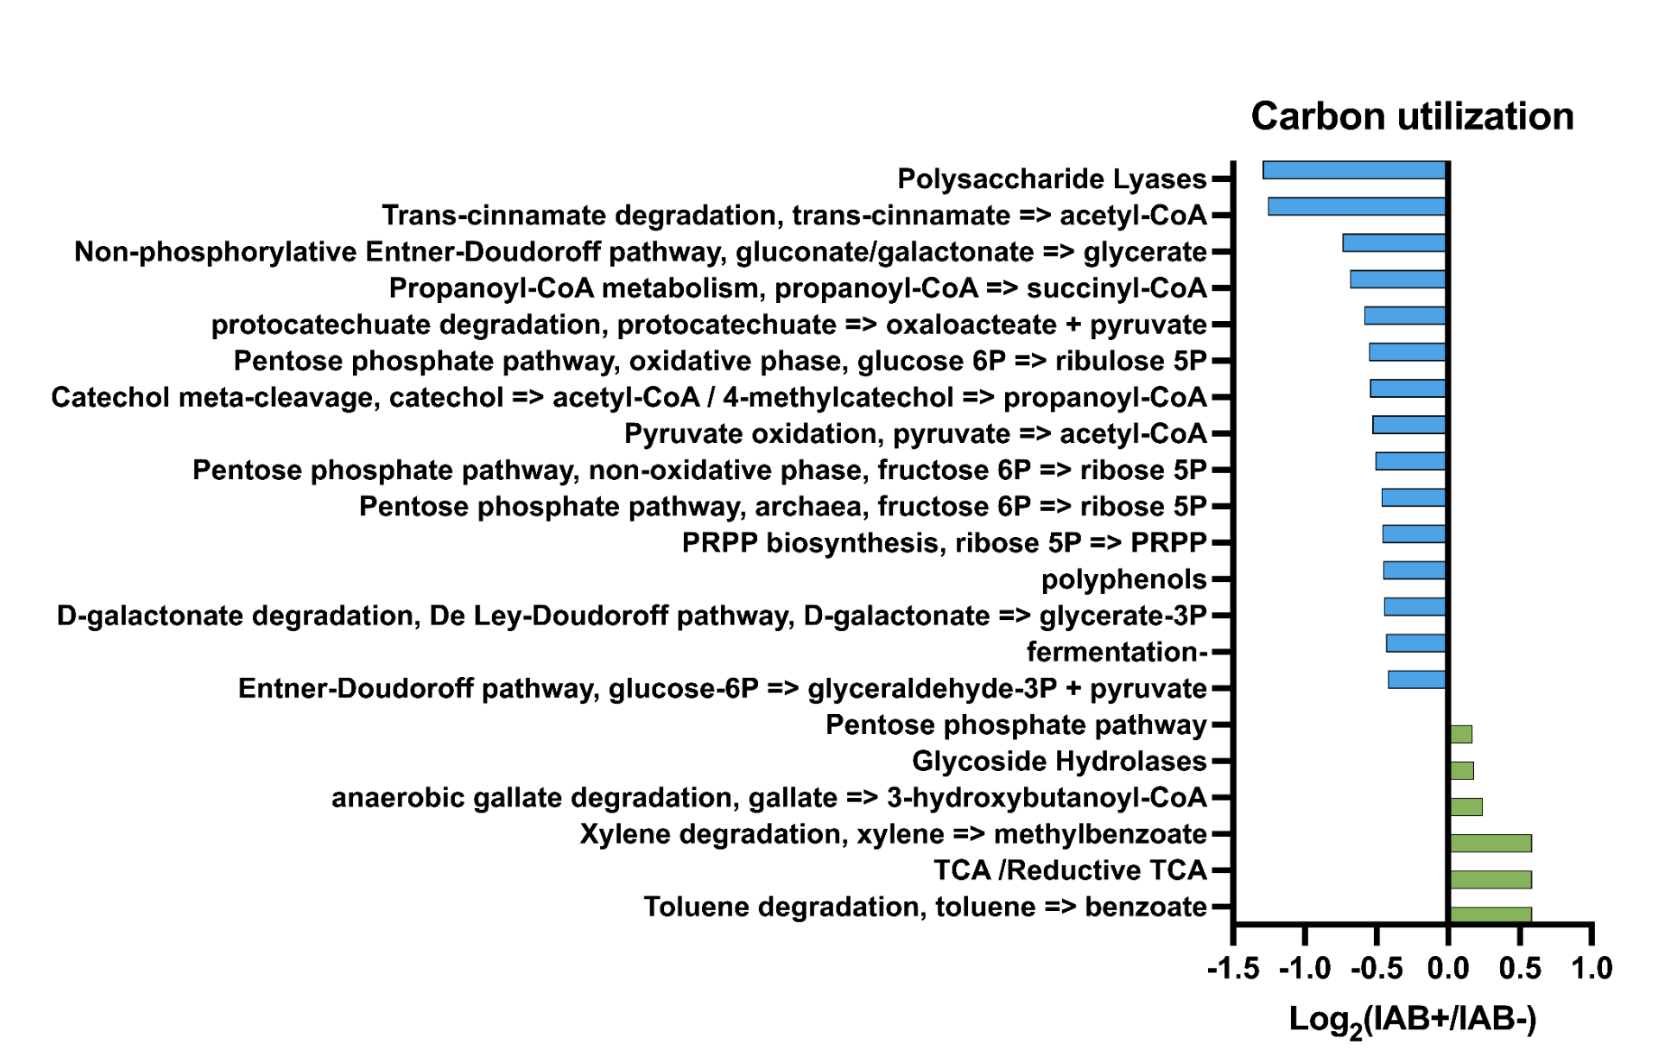
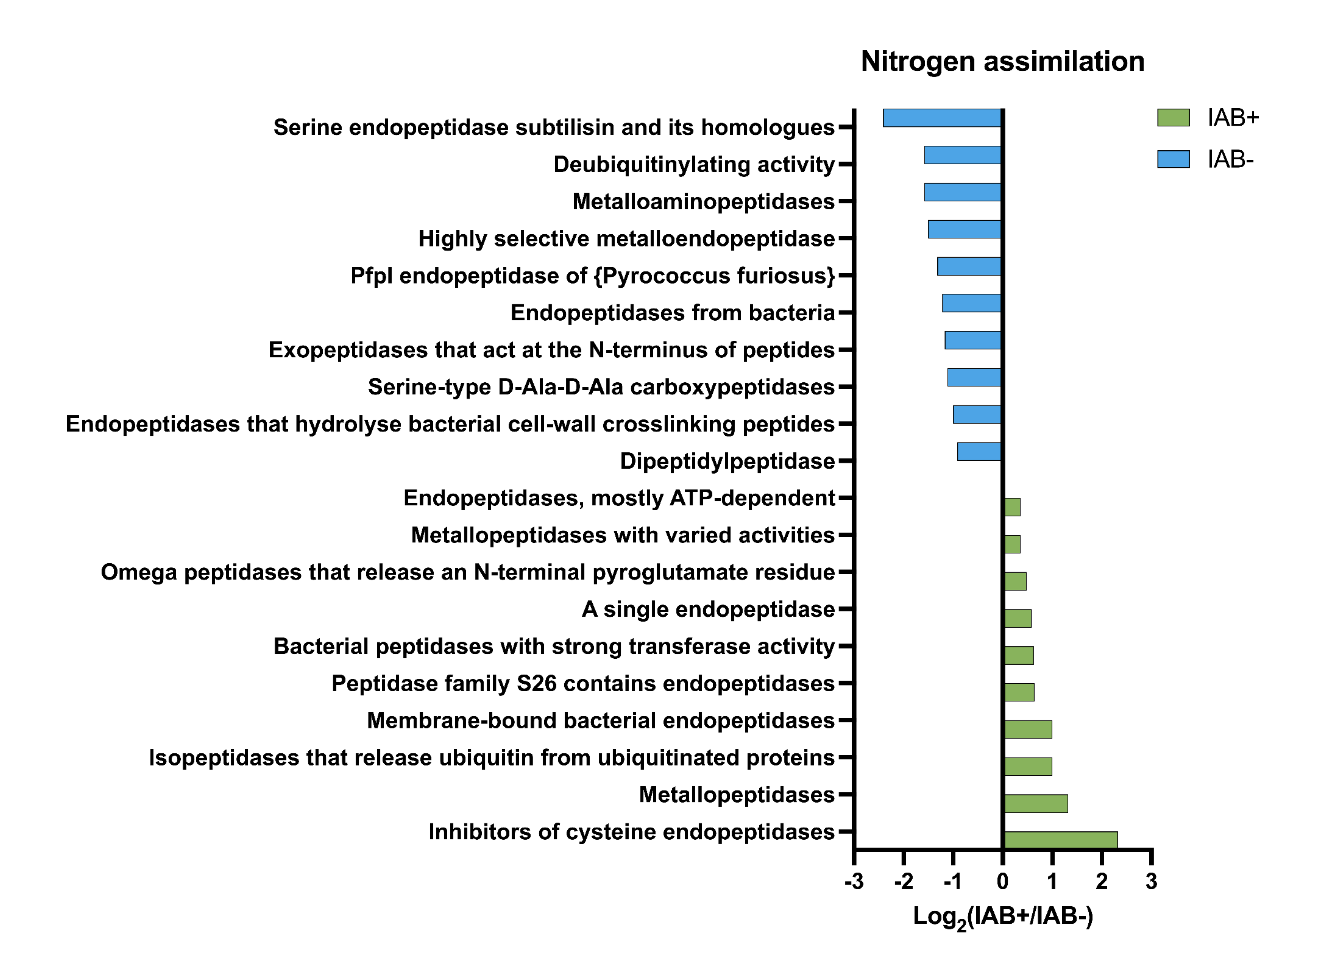
The program utilizes the collections package in Python3 to make counters to count the number of occurrences of “S-hits”, which are the number of occurrences of that specific item in the seroconverted files, and “NS-hits”, which are the number of occurrences of that specific item in the non-seroconverted files, as well as the specific file names from which each entry was found. The ratio between seroconverted hits and non-seroconverted hits is calculated by dividing the two and sorting them in numerical order. The calculated difference between seroconverted and non-seroconverted hits, derived by dividing "S-hits" by "NS-hits," describes whether a metabolic reaction is more likely to be found in the seroconverted community. This ratio was then sorted by using the PANDAS5 data package provided from most substantial ratio to least. Matplotlib was used to generate bar graphs of the most meaningful ratios calculated by the program.6 This graph allows the user to see the most likely metabolic pathways at play in the development of T1D. Positive ratios from the graphs indicate a pathway that could be involved with the development of T1D, and these pathways will be further analyzed to determine their connection with T1D. Negative ratios will be analyzed to determine if potential treatments could be found by manipulating certain pathways or inhibiting bacteria.
Our program is pasted in the Data Section.
Research
Type 1 Diabetes Mellitus (T1D) is an endocrine disorder characterized by the autoimmune destruction of pancreatic β-cells, leading to the cessation of insulin production.1 The CD4+ and CD8+ autoimmune T-cells are responsible for the destruction of the pancreatic β-cells.2 T1D presents itself in three main stages: (i) the initial destruction of the pancreatic cells with no apparent symptoms, (ii) the presence of hyperglycemia, and (iii) hyperglycemia, destruction of beta-cells, as well as the presence of polydipsia, polyuria, and weight loss3. Along with the previously listed symptoms, a short-term effect of T1D is diabetic ketoacidosis, and long-term effects include micro and macrovascular diseases.3 Certain autoantibodies – antibodies reacting with self-antigens - indicate an elevated risk of T1D progression.3,4 In other words, these autoantibodies mistakenly attack the pancreatic β-cells which are responsible for the production of insulin.4 Individuals who are positive with glutamic acid decarboxylase (GAD), islet cell tyrosine phosphatase 2 (IA2), islet cell (ICA), insulin (IAA), and/or zinc transporter 8 (ZnT8) autoantibodies have upwards of a 50% higher chance of T1D development.3 The presence of these autoantibodies in the diagnosis of T1D is meaningful as they function as a diagnostic marker when symptoms may not be present or showing fully.3
The prevalence of T1D for the general worldwide population is 0.4% but accounts for more than 5% across all diabetes patients.3 Incidence peaks have been recorded in younger children and adolescents early in puberty (typically between the ages of 5 and 14).3 The incidence worldwide is considered to be 15 per 100,000 population per year,5 and it has been increasing worldwide when compared to previous decades.5 A geographical correlation has been previously observed with the incidence global index increasing by 34% in the past 20 years, with those of European descent most likely to be affected by the disease.1 A child of European descent is 400 times more likely to get the disease compared to a child of Latin American descent.2 Genetic predisposition, particularly in first-degree relatives, is another risk factor of particular importance.3 Children of fathers with T1D are at higher risk than children of mothers with T1D, with incidence rates being substantially higher, ranging from a 6% increase for siblings of those with T1D to a 70% increase for monozygotic twins.3
To date, there is no known cause of T1D, which has led some researchers to question if environmental factors may affect the development of T1D.1 Previous studies have correlated several factors to an early onset of T1D. Indeed, some of these factors include the early introduction to cow’s milk, an absence of breastmilk, early introduction to cereals and gluten, and vitamin D supplementation during infancy, amongst others.1 Some research groups believe that mimotopes, also known as molecular mimicry, could be involved in the development of the disease.6 Overall, bacteria release metabolites and have external receptors that are recognized by the human’s immune cells, and the epitopes are a specific region that binds directly to the peptide groves of T-cell receptors for priming and self-activation.6 The major histocompatibility complex II (MHC-II) is a family of receptors found in various immune cells, including dendritic cells.6 These receptors bind to the epitope and report to T-cells, triggering an autoimmune response.6 Mimotopes are naturally occurring similar antigens that are produced by microbial cells.6 These antigens are recognized by immune cells in the body, which causes an autoimmune response leading to diseases, such as rheumatoid arthritis.7 In this example, autoantibodies produced by the expression of co-stimulatory molecules cause an autoimmune response from T-Cells, leading to symptoms such as synovial inflammation, erosion of bones and cartilage, loss of body weight, and development of rheumatoid nodules.7
The gut microbiome is a large and complex network that harbours thousands of microorganisms which play an essential role in human health as well as the development of various diseases (i.e liver conditions, diabetes, inflammatory bowel disease, autoimmune disorders, colorectal cancer, and central nervous system diseases).8 On the other hand, the gut microbiome harbours numerous beneficial organisms essential for nutrient absorption, fermenting fibre to produce short-chain fatty acids, vitamin synthesis, detoxification and regulating the immune system.8,9 Previous studies have stated that there is a high chance of the gut microbiome potentially relating to the development of T1D.8 In this case, we believe mimotopes produced in the gut microbiome may have a role in the development of T1D. Metabolic pathways of these bacteria of the gut microbiome have distinct processes and components.10 These metabolic pathways are how these bacteria take in matter from their environment to complete necessary processes and energy conversion to survive.10 One such metabolic pathway is glycolysis, which describes how glucose molecules are broken down by enzymes to create energy and can help with differentiating between bacteria that could be associated with the development of T1D by looking at the metabolic pathways present in these bacteria.10
The relationship between the gut microbiome and T1D is now more easily explorable due to the development of sequencing and technology in immunology.8 The development of Next Generation Sequencing (NGS) such as Illumina has increased the speed of sequencing and allows for all the DNA of the microbes present in the gut microbiome to be sequenced and studied.8 The genomes of bacteria are important to be studied as they provide the full picture of all the genes present in the bacteria, which includes their function and how they differ between different bacteria8. Similarly, bioinformatics software has allowed users to infer metabolic pathway differences between cohorts of bacteria, allowing the scientific community to have a better understanding of biochemical signalling that could play a role in various diseases, T1D included.8 The data collected by NGS can then be used in genome assembly with software like DRAM.11 Genome assembly is the process of deciphering and organizing small components of a DNA sequence obtained from a sequencing approach, in an adequate representation.8 Having a full genome gives a comprehensive detail of metabolic pathways and other relevant information about the bacteria in the microbiome and specific metabolic processes within bacteria that create mimotopes that could play a role in the development of T1D.8
Data
import pandas as pd
import os
from collections import Counter, defaultdict
import re
import matplotlib.pyplot as plt
def find_3_digit_number(input_string):
pattern = re.compile(r'\d{3}')
match = re.search(pattern, input_string)
return match.group() if match else None
def process_excel_file(file_path, output_folder, data_counters, file_contributions):
if "_NS" in file_path:
sero = "NS"
else:
sero = "S"
sheetnames = ["MISC", "carbon utilization", "Transporters", "Energy", "Organic Nitrogen", "carbon utilization (Woodcroft)", "tRNA", "rRNA"]
gene_id_data = []
module_data = []
for sheet_name in sheetnames:
df = pd.read_excel(file_path, sheet_name=sheet_name)
df = df.fillna("N/A")
# Extract module, header, subheader, and other columns
module_column = df["module"].tolist()
header_column = df["header"].tolist()
subheader_column = df["subheader"].tolist()
assembly_column = df["assembly"].tolist()
# Filter out modules containing parentheses and with assembly value not equal to 1
module_data = [
(module, header, subheader)
for module, header, subheader, assembly in zip(module_column, header_column, subheader_column, assembly_column)
if "(" not in module and assembly == 1
]
# Update counters for module
data_counters["module"][sero].update([module for module, _, _ in module_data])
# Update file contributions for module
for module, header, subheader in module_data:
file_contributions["module"][sero][module].append(file_path)
# Specify the output file path for module
module_output_file_path = os.path.join(output_folder, f"{sheet_name}_module_counts.tsv")
# Write module data to the output file
with open(module_output_file_path, "w") as module_output_file:
module_output_file.write(f"module\tS-Hits\tS-Hit_Files\tNS-Hits\tNS-Hit_Files\tCumulative-Hits\tRatio\n") # Header
for value in set(module_column):
s_hits = data_counters["module"]["S"].get(value, 0)
ns_hits = data_counters["module"]["NS"].get(value, 0)
cumulative_hits = s_hits + ns_hits
if ns_hits == 0:
ratio = "N/A"
else:
ratio = s_hits / ns_hits
s_hit_files = ', '.join(file_contributions["module"]["S"][value])
ns_hit_files = ', '.join(file_contributions["module"]["NS"][value])
module_output_file.write(f"{value}\t{s_hits}\t{s_hit_files}\t{ns_hits}\t{ns_hit_files}\t{cumulative_hits}\t{ratio}\n")
# Extract gene_id, gene_description, and other columns
gene_id_column = df["gene_id"].tolist()
gene_description_column = df["gene_description"].tolist()
module_column = df["module"].tolist()
header_column = df["header"].tolist()
subheader_column = df["subheader"].tolist()
assembly_column = df["assembly"].tolist()
# Filter out gene_ids containing parentheses and with assembly value not equal to 1
gene_id_data = [
(gene_id, gene_description)
for gene_id, gene_description, assembly in zip(gene_id_column, gene_description_column, assembly_column)
if "(" not in gene_id and assembly == 1
]
# Update counters for gene_id
data_counters["gene_id"][sero].update([gene_id for gene_id, _ in gene_id_data])
# Update file contributions for gene_id
for gene_id, gene_description in gene_id_data:
file_contributions["gene_id"][sero][gene_id].append(file_path)
# Specify the output file path for gene_id
gene_id_output_file_path = os.path.join(output_folder, f"{sheet_name}_gene_id_counts.tsv")
# Write gene_id data to the output file
with open(gene_id_output_file_path, "w") as gene_id_output_file:
gene_id_output_file.write("gene_id\tgene_description\tS-Hits\tS-Hit_Files\tNS-Hits\tNS-Hit_Files\tCumulative-Hits\tRatio\n") # Header
for value in set(gene_id_column):
s_hits = data_counters["gene_id"]["S"].get(value, 0)
ns_hits = data_counters["gene_id"]["NS"].get(value, 0)
cumulative_hits = s_hits + ns_hits
if ns_hits == 0:
ratio = "N/A"
else:
ratio = s_hits / ns_hits
s_hit_files = ', '.join(file_contributions["gene_id"]["S"][value])
ns_hit_files = ', '.join(file_contributions["gene_id"]["NS"][value])
gene_id_output_file.write(f"{value}\tN/A\t{s_hits}\t{s_hit_files}\t{ns_hits}\t{ns_hit_files}\t{cumulative_hits}\t{ratio}\n")
return gene_id_data, module_data
def process_excel_files_in_folder(input_folder_path, output_folder_path):
data_counters = {
"gene_id": {"S": Counter(), "NS": Counter()},
"module": {"S": Counter(), "NS": Counter()},
"header": {"S": Counter(), "NS": Counter()},
"subheader": {"S": Counter(), "NS": Counter()},
"assembly": {"S": Counter(), "NS": Counter()}
}
file_contributions = {
parameter: {"S": defaultdict(list), "NS": defaultdict(list)}
for parameter in data_counters.keys()
}
gene_id_data = []
module_data = []
files = [f for f in os.listdir(input_folder_path) if os.path.isfile(os.path.join(input_folder_path, f))]
for file in files:
if file.endswith(".xlsx") or file.endswith(".xls"):
file_path = os.path.join(input_folder_path, file)
gene_id, module = process_excel_file(file_path, output_folder_path, data_counters, file_contributions)
gene_id_data.extend(gene_id)
module_data.extend(module)
# Generate graphs for gene_id
for sheet_name in ["MISC", "carbon utilization", "Transporters", "Energy", "Organic Nitrogen", "carbon utilization (Woodcroft)", "tRNA", "rRNA"]:
# Read the gene_id_counts.tsv file into a DataFrame
gene_id_df = pd.read_csv(os.path.join(output_folder_path, f"{sheet_name}_gene_id_counts.tsv"), sep='\t')
# Remove rows with N/A in the Ratio column
gene_id_df = gene_id_df[gene_id_df['Ratio'] != 'N/A']
# Convert the Ratio column to numeric for sorting
gene_id_df['Ratio'] = pd.to_numeric(gene_id_df['Ratio'])
# Sort by ratio in descending order
gene_id_df = gene_id_df.sort_values(by=['Ratio'], ascending=False)
# Select the top 20 unique gene_ids
top_20_gene_id_df = gene_id_df.drop_duplicates(subset=['gene_id']).head(20)
# Plotting the top 20 gene_ids
plt.figure(figsize=(10, 6))
plt.bar(top_20_gene_id_df['gene_id'], top_20_gene_id_df['Ratio'], color='blue')
plt.xlabel('Gene IDs')
plt.ylabel('Ratio')
plt.title(f'Top 20 Unique Gene IDs by Ratio for {sheet_name} (Sorted from Greatest to Lowest)')
plt.xticks(rotation=90)
plt.show()
# Select the bottom 20 unique gene_ids
bottom_20_gene_id_df = gene_id_df.drop_duplicates(subset=['gene_id']).tail(20)
# Sort by ratio in ascending order
bottom_20_gene_id_df = bottom_20_gene_id_df.sort_values(by=['Ratio'], ascending=True)
# Plotting the bottom 20 gene_ids
plt.figure(figsize=(10, 6))
plt.bar(bottom_20_gene_id_df['gene_id'], bottom_20_gene_id_df['Ratio'], color='red')
plt.xlabel('Gene IDs')
plt.ylabel('Ratio')
plt.title(f'Bottom 20 Unique Gene IDs by Ratio for {sheet_name} (Sorted from Lowest to Greatest)')
plt.xticks(rotation=90)
plt.show()
print(f"\nSheet: {sheet_name}\n")
print("Top 20 Gene IDs:")
print(top_20_gene_id_df[['gene_id', 'Ratio']])
print("\nBottom 20 Gene IDs:")
print(bottom_20_gene_id_df[['gene_id', 'Ratio']])
# Generate graphs for module
for sheet_name in ["MISC", "carbon utilization", "Transporters", "Energy", "Organic Nitrogen", "carbon utilization (Woodcroft)", "tRNA", "rRNA"]:
# Read the module_counts.tsv file into a DataFrame
module_df = pd.read_csv(os.path.join(output_folder_path, f"{sheet_name}_module_counts.tsv"), sep='\t')
# Remove rows with N/A in the Ratio column
module_df = module_df[module_df['Ratio'] != 'N/A']
# Convert the Ratio column to numeric for sorting
module_df['Ratio'] = pd.to_numeric(module_df['Ratio'])
# Sort by ratio in descending order
module_df = module_df.sort_values(by=['Ratio'], ascending=False)
# Select the top 20 unique modules
top_20_module_df = module_df.drop_duplicates(subset=['module']).head(20)
# Plotting the top 20 modules
plt.figure(figsize=(10, 6))
plt.bar(top_20_module_df['module'], top_20_module_df['Ratio'], color='green')
plt.xlabel('Module IDs')
plt.ylabel('Ratio')
plt.title(f'Top 20 Unique Module by Ratio for {sheet_name} (Sorted from Greatest to Lowest)')
plt.xticks(rotation=90)
plt.show()
# Select the bottom 20 unique modules excluding rows with N/A in the Ratio column
bottom_20_module_df = module_df.drop_duplicates(subset=['module']).tail(20)
bottom_20_module_df = bottom_20_module_df[bottom_20_module_df['Ratio'] != 'N/A']
# If there are less than 20 valid rows, adjust the selection
if len(bottom_20_module_df) < 20:
bottom_20_module_df = module_df.drop_duplicates(subset=['module']).tail(20 - len(bottom_20_module_df))
bottom_20_module_df = bottom_20_module_df[bottom_20_module_df['Ratio'] != 'N/A']
# Sort by ratio in ascending order
bottom_20_module_df = bottom_20_module_df.sort_values(by=['Ratio'], ascending=True)
# Plotting the bottom 20 modules
plt.figure(figsize=(10, 6))
plt.bar(bottom_20_module_df['module'], bottom_20_module_df['Ratio'], color='orange')
plt.xlabel('Module IDs')
plt.ylabel('Ratio')
plt.title(f'Bottom 20 Unique Module by Ratio for {sheet_name} (Sorted from Lowest to Greatest)')
plt.xticks(rotation=90)
plt.show()
print(f"\nSheet: {sheet_name}\n")
print("Top 20 Modules:")
print(top_20_module_df[['module', 'Ratio']])
print("\nBottom 20 Modules:")
print(bottom_20_module_df[['module', 'Ratio']])
# Prompt the user to input the folder containing Excel files
input_folder_path = input("Enter the path to the folder containing Excel files: ")
# Prompt the user to input the folder where TSV files and the output parameter files will be saved
output_folder_path = input("Enter the path to the folder where TSV files and the parameter files will be saved: ")
# Process Excel files in the specified folder and save TSV files to the output folder
process_excel_files_in_folder(input_folder_path, output_folder_path)
Conclusion

- Pathways in bacterial samples have been seen in T1D in previous studies
- Hypothesis supported: We found differences in the metabolic pathways in the samples, which also correlated with previous findings in T1D
- Significance
- Higher understanding of T1D development
- A better understanding of mimotopes
- Able to create therapies and preventative measures to prevent the development of T1D
Citations
1. Kostic AD, Gevers D, Siljander H, et al. The Dynamics of the Human Infant Gut Microbiome in Development and in Progression toward Type 1 Diabetes. Cell Host Microbe. 2015;17(2):260-273. doi:10.1016/j.chom.2015.01.001
2. Hebert SL, Nair KS. Protein and energy metabolism in type 1 diabetes. Clin Nutr. 2010;29(1):13-17. doi:10.1016/j.clnu.2009.09.001
3. Aharon-Hananel G, Romero-Afrima L, Saada A, Mantzur C, Raz I, Weksler-Zangen S. Cytochrome c Oxidase Activity as a Metabolic Regulator in Pancreatic Beta-Cells. Cells. 2022;11(6). doi:10.3390/cells11060929
4. Oelze M, Schuhmacher S, Daiber A. Organic nitrates and nitrate resistance in diabetes: the role of vascular dysfunction and oxidative stress with emphasis on antioxidant properties of pentaerithrityl tetranitrate. Exp Diabetes Res. 2010;2010:213176. doi:10.1155/2010/213176
5. Chai J, Sun Z, Xu J. A Contemporary Insight of Metabolomics Approach for Type 1 Diabetes: Potential for Novel Diagnostic Targets. Diabetes Metab Syndr Obes. 2022;15:1605-1625. doi:10.2147/DMSO.S357007
6. Hinder LM, Vivekanandan-Giri A, McLean LL, Pennathur S, Feldman EL. Decreased glycolytic and tricarboxylic acid cycle intermediates coincide with peripheral nervous system oxidative stress in a murine model of type 2 diabetes. J Endocrinol. 2013;216(1):1-11. doi:10.1530/JOE-12-0356
7. Skibowska A, Raszeja-Specht A, Szutowicz A. Platelet function and acetyl-coenzyme A metabolism in type 1 diabetes mellitus. Clin Chem Lab Med. 2003;41(9):1136-1143. doi:10.1515/CCLM.2003.176
8. Gharagozlian S, Svennevig K, Bangstad HJ, Winberg JO, Kolset SO. Matrix metalloproteinases in subjects with type 1 diabetes. BMC Clin Pathol. 2009;9:7. doi:10.1186/1472-6890-9-7
Acknowledgement
We want to acknowledge our mentor, Dr. Castaneda Mogollon from the Sycruo Lab at the University of Calgary for assisting us and providing guidance throughout this project. We want to also acknowledge Dr. Garcia, our teacher who organized this course for being able to undertake this project and guiding us throughout the year. Lastly, we want to acknowledge the University of Calgary for presenting this opportunity to us and allowing us to use their facilities.