Phylogenetic Study of Contemporary Mainland Southeast Asian Populations Using Single Nucleotide Polymorphisms (SNP)
Aaron George
North Trail High School
Grade 11
Presentation
No video provided
Problem
Ethnolinguistic Diversity in Mainland Southeast Asia and the Underrepresentation of the Southeast Asian Genome
Mainland Southeast Asia (MSEA) constitutes one of the highest concentrations of ethnolinguistic and genetic diversity across all of the Asia-Pacific region, reflected through the constant waves of migration, admixture, and trade experienced by the region throughout thousands of years (Changmai et al., 2022). Since 200 BC, traders and merchants from Southern India, Sri Lanka, and China established routes connecting East Asia, Southeast Asia, and South Asia, leading to the development of powerful empires and states such as the Ayutthaya Kingdom (1351), or the Khmer Empire (802). Hence, the contact of ancient Southeast Asians with their East and South Asian counterparts has led to the substantial genetic diversity seen today in the ethnic groups of contemporary MSEA, resulting in the wide range of phenotypes and heterogeneity expressed in countries like Thailand, Cambodia, Vietnam, etc.
Despite this rich genetic diversity prevalent in the region, Southeast Asian genomic data is alarmingly underrepresented in global genome databases (Sasongko et al., 2025), often dominated by West Eurasian genomic data instead, seen through the way Southeast Asian genomes are only represented in approximately 3% of population health studies, hence hindering population and medical genetics research in the field, despite Southeast Asia being one of the most densely-populated regions in the world with a high amount of ethnolinguistic diversity amongst the demographics of Southeast Asian nations.
Utilizing the power of single nucleotide polymorphisms (SNP), a common single variation at a given location in a genome which is crucial for tracking genetic markers along lineages, is it possible to gain a more insightful understanding into the contemporary MSEAN genome and the genetic distance between MSEAN ethnic groups in proportion to other Asia-Pacific populations? Through tracking variations amongst nucleotides in alleles, responsible for a wide variety of morphological and health-related phenotypes, including SNPs which control the body's ability to metabolize certain chemicals, or the structural components of bodily features such as the nasal dorsum or hair follicles, is it possible to determine which lineages share certain common ancestral lineages, and hence track human migration into Mainland Southeast Asia?
Method
Phylogenetic & Dimensionality Analysis of Asia-Pacific Region Populations
Data Collection of Single Nucleotide Polymorphism Data
Single nucleotide polymorphism data (SNP) was obtained from large genomic databases such as Ensembl and the SNPedia, alongside data from research institutes like the Fondation Jean-Dausett. A variety of SNPs were intentionally chosen based on high allele frequency variance/heterozygosities in order to accurately distinguish certain ethnic groups from each other, such rs1426654, an ancestry informative genetic marker which affects skin pigmentation and differentiates between European-origin and Asian-origin individuals, alongside SNPs reflecting a variety of differing phenotypes, such as rs671, a pleidotropic polymorphism most commonly known for causing the inability to metabolize alcoholic products due to the lack of the mitochondrial enzyme aldehyde dehydrogenase (ALDH2) which breaks down toxic acetaldehyde in the body, hence causing the "Asian flush" in East Asian individuals, as well as affecting cancer susceptibility and cardiovascular disease risk, such as for coronary artery disease (CAD) or acute myocardial infarction. This can be measured through various methods such as calculating the standard deviation of allele frequencies across populations. Taking the example of the SNP rs214247, we may use the standard deviation formula:
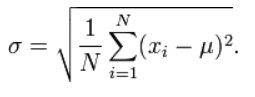 Substituting in the percentages of rs214247 for each given population recorded, there would be a standard deviation of approximately 20.891% percentage points, indicating a relatively higher amount of variation between populations, which are crucial to accurately pinpointing where certain populations are situated in a given evolutionary time period, along with their relations to other groups. SNPs can also be chosen if most populations have an allele frequency of 100%, or 0% for a given SNP, while a few select populations have more variation, which differentiates the select populations from other populations. Choosing SNPs with similar allele frequencies found in all populations indiscriminately would be quantified incorrectly and would make populations appear more similar, therefore they were not elligible for data input.
In total, eight different populations were selected from the Asia-Pacific region in which SNP allele frequencies were sampled from. For the Southeast Asian group, Chinese Dai from Xishuangbanna (CDX) was used to make up for the lack of a Thai/Lao population within the 1000 Genomes Project, and to also represent a broader Kra-Dai group consisting of Thai and Lao populations. Cambodian (specifically Khmer) was used to represent ancient Austroasiatic DNA, one of the first ethnolinguistic groups to emerge in Mainland Southeast Asia, along with boasting signficant admixture from southern India and Sri Lanka, and Kinh from Ho Chi Minh City, Vietnam (KHV) was used to represent an Austroasiatic group that has also been substantially influenced by East Asian admixture.
Sri Lankan Tamil in the UK (STU) was used to represent a South Asian Dravidian group that has historically held extensive trading relationships and cultural exchange with Southeast Asian groups, hence fostering genetic exchange in the process, along with Sri Lanka's close proximity to Southeast Asia via maritime routes, and Bengali in Bangladesh (BEB) was selected due to Bangladesh's geographical proximity to Mainland Southeast Asia, alongside being surrounded by various ethnic groups in Northeastern India and Bangladesh itself who are almost genetically identical to multiple other groups in MSEA such as the Chin of Myanmar.
For the East Asian group, Southern Han Chinese, China (CHS) was selected due to the region's proximity to countries such as Laos and Vietnam, alongside being part of the broad Sino-Tibetan ethnolinguistic group, which branches off into the Tibeto-Burman ethnolinguistic group found in parts of MSEA and Northeastern India. Likewise, Han Chinese in Beijing, China (CHB) was introduced due to being part of the same ethnic group as CHS with minor genetic variations due to the difference in environment. Japanese in Tokyo, Japan (JPT) was selected due to a minor influence of Jomon ancestry in the contemporary Japanese individual, which may be compared with Southeast Asian genetics.
Yoruba in Ibadan, Nigeria (YRI) was selected for the outlier group in order to crucially display how groups in the Asia-Pacific cluster distinguish themselves from other populations in other geographical regions, due to the population diverging from Asia-Pacific populations at an early point in history, leading to the most substantial genetic difference between individuals of both regions. In the context of the phylogenetic tree, all the Asia-Pacific origin populations will cluster together closely, with YRI (Yoruba in Ibadan, Nigeria) forming a seperate branch that evolves separately.
Phylogenetic Tree Construction
The allele frequencies of the various SNPs within all of the respective chosen populations were entered into the application POPTREE2, a bioinformatics tool developed by Naoko Takezaki et al., at Kagawa University, to construct phylogenetic trees using the neighbour-joining method, as well as calculating heterozygosities and genetic variation. The rsIDs of 23 SNPs at their particular loci were inputted into the program, along with the allele frequencies of the nine populations: CDX, KHV, CAMBODIAN, BEB, STU, CHS, CHB, JPT, YRI, as well as the amount of chromosomes sampled for each population, which is necessary to accurately assess accuracy and reduce bias, by accounting for the possiblity of interferences such as mutations that may cause certain groups to appear falsely closer or further from another population than it is in reality.
The phylogenetic tree was created horizontally with a scale bar of 0.05, indicating the expected number of substitutions/changes per nucleotide, or the percentage of variation between sequences. This will be in direct proportionality the branch lengths, which indicate the accumulation of genetic changes (nucleotide substitutions), giving an idea of evolutionary time periods within the context of the phylogenetic tree, and allowing inferences to be made on the amount of time it took for certain populations to diverge from each other. Multiple branches stem from a common root, with the common point representing a common ancestor at one point in East Eurasian evolutionary history. Clades within the phylogenetic tree can be from any common ancestor depicted on the visual representation, indicating that populations beyond that specific point share a common ancestor. Nodes occur where an ancestral population branches off, from a man branch, and tips represent the populations themselves. The most closely related populations will be represented as sister taxa, in which two communities are directly connected and diverge by one common node. The least related community, will diverge from the common ancestor at a proportionally earlier period and hence form a separate branch from the other clades represented. Branch lengths depend on the accumulation of genetic changes during an evolutionary period, which may directly correspond with time length or chronology.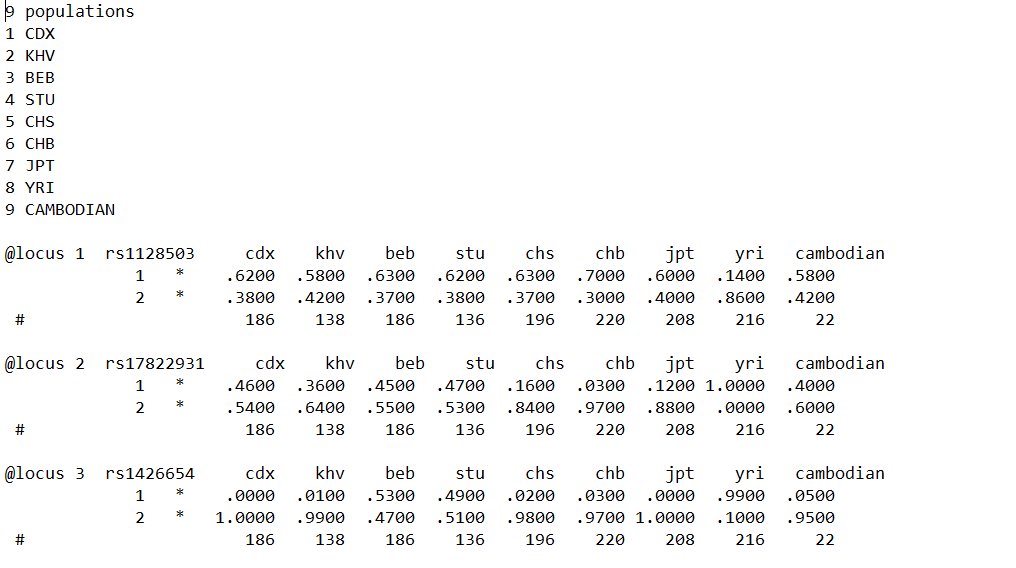 (Table of 3 sampled loci used for phylogenetic analysis with their respective rsIDs and allele frequencies per population.)
PCA Scatterplot Construction
Google Colab was used write the Python code in order to generate a Principal Component Analysis scatterplot with the help of various Python libraries. The allele frequencies of the SNPs and their respective populations were first entered into a Pandas Dataframe before being converted into a CSV file for later manipulation.Two Scikit-learn modules ("sklearn.decomposition" and "sklearn.preprocessing"), parts of the broader machine learning Scikit-learn library, were imported in order to utilize the PCA tools to convert SNP data into a two-dimensional scatterplot graph. The data was then standardized in order to be displayed within the PCA scatterplot through both the x-axis and the y-axis, representing Principal Component 1 (PC1) and Principal Component 2 (PC2) respectively. PC1 represents the most and the largest genetic variation between populations, and PC2 represents the second-most genetic variation between populations. As a result, there is significantly more genetic distance between two populations seen in the x-axis, than between two populations of a similar-looking distance seen on the y-axis. The graph upon creation represents each point as a one population in contradiction to traditional PCA scatterplot usage which quantifies each particular point as an individual within the population. Genetically similar populations will appear to form clusters together, while populations that are distant from other populations will have their particular points further away from each other. By utilizing PCA scatterplots, complex bioinformatic data can be dimensionally reduced, presenting genetic variation in a simplified visual representation.
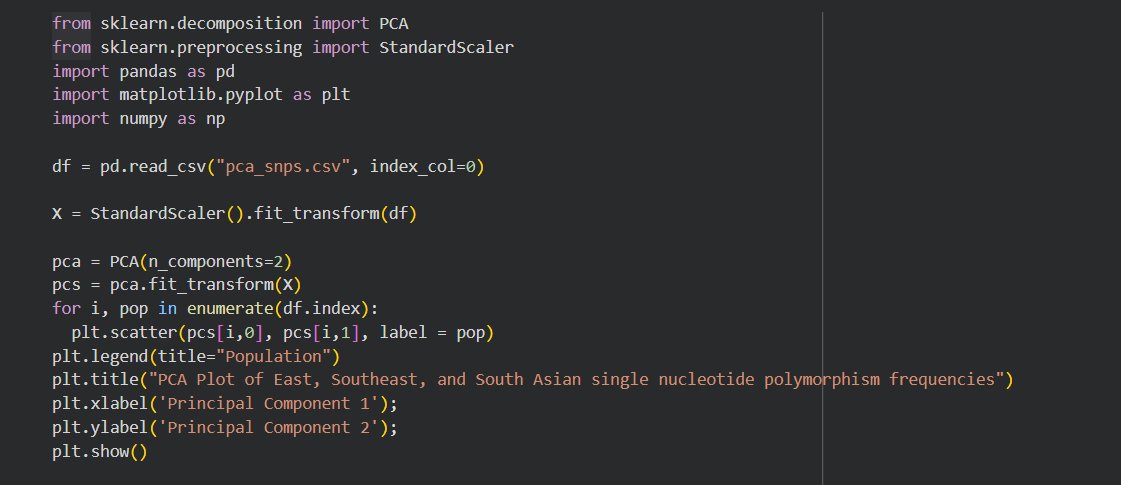 (Sample section of code from PCA Plot construction.)
Research
Background Research: Southeast Asian Ethnolinguistic and Genetic Diversity
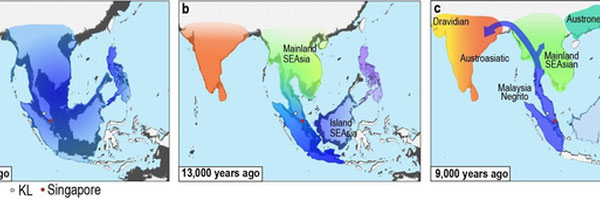
Southeast Asia boasts one of the highest concentrations of ethnolinguistic diversity in the Asia-Pacific region, separated into five distinct ethnolinguistic groups: Austroasiatic (Vietnamese, Khmer), Austronesian (Cham, Jarai), Hmong-Mien (Hmong), Kra-Dai (Thai, Lao), and Sino-Tibetan (Burmese, Karen languages). Archaelogical evidence points to the inhabitation of Mainland Southeast Asia (MSEA) to approximately 50 000 years ago, during the late Pleistocene era, in which Hoabinhian hunter gatherers, primarily located in present-day Thailand, Laos, Cambodia, Vietnam, and Southern China, thrived on the local flora and fauna indigenous to the tropical monsoon/rainforest climate types dominating large portions of the region, displaying the concept of ethnobotany. During the Neolithic period, extending all the way to the Bronze and Iron Ages, these East-Eurasian hunter gatherer groups experienced significant admixture with agriculturalists migrating from neighboring regions such as Southern China, leading to the development of the modern Mainland Southeast Asian. Evidence to ancient Indian/Sri Lankan migration is evident in the discovered remains of Indian artifacts and inscriptions in kingdoms such as Champa and Funan in Cambodia and Southern Vietnam, Pyu city states in Myanmar, the Sukhothai kingdom in Thailand, and Langkasuka in Southern Thailand and Malaysia as a few examples, evidencing the potential introduction of Southern South Asian haplogroups and AASI (Ancient Ancestral South Indian) DNA within MSEAN populations. These Indian/Sri Lankan influences were imperative in constructing the modern culture of MSEA, introducing language scripts, Theravada Buddhism and Hinduism, and literature. Moreover, Dai ethnic groups, such as Thai and Lao populations are believed to hail from distinct Dai ethnic groups residing in Southern China, migrating south due to pressure from the Mongol Empire, mixing with local Indianized Austroasiatic populations such as the Mon and Khmer, leading to both genetic and cultural exchange. The genetic relatedness of MSEAN groups to other populations in Asia-Pacific to both East and certain South Asian groups can be traced back to ancient East-Eurasian DNA as well, in which three ancestral lineages, AASI, ESEA (East and Southeast Asian), and Australasian cluster together closely in comparision to other lineages. Due this convoluted history of admixture and migration around MSEA, a variety of techniques may be used to map out the divergence of contemporary MSEAN populations, as well as their genetic distance in proportion to other ethnic groups around the Asia-Pacific region.
(From Nanyang Technological University)
SNP Analysis (Single Nucleotide Polymorphisms)
In modern genomic databases, East-Eurasian genomic data, including Mainland Southeast Asian populations, is often underrepresented in proportion in comparision to European-origin genomic data. However, there are many potential methods that may be used to map out the genetic data of MSEAN populations. One popular method is through tracking Y-chromosomal DNA, in which patrilineal ancestry (through the father) may be tracked through haplogroups, which are mutations in the Y-chromosomal DNA that indicate certain genetic population groups who share a common ancestor. Similarly, mtDNA (mitochondrial DNA) may also be used to track matrilineal ancestry (through the ovum gamete.) MtDNA does not undergo recombinations, and accumulates mutations at a slower rate, and is often used to track human migration over the course of thousands of years.
However, SNP (Single Nucleotide Polymorphism) data was used instead, due to its ability to create detailed depictions of various population structures, and in this case, easily map out lineages through the use of phylogenetic trees and PCA plots. SNPs are the most common form of genetic variation, where a genome varies from another genome sequence by a single letter in a nucleotide, (e.g. cytosine in the place of thymine.) SNPs occur approximately once in every 1 000 nucleotides, meaning there are over 4 million SNPs in the entire human genome, with SNPs distinguishing and differentiating alleles from each other. These polymorphisms have the ability to control a wide variety of phenotypes, such as in the specific SNP rs671, a pleidotropic polymorphism most renowned for causing the inability to metabolize alcohol due to the lack of the mitochondrial enzyme (aldehyde dehydrogenase) which breaks down toxic acetaldehyde in the body, which hence causes the "Asian flush" in many East Asian origin individuals, as well as affecting cancer susceptibility and the risk of certain cardiovascular diseases such as coronary artery disease (CAD). Such SNPs occur at certain frequencies in populations inhabiting many geographical locations, due to various lifestyle and environmental factors, such as agriculturalist or nomadic practices, leading to the natural selection of certain traits over others, consequently increasing the frequencies of such polymorphisms and alleles. Another notable example is lactose-intolerance in East-Eurasian populations, represented by the SNP rs4988235: due to the tropical monsoon/rainforest climate of Southeast Asian regions, dairy cultivation was not frequent, nor were dairy products an essential component of the Southeast Asian diet, hence individuals without the lactase enzyme, which metabolizes lactose, thrived instead, hence selecting against the presence of the lactase enzyme in a plethora of Mainland Southeast Asian groups.
Genetic relatedness amongst MSEAN groups may be calculated by analyzing what particular SNPs are held at similar frequencies by populations in various geographic locations, specifically by using allele frequencies. (e.g. how common is a particular SNP in a Khmer individual in Cambodia compared to a Tamil individual in Sri Lanka.) This data may be used to qualify individuals as being part of certain ethnic groups, and can be used to quantify the relationship between various ethnic groups. SNPs offer several more benefits in comparision to other methods of analyzing population genetics:
- SNPs can precisely estimate population diversity and admixture.
- SNPs as aforementioned are the most common genetic variation (approximately making up over 90% of sequencing variations in the human genome), hence offer a high volume of data.
- SNPs have the capacity to identify where certain populations cluster.
- SNPs are comparatively easier to manage for mapping out visual representations of genetic distance and relatedness
Considering said benefits, SNP genotyping data may be used to construct PCA plots, as well as conduct phylogenetic analysis. In order to select SNPs that provide the most informative data on genetic distance, SNPs with the higher delta values, or genetic markers with the most extreme allele frequency differences must be used in order to accurately assess and distinguish certain ethnic groups from each other. These high delta value SNPs are known as "ancestry informative markers." Conversely, if SNPs with similar frequencies are used, all populations will incorrectly look more related with one another and cluster together.
Data
Phylogenetic Tree Construction
The allele frequencies of the various single nucleotide polymorphisms as per the nine populations sampled were entered into the POPTREE2 application, hence creating the phylogenetic tree below, with the scale bar of 0.05. The phylogenetic tree will create a visual representation of when East-Eurasian populations diverged from one common ancestral group, forming the distinct contemporary ethnic groups seen today in the Asia-Pacific, therefore gaining an idea of where Mainland Southeast Asian groups fit in in the context of East-Eurasian evolutionary history. Longer branch lengths correspond to a greater number of genetic changes, which may correspond to time and chronology.
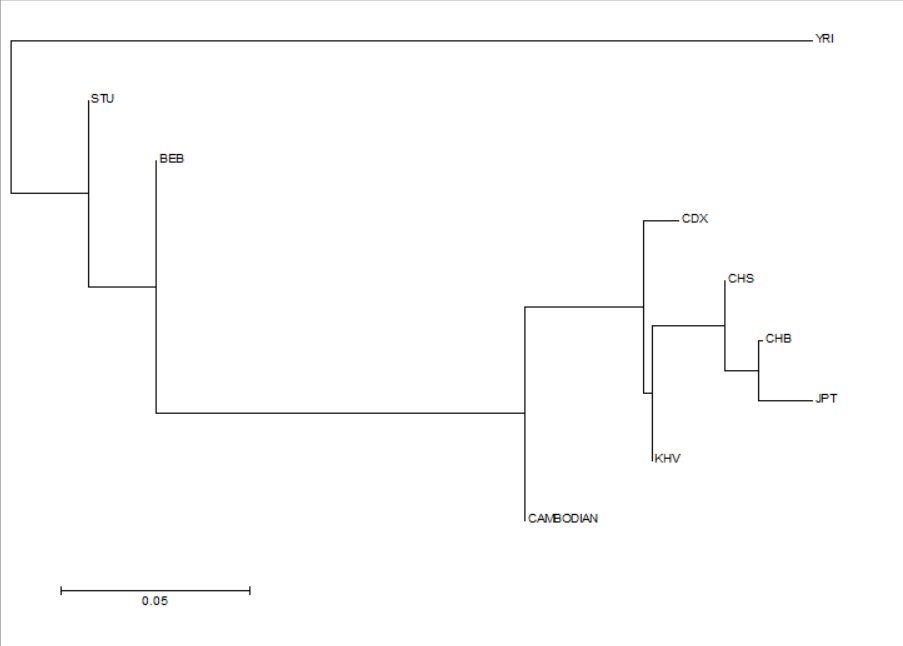 The leftmost section of the phylogenetic tree indicates the root of the tree, therefore a common ancestor for all populations represented in the figure, likely stemming from Sub-Saharan Africa approximately 200 000 years ago, in which all humans may trace back both mitochondrial and Y-chromosomal DNA to. This branch diverges very early, separating the East-Eurasian clade from other global populations, hence making Yoruba in Ibadan, Nigeria, (YRI) have a distinct ancestral lineage that does not evolve with the East-Eurasian populations depicted.
Out of the East-Eurasian populations, Sri Lankan Tamil (STU) is displayed as the most basal population sampled, meaning it diverged from a common ancestor earlier than the rest of the populations seen, likely during the Paleolithic period. Bengali in Bangladesh (BEB) is the second-most basal population, diverging from a common ancestor a few thousand years after STU formed a separate branch. The first Mainland Southeast Asian population, Khmer in Cambodia, emerges after a longer branch, directly from the Eastern/Southern South Asian branch, indicating that both the Khmer as an Austroasiatic ethnolinguistic group were amongst the first contemporary ethnic groups in Mainland Southeast Asia, and that the Khmer have a closer genetic distance to certain South Asian groups, especially Southern and Eastern South Asian groups, than their other Mainland Southeast Asian and East Asian counterparts. Chinese Dai in Xishuangbanna (CDX), which is genetically related to modern Thai and Lao populations, diverges next from a common ancestor, most likely a few thousand years after the divergence of the Khmer group. Anthropological evidence suggests a close affinity between certain Mon-Khmer groups and Kra-Dai groups following the migration of the Dai people into modern day Thailand, Laos, and other parts of Mainland Southeast Asia. Kinh in Ho Chi Minh City, Vietnam (KHV) diverges very shortly after CDX, evidence with the short amount of genetic changes after the divergence of CDX, indicating a high level of genetic affinity with a short genetic distance. The close genetic affinity between the Dai and the Kinh can be inferred due to a potential shared origin with agriculturalists from the Southern China area, with significant admixture with the earlier Austroasiatic groups of Mainland Southeast Asia, creating both of the contemporary groups seen today in two different regions of MSEA. KHV also bridges the Southeast Asian clade with the East Asian clade, specifically to Southern Han Chinese (CHS). CHS marks the start of the East Asian clade, with CHS diverging after KHV, most likely due to the geographical proximity of parts of Vietnam to Southern China, along with the migration between both regions, and the Sinicization of said parts of Vietnam. CHS is directly related to Han Chinese from Beijing, seen through the divergence from a common Han Chinese ancestor, with the genetic closeness easily inferred due to being part of the same general ethnic group, with phenotypic differences mainly due to environmental factors and admixtures with other local populations in their respective regions. CHB is also a sister taxa, meaning they share the same most recent common ancestor, with Japanese in Tokyo, Japan, (JPT), with JPT being the most recently diverged population out of the entire phylogenetic tree, most likely due to the comparatively recent migration of Yayoi agriculturalist populations from Northern China and the Korean Peninsula with Jomon hunter-gatherer populations. Although JPT and CHS appear to be sister taxa, contemporary Japanese are genetically more close to Korean populations, and due to the lack of a Korean population, CHB is consequently substituted as the "most-related."
When analyzing the Mainland Southeast Asian populations in particular, ethnic groups such as the Khmer, the Dai, and the Kinh appear to serve as a genetic intersection between the earlier diverged Eastern/Southern South Asian populations, and the proportionally recently diverged East Asian populations, with many populations in the region gaining signficant admixture due to the long history of human migration in Southeast Asia, dating back to the late Pleistocene period. Sinicized MSEAN populations such as the Kinh serve as the closest genetic bridge connecting East Asian and Southeast Asian populations. Populations such as the Khmer in Cambodia conversely appear substantially closer to their South Asian counterparts, appearing more basal than other MSEAN groups sampled, likely due to historical migration patterns into the region, with Khmer populations being one of the first groups to populate Mainland Southeast Asia as an Austroasiatic ethnolinguistic group.
Principal Component Analysis Scatterplot Construction
A Principal Component Analysis scatterplot was likewise constructed using Python in Google Colab, in order to gain a deeper understanding of where Mainland Southeast Asian genetics lie in comparision to other East-Eurasian populations. Various rsIDs of SNPs and their allele frequencies were entered into a dataframe and converted into a CSV file, before standardizing the data into PCA format to construct a two-dimensional PCA scatterplot with Principal Component 1 (maximum genetic variation) being the x-axis and Principal Component 2 (second-most genetic variation) being the y-axis.
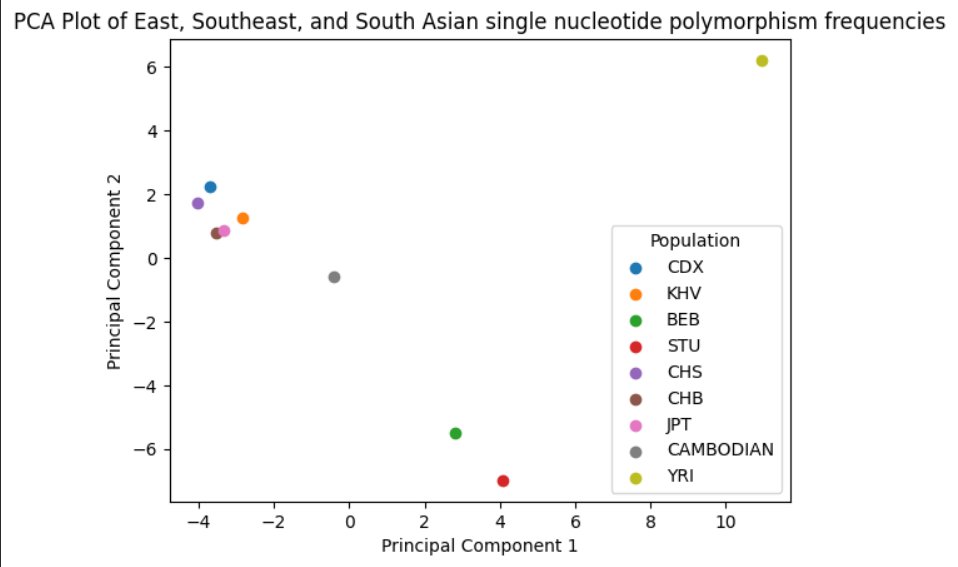 When viewing the Mainland Southeast Asian populations, Chinese Dai from Xishuangbanna, the most closely related population to Thai and Lao populations that was available, along with Kinh from Ho Chi Minh City, Vietnam, appear to cluster together closely with other East Asian populations, especially closer to Southern Han Chinese, due to a shared origin in Southern China and regions surrounding it. The South Asian populations have a larger genetic distance when compared with the aforementioned populations, as evidenced by the coordinates in relation to the x-axis, which magnifies the genetic distance significantly. (South Asian populations, Bengali in Bangladesh have an approximated average of 3.5 on the x-axis, whereas CDX and KHV have an approximated average of -3.5 on the x-axis.) The larger distance is furthermore evidenced by the difference in terms of the y-axis. However, the Cambodian population appears to lie in the middle of the two clusters, with the x-axis coordinate closer to 0, which is approximately halfway between both populations. This evidenced a larger amount of South Asian admixture in contemporary Cambodian populations, which is accurate, considering the extent of human migration and historical trade between regions like Cambodia, Sri Lanka, and Southern India.
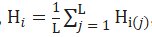
Analyzing the Cambodian group more due to its unique location on the PCA scatterplot, the average heterozygosity for the entire population was calculated using the formula:
 (Source of image cited in citations)
The heterozygosities of each given allele frequency in the Cambodian population, according to the Hardy-Weinberg Equilibrium, were summed and divided by the number of loci, or the number of SNPs sampled. From substituting the values of each heterozygosity in, an average heterozygosity of 0.2925 was obtained for the Cambodian population. Considering that the maximum heterozygosity for a population is 0.50, an average heterozygosity of 0.29 indicates high diversity, further evidencing the high amount of admixture and diversity within the Khmer ethnic group.
(Source of image cited in citations)
The heterozygosities of each given allele frequency in the Cambodian population, according to the Hardy-Weinberg Equilibrium, were summed and divided by the number of loci, or the number of SNPs sampled. From substituting the values of each heterozygosity in, an average heterozygosity of 0.2925 was obtained for the Cambodian population. Considering that the maximum heterozygosity for a population is 0.50, an average heterozygosity of 0.29 indicates high diversity, further evidencing the high amount of admixture and diversity within the Khmer ethnic group.
Using the data from the graph and the heterozygosity calculation of the Khmer, Mainland Southeast Asian populations such as the Dai or Kinh tend to be proportionally closer to East Asian populations rather than South Asian populations, considering a shared origin in regions around Southern China as aforementioned, albeit showing slightly more basal South Asian influence in comparision to pure East Asian groups, whereas populations such as the Khmer, who hail from earlier Austroasiatic groups in Mainland Southeast Asia appear to serve as the genetic bridge between the East/Southeast Asian lineages, and the South Asian lineages, displaying a high amount of genetic diversity due to ancient admixture.
Conclusion
Conclusion
As stated before, with a population of over 700 million people, Southeast Asia boasts some of the highest levels of ethnolinguistic diversity found globally, with thousands of ethnic groups and languages scattered across the region. Despite the consequent genetic diversity that comes along with this saturation of ethnolinguistic groups, the Southeast Asian genome is often underrepresented in both the contexts of population and medical genetics research. Utilizing available genome databases and gaining data on single nucleotide polymorphisms (SNP), in which a genome varies from another genome sequence by a single letter in a nucleotide, we were able to create a simplified phylogenetic tree which may be used to analyze and make inferences on human migration, as well as a Principal Component Analysis scatterplot which maps out the genetic distance between populations on a two-dimensional graph.
Based on the results, it can be determined that Mainland Southeast Asian populations (MSEAN) serve as a genetic bridge between certain South Asian and East Asian groups, likely due to a large history of human migration from both of the respective regions. Populations such as the Dai and the Kinh cluster closer to other East Asian groups, as seen on both the phylogenetic tree and the Principal Component Analysis scatterplot, particularly Southern Han Chinese, due to both of the populations originating from regions near Southern China, with the Kinh serving as a direct genetic link between East Asian populations such as the Han Chinese ethnic group, and Southeast Asian populations such as Thais, Laos, and Cambodians. Conversely, earlier Austroasiatic ethnolinguistic groups such as the Khmer of Cambodia appear to be a midpoint between both East and South Asian groups, with a significant amount of admixture from areas such as Sri Lanka and Southern India, as seen from the Principal Component Analysis scatterplot in which the Khmer group was at an intermediate point when analyzing the x-axis coordinates, as well as the distance to basal South Asian populations on the phylogenetic tree. Based on the lengths of the branches on the phylogenetic tree, which indicate the accumulation of genetic changes over time, it can be seen that South Asian groups diverged from a common ancestor at a relatively earlier point in chronology, whereas the East Asian groups diverged nearer to the end, placing MSEAN populations between both groups, relatively closer to their East Asian counterparts, with Cambodian populations appearing more genetically close to the said basal South Asian populations.
Limitations
While the project portrayed a generally accurate representation of Mainland Southeast Asian population genetics within the broader context of East-Eurasian populations, many changes could have been made to further improve the accuracy of the results. Due to time constraints and a lack of capacity to host high efficiency applications to gather data in large scopes, I was only able to choose 23 SNPs to analyze, and therefore had to ensure the quality of each one, manually evaluating the allele frequency variation between each populations, whereas many bioinformatics projects collected hundreds of SNPs regardless of type in order to create a fine-tuned visual representation of MSEAN population genetics. Moreover, considering the lack of data of Asian genomic data in proportion to European-origin genomic data, the amount of populations I could sample was constrained, leading to a lack of populations from places such as Myanmar, certain parts of Thailand and Laos, and places in East Asia such as the Korean Peninsula.
In order to address these flaws in the future, research may be conducted into finding applications that may collect large samples of genomic data in a shorter timeframe, or I may even create a program which may collect such data. A larger variety of genomic libraries could have been dissected and analyzed in order to research populations from underrepresented regions and groups in the Asia-Pacific, particularly in Southeast Asia, such as the Akha, Palaung, or Shan. Considering all these points, the accuracy of this project may be increased substantially, along with fostering inclusion, and an expanded variety of valuable data.
Citations
Studies/Articles:
Wangkumhang, P., Shaw, P. J., Chaichoompu, K., Ngamphiw, C., Assawamakin, A., Nuinoon, M., ... & Tongsima, S. (2013). Insight into the peopling of Mainland Southeast Asia from Thai population genetic structure. PLoS One, 8(11), e79522., ,
Teo YY, Sim X, Ong RT, Tan AK, Chen J, Tantoso E, Small KS, Ku CS, Lee EJ, Seielstad M, Chia KS. Singapore Genome Variation Project: a haplotype map of three Southeast Asian populations. Genome Res. 2009 Nov;19(11):2154-62. doi: 10.1101/gr.095000.109. Epub 2009 Aug 21. PMID: 19700652; PMCID: PMC2775604.
Changmai P, Jaisamut K, Kampuansai J, Kutanan W, Altınışık NE, et al. (2022) Indian genetic heritage in Southeast Asian populations. PLOS Genetics 18(2): e1010036. https://doi.org/10.1371/journal.pgen.1010036
Sasongko TH, Gunadi, Hoh BP, Minari J, Seow SW, Shotelersuk V. The ASEAN genome consortium: advancing equitable precision medicine through regional solidarity. Lancet Reg Health West Pac. 2025 Jun 20;60:101611. doi: 10.1016/j.lanwpc.2025.101611. PMID: 40605969; PMCID: PMC12221367.
Vongpaisarnsin K, Listman JB, Malison RT, Gelernter J. Ancestry informative markers for distinguishing between Thai populations based on genome-wide association datasets. Leg Med (Tokyo). 2015 Jul;17(4):245-50. doi: 10.1016/j.legalmed.2015.02.004. Epub 2015 Feb 25. PMID: 25759192; PMCID: PMC4480199.
Qiu QW, Wu DD, Yu LH, Yan TZ, Zhang W, Li ZT, Liu YH, Zhang YP, Xu XM. Evidence of recent natural selection on the Southeast Asian deletion (--(SEA)) causing α-thalassemia in South China. BMC Evol Biol. 2013 Mar 11;13:63. doi: 10.1186/1471-2148-13-63. PMID: 23497175; PMCID: PMC3626844.
Single nucleotide polymorphisms (snps). Genome.gov. (n.d.). https://www.genome.gov/genetics-glossary/Single-Nucleotide-Polymorphisms-SNPs
Nielsen R. Population genetic analysis of ascertained SNP data. Hum Genomics. 2004 Mar;1(3):218-24. doi: 10.1186/1479-7364-1-3-218. PMID: 15588481; PMCID: PMC3525085.
He Y, Zhang X, Peng MS, Li YC, Liu K, Zhang Y, Mao L, Guo Y, Ma Y, Zhou B, Zheng W, Yue T, Liao Y, Liang SA, Chen L, Zhang W, Chen X, Tang B, Yang X, Ye K, Gao S, Lu Y, Wang Y, Wan S, Hao R, Wang X, Mao Y, Dai S, Gao Z, Yang LQ, Guo J, Li J, Liu C, Wang J, Sovannary T, Bunnath L, Kampuansai J, Inta A, Srikummool M, Kutanan W, Ho HQ, Pham KD, Singthong S, Sochampa S, Kyaing UW, Pongamornkul W, Morlaeku C, Rattanakrajangsri K; Consortium of Anthropological Research in Southeast Asia and Southwest China (CASEAC); Kong QP, Zhang YP, Su B. Genome diversity and signatures of natural selection in mainland Southeast Asia. Nature. 2025 Jul;643(8071):417-426. doi: 10.1038/s41586-025-08998-w. Epub 2025 May 14. PMID: 40369069.
Demeter F, Shackelford LL, Bacon AM, Duringer P, Westaway K, Sayavongkhamdy T, Braga J, Sichanthongtip P, Khamdalavong P, Ponche JL, Wang H, Lundstrom C, Patole-Edoumba E, Karpoff AM. Anatomically modern human in Southeast Asia (Laos) by 46 ka. Proc Natl Acad Sci U S A. 2012 Sep 4;109(36):14375-80. doi: 10.1073/pnas.1208104109. Epub 2012 Aug 20. PMID: 22908291; PMCID: PMC3437904.
(W. E. Talk) Yuduan Zhou: Why the late paleolithic hoabinhian culture is important for southern China and Southeast Asia?. China News Service Website - Headlines, stories, photos and videos. (n.d.). https://www.ecns.cn/news/2023-09-05/detail-ihcsvcpq5395055.shtml
Zimmerman SJ, Aldridge CL, Oyler-McCance SJ. An empirical comparison of population genetic analyses using microsatellite and SNP data for a species of conservation concern. BMC Genomics. 2020 Jun 1;21(1):382. doi: 10.1186/s12864-020-06783-9. PMID: 32487020; PMCID: PMC7268520.
Evolutionary Origin of GnIH and NPFF in Chordates: Insights from Novel Amphioxus RFamide Peptides - Scientific Figure on ResearchGate. Available from: https://www.researchgate.net/figure/A-HPLC-profile-of-the-retained-material-obtained-by-immunoaffinity-purification-using_fig3_263585805 [accessed 3 Mar 2026]
Browse the manual. QIAGEN Bioinformatics Manuals. (n.d.). https://resources.qiagenbioinformatics.com/manuals/clcsequenceviewer/current/index.php?manual=Scale_bar.html
Kutanan W, Kampuansai J, Fuselli S, Nakbunlung S, Seielstad M, Bertorelle G, Kangwanpong D. Genetic structure of the Mon-Khmer speaking groups and their affinity to the neighbouring Tai populations in Northern Thailand. BMC Genet. 2011 Jun 15;12:56. doi: 10.1186/1471-2156-12-56. PMID: 21672265; PMCID: PMC3126721.
Liu D, Duong NT, Ton ND, Van Phong N, Pakendorf B, Van Hai N, Stoneking M. Extensive Ethnolinguistic Diversity in Vietnam Reflects Multiple Sources of Genetic Diversity. Mol Biol Evol. 2020 Sep 1;37(9):2503-2519. doi: 10.1093/molbev/msaa099. PMID: 32344428; PMCID: PMC7475039.
Zhang X, Liu Q, Zhang H, Zhao S, Huang J, Sovannary T, Bunnath L, Aun HS, Samnom H, Su B, Chen H. The distinct morphological phenotypes of Southeast Asian aborigines are shaped by novel mechanisms for adaptation to tropical rainforests. Natl Sci Rev. 2021 Apr 27;9(3):nwab072. doi: 10.1093/nsr/nwab072. PMID: 35371514; PMCID: PMC8970429.
2.4 phylogenetic trees and classification - digital atlas of ancient life. Digital Atlas of Ancient Life. (n.d.). https://www.digitalatlasofancientlife.org/learn/systematics/phylogenetics/trees-classification/
Prehistoric human migration in Southeast Asia driven by sea-level rise, study reveals. PHYS ORG. (n.d.). https://phys.org/news/2023-02-prehistoric-human-migration-southeast-asia.html
Dissecting the genetic structure and admixture of four geographical Malay populations - Scientific Figure on ResearchGate. Available from: https://www.researchgate.net/figure/Locations-and-genetic-makeup-of-the-Malays-and-other-populations-The-averaged-genetic_fig2_282130620
Chin EL, Huang L, Bouzid YY, Kirschke CP, Durbin-Johnson B, Baldiviez LM, Bonnel EL, Keim NL, Korf I, Stephensen CB, Lemay DG. Association of Lactase Persistence Genotypes (rs4988235) and Ethnicity with Dairy Intake in a Healthy U.S. Population. Nutrients. 2019 Aug 10;11(8):1860. doi: 10.3390/nu11081860. PMID: 31405126; PMCID: PMC6723957.
K.K. Kanaka, Nidhi Sukhija, Rangasai Chandra Goli, Sanjeev Singh, Indrajit Ganguly, S.P. Dixit, Aishwarya Dash, Anoop Anand Malik, On the concepts and measures of diversity in the genomics era, Current Plant Biology, Volume 33, 2023, 100278, ISSN 2214-6628, https://doi.org/10.1016/j.cpb.2023.100278. (https://www.sciencedirect.com/science/article/pii/S2214662823000075) Keywords: Abiotic stress; Breeding; Classical genetics; Diversity; Genotyping; Haplotype; Linkage disequilibrium; Phylogeny
Genome Libraries (website form):
https://www.internationalgenome.org/data-portal/population/CambodianHGDP - Internation Genome Sample Resource
https://useast.ensembl.org/Homo_sapiens/Info/Index - Ensembl
https://cephb.fr/en/hgdp/hgdp_search.php - Fondation Jean-Dausett
Additional Resources:
Galarnyk, M. (n.d.). PCA using python: A tutorial. Built In. https://builtin.com/machine-learning/pca-in-python
Acknowledgement
I would like to thank the Science Fair coordinator of my school, Mr. Maclean, my AP Biology teacher Ms Wang for providing valuable research and information on various genetics and statistics topics, and the Calgary Youth Science Fair for hosting my project in person, and online.