
A Multimodal Neuroimaging and Omics approach for Rational Dual Therapeutic Design in Amyotrophic Lateral Sclerosis
Mrigank Pandey
STEM Innovation Academy High School
Grade 10
Presentation
No video provided
Problem
Amyotrophic Lateral Sclerosis (ALS) is a progressive and fatal neurodegenerative disease characterized by the selective degeneration of both upper and lower motor neurons within the motor cortex and spinal cord. These neurons are responsible for transmitting signals that control voluntary muscle movement; as such, their degeneration leads to progressive muscle weakness, paralysis, and eventual loss of respiratory function. Despite extensive research efforts over the past several decades, ALS remains one of the most challenging neurological diseases to treat. The precise mechanisms underlying motor neuron degeneration remain elusive worldwide, and current therapies offer only modest clinical benefits. As a result, ALS continues to represent a significant unmet medical need within neurodegenerative disease research.
The pathophysiology of ALS is widely recognized as multifactorial, involving complex interactions between genetic, molecular, and environmental factors. Several molecular pathways have been implicated in disease progression, including oxidative stress, mitochondrial dysfunction, impaired RNA metabolism, neuroinflammation, and substantial protein misfolding. Among the most extensively studied genetic contributors are mutations in the superoxide dismutase 1 (SOD1) gene, which can produce aberrant proteins that exhibit toxic gain-of-function properties and contribute to oxidative damage within motor neurons. Another major pathological hallmark of ALS is the aggregation and cytoplasmic mislocalization of TAR DNA-binding protein 43 (TDP-43), a protein involved in RNA splicing and regulation. Clumping of this protein (aggregates) impair the ability of the protein to carry out its function properly, which results in downstream inclusion of cryptic exons that were meant to be excluded from coding RNA. In the majority of ALS cases (97%), abnormal TDP-43 aggregation disrupts RNA processing and cellular homeostasis, contributing to neuronal dysfunction and degeneration. Additionally, hexanucleotide repeat expansions within the C9orf72 gene represent the most common known genetic cause of ALS, producing toxic RNA species and abnormal dipeptide repeat proteins that interfere with neuronal stability and intracellular trafficking. However, the C9orf72 and SOD1 malfunctions are typically associated with unique subtypes of the disease, known as C9orf72-ALS and SOD1-ALS.
These molecular disruptions collectively contribute to a cascade of cellular dysfunctions that ultimately culminate in motor neuron death. Importantly, ALS pathology does not appear to arise from a single dominant pathway; rather, it emerges from the interaction of multiple dysregulated biological processes. This is known as sporadic ALS. This complexity has posed significant challenges for therapeutic development. Current pharmacological treatments for ALS—including drugs aimed at reducing glutamate-mediated excitotoxicity or slowing oxidative stress—primarily target isolated aspects of the disease rather than the broader network of pathological mechanisms involved. Consequently, existing therapies generally provide only limited extensions in patient survival and do not halt disease progression. The average survival time following diagnosis remains approximately two to five years, with respiratory failure representing the final stage of the disease.
Given the multifactorial nature of ALS pathology, there is growing recognition that effective treatments will likely require strategies capable of targeting multiple disease pathways simultaneously. In recent years, advances in molecular therapeutics have introduced new approaches that may offer greater specificity and therapeutic potential. One such strategy involves the use of antisense oligonucleotides (ASOs), short synthetic strands of nucleic acids designed to selectively bind messenger RNA transcripts and modulate gene expression. ASO therapies have shown promising results in targeting pathogenic genes associated with neurodegenerative diseases, including SOD1-related ALS, by suppressing the production of toxic proteins at the transcript level.
Another therapeutic approach, although not explored in ALS research, is highlighted in Alzhemiers therapeutic breakthroughs. It is the development of multi-target directed ligands (MTDLs), single compounds engineered to interact with multiple molecular targets simultaneously. Unlike traditional drugs designed to affect only one biological pathway, MTDLs aim to address the complex and interconnected nature of neurodegenerative disease mechanisms. By modulating several pathological pathways at once—such as oxidative stress, protein aggregation, and/or neuroinflammation—MTDLs may offer improved therapeutic efficacy compared to single-target treatments.
The objective of this study is to explore a dual-pronged therapeutic strategy for ALS by integrating both approaches into a single research framework. Specifically, this project aims to design and evaluate a combination of antisense oligonucleotide therapy and a multi-target directed ligand, with the goal of addressing both upstream genetic drivers and downstream molecular consequences of ALS pathology. The proposed strategy seeks to achieve synergistic therapeutic effects by simultaneously suppressing pathogenic gene expression while modulating multiple biochemical pathways implicated in neuronal degeneration.
To identify viable therapeutic targets and support rational treatment design, this study employs a multi-modal analytical approach that integrates several layers of biological data. Functional neuroimaging analyses were conducted using functional magnetic resonance imaging (fMRI) combined with diffusion weighted imaging (DWI) and positron emission tomography (PET) atlases from both healthy individuals and ALS patients in order to investigate alterations in neural connectivity and metabolic activity associated with disease progression. In parallel, single nucleus RNA sequencing (snRNA-seq) and iPSC derived motor neuron proteomics datasets derived from post-mortem neural tissue from ALS patients were analyzed to identify differentially expressed genes and disrupted molecular pathways. When direct access to certain datasets was not available, relevant findings from peer-reviewed literature were incorporated to complement the analysis and strengthen biological interpretation for PET data analysis.
By integrating transcriptomic, neuroimaging, and literature-derived evidence, this study aims to identify key molecular targets involved in ALS progression and translate these findings into a rational therapeutic design framework. The development of a combined ASO-MTDL treatment strategy represents a novel attempt to address ALS pathology from both a genetic and biochemical perspective simultaneously. Ultimately, this approach may provide a foundation for more comprehensive therapeutic interventions capable of slowing or potentially altering the progression of this devastating disease.
Research Question:
Can multimodal neuroimaging and omics data employ a feasible, mechanistically driven approach towards Amyotrophic Lateral Sclerosis, aiming for integration of a dual therapy framework utilizing an multi target directed ligand and antisense oligonucleotide to address the multifactorial pathology of the disease?
Hypothesis:
A multimodal strategy integrating neuroimaging and omics datasets will identify key molecular pathways and brain regions involved in the ALS pathology. These findings can employ rationale-based drug design for an alternative, effective approach to ALS. The multifactorial mechanisms of the disease can be addressed on two separate levels, including the RNA level (targeted with an antisense oligonucleotide) for precision splicing and pathway level (targeted with a multi-target directed ligand) for broader pathways.
Method
The method was divided into 4 different components. The literature dive included papers across publishers such as Google Scholar to learn more about the disease itself and make preliminary decisions for the future of the project, with literature being consulted regularly throughout the project. Following the initial literature dive, an fMRI analysis to understand the connectivity changes within the brain of an ALS-affected patient was conducted, as well as a gene analysis to understand how to create both the ASO and the MTDL. Following the analysis and research, I went into designing the two different pharmaceuticals, each serving a different purpose. Note that papers from Google Scholar were used throughout this project for each segment.
Functional connectivity comprehension (fMRI Analysis with additional PET comparison*):
To effectively comprehend and interpret the latent disruptions within the human brain caused by motor neuron damage, I had to first analyze the differences in functional connectivity between ALS-affected brains and healthy controls. It included an interest in the hypothalamus and of course, the motor cortex (defined regions of interest - ROIs - based on Harvard-Oxford Cortical Atlas). In addition to connectivity, PET data were incorporated. However, due to the extremely restricted nature of PET scans specifically for ALS (as well as their rare nature due to in-development PET tracers) I obtained HEALTHY controls from OpenNeuro.org to analyze as a healthy baseline, then compare to literature containing a PET data analysis. The process is listed below. Please note that as of the time of submission, some aspects of the analyses had either failed or were incomplete. Therefore, any expected processes are listed below, with results to be shown at the judging.
Materials:
CONN Toolbox - To analyze functional connectivity and disparities within the brain structure of ALS-affected patients, with a keen focus on white matter thinning and atrophy of grey matter.
FSL and FSLeyes - 1) Used for DWI imaging analysis to understand more about the structural integrity of the brain in ALS. 2) To view the data after it is entered for different steps in the CONN Toolbox, aiming to document regions of interest (ROIs)
OpenNeuro.org - An open source platform to access MRI, PET, EEG, and other types of data for brain imaging analysis.
PETsurfer - Toolbox to analyze PET scans, providing complex mathematical calculations such as Partial Volume Correction to account for inaccuracies within the scan
- The literature dive included comprehensive coverage of symptoms, treatments, and varying disease progressions, with a specific interest in DNA methylation patterns and glial cell activation within the disease pathophysiology. Epigenetics was not given extreme priority to, but keen interest was given to the differences in progression based on familial and sporadic cases, with touches upon MND (umbrella term for ALS, which allows for broader datasets and more consideration into motor neuron atrophy). Metabolism within the brains of ALS patients was also covered to understand more about the brain's metabolic distribution.
- Brain imaging Data acquisition - fMRI scans were obtained from OpenNeuro.org, using ds005874, which included 36 MND-affected patients (fMRI data acquired during task-based imaging, which included the patients' action of eating) and 23 healthy controls performing the same tasks. BIDS validation was ensured. The sample size was slightly smaller; any comorbidities were related to the disease, which means there is no significant risk of inaccurate results.
- Healthy PET control atlases were obtained from OpenNeuro as well. Once again, BIDS validation was ensured.
- Out of the 67 patients in total for the dataset, 8 were excluded from the published dataset due to too much noise within the scan, making it unreadable (meaning that some subjects were named without respect to the order change), and an additional 8 were later excluded due to file corruption. Total patient count was 51 patients. Subject 4 had one invalid scan (session 4) so that was excluded before denoising.
Procedure - CONN Toolbox Analysis - ds005874
- Both anatomical (T1 weighted, 1 T2 weighted) and functional (BOLD) scans were uploaded into the CONN toolbox from dataset ds005874 (all unreadable patients were excluded from the study otherwise)
- Set repetition of scan analysis to the timing specified within ds005874 metadata (0.82 s)
- Prior to preprocessing, conditions were set to the patients due to the presence of more than 1 session for the functional data. Conditions were as follows: REST for sessions 1 and 3, FOOD for sessions 2 and 4.
- Preprocessed data to fit standard MNI152 space. Aligned the samples to become skull-stripped segmented images, using Gaussian kernel smoothing (used 4mm ) and Artifact Detection Tools (ART), as well as white matter and cerebrospinal fluid separation and segmentation (aCompCor) to remove any other biological "noise" related to motion, which could render my results statistically invalid.
- Quality assurance checks were done to ensure that the data did not drift or warp during preprocessing. MNI slices were analyzed prior to denoising and after denoising.
- Denoising - Set band-pass filtering to 0.01 - 0.15 Hz, as the TR was quite high. Set up the pipeline with 10 confound dimensions, ensuring high df for the denoised data. Data was filtered.
- First level analysis (Group ICA and PCA analyses) was performed. Images of the process are in the Data section.
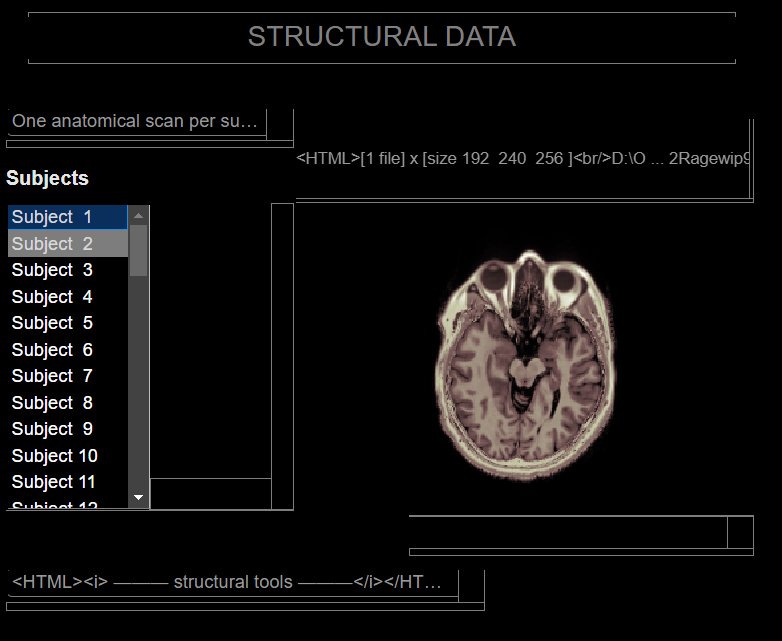 Added sample's anatomical data into the CONN toolbox. Used only T1 scans for greatest precision, with one patient having a T2w scan due to absence of a T1. Statistical bias due to this one scan was minimal, as T2w scans are valid to use but less preferred. GM, WM, and CSF proportions are inverted with T2w scans.
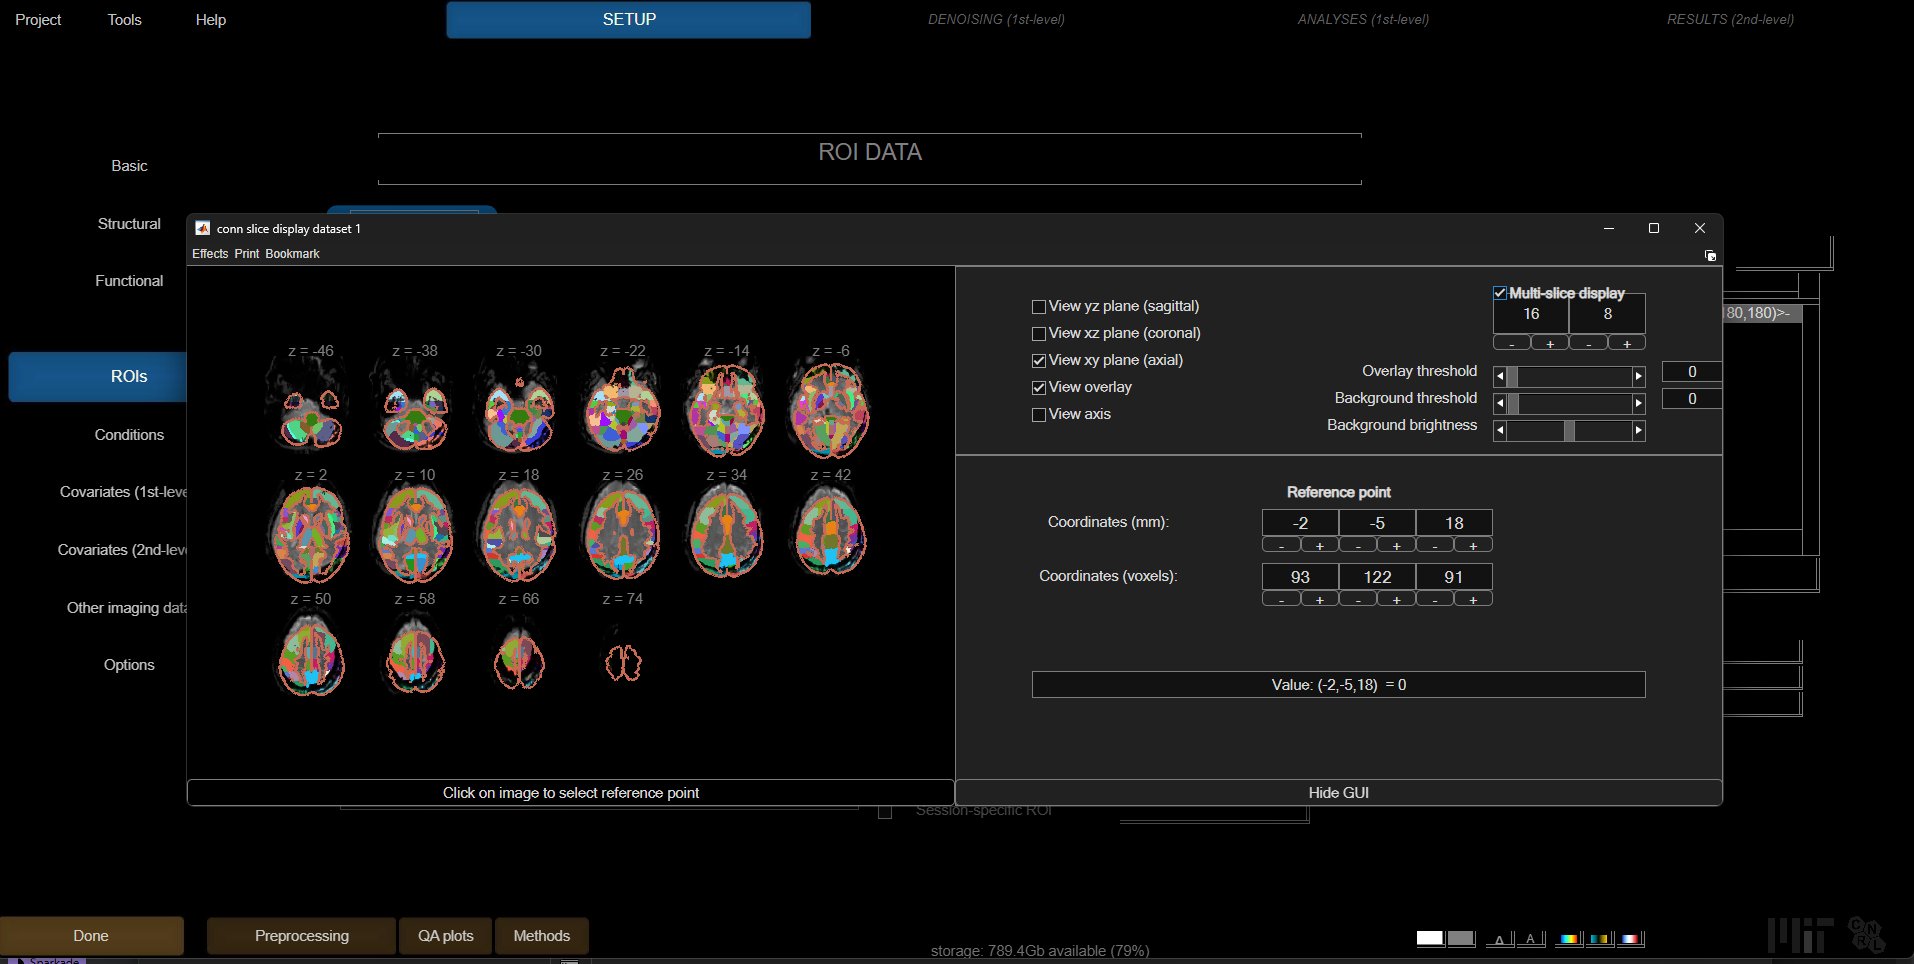 Setting basic ROIs in the CONN toolbox. These are based on Dynamic ICA.
DWI Imaging - ds005874
- Loaded both DWI runs for AP and PA scans (run-01 and run-02), bval and bvec files, as well as acqparam and index files into FSL.
- Ran the BET command to extract the binary brain masks from the raw DWI imaging files
- Preprocessed data by running the
- topup (to correct any magnetic field inhomogeneities) and
- eddy (eddy current induced motion artifacts) commands that would affect downstream analysis.
- For eddy, due to computational constraints, I decided to use 20 subjects out of the 51 subject fMRI cohort (age and sex balanced, with approx 11:9 male female ratio and mean age of 57), with 10 of them being ALS patients and the other 10 being controls.
- dtifit in FSL allowed for conversion of DWI files into Diffusion Tensor Imaging files (DTI), which provided insight onto white matter atrophy for ALS.
- Extracted ROIs from FSLeyes atlases, primarily the JHU White Matter Tractography Atlas and the JHU ICBM-DTI-81 White Matter Labels based on literature coverage of CST regions, the Visual Network, the Salience Network, and the Default Mode Network.
- Regions of significant atrophy in the ALS patients compared to controls were compared to find any differences in connectivity correlating with fMRI connectivity disparities, which may have indicated compensatory networks or significant structural atrophy.
RNA sequencing analysis (snRNA-seq of postmortem brain tissue):
Following the functional connectivity analysis, I conducted a deep dive into specific known genes expressed within the brains of ALS patients. This included analysis of peripheral blood samples from ALS patients and controls, followed by a larger dataset of postmortem tissue of an ALS brain. These were provided by the NCBI GEO. Analysis was primarily performed in the GALAXY Bioinformatics platform that houses popular bioinformatics tools that allow in-depth analysis through a proper GUI.
Materials:
NCBI GEO (Gene Expression Omnibus) - Raw genomic data available for analysis
NCBI Gene Database - Comprehensive database that includes annotated gene sequences and their relations to known diseases
Allen Human Brain Atlas - Provides genomic data in relation to the different parts of the brain, particularly useful in terms of discovering where certain genes are upregulated in the brain's anatomy
GALAXY Bioinformatics - Multiple crucial bioinformatics tools to simplify and streamline the process of acquiring omics data, as well as output (graphs, images, etc)
ALS Compute - Provides whole genome ALS variants to cross-reference
ALS Knowledge Portal - Molecular datasets and biomarkers
BioGPS - Specialized gene annotation portal, with available datasets for ALS patients
Human Protein Atlas - Comprehensive map of proteins within human cells
Neuromine Data Portal (Answer ALS) - The worlds biggest repository of clinical and genomic data, containing Proteomics, Epigenomics, and Genomics datasets
ADDI Workbench - Utilized as a secure cloud computing environment, allowing for manipulating datasets and matricies
Transcriptomics analysis in Galaxy - ONGOING, Up to Seurat Merging was completed
- One dataset was acquired from NCBI GEO (GSE174332), focusing on primary motor cortex tissue based on my initial adherence to the dying forward theory of ALS. Note that this was transcriptomics, required for the ASO design. This dataset (primary motor cortex, Brodmann Area 4) was snRNA-seq, allowing for substantially higher precision reads and results.
- fasterq-dump in GALAXY was performed via the SRA toolkit to extract reads of raw cell data from the NCBI gene database, using each SRR accession number rather than downloading onto my computer (this was because these files are massive).
- FastQC was performed to ensure quality readings, followed by MultiQC to aggregate quality reports into a single map for ease of access and reading. Readings were not flagged just yet.
- Adapter content was quite low, and the pHRED score was quite high for all reads, so adapter trimming was not as necessary.
- Reads were aligned to the human genome using the RNA STARsolo tool (used hg38 as reference genome).
- Seurat Read10X was used to combine all the different batches, allowing for cryptic exon findings and possible discovery of hidden genes AND transcripts (isoforms) that were not part of the human genome in BOTH datasets.
- featureCounts, despite being part of the standard pipeline, was NOT used to count reads of ALS patients and controls, as it would only count known genes and delete any data not found within the human genome.
- Seurat FilterCells was used to remove any remaining ambient RNA or empty droplets.
- Seurat Objects were concatenated via a merge script
- Seurat NormaliseData was used via the LogNormalise tool to account for any differences in nuclei depth.
- Seurat FindVariableGenes was used to find genes with the highest expression value across the normalized nuclei.
- Seurat ScaleData was perfomed to ensure standardization of gene expression across the dataset, preventing that higher expressed genes do not dominate the dataset downstream.
- Seurat PCA (Principal Component Analysis) was used to reduce the dimensionality of the dataset and identify primary transcriptomic axes.
- Seurat FindNeighbors was constructed using the principal components, followed by graph based clustering to group nuclei with similar transcriptional profiles.
- Seurat UMAP was utilzied to visualize the dataset, allowing for identification of transcriptionally distinct cell populations.
- DEG (Differential Gene Expression) analysis was perfomed between ALS and Control nuclei to identify significant transcripts in the ALS pathology.
- Results were analyzed and interpreted through the NCBI Gene Database, cross referenced with the ALS Knowledge Portal and ALS Compute, and various visualization tools were utilized to create plots and output data.
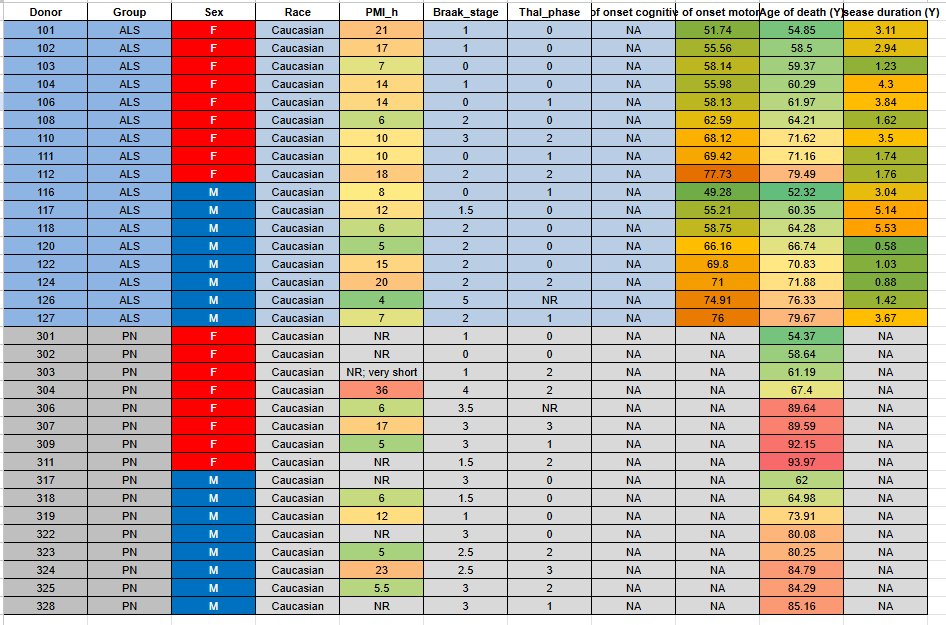 GSE174332 Metadata Table. Highest PMI was not past the low quality bar of 48 hours. Therefore, due to all others factors considering quality, I did NOT exclude any subjects.
Proteomics analysis in the ADDI Workbench and Galaxy EU
- Answer ALS Level 4 proteomics (.csv, matrix of intensities) files were transferred to the ADDI Workbench for file manipulation.
- Matrix of approximately 4134 protein intensities through differential expression between cases and controls were filtered to fit values of FDR < 0.05 and nPeptide lengths of >= 2, with about 264 proteins becoming part of the study set.
- GOEnrichment tool was used to perform Gene Ontology Enrichment on differentially expressed proteins. 4 pathways were annotated to the proteins.
- Throughout these 4 pathways, I created another file that contained all values of how many times the protein held significance in all pathways. From this list, about 104 proteins were remaining, as proteins that only occured in 1 pathway were not included even though they were significant. This ensured the proteins that were convergent across multiple pathways could allow me to pick targets for my MTDL.
- After filtering out proteins based on how many pathways they converged on, I ordered the remaining proteins by log2FC and chose the 15 highest log2FC valued proteins to include in my GO Chord plot.
- Interpreted results through existing literature.
Pharmaceutical Design
The two pharmaceuticals were designed using the processes below. Note that the ASO was NOT designed at this time. This is specifically for the MTDL.
Materials:
OpenBabel - Chemical file format converter use to convert various compounds into SMILES code, InchKey, and other types of formats.
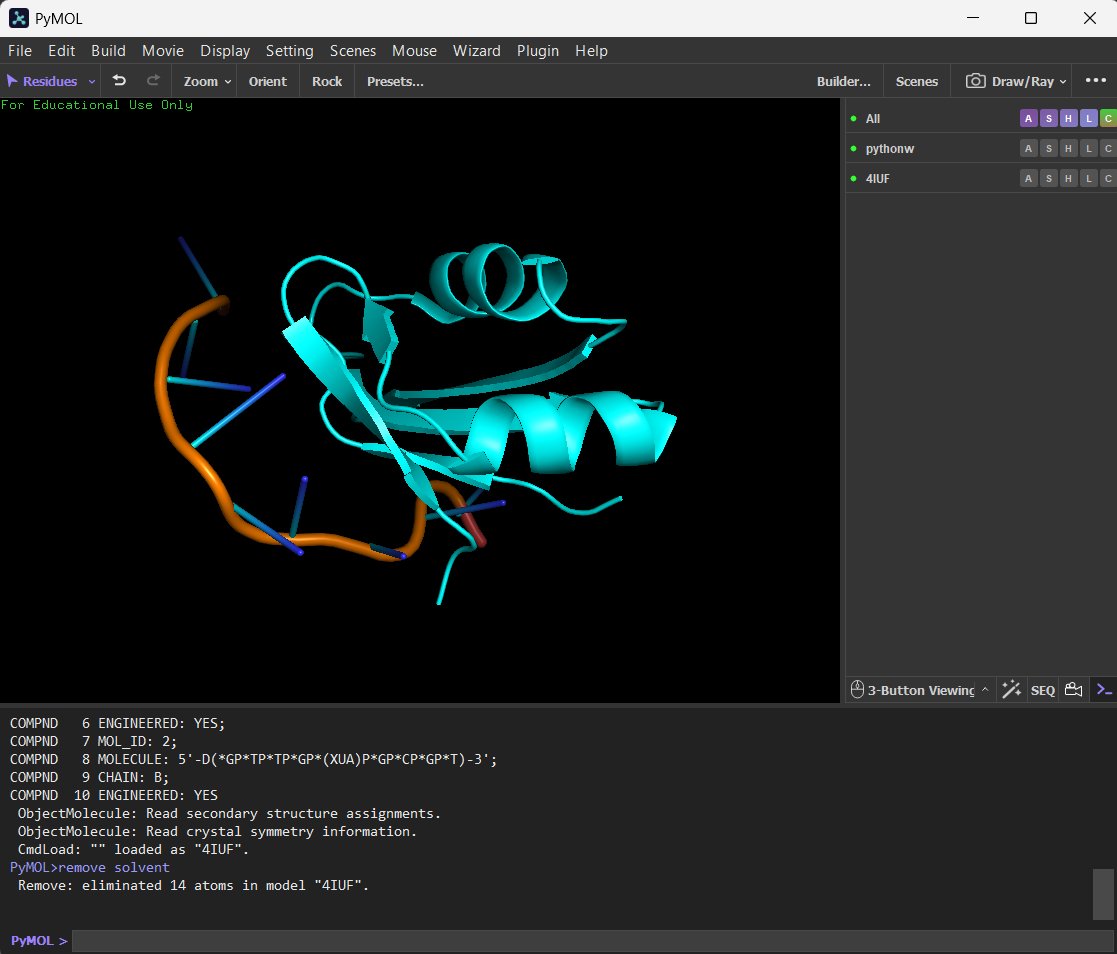
PyMOL - Molecular visualization system used to clean molecules
AutoDock Vina -
RSCB PDB -
Marvins ChemDRAW -
SwissADME -
- Candidate proteins for MTDL were found on the Protein Data Bank (PDB) 2.
Research
Background Information
ALS and it's dysfunctions
Stated before in the problem section, ALS is the gradual loss of motor neurons in the brain and spinal cord areas, which results in the loss of muscle control and inevitably, respiratory failure. Current studies are still underway to determine the cause of the disease, yet the exact pathology and progenitors of the disease remain elusive worldwide. Some symptoms that ALS induces include twitching and cramping of muscles, constant fatigue, impairment of muscle function, and difficulty swallowing. The majority of deaths caused by ALS are respiratory failures, as the last stages of the disease cause final muscle loss and the diaphragm can no longer function properly to bring air into the lungs.
Males have a higher genetic predisposition rate and a higher chance of developing the onset of symptoms of ALS compared to females. This inherent disease bias was also reflected in the uneven cohorts of my fMRI study, which I had to orthogonalize sex and age to with respect to the whole group. Additionally, ALS, being a rare disease, affects about 30 000 people in the US alone at any given time.
90-95% of ALS cases are sporadic, meaning that the patient has no apparent familial history of genetic predisposition linked to the disease. In other words, this form of the disease is specifically detrimental as doctors cannot pinpoint the genes related to the disease, and a family history of the disease is not present. The other 5% of ALS cases are familial, meaning that there is a family history of the disease, and a genetic predisposition combined with environmental factors would have caused the disease onset. Current research into ALS has also seen that interestingly, environmental factors can increase the chance that one gets ALS, or at least speed up the progression of the disease. Factors such as toxic chemical exposure, cyanobacteria, persistent organic pollutants, and intense physical exertion have all been suggested to significantly adjust the trajectory disease progression, even sometimes being a potential major factor in starting the atrophy of motor neurons.
The limitations of current treatments
Current treatments, such as Riluzole and Radicava (Edavarone), target broad functions, such as glutamate production and release and the decrease of free radicals, respectively. However, these broad functions are not beneficial to the patient's disease progression and cause no significant change within the disease pathophysiology. With current, novel treatments such as Qalsody (Tofersen), ASOs target only one area that is highlighted within the disease. For example, the SOD1 gene, substantially upregulated within the pathology of the disease (specifically in the SOD1-ALS variant), provides a mutated gene to the body that in turn produces neurotoxic SOD1 proteins. This malfunctioning gene is silenced with Qalsody, but treatment options remain shockingly limited, with Qalsody being the first approved ALS medication in terms of gene therapy.
The focus on glial cells, particularly astrocytes and microglia, remains a significant gap in current therapeutic strategies. When these cells undergo atrophy or transition into a neurotoxic state, they create a prohibitive environment for patient survival, yet we lack a definitive treatment that protects against glial autophagy. This is further complicated by the emerging roles of oligodendrocytes and Schwann cells, which are only now receiving the deep dive they deserve in ALS research.
Furthermore, the broader environmental context of ALS cases is frequently sidelined, leading to a profound disparity in treatment efficacy. This oversight ignores a factor that plays an exponentially important role in the pathophysiology of the disease. Without addressing the systemic breakdown of the neurovascular unit and the surrounding cellular landscape, any intervention remains reactive rather than restorative. Leveraging an MTDL and ASO approach allows for a more sophisticated response to this complexity, targeting the genetic drivers of this multi-cellular collapse across the entire central nervous system.
Antisense Oligonucleotides - Chemical Structure and Background
Antisense Oligonucleotides are new-generation precision medicine treatments that aim to suppress genes rather than cut them off completely, allowing for less downstream side effects. Based on their sequence targets, they are typically between 15 and 25 nucleotides long, allowing for suppression inducement that is as efficient as possible. Their basic chemical structure involves a phosphorothioate backbone. However, there are multiple types of antisense oligonucleotides. Some are RNase H dependant, meaning that the goal of that structure is to degrade the RNA structure it was designed to bind to. The hybrid DNA-RNA structure allows for the RNase H enzyme to recognize it, then cleave the mRNA. Other structures include steric blockers. These structures "sit" on the target RNA rather than degrading it, almost shielding it from anything that can bind to it (such as ribosomes, which would translate the RNA to proteins).
Splice Switching Oligonucelotides - Binds to pre defined exons or introns and forces the cell to skip certain exons\, include cryptic exons\, or prevent mis-splicing.
Translation Blockers - These therapeutics prevent the ribosomes from initiating translation\, reducing protein levels without destroying the RNA istelf.
miRNA inhibitors - Binds to micro RNA\, preventing silencing of proteins that they may create. In essence\, a neuroprotective protein can be upregulated to further enhance it's effects.
Multi-Target Directed Ligands - Chemical Structure and Background
Multi Target Directed Ligands are polypharmaceutical small molecules that are designed to target upwards of 2 functions simultaneously. Typically, their chemical structure is achieved by having a core chemical group, then adding on extra groups that can attack various other parts of a pathophysiology. This double (or more) action is what allows a more appropriate approach to multifactorial diseases that have dysregulation of multiple pathways.
Microglial activation and its role in ALS
Rather than a single change, current research shows more and more suggestions that microglial activation in ALS is a dynamic phenotypic shift that correlates with disease progression. Typically, there are two polar states of microglial activation that were accepted. However, there is now a more fluid framework centered around correlations with compensatory networks as well. For example, in early stage ALS, the microglial cells adopt a neuroprotective role. anti-inflammatory cytokines are released, with additional neurotrophic factors such as IGF-1. Here, phagocytosis is the primary driver of neuroprotection, "eating up" proteins such as SOD1 and TDP-43.
However, in late stage ALS, microglial activation becomes pro-inflammatory, releasing toxic factors and reactive oxygen species (that drugs like Edavarone are designed to take down). This accelerates motor neuron apoptosis. Therefore, it is plausible to assume that targeting factors such as
Hypothesis with fMRI, PET, and Multi Omics data
Current studies into ALS show that connectivity disparities extend beyond the motor cortex and spinal cord. Consortia such as NiSALS (Neuroimaging Society in Amyotrophic Lateral Sclerosis) extend the global regions of interest of the brain into areas such as the hypothalamus as well, showcasing how profound the depth of this multifaceted disease is. Rather than focusing on single regions of the brain, studies are increasingly shifting findings to focus on the neural circuitry aspect of the disease. However, the challenge is present both in the disease as well as the methods of analyses (refer to logbook and method section), and proper results remain a formidable obstacle to hurdle over with only single modal analyses.
As part of the difficulties mentioned above, PET data is specifically difficult to analyze and collect due to the expensive and rare nature of ALS-specific PET tracers. Utilizing software such as PETsurfer proves to be a challenge due to its steep learning curve and extremely time-consuming steps (often taking 6 hours per subject based on the analyses required) to analyze scans in bulk. This is due to Partial Volume Correction (PVC), a heavy mathematical step within PET analyses that allows for the best quantification and accuracy of data. PVC exists because of the Partial Volume Effect (PVE), where underestimations of activity concentrations are increasingly pronounced because the object is comparable or smaller than a PET scanner. To prevent significant inaccuracies within the results, one must apply PVC to negate the Partial Volume Effect. As with all other mathematical models, PVC still cannot pinpoint and correct PET scans with 100 percent accuracy.
Exploratory fMRI analysis results - 1st Level Analyses (basic ROIs, Group ICA and PCA)
Alongside DWI (Diffusion Weighted Imaging), which allowed me to observe and analyze the structural connectivity and integrity of the MND patients, I used fMRI to analyze the different connectivity components that measured brain activity over a set period of time. By using ds005874 from OpenNeuro, I had the ability to sufficiently analyze these separate modalities. Measuring brain activity told me exactly where the different areas of hypoconnectivity and, interestingly, hyperconnectivity were. From these findings, I was able to understand the areas that would be of interest to target with my pharmaceutical approach.
Group ICA - A tool in the CONN Toolbox that splits brain regions into independent components for analysis. Shows common connectivity across brain regions.
Group PCA - Used PRIOR to Group ICA to reduce the dimensionality between Voxel-Voxel connectivity matricies. Allows for easier calculations in ICA.
Results of Group ICA/PCA
My Independent Component Analysis results revealed some interesting findings - the motor network was not as disrupted compared to other networks that are not as common in sporadic ALS. However, I did conduct 2 smaller experiments within the Exploratory fMRI stage, as I was able to find the following statistically significant networks and the components that they corresponded to. The contrast that I utilized was a Control > ALS contrast, alongside 2 separate
REST - ICA Component 1 - The Sensorimotor Network
Cluster 1 - Blue
- 223 voxels (56%) covering 7% of PostCG r (Postcentral Gyrus Right) with center at (+32,-36,+60)
- 128 voxels (32%) covering 9% of SPL r (Superior Parietal Lobule Right) with center at (+30,-42,+60)
- 12 voxels (3%) covering 0% of PreCG r (Precentral Gyrus Right) with center at (+34,-24,+58)
- 32 voxels (8%) covering 0% of not-labeled with center at (+24,-38,+46)
Cluster 2 - Blue
- 108 voxels (46%) covering 7% of SPL l (Superior Parietal Lobule Left) with center at (-36,-42,+56)
- 60 voxels (26%) covering 2% of PostCG l (Postcentral Gyrus Left) with center at (-34,-36,+50)
- 66 voxels (28%) covering 0% of not-labeled with center at (-30,-36,+48)
At resting state connectivity, this suggests that ALS patients, in relation to controls, have increased connectivity. Regions that belong to the Sensorimotor Network were observed. This component displays general consistency with accepted portions of ALS pathology, with postcentral gyrus and parietal lobe involvement, as well as modest precentral gyrus involvement. This could signal regional atrophy, as paired with DWI.
REST - ICA Component 5 - Anterior Default Mode Network
Cluster 1 - Blue
- 46 voxels (27%) covering 4% of SubCalC (Subcallosal Cortex) with center at (+2,+28,-6)
- 43 voxels (25%) covering 2% of AC (Cingulate Gyrus, anterior division) with center at (+0,+32,+2)
- 17 voxels (10%) covering 2% of MedFC (Frontal Medial Cortex) with center at (-6,+34,-14)
- 12 voxels (7%) covering 1% of PaCiG r (Paracingulate Gyrus Right) with center at (+4,+36,-10)
- 8 voxels (5%) covering 1% of PaCiG l (Paracingulate Gyrus Left) with center at (-6,+32,-12)
- 47 voxels (27%) covering 0% of not-labeled with center at (-6,+30,-4)
REST - ICA Component 9 - Temporal Language Network
Cluster 1 - Red
- 160 voxels (70%) covering 12% of pMTG r (Middle Temporal Gyrus, posterior division Right) with center at (+62,-22,-8)
- 31 voxels (14%) covering 7% of pSTG r (Superior Temporal Gyrus, posterior division Right) with center at (+58,-20,-4)
- 36 voxels (16%) covering 0% of not-labeled with center at (+64,-12,-2)
Cluster 2 - Red
- 129 voxels (96%) covering 4% of MidFG l (Middle Frontal Gyrus Left) with center at (-34,+26,+38)
- 6 voxels (4%) covering 0% of not-labeled with center at (-34,+26,+30)
REST - ICA Component 14 - Auditory + Somatosensory Network
Cluster 1 - Blue
- 140 voxels (38%) covering 25% of PO l (Parietal Operculum Cortex Left) with center at (-54,-28,+18)
- 66 voxels (18%) covering 7% of aSMG l (Supramarginal Gyrus, anterior division Left) with center at (-62,-28,+24)
- 64 voxels (17%) covering 11% of PT l (Planum Temporale Left) with center at (-46,-30,+12)
- 38 voxels (10%) covering 12% of HG l (Heschl's Gyrus Left) with center at (-40,-26,+12)
- 17 voxels (5%) covering 0% of PostCG l (Postcentral Gyrus Left) with center at (-62,-22,+26)
- 10 voxels (3%) covering 1% of CO l (Central Opercular Cortex Left) with center at (-50,-24,+14)
- 6 voxels (2%) covering 0% of IC l (Insular Cortex Left) with center at (-32,-26,+14)
- 3 voxels (1%) covering 1% of pSTG l (Superior Temporal Gyrus, posterior division Left) with center at (-64,-32,+6)
- 25 voxels (7%) covering 0% of not-labeled with center at (-48,-26,+24)
Cluster 2 - Blue
- 270 voxels (95%) covering 6% of sLOC r (Lateral Occipital Cortex, superior division Right) with center at (+42,-74,+32)
- 6 voxels (2%) covering 0% of iLOC r (Lateral Occipital Cortex, inferior division Right) with center at (+50,-72,+14)
- 7 voxels (2%) covering 0% of not-labeled with center at (+36,-62,+26)
Cluster 3 - Blue
- 109 voxels (44%) covering 30% of PP l (Planum Polare Left) with center at (-48,-4,-6)
- 66 voxels (27%) covering 5% of IC l (Insular Cortex Left) with center at (-40,-12,-4)
- 26 voxels (10%) covering 1% of TP l (Temporal Pole Left) with center at (-50,+4,-8)
- 23 voxels (9%) covering 7% of HG l (Heschl's Gyrus Left) with center at (-42,-16,+4)
- 7 voxels (3%) covering 1% of CO l (Central Opercular Cortex Left) with center at (-50,+4,-2)
- 2 voxels (1%) covering 0% of PreCG l (Precentral Gyrus Left) with center at (-54,+6,+0)
- 15 voxels (6%) covering 0% of not-labeled with center at (-46,-6,-2)
Cluster 4 - Blue
- 60 voxels (43%) covering 5% of pSMG r (Supramarginal Gyrus, posterior division Right) with center at (+58,-42,+32)
- 30 voxels (21%) covering 2% of AG r (Angular Gyrus Right) with center at (+50,-46,+32)
- 27 voxels (19%) covering 3% of aSMG r (Supramarginal Gyrus, anterior division Right) with center at (+64,-28,+28)
- 12 voxels (9%) covering 2% of PO r (Parietal Operculum Cortex Right) with center at (+58,-32,+28)
- 12 voxels (9%) covering 0% of not-labeled with center at (+50,-42,+34)
Cluster 5 - Blue
- 119 voxels (86%) covering 2% of Precuneous (Precuneous Cortex) with center at (-8,-56,+60)
- 8 voxels (6%) covering 1% of SPL l (Superior Parietal Lobule Left) with center at (-12,-58,+62)
- 6 voxels (4%) covering 0% of sLOC l (Lateral Occipital Cortex, superior division Left) with center at (-8,-62,+66)
- 6 voxels (4%) covering 0% of not-labeled with center at (-6,-62,+68)
Cluster 6 - Red
- 78 voxels (68%) covering 8% of MedFC (Frontal Medial Cortex) with center at (+0,+44,-20)
- 14 voxels (12%) covering 0% of FP r (Frontal Pole Right) with center at (+10,+46,-22)
- 2 voxels (2%) covering 0% of FP l (Frontal Pole Left) with center at (-8,+46,-22)
- 21 voxels (18%) covering 0% of not-labeled with center at (-10,+48,-16)
Cluster 7 - Blue
- 69 voxels (65%) covering 7% of aSMG l (Supramarginal Gyrus, anterior division Left) with center at (-62,-32,+38)
- 19 voxels (18%) covering 2% of pSMG l (Supramarginal Gyrus, posterior division Left) with center at (-64,-44,+32)
- 10 voxels (9%) covering 0% of PostCG l (Postcentral Gyrus Left) with center at (-58,-26,+42)
- 8 voxels (8%) covering 0% of not-labeled with center at (-66,-38,+38)
Cluster 8 - Blue
- 34 voxels (35%) covering 11% of FO r (Frontal Operculum Cortex Right) with center at (+36,+24,+8)
- 13 voxels (14%) covering 1% of IC r (Insular Cortex Right) with center at (+30,+22,+6)
- 1 voxels (1%) covering 0% of IFG tri r (Inferior Frontal Gyrus, pars triangularis Right) with center at (+38,+28,+8)
- 48 voxels (50%) covering 0% of not-labeled with center at (+32,+26,+10)
REST - ICA Component 17 - Posterior Default Mode Network with additional clusters
Cluster 1 - Red
- 257 voxels (60%) covering 19% of pMTG l (Middle Temporal Gyrus, posterior division Left) with center at (-56,-32,-8)
- 29 voxels (7%) covering 7% of pSTG l (Superior Temporal Gyrus, posterior division Left) with center at (-56,-34,+2)
- 23 voxels (5%) covering 3% of toMTG l (Middle Temporal Gyrus, temporooccipital part Left) with center at (-56,-48,-6)
- 1 voxels (0%) covering 0% of toITG l (Inferior Temporal Gyrus, temporooccipital part Left) with center at (-52,-48,-10)
- 120 voxels (28%) covering 0% of not-labeled with center at (-48,-36,-6)
Cluster 2 - Red
- 175 voxels (48%) covering 18% of AG l (Angular Gyrus Left) with center at (-48,-56,+26)
- 17 voxels (5%) covering 1% of SPL l (Superior Parietal Lobule Left) with center at (-30,-54,+40)
- 15 voxels (4%) covering 1% of pSMG l (Supramarginal Gyrus, posterior division Left) with center at (-52,-48,+16)
- 8 voxels (2%) covering 0% of sLOC l (Lateral Occipital Cortex, superior division Left) with center at (-48,-60,+36)
- 146 voxels (40%) covering 0% of not-labeled with center at (-34,-52,+32)
Cluster 3 - Red
- 213 voxels (71%) covering 8% of AC (Cingulate Gyrus, anterior division) with center at (+2,+38,+6)
- 24 voxels (8%) covering 2% of PaCiG l (Paracingulate Gyrus Left) with center at (-4,+40,-8)
- 18 voxels (6%) covering 1% of PaCiG r (Paracingulate Gyrus Right) with center at (+10,+44,+8)
- 12 voxels (4%) covering 1% of SubCalC (Subcallosal Cortex) with center at (-4,+28,-4)
- 31 voxels (10%) covering 0% of not-labeled with center at (+8,+34,+6)
Cluster 4 - Blue
- 81 voxels (29%) covering 4% of Cereb1 l (Cerebelum Crus1 Left) with center at (-28,-88,-24)
- 43 voxels (15%) covering 2% of Cereb1 r (Cerebelum Crus1 Right) with center at (+16,-88,-22)
- 39 voxels (14%) covering 2% of iLOC l (Lateral Occipital Cortex, inferior division Left) with center at (-40,-82,-18)
- 13 voxels (5%) covering 0% of OP l (Occipital Pole Left) with center at (-28,-96,-16)
- 12 voxels (4%) covering 1% of OFusG l (Occipital Fusiform Gyrus Left) with center at (-30,-84,-18)
- 10 voxels (4%) covering 1% of LG r (Lingual Gyrus Right) with center at (+4,-84,-16)
- 9 voxels (3%) covering 0% of Cereb2 l (Cerebelum Crus2 Left) with center at (-8,-86,-22)
- 7 voxels (2%) covering 0% of LG l (Lingual Gyrus Left) with center at (-6,-84,-18)
- 67 voxels (24%) covering 0% of not-labeled with center at (-6,-88,-20)
Cluster 5 - Red
- 124 voxels (64%) covering 5% of PC (Cingulate Gyrus, posterior division) with center at (-6,-50,+26)
- 39 voxels (20%) covering 1% of Precuneous (Precuneous Cortex) with center at (-4,-56,+26)
- 32 voxels (16%) covering 0% of not-labeled with center at (-10,-50,+24)
Cluster 6 - Blue
- 163 voxels (90%) covering 3% of sLOC r (Lateral Occipital Cortex, superior division Right) with center at (+20,-76,+48)
- 9 voxels (5%) covering 0% of Precuneous (Precuneous Cortex) with center at (+8,-78,+48)
- 1 voxels (1%) covering 0% of Cuneal r (Cuneal Cortex Right) with center at (+10,-82,+42)
- 8 voxels (4%) covering 0% of not-labeled with center at (+8,-82,+48)
Cluster 7- Red
- 96 voxels (62%) covering 7% of PaCiG l (Paracingulate Gyrus Left) with center at (-6,+52,+6)
- 14 voxels (9%) covering 0% of FP l (Frontal Pole Left) with center at (-8,+58,+10)
- 2 voxels (1%) covering 0% of FP r (Frontal Pole Right) with center at (+2,+56,+8)
- 1 voxels (1%) covering 0% of MedFC (Frontal Medial Cortex) with center at (-10,+54,-6)
- 1 voxels (1%) covering 0% of PaCiG r (Paracingulate Gyrus Right) with center at (+2,+54,+8)
- 40 voxels (26%) covering 0% of not-labeled with center at (-10,+56,+8)
Cluster 8- Red
- 42 voxels (30%) covering 10% of pSTG r (Superior Temporal Gyrus, posterior division Right) with center at (+56,-26,+0)
- 41 voxels (29%) covering 3% of pMTG r (Middle Temporal Gyrus, posterior division Right) with center at (+60,-26,-6)
- 11 voxels (8%) covering 1% of toMTG r (Middle Temporal Gyrus, temporooccipital part Right) with center at (+54,-40,+4)
- 2 voxels (1%) covering 0% of pSMG r (Supramarginal Gyrus, posterior division Right) with center at (+54,-40,+6)
- 43 voxels (31%) covering 0% of not-labeled with center at (+52,-26,+4)
Cluster 9- Blue
- 9 voxels (7%) covering 1% of LG r (Lingual Gyrus Right) with center at (+14,-80,-2)
- 9 voxels (7%) covering 1% of OFusG r (Occipital Fusiform Gyrus Right) with center at (+26,-74,-4)
- 5 voxels (4%) covering 1% of ICC r (Intracalcarine Cortex Right) with center at (+16,-82,+2)
- 99 voxels (81%) covering 0% of not-labeled with center at (+28,-76,+0)
Cluster 10- Red
- 66 voxels (56%) covering 5% of FOrb r (Frontal Orbital Cortex Right) with center at (+44,+28,-6)
- 18 voxels (15%) covering 3% of IFG tri r (Inferior Frontal Gyrus, pars triangularis Right) with center at (+50,+28,-2)
- 9 voxels (8%) covering 3% of FO r (Frontal Operculum Cortex Right) with center at (+46,+24,-2)
- 25 voxels (21%) covering 0% of not-labeled with center at (+38,+32,-2)
Cluster 11- Red
- 23 voxels (20%) covering 2% of pMTG r (Middle Temporal Gyrus, posterior division Right) with center at (+48,-20,-12)
- 9 voxels (8%) covering 2% of pSTG r (Superior Temporal Gyrus, posterior division Right) with center at (+48,-14,-10)
- 1 voxels (1%) covering 0% of PP r (Planum Polare Right) with center at (+42,-18,-6)
- 82 voxels (71%) covering 0% of not-labeled with center at (+46,-16,-10)
Cluster 12- Red
- 56 voxels (59%) covering 1% of FP l (Frontal Pole Left) with center at (-48,+40,-2)
- 31 voxels (33%) covering 5% of IFG tri l (Inferior Frontal Gyrus, pars triangularis Left) with center at (-48,+34,+0)
- 4 voxels (4%) covering 0% of FOrb l (Frontal Orbital Cortex Left) with center at (-46,+34,-10)
- 4 voxels (4%) covering 0% of not-labeled with center at (-40,+34,+0)
Cluster 13- Blue
- 53 voxels (56%) covering 1% of Precuneous (Precuneous Cortex) with center at (-2,-60,+64)
- 4 voxels (4%) covering 0% of sLOC l (Lateral Occipital Cortex, superior division Left) with center at (-6,-66,+64)
- 37 voxels (39%) covering 0% of not-labeled with center at (+0,-58,+66)
Cluster 14- Red
- 83 voxels (89%) covering 3% of MidFG l (Middle Frontal Gyrus Left) with center at (-50,+20,+38)
- 4 voxels (4%) covering 1% of IFG oper l (Inferior Frontal Gyrus, pars opercularis Left) with center at (-52,+18,+28)
- 6 voxels (6%) covering 0% of not-labeled with center at (-56,+18,+30)
Cluster 15- Red
- 28 voxels (31%) covering 3% of Cereb9 l (Cerebelum 9 Left) with center at (-8,-50,-36)
- 10 voxels (11%) covering 6% of Ver9 (Vermis 9) with center at (-2,-52,-32)
- 9 voxels (10%) covering 9% of Ver10 (Vermis 10) with center at (+2,-48,-26)
- 7 voxels (8%) covering 0% of Brain-Stem with center at (+10,-42,-30)
- 2 voxels (2%) covering 0% of Ver45 (Vermis 4 5) with center at (+0,-50,-22)
- 1 voxels (1%) covering 0% of Cereb8 l (Cerebelum 8 Left) with center at (-14,-54,-38)
- 33 voxels (37%) covering 0% of not-labeled with center at (+4,-44,-28)
REST - ICA Component 23 - Visual Network
Cluster 1 - Blue
- 374 voxels (39%) covering 15% of OP r (Occipital Pole Right) with center at (+24,-94,+12)
- 345 voxels (36%) covering 17% of iLOC r (Lateral Occipital Cortex, inferior division Right) with center at (+40,-80,+4)
- 148 voxels (15%) covering 3% of sLOC r (Lateral Occipital Cortex, superior division Right) with center at (+32,-84,+16)
- 104 voxels (11%) covering 0% of not-labeled with center at (+28,-84,+6)
Cluster 2 - Blue
- 97 voxels (48%) covering 2% of sLOC r (Lateral Occipital Cortex, superior division Right) with center at (+18,-80,+44)
- 49 voxels (24%) covering 8% of Cuneal r (Cuneal Cortex Right) with center at (+6,-82,+36)
- 24 voxels (12%) covering 0% of Precuneous (Precuneous Cortex) with center at (+12,-76,+42)
- 21 voxels (10%) covering 1% of OP r (Occipital Pole Right) with center at (+12,-90,+38)
- 10 voxels (5%) covering 0% of not-labeled with center at (+12,-80,+42)
Cluster 3 - Red
- 137 voxels (75%) covering 7% of Cereb2 l (Cerebelum Crus2 Left) with center at (-42,-68,-42)
- 40 voxels (22%) covering 2% of Cereb1 l (Cerebelum Crus1 Left) with center at (-48,-68,-30)
- 1 voxels (1%) covering 0% of Cereb7 l (Cerebelum 7b Left) with center at (-30,-64,-40)
- 5 voxels (3%) covering 0% of not-labeled with center at (-52,-68,-40)
Cluster 4 - Blue
- 89 voxels (50%) covering 6% of SPL r (Superior Parietal Lobule Right) with center at (+18,-52,+72)
- 36 voxels (20%) covering 1% of PostCG r (Postcentral Gyrus Right) with center at (+10,-44,+76)
- 14 voxels (8%) covering 0% of sLOC r (Lateral Occipital Cortex, superior division Right) with center at (+18,-58,+70)
- 2 voxels (1%) covering 0% of Precuneous (Precuneous Cortex) with center at (+8,-54,+72)
- 37 voxels (21%) covering 0% of not-labeled with center at (+12,-54,+76)
Cluster 5 - Red
- 124 voxels (72%) covering 8% of Cereb6 r (Cerebelum 6 Right) with center at (+26,-68,-24)
- 37 voxels (21%) covering 1% of Cereb1 r (Cerebelum Crus1 Right) with center at (+36,-64,-30)
- 12 voxels (7%) covering 0% of not-labeled with center at (+20,-60,-32)
Cluster 6 - Red
- 100 voxels (73%) covering 11% of pITG r (Inferior Temporal Gyrus, posterior division Right) with center at (+58,-22,-28)
- 36 voxels (26%) covering 3% of pMTG r (Middle Temporal Gyrus, posterior division Right) with center at (+64,-16,-20)
- 1 voxels (1%) covering 0% of not-labeled with center at (+52,-22,-22)
Cluster 7 - Red
- 70 voxels (61%) covering 5% of Cereb6 l (Cerebelum 6 Left) with center at (-32,-62,-24)
- 44 voxels (39%) covering 2% of Cereb1 l (Cerebelum Crus1 Left) with center at (-38,-60,-28)
DWI Analysis Results
Diffusion Weighted Imaging (DWI) and Diffusion Tensor Imaging (DTI) are two specialized MRI methods that detect water diffusivity over a period of time. This equips researchers with the ability to test potential structural integrity in the brains of ALS patients, which is pivotal in understanding more about the disease. The DWI analysis consisted of 10 ALS patients and 10 Controls, age and sex matched so that the mean age was roughly the same as the fMRI cohort. As for sex, I kept sex relatively equal as well (11:9 male to female ratio) to ensure that sex wasnt a major confounder in any structural disparities. The results of DWI are shown below. Specific ROIs included the corticospinal tract (CST), the Corpus Callosum (CC), the Cingulum Bundle (CING), and the Superior Longitudinal Fasciculus (SLF). Only the CST was extracted bilateraly due to its presence on both hemispheres of the brain, whereas the Corpus Callosum, a midline structure, came as is.
| subject | FA_CST_L | FA_CST_R | MD_CST_L | MD_CST_R | FA_CC | MD_CC | FA_CING | MD_CING | FA_SLF | MD_SLF |
|---|---|---|---|---|---|---|---|---|---|---|
| sub-01 (Control) | 0.307869 | 0.329718 | 0.000553 | 0.000555 | 0.290223 | 0.000596 | 0.273088 | 0.000588 | 0.251783 | 0.000602 |
| sub-03 (ALS) | 0.339416 | 0.335664 | 0.000578 | 0.000591 | 0.301299 | 0.000608 | 0.292247 | 0.000594 | 0.261334 | 0.000612 |
| sub-04 (ALS) | 0.302070 | 0.316782 | 0.000553 | 0.000561 | 0.284005 | 0.000588 | 0.280205 | 0.000588 | 0.242324 | 0.000624 |
| sub-05 (Control) | 0.360501 | 0.349193 | 0.000544 | 0.000566 | 0.287866 | 0.000615 | 0.295073 | 0.000597 | 0.261630 | 0.000622 |
| sub-10 (Control) | 0.324812 | 0.334935 | 0.000553 | 0.000562 | 0.292618 | 0.000561 | 0.274531 | 0.000597 | 0.249027 | 0.000615 |
| sub-13 (ALS) | 0.306844 | 0.307660 | 0.000516 | 0.000531 | 0.264103 | 0.000612 | 0.285218 | 0.000582 | 0.234345 | 0.000560 |
| sub-15 (Control) | 0.342615 | 0.337013 | 0.000510 | 0.000515 | 0.302231 | 0.000560 | 0.300936 | 0.000567 | 0.256430 | 0.000552 |
| sub-18 (ALS) | 0.304676 | 0.327279 | 0.000538 | 0.000546 | 0.294609 | 0.000554 | 0.279348 | 0.000567 | 0.260854 | 0.000562 |
| sub-19 (ALS) | 0.319200 | 0.327784 | 0.000540 | 0.000541 | 0.307813 | 0.000551 | 0.303420 | 0.000576 | 0.250902 | 0.000598 |
| sub-20 (ALS) | 0.326205 | 0.325567 | 0.000561 | 0.000568 | 0.276883 | 0.000580 | 0.280139 | 0.000605 | 0.238440 | 0.000650 |
| sub-25 (Control) | 0.348025 | 0.348566 | 0.000509 | 0.000519 | 0.345261 | 0.000528 | 0.320004 | 0.000549 | 0.277706 | 0.000546 |
| sub-26 (Control) | 0.343433 | 0.336642 | 0.000516 | 0.000521 | 0.295643 | 0.000547 | 0.294850 | 0.000577 | 0.255975 | 0.000567 |
| sub-31 (Control) | 0.383879 | 0.387458 | 0.000535 | 0.000541 | 0.333296 | 0.000550 | 0.331457 | 0.000554 | 0.276529 | 0.000575 |
| sub-36 (ALS) | 0.373239 | 0.370392 | 0.000498 | 0.000508 | 0.293081 | 0.000566 | 0.299429 | 0.000572 | 0.276429 | 0.000568 |
| sub-39 (Control) | 0.329860 | 0.332368 | 0.000540 | 0.000541 | 0.289123 | 0.000576 | 0.271856 | 0.000596 | 0.248136 | 0.000605 |
| sub-41 (ALS) | 0.299833 | 0.320766 | 0.000580 | 0.000554 | 0.264683 | 0.000620 | 0.269943 | 0.000625 | 0.221127 | 0.000647 |
| sub-46 (Control) | 0.318917 | 0.332617 | 0.000518 | 0.000515 | 0.288006 | 0.000548 | 0.270737 | 0.000564 | 0.245542 | 0.000545 |
| sub-48 (ALS) | 0.318275 | 0.324789 | 0.000524 | 0.000526 | 0.289760 | 0.000570 | 0.272996 | 0.000580 | 0.241333 | 0.000579 |
| sub-52 (ALS) | 0.297918 | 0.307116 | 0.000545 | 0.000576 | 0.285589 | 0.000588 | 0.259868 | 0.000597 | 0.237362 | 0.000589 |
| sub-65 (ALS) | 0.308513 | 0.316505 | 0.000572 | 0.000598 | 0.286537 | 0.000567 | 0.278578 | 0.000576 | 0.242332 | 0.000594 |
Diffusion-weighted imaging (DWI) revealed multiple structural alterations consistent within the known ALS pathology. For instance, corticospinal tract (CST) fractional anisotropy (FA) was observed to be slightly lower in ALS participants compared to controls, indicating possible reduced white matter integrity within the primary motor pathway leading to the spinal areas. Conversely, mean diffusivity (MD) within the CST was elevated in ALS patients relative to controls, suggesting increased water diffusion associated with axonal degeneration or myelin disruption. Together, these complementary diffusion metrics support the presence of structural degeneration along the motor pathways that are characteristically affected in ALS.
Beyond the corticospinal tract, additional white matter tracts demonstrated patterns that may reflect extra-motor involvement in ALS. Moderate differences were observed within the corpus callosum and superior longitudinal fasciculus, both of which showed trends toward reduced FA and increased MD in ALS participants. These findings may indicate broader disruptions in interhemispheric communication and frontoparietal connectivity. In contrast, the cingulum bundle demonstrated comparatively smaller differences between groups, though subtle alterations were still present. Collectively, these results suggest that while degeneration is most pronounced in motor pathways such as the CST, ALS-related microstructural changes may extend into association and network-supporting tracts, providing structural context for the functional connectivity alterations observed in the fMRI analyses.
This table shows the FA results, calculated with the results from the table above.
| Tract | Control Mean | ALS Mean | Cohen's d | Effect |
|---|---|---|---|---|
| CST_mean | 0.3391 | 0.3206 | 0.47 | Medium |
| Corpus Callosum | 0.3020 | 0.2859 | 0.40 | Small–medium |
| Cingulum | 0.2907 | 0.2825 | 0.21 | Small |
| SLF | 0.2577 | 0.2469 | 0.36 | Small–medium |
This table illustrates the MD results, calculated with the results from the table above.
| Tract | Control Mean | ALS Mean | Cohen's d | Effect |
|---|---|---|---|---|
| CST_mean | 0.0005364 | 0.0005561 | 0.67 | Medium–large |
| Corpus Callosum | 0.0005640 | 0.0005846 | 0.50 | Medium |
| Cingulum | 0.0005776 | 0.0005877 | 0.30 | Small |
| SLF | 0.0005808 | 0.0006006 | 0.55 | Medium |
Tests such as Cohen's d were used to compare the magnitude of the differences between the two units of standard deviation. Additionally, because the sample size was relatively modest, this ensured that even if a p test was run to decide statistical significance, these results would show the magnitude of difference was truly a hallmark of ALS pathology rather than an effect just due to chance.
Multi Omics analyses results - Transcriptomics and Proteomics
Proteomics analysis - GO Enrichment Pathway Results
To interpret the proteomics differential expression results provided by Answer ALS in a mechanistic context, I performed Gene Ontology (GO) enrichment analysis on the differentially expressed protein set. GO enrichment tests whether specific cellular structures or biological contexts are represented more frequently in the study list than would be expected by chance (relative to the background “population”). The study frequency vs population frequency, alongside the p-value and multiple-testing corrected q-value, indicate which GO terms are statistically over-represented and therefore most plausibly linked to disease-associated biology. This analysis was mainly to understand which targets were viable, and if having them as MTDL targets would prove to be effective and novel.
Across the enriched terms, four cellular themes emerged:
Supramolecular complex (GO:0099080)
- refers to large multi-protein assemblies (e.g., ribonucleoprotein complexes, cytoskeletal assemblies, and other macromolecular machines). Enrichment of this term suggests that ALS-associated proteomic changes are concentrated in proteins that function through large cooperative complexes, consistent with the idea that disruption of coordinated protein/RNA machinery can have outsized effects in neurons.
Intracellular membraneless organelle (GO:0043232)
- refers to compartments that lack lipid membranes and instead form through dynamic molecular interactions, often described as phase-separated condensates (examples include stress granules, nucleoli, and other RNA/protein granules). Enrichment here implies dysregulation of RNA handling, stress responses, and protein–RNA assembly dynamics, which is particularly relevant to ALS because disease mechanisms strongly involve RNA-binding proteins and aberrant granule/aggregate behavior.
Dendrite (GO:0030425)
- indicates that many altered proteins localize to or function within dendrites—neuronal structures responsible for receiving and integrating synaptic input. Enrichment of dendrite-associated proteins supports a model where ALS involves not only motor neuron cell body degeneration, but also early synaptic/dendritic dysfunction, which can precede overt cell loss and contribute to network-level impairment.
- The proteins that were involved in this
Growth cone (GO:0030426)
- refers to the motile structure at the tip of growing or remodeling neurites (axons and dendrites) that controls guidance, extension, and cytoskeletal dynamics. Enrichment of growth cone proteins suggests disruption in neurite outgrowth, axonal maintenance, and cytoskeletal regulation—processes that are highly relevant to ALS, given the vulnerability of long motor neuron axons and known axonal transport/cytoskeletal pathology.
Taken together, these GO results point to a coherent disease-relevant picture: proteomic changes in ALS are enriched for proteins involved in large macromolecular assemblies and membraneless RNA/protein compartments, alongside neuronal structural compartments (dendrites and growth cones). This convergence supports the hypothesis that ALS pathology reflects combined disruption of RNA/protein complex biology and neuronal structural integrity, which provides a mechanistic rationale for selecting therapeutic targets that span more than one pathological axis.
Transcriptomics Pipeline Errors
Unfortunately, due to Seurat pipeline errors, my transcriptomics pipeline had to be delayed in order to prioritize MTDL design. However, I expect that by the fair date, my ASO and transcriptomics pipeline will be completed, and any additional tests to optimize both the ASO and MTDL will be complete as well.
Drug Design and Rationales
My analyses in DWI, fMRI, and proteomics revealed that there were significant disruptions widespread in convergent regions. For instance, my analyses revealed that the top proteins were involved in pathways that are significantly enriched in neuron atrophy as well as microglial activation. After researching the effects of certain proteins on the ALS pathology, I decided that my multi target directed ligand should focus on the following functions:
- Chelate heavy metal ions out of the brain, allowing for less toxic compounds in the brain, which has been correlated to ALS pathology
- Antioxidant properties to stabilize free radicals (Edavarone-like function)
- Potentially foster TDP-43 stabilization by binding to the RRM1 and RRM2 domains, potentially even the N-terminal domain
- Anchor SFPQ protein, potentially preventing toxic aggregates within the cytoplasm of the cell by chelating zinc ions out of the SFPQ structure, which could slow down or even stop SFPQ protein aggregation
- BASP1 reinforcement, because dysregulation causes this intrinsically disordered protein to begin acting irregularly.
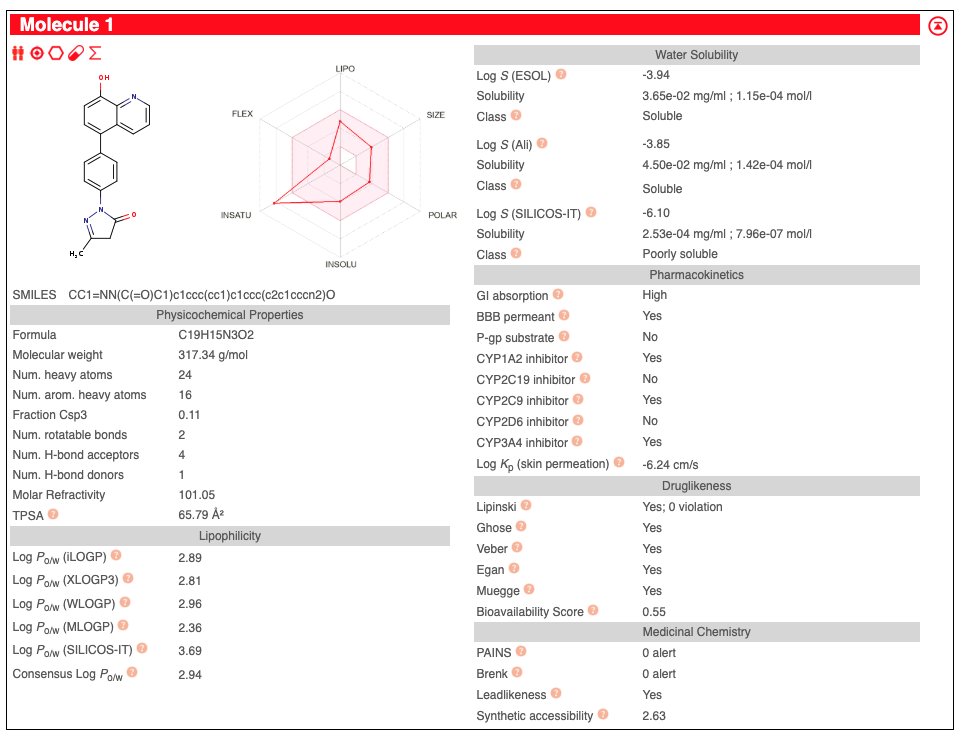
This drug design was achieved by taking Edavarone (Radicava) and attaching a chemical linker to the 4 end of the B group (phenyl group). Additionally, 8 Hydroxyquinoline.
Data
General Figures
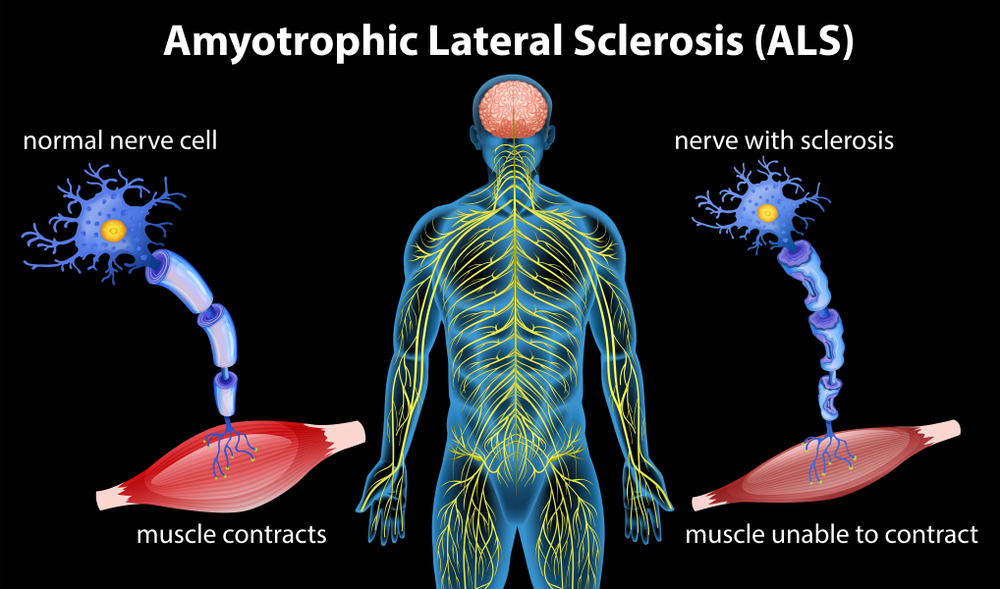 Fig 1.1 - Problem - shows the difference between normal electrical transmissions between motor neurons and muscle cells, compared to ALS-affected motor neurons, a significant change in the structure and the responding efficiency of electrical transmissions
Quality Control - fMRI Data
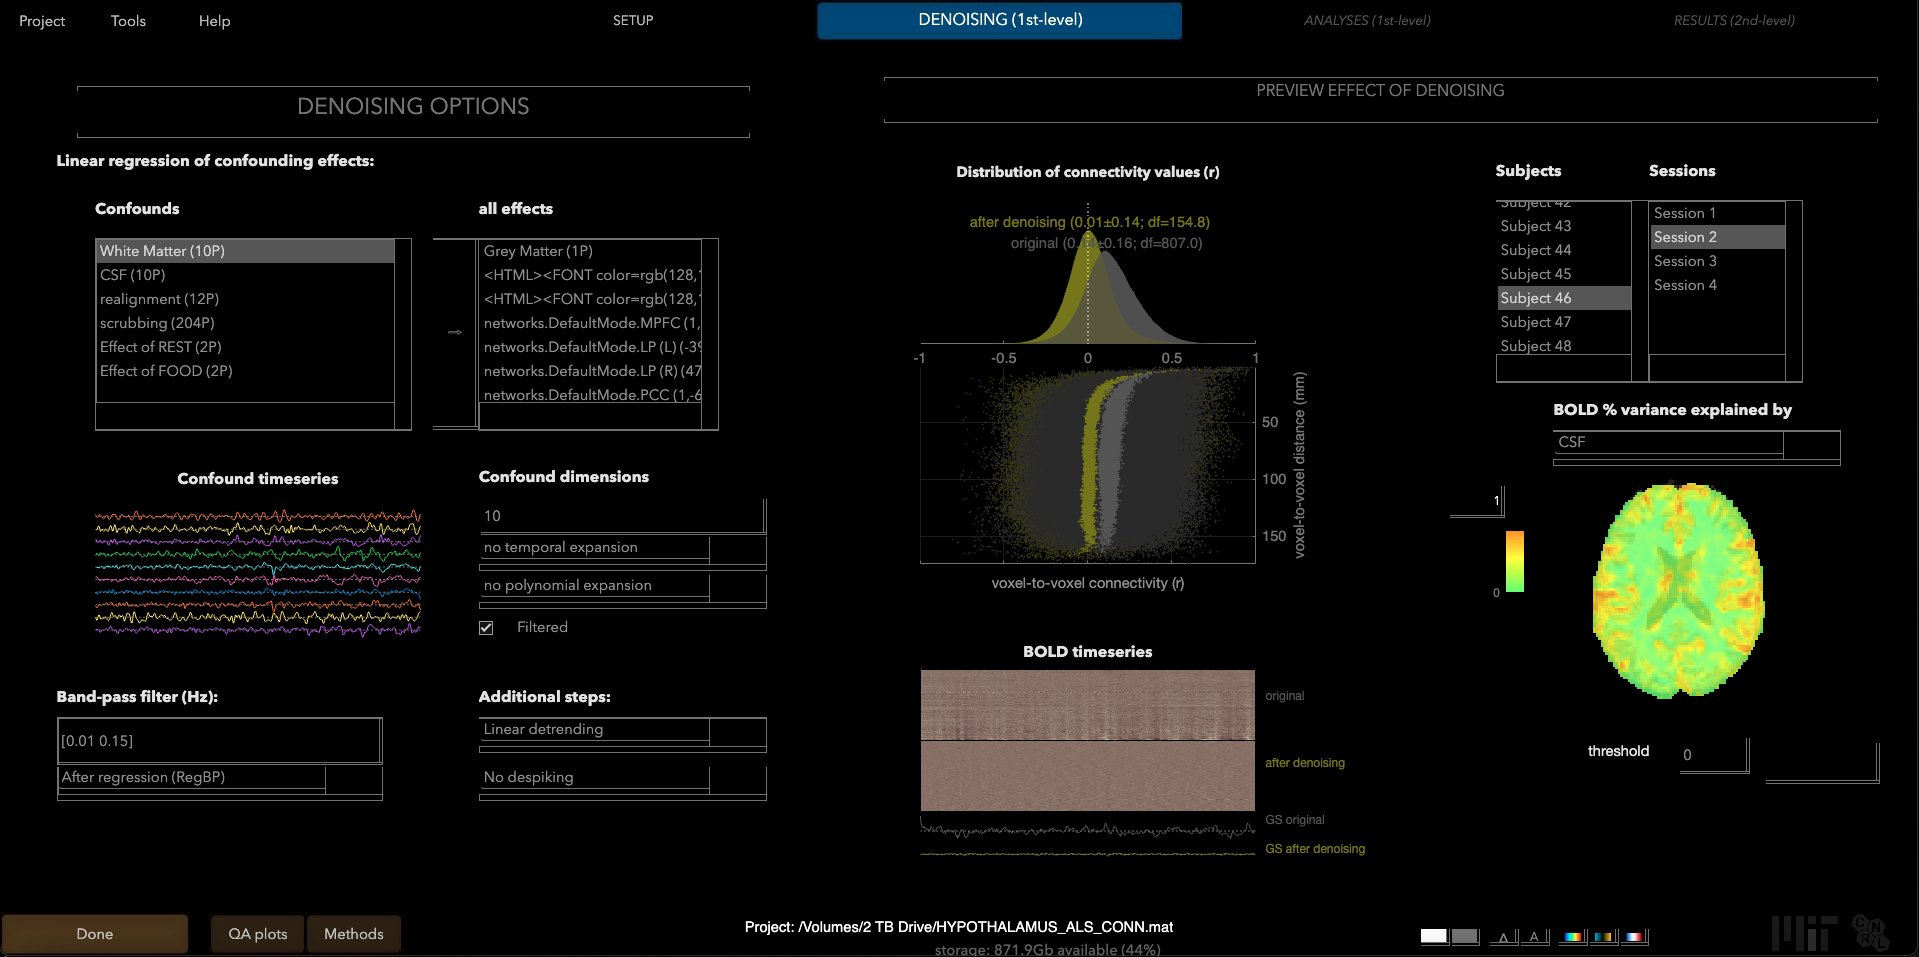 Applying settings (pre-denoising) in the Denoising tab of the CONN Toolbox, ensuring quality of scans and proper settings.
Quality Control - Transcriptomics MultiQC Reports
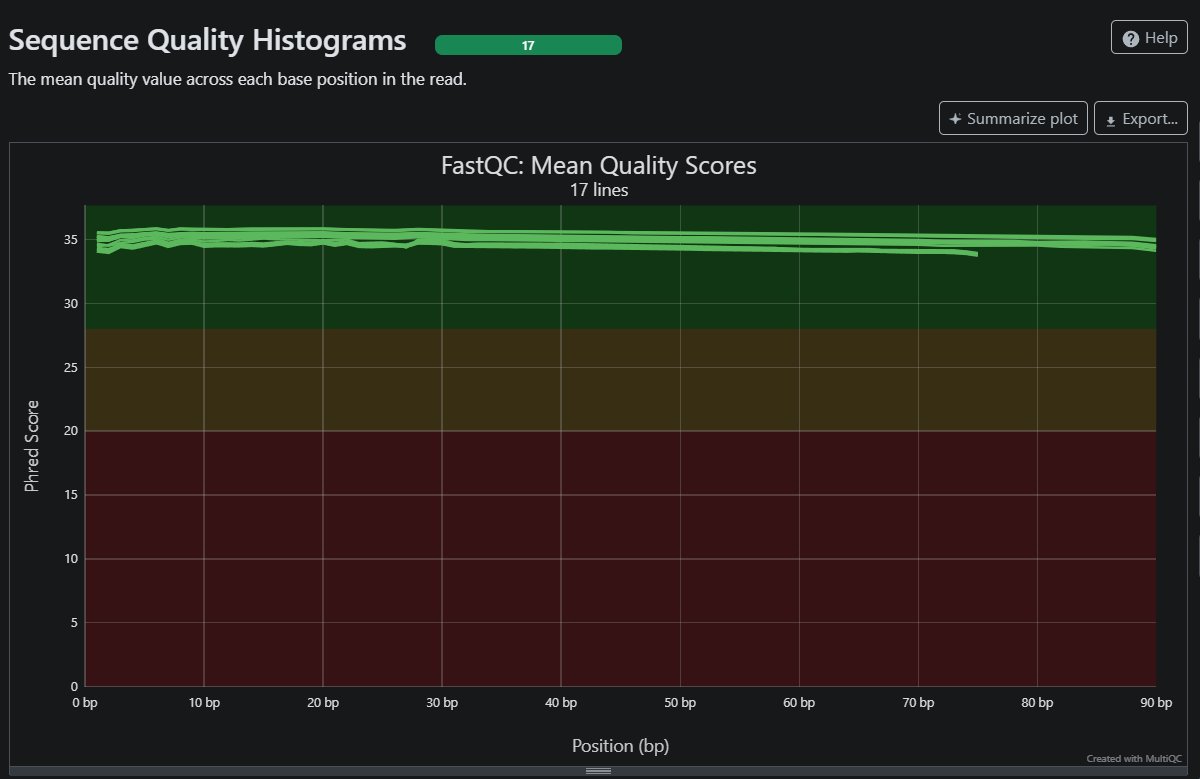 Mean quality scores from my 16 ALS patients yield high resulls, as shown with a mean score above pHRED > 35 all the way through 90
Figures - fMRI data
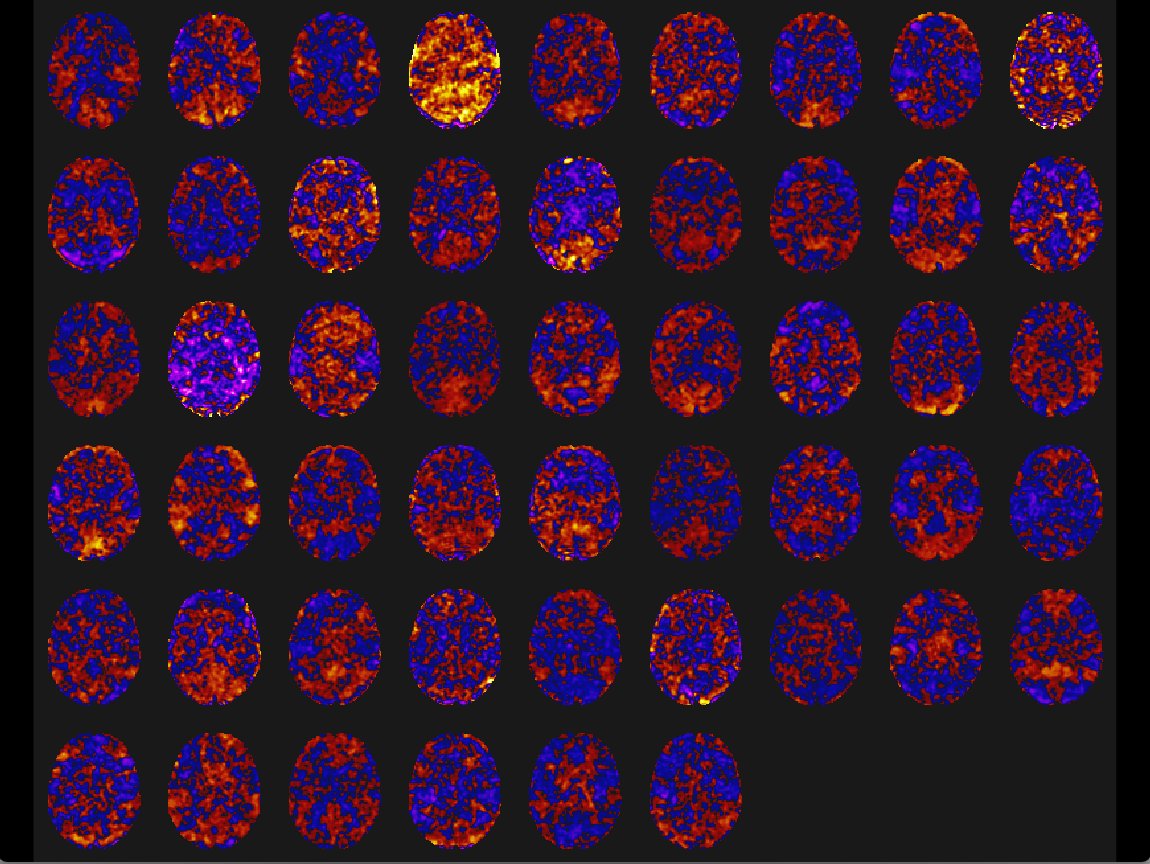 Shows mini movie map for all 51 patients in an ICA component. The variation of connectivity is filtered by selected components.
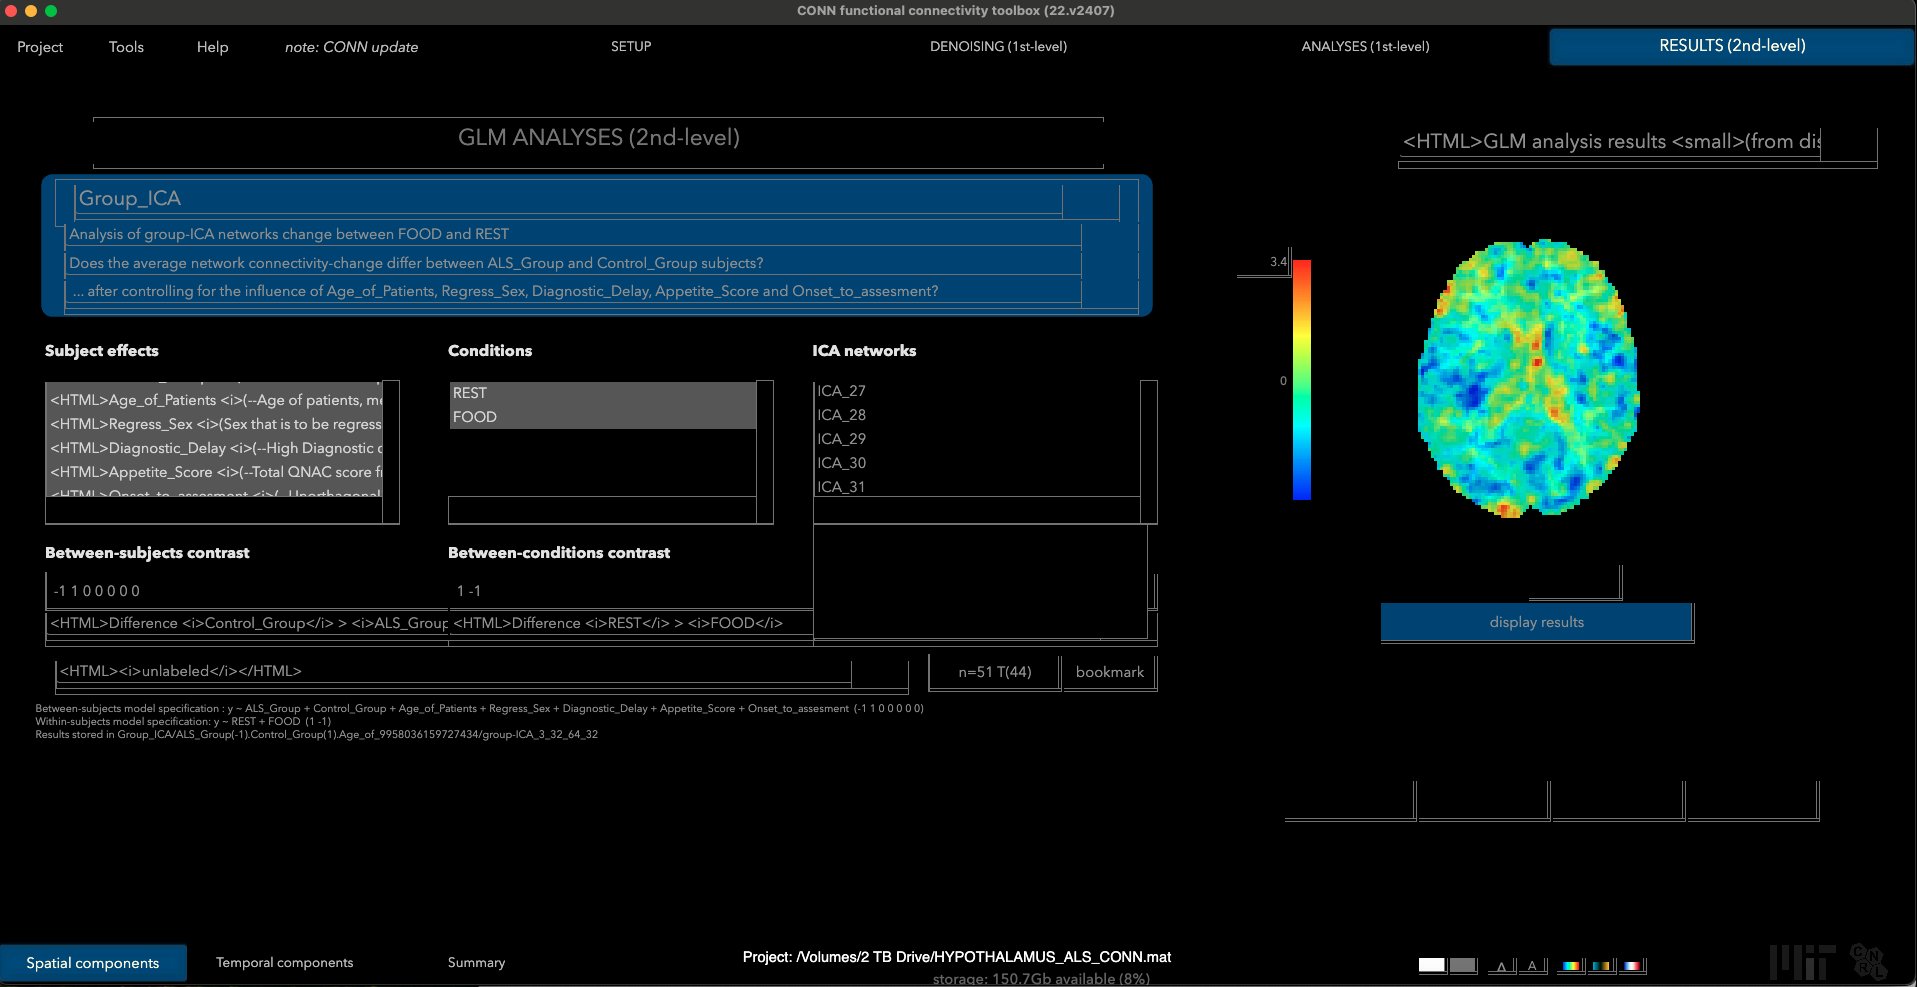 GLM pictures viewed in the CONN toolbox as Group ICA (group results) visualized for chosen ICA component.
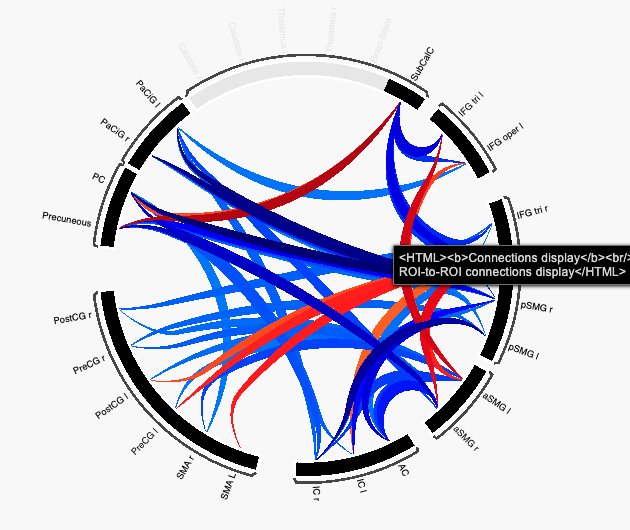 The connectome ring of Task based fMRI at p-FWE correction.
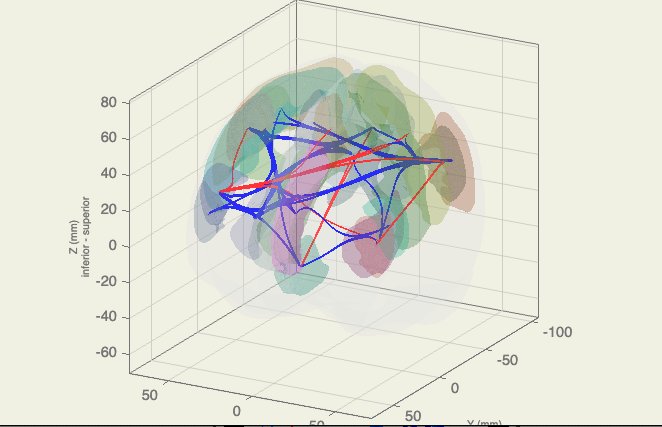 Connectome parcellations within task based fMRI.
Figures - DWI data
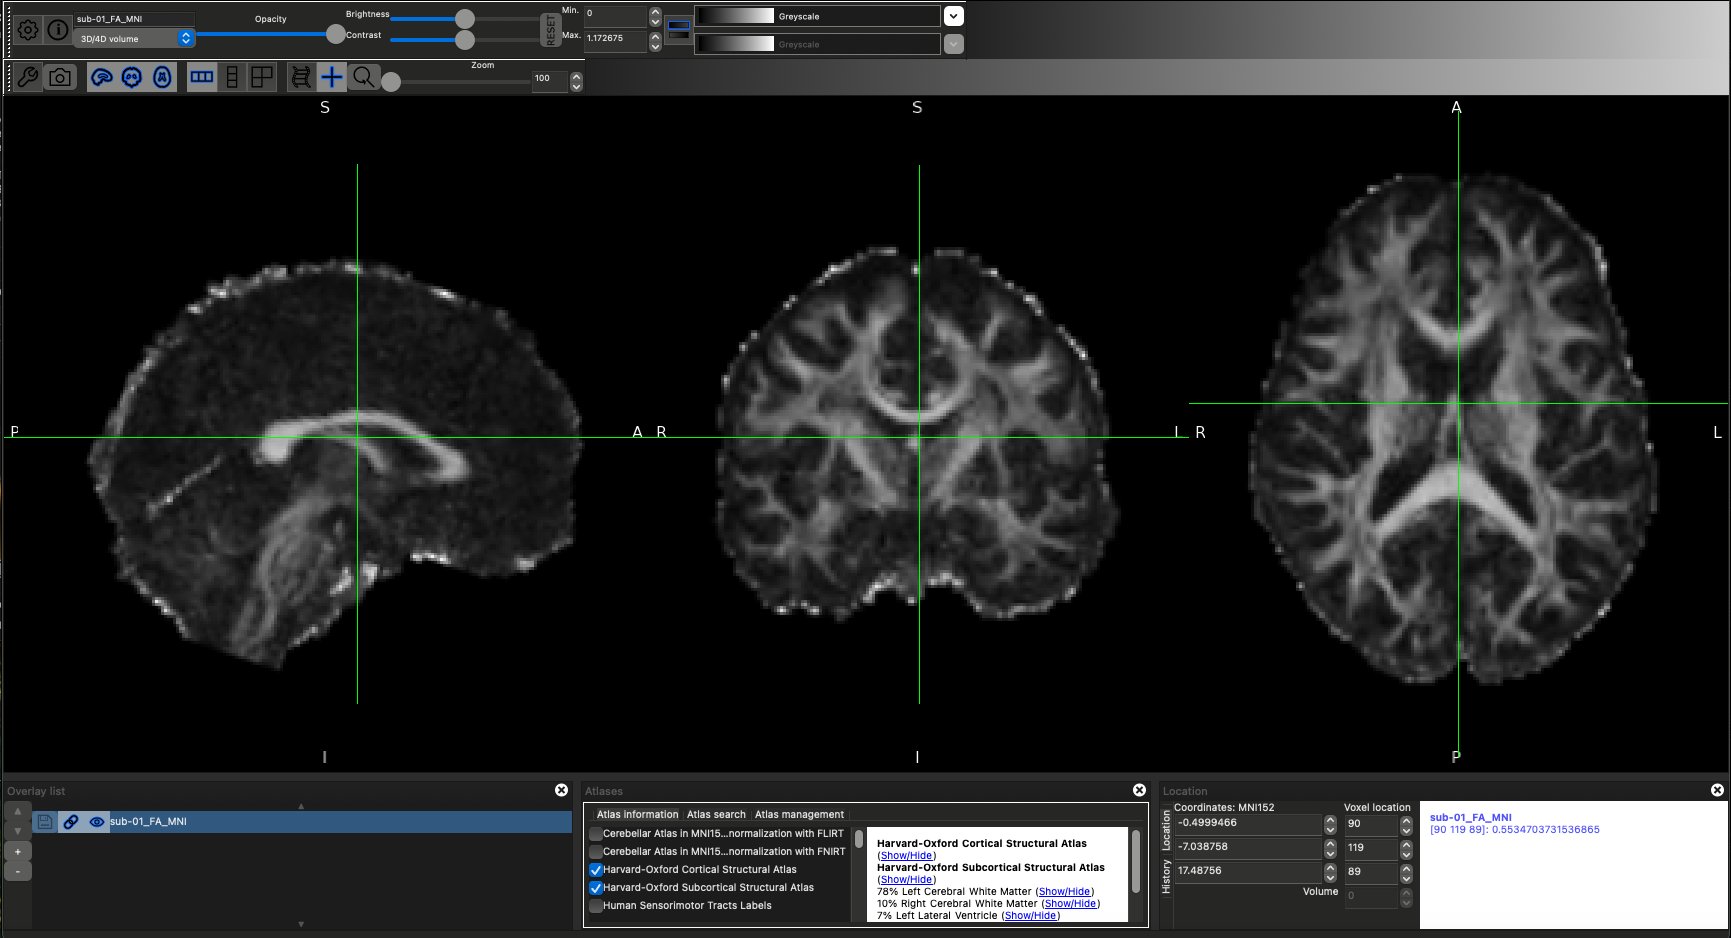 DTI scan overlayed with Harvard-Oxford atlases.
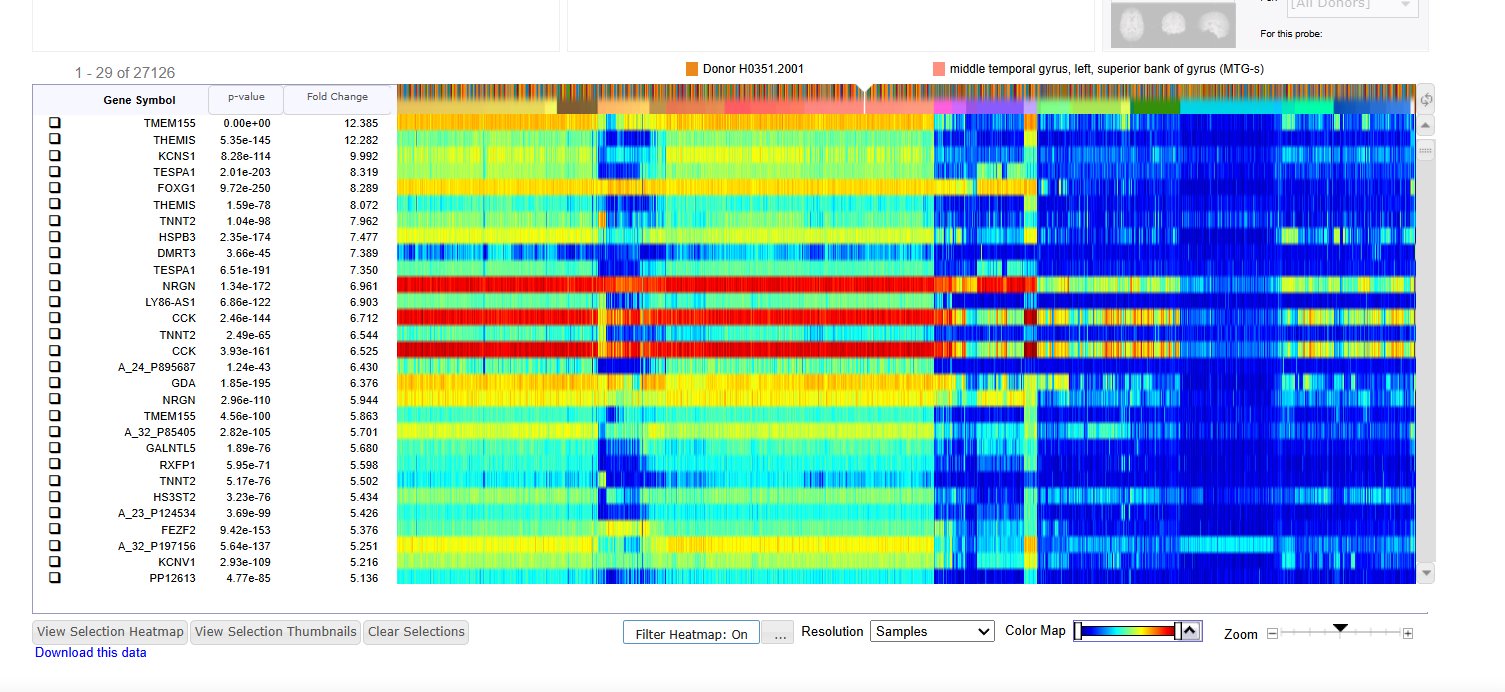
Shows differential gene expression search in the Allen Brain Atlas with the target structures of the Precentral Gyrus (left and right, superior and inferior) against the rest of the brain.
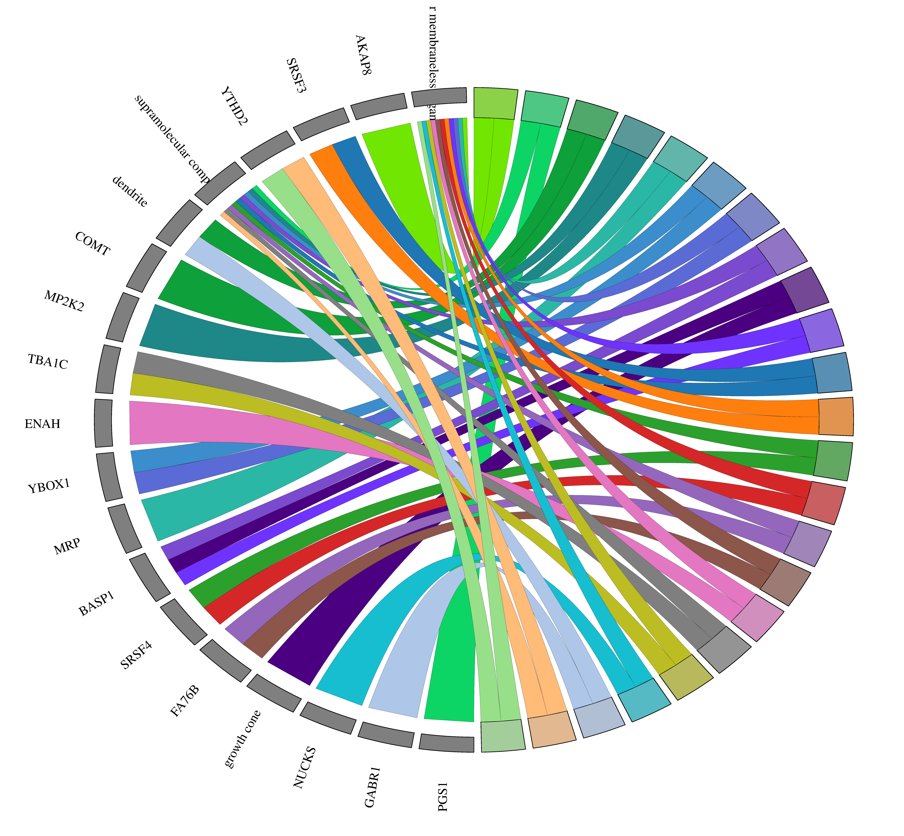 GO chord plot visualized using SRplot after GOEnrichment was done in Galaxy EU.
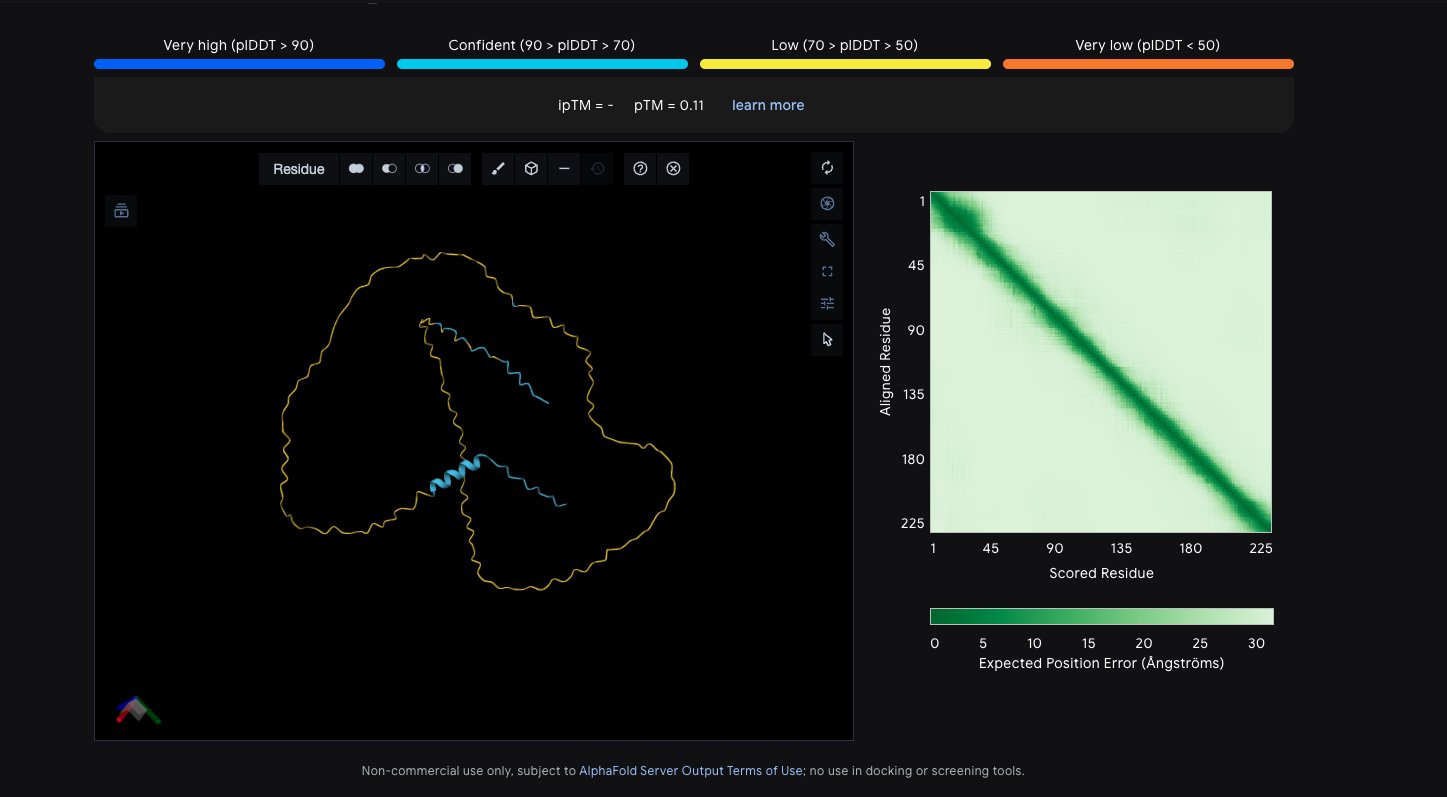 Regions of BASP1 protein where uncertainty is high, predicted by AlphaFold.
Conclusion
Amyotrophic Lateral Sclerosis (ALS) is a complex and multifactorial neurodegenerative disorder characterized by progressive motor neuron loss, widespread neural network disruption, and extensive molecular dysregulation. This project employed a multimodal analytical framework integrating neuroimaging, transcriptomic, and proteomic datasets to identify potential therapeutic targets and explore a rational dual-therapy strategy for the disease.
Diffusion MRI analysis demonstrated structural alterations consistent with known ALS pathology. Reduced fractional anisotropy within the corticospinal tract suggested degeneration of major motor pathways, while increased mean diffusivity across several white-matter regions indicated potential microstructural disorganization and axonal loss. These findings support the established concept of ALS as a network-level degenerative disorder rather than a purely localized motor neuron disease.
Resting-state functional MRI analyses further reinforced this network-based pathology. Group independent component analysis and region-based connectivity analyses revealed altered connectivity within motor and sensorimotor networks, suggesting disrupted communication between cortical regions responsible for motor planning, execution, and sensory integration. Together, the structural and functional imaging findings highlight the widespread neural reorganization that occurs as ALS progresses.
To investigate the molecular drivers underlying these neural alterations, omics datasets from patient-derived motor neurons were analyzed. Differential expression and gene ontology enrichment analyses revealed significant associations with pathways involved in growth cone dynamics, dendritic structure, supramolecular complexes, and intracellular membraneless organelles, all of which are critical to neuronal stability and axonal maintenance. These pathways suggest that cytoskeletal organization, synaptic integrity, and intracellular transport processes may play key roles in ALS progression.
Using these findings, a mechanistically guided therapeutic strategy was proposed. Candidate molecular targets identified from the omics analysis informed the design of a multi-target directed ligand (MTDL) intended to modulate multiple dysfunctional pathways simultaneously. In parallel, transcriptomic analysis was used to identify potential antisense oligonucleotide (ASO) targets capable of reducing expression of pathogenic genes. By combining small-molecule pharmacology with gene-silencing approaches, this framework attempts to address the multifactorial nature of ALS pathology rather than focusing on a single molecular target.
Overall, this study demonstrates that integrating neuroimaging and omics data can provide a powerful systems-level understanding of neurodegenerative disease. The results highlight specific neural networks and molecular pathways that may contribute to ALS pathology and present a proof-of-concept workflow for identifying potential therapeutic strategies.
Future Directions
While this study provides an exploratory framework for multimodal ALS analysis and therapeutic hypothesis generation, several avenues for future work could further strengthen and expand these findings.
First, larger patient cohorts and longitudinal imaging data would allow for improved statistical power and a clearer understanding of disease progression. Tracking structural and functional connectivity changes over time could reveal how network disruptions evolve throughout the disease course. For instance, not all Answer ALS proteomics data was utilized due to difficulty in file manipulation that prevented the project from progressing.
Second, additional single-cell transcriptomic and proteomic analyses across multiple brain regions may help identify cell-type-specific mechanisms of ALS pathology. Motor neurons, astrocytes, oligodendrocytes, and microglia each contribute to disease progression, and future analyses could determine how molecular dysfunction differs between these cell populations. The datasets that were utilized were primarily the motor cortex, so expanding to find more widespread patterns from there may benefit greatly
Third, the candidate therapeutic molecules identified in this study require experimental validation. In silico docking and pharmacokinetic predictions provide an initial assessment of feasibility, but in vitro testing in motor neuron cell models and in vivo testing in ALS model organisms would be necessary to evaluate therapeutic potential and safety. Finally, future research could further develop the integrated therapeutic framework combining MTDL and ASO approaches. Such combination therapies may offer improved treatment outcomes by targeting both molecular dysfunction and gene expression abnormalities simultaneously.
Impact
ALS remains a devastating disease with limited treatment options and a poorly understood etiology. By integrating multimodal datasets and applying systems-level analysis, this project contributes to a growing body of research that views ALS as a complex network and molecular systems disorder.
The analytical framework developed in this study demonstrates how combining neuroimaging, transcriptomics, and proteomics can generate mechanistically informed therapeutic hypotheses. Such approaches may accelerate target discovery and improve the efficiency of drug development pipelines for neurodegenerative diseases.
More broadly, the methodology used here could be applied to other neurological disorders such as Parkinson’s disease, Alzheimer’s disease, and frontotemporal dementia. As multimodal biomedical datasets continue to grow, integrative computational strategies like the one presented in this study may become increasingly important for translating large-scale biological data into actionable therapeutic insights.
Citations
Inspiration for aspects of the computational drug design framework was drawn from a previous student research project presented at the Canada-Wide Science Fair platform (Sara Waqas).
CYSF. (n.d.). https://platform.cysf.org/project/91e3c3d2-0fa5-4dbc-b415-62a6cc09ff27/
Background Literature Citations:
- Brown RH, Al-Chalabi A. Amyotrophic lateral sclerosis. New England Journal of Medicine. 2017;377(2):162–172. Accessed Dec 12, 2025.
- Hardiman O, Al-Chalabi A, Chio A, et al. Amyotrophic lateral sclerosis. Nature Reviews Disease Primers. 2017;3:17071. Accessed Dec 13, 2025.
- Taylor JP, Brown RH, Cleveland DW. Decoding ALS: from genes to mechanism. Nature. 2016;539(7628):197–206. Accessed Dec 14, 2025.
- Renton AE, Chio A, Traynor BJ. State of play in amyotrophic lateral sclerosis genetics. Nature Neuroscience. 2014;17(1):17–23. Accessed Dec 15, 2025.
- Al-Chalabi A, Hardiman O. The epidemiology of ALS: a conspiracy of genes, environment and time. Nature Reviews Neurology. 2013;9(11):617–628. Accessed Dec 16, 2025.
- Philips T, Rothstein JD. Glial cells in amyotrophic lateral sclerosis. Nature Reviews Neuroscience. 2014;15(9):595–610. Accessed Dec 17, 2025.
- Yamanaka K, Komine O. The multi-dimensional roles of astrocytes in ALS. Neuroscience Research. 2018;126:31–38. Accessed Dec 18, 2025.
- Paez-Colasante X, Figueroa-Romero C, Sakowski SA, Goutman SA, Feldman EL. Amyotrophic lateral sclerosis: mechanisms and therapeutics in the epigenomic era. Neurobiology of Disease. 2015;82:151–160. Accessed Dec 19, 2025.
- Masala A, Solla P, Liscia A, et al. Epigenetic regulation in amyotrophic lateral sclerosis. Frontiers in Neuroscience. 2018;12:1023. Accessed Dec 19, 2025.
- Chestnut BA, Chang Q, Price A, Lesuisse C, Wong M, Martin LJ. Epigenetic regulation of motor neuron cell death in ALS. Neurotherapeutics. 2017;14(1):119–134. Accessed Dec 20, 2025.
- Dupuis L, Pradat PF, Ludolph AC, Loeffler JP. Energy metabolism in amyotrophic lateral sclerosis. Lancet Neurology. 2011;10(1):75–82. Accessed Dec 20, 2025.
- Cistaro A, Pagani M, Montuschi A, et al. The metabolic signature of amyotrophic lateral sclerosis: FDG PET imaging evidence. European Journal of Nuclear Medicine and Molecular Imaging. 2012;39(5):841–850. Accessed Dec 21, 2025.
- Neumann M, Sampathu DM, Kwong LK, et al. Ubiquitinated TDP-43 in frontotemporal lobar degeneration and amyotrophic lateral sclerosis. Science. 2006;314(5796):130–133. Accessed Dec 21, 2025.
- Ling SC, Polymenidou M, Cleveland DW. Converging mechanisms in ALS and frontotemporal dementia. Neuron. 2013;79(3):416–438. Accessed Dec 22, 2025.
- Tam OH, Ostrow LW, Gale Hammell M. Diseased neurons in ALS reveal altered RNA processing and epigenetic regulation. Nature Neuroscience. 2019;22(10):1675–1686. Accessed Dec 22, 2025.
These citations are what were used to develop the foundation of understanding within this project, focusing on various mechanisms that contribute to the disease. Any additional sources, error notes, and methodology references are included in the project construction log, which will be available at time of judging.
Acknowledgement
AI tools such as ChatGPT and Gemini WERE utilized as learning and clarification tools to subside the steep learning curve of tools such as FSL and the CONN toolbox. Specifically for MATLAB scripts (because I do NOT know the programming language that MATLAB requires), I used ChatGPT to generate me those scripts (with substantial trial and error) until I could succesfully upload my data into the CONN toolbox. NOTHING AI-generated has been included within the writeup of this project.
Thank you to Ms. Kalma and Ms. Fillipovic (my science teachers), Ms. O'Keefe (my science fair coordinator), and all others who assisted me in my project when it seemed absurdly impossible. Thanks also to my family who supported me emotionally through the massive undertaking of this project, because your support never hindered my ability to complete something I am passionate about.
Special thanks to Ms. Kelsey Valentine on behalf of On Point Science and Answer ALS (Neuromine Data Portal) for providing me with the high throughput omics data used extensively in my project. Additional thanks to OpenNeuro.org (PET and fMRI data retrieval), ALS Knowledge Portal (for genomic validation) and ALS Compute (for additional validation of drug targets).
Thank you to all those who volunteer at the CYSF for making scientific strides possible for youth!
ADDITIONAL NOTE
Some aspects of my project were not able to be completed by the deadline due to unexpected errors or pipeline hangs. However, on the date of the fair, I expect to have all these aspects complete, which include PET analysis, finishing up my transcriptomics analysis, and designing/in silico validation of the ASOs' feasibility.