
Improving Algorithmic Transparency: A Comparative Study of SHAP and ELI5 for Younger Gen Z Retail-Level Investors
Jennilia Peter
Ernest Manning High School
Grade 11
Presentation
Hypothesis
If Younger Gen Z non-experts are provided with visual-quantitative plots (SHAP Waterfall) vs. narrative qualitative summary(ELI5) for algorithmic swing trading signals, then…
- Mental Model Accuracy: The SHAP group will demonstrate a higher level of retention of the weight and effect of each financial factor, leading to a better result in “What if” logic assessments. This is due to the visual distribution of the chart representing a direct correlation of how the decision was made in both direction and magnitude, enabling better cognitive visualization
- Delta Trust: The ELI5 group will display a higher level of “Delta Trust”(increase in confidence behind the algorithm’s choice) due to its similarity to LLMs(Large Language Models), a tool in which 47% Gen Z individuals use weekly (According to Walton Family Foundation), possibly mistaking clear prose for accurate math, falling victim to the Automation Bias.
Research
0.0 Aspects/Issues Explored by this Question
“To what extent do visual-quantitative (SHAP) versus narrative-qualitative (ELI5) xAI explanations influence Younger Gen Z user trust and mental model accuracy in rule-based algorithmic trading?”
i) Investing Accessibility
Recently, Artificial Intelligence(AI) and Financial Democratization movements have been taking the world of finance by storm. Becoming a key to solving inaccessibility in financial management for the rising generation. Large language models (LLMs), like Gemini and ChatGPT, can now offer personalized financial advice for free, and the friendly UX behind budgeting apps encourages financial planning. According to Investopedia, “Firms like State Street and BlackRock have launched new exchange-traded funds (ETFs) to offer retail investors private credit strategies.” Could this be pivotal to solving the socioeconomic gap between classes, or a way for private companies capitalizing off of the FOMO of retail investors? How can we take AI to the next level for closing the gap between “high intelligence” and “low UX” within apps made for retail investing?
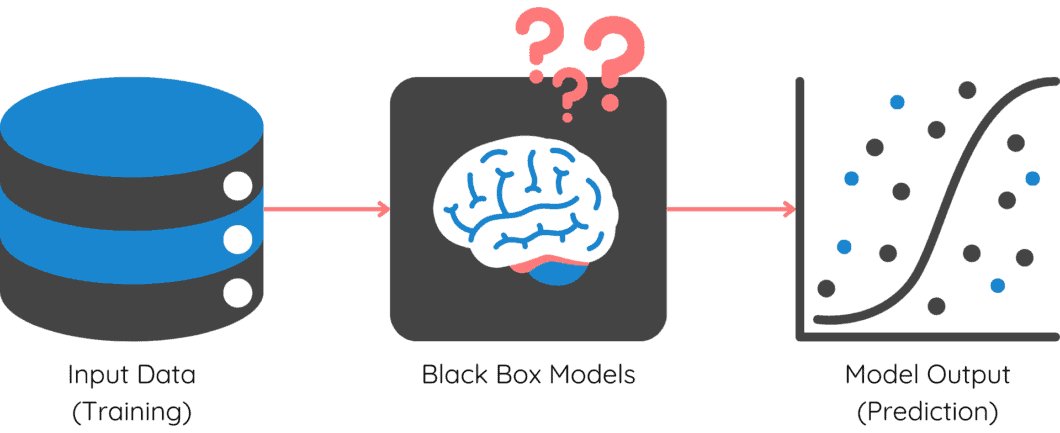
ii) The "Black Box" Problem
Artificial Intelligence is an extremely powerful instrument, with the capabilities of detecting patterns that humans can’t simply recognize. Yet despite its potency, it cannot explain the reasoning behind its answers; it only reveals an input and output with a mystery in between. Laura Blattner, an assistant professor of finance at Stanford GSB, reflects on AI’s limitations when it comes to human-computer interaction(HCI), “If these black boxes are being used to make a high-stakes decision in lending, insurance, healthcare or the judicial system, we have to decide whether we feel comfortable not knowing exactly why the decision was being made.”
In the field of lending, an AI model can analyze over 600 variables that contribute to a credit score, over a few dozen that traditional loan decisions are derived from, for a more precise and fair answer. Yet despite this, U.S lenders tend to be skeptical of these tools due to their lack of credibility. When applying this to algorithmic trading, the aversion to implementing such tools in retail investing has been amplified. The lack of investment literacy and monetary sensitivity from non-experts, combined with the ominousness of AI, makes people skeptical.
Fig 1.0 "Black Box" Visual
iii)The "Overtrust" Problem
“Overtrust” in terms of AI refers to the psychological phenomenon of human users placing excessive confidence in such systems, often overlooking critical analysis of AI’s input and reliability. This is often caused by multiple factors, with the most prominent one in algorithmic trading being the automation bias. The automation bias refers to the human tendency to trust automated systems when emotionally pressured, faced with complex information and lacking time. These are often aspects faced by non-experts/new traders.
iv) 2026 Adolescent exposure to AI
The rising generation is born in the “Digital Nativity" period, growing alongside social media, advanced UX and online learning during the COVID-19 pandemic. Artificial intelligence is relatively new, even for adolescents of this time, yet despite this, they have managed to integrate the use of artificial intelligence, mainly LLMs, into everyday life. Negatively impacting adolescent emotional, social and critical skills.
To what extent will Gen Z trust AI and good UX in an algorithmic environment?
v) Narrative vs. Visual Comprehension
Humans are often defined to be “visual” creatures, a survival trait passed down from our ancestors, but in this day and age, what format enables optimized comprehension? According to NIH, the high cognitive demand is that sequential logic from narratives is better suited for complex information. Yet for rapid processing and cognitive ease, visuals are key. Another interesting aspect of the study is that the extent of enhanced apprehension comes from exposure to such visuals; therefore, not universal.
In trading, for professionals, visual tools can clearly showcase an immediate result, while narrative tools can help traders find themes within patterns. When applying these factors to algorithmic trading for non-experts, it raises the question: What format (Narrative vs. Visual) helps beginner investors understand trading?
1.0 Creating the Optimal Algorithm
i) What is Artificial Intelligence?
Artificial Intelligence utilizes computational learning and reading to carry out advanced tasks that need human intellect through computer science, data analytics, statistics, software engineering and neuroscience. An example of a complex assignment may be analyzing data, linguistic comprehension and insights.
ii) What is Algorithmic Trading?
The use of computer algorithms to automate the trading process and execute these trades that specifical intervals by combining programming and financial market analysis. It is also known as automated trading or black-box trading (the issue we are trying to solve).
iii) Finding the best framework
To simulate a professional portfolio, I decided to organize my selected stocks into three risk-stratified categories, drawing inspiration from my role as the Lead Quantitative Analyst in the Wharton Junior Investment Program, where I first introduced the initial model when working alongside my team. Together, we refined it and devised a “Triathlon” analogy that perfectly describes the level of volatility(sensitivity to the market) in each category:
- The “Swim”(Conservative): Comprised of ETFs like AGG, BSV, SCHD. These assets are centred on broad diversification, price stability, and long-term longevity, acting as an anchor of the portfolio.
- The “Run”(Moderate): Consisting of a mix of ETFs and stocks like VOO, MSFT, CEG, WCN, and AMT. These are industry leaders known for consistent growth and established market share within their respective sectors.
- The “Bike”(Aggressive): Made up of QQQ, ICLN, PAVE, NVDA, AVAV. These tech stocks and ETFs contribute to short-term exponential portfolio growth.
Code Block 1.0 Ticker Groups
def compile():
# prep for group_closing_prices_calc
Ticker_Groups={
"The Swim Average": ["AGG", "BSV", "SCHD"],
"The Bike Average": ["VOO", "MSFT", "CEG", "WCN", "AMT"],
"The Run Average": ["QQQ", "ICLN", "PAVE", "NVDA", "AVAV"]
}
NOTE*** While the “Triathlon” categorization was developed during my extracurricular program, all other elements in this project were developed independently for this research.
iv) Choosing the Underlying Strategy
Mean Reversion (Bollinger Bands): Best SMA for choppy markets that bounce between an equilibrium
Bollinger Bands consist of 3 lines: the middle band is the moving average, with the upper and lower bands representative of a certain number of standard deviations above and below the mean. In a normal distribution, about 95% of the values will be contained between these lines. By taking advantage of this principle and market elasticity, the algorithm will go short when it hits the upper band and long when it hits the lower band.
Figure 1.1 Standard Deviation Calculation

Pros:
- Representative of volatility measurement
- Clear identification of trends and potential breakpoints
- Excellent when used alongside other indicators
Cons:
- Lagging indicator
What algorithm did I end up choosing and why? A Mean Reversion strategy using Bollinger Bands applied to my "Triathlon" portfolio (Swim, Bike, and Run sections).
- Interpretability: Bollinger Bands are excellent for Heuristic Mapping (conceptualization) due to their visual nature and association with oscillation. The use of a common statistical limit with a simple ideology (Standard deviation) is a topic that can be intuitively understood by non-experts.
- Multidimensionality: Unlike simpler strategies, Bollinger Bands allow the integration of volatility and relative position through band width. This provides a nuanced data set that is closer to capturing the essence of the “Black Box” problem.
- Risk Management: My Triathlon approach can further be highlighted by Mean Reversion by highlighting the contrasts and ceiling between each Risk-Stratified Index Model created to demonstrate the simplification of a well-rounded portfolio
RSI(Relative Strength Index) Confluence A technical indicator in momentum trading is a tool used to measure the speed and magnitude of a recent price change in a stock. It provides technical traders with information about whether market conditions are bullish (on the rise) or bearish (falling). An asset is considered overbought when above 70 and oversold at 30. By combining it with my Bollinger bands strategy, I decided to loosen the boundaries to 40 & 65 through hyperparameter tuning to replicate the algorithmic swing trading. This, paired with my %b threshold signals of 0.45 for buying (triggers when 5% below 8 week average) and 0. 65 for selling (15% above 8 week average), creates a well-constructed algorithm. The positive skew is targeted towards the bullish market and rising stock valuations during these periods.
Code Block 1.1 Bollinger Bands + Mean Reversion Strategy
def mean_reversion_signal(self, percent_b, rsi): #relative strength index
signals = pd.DataFrame(index = percent_b.index)
for col in percent_b.columns:
s = percent_b[col]
signals[f"{col}_Buy"] = (s < 0.45) & (rsi[col] < 40) #buy if price is near bottom of band + heavily oversold
signals[f"{col}_Sell"] = (s > 0.85) & (rsi[col] > 65) #sell if price near top and is undersold
return signals
1.1 Choosing the Right xAI Framework
Note** The IML(Interpretable Model Learning) is also applicable to the topic, as the field is relatively new and scientists, as well as other professionals, have yet to define the two terms. Generally, an IML is reflective of a 3-step decision tree or models that are generally more interpretable to humans. Despite my project being relatively simple, I would like to classify it under xAI because the financial applications and analysis of my work are aimed towards individuals with minimal knowledge of how markets work.
i) What is xAI?
Explainable artificial intelligence(xAI) is a set of processes and methods that enables human users to understand and trust the output and results produced by algorithms. Often describing the model in terms of objectives, expected impact and potential biases. It provides insight into model accuracy, fairness and transparency in decision making. It is a layer on top of an algorithm or AI that can trace and explain each decision. xAI is the answer to solving the blackbox problem.
Some types of xAI:
Local Interpretable Model-agnostic Explanations (LIME): A common technique used to interpret black box models. It approximates explanations for a single case of the model’s inputs or outputs. LIME explains the outcome generated for a specific AI input by modifying it to recognize its impact on the outcome.
Shapley Additive Explanations (SHAP): A technique that identifies the significance of each feature in a certain prediction. The concept is similar to game theory, where it is based on the distribution of an award(the trade) fairly among players(the features determining the trigger of the trade).
Permutation feature importance: The evaluation of each separate input feature to determine predictive power. This is done by generating a score for each feature by randomly shuffling its values while measuring prediction error. After observation, the next step is to measure the feature of choice through permutations(reshuffling). The importance score is derived by averaging the differences between the baseline and the reshuffled outcome.
Gradient-weighted Class Activation Mapping (Grad-CAM): A model-specific method used to explain neural networks(highly advanced AI algorithms). For a particular input image(a graph in this case), the Grad-CAM combines the feature maps to decipher each part’s relevance.
Explain it Like I’m 5 (ELI5): An explainable tool that seeks to offer simple explanations for the outcome of models in a human-friendly manner. It provides an explanation considering relevant features of input that contribute to the outcome of the model. This method is reliant on other xAI methods like SHAP, Permutation feature importance and LIME for explanation generation.
What Xai should I use? I have decided to take a dual approach using SHAP and ELI5 to enable a comprehensive comparison of interpretability and test the improvement of trust by different outputs.
1) Shapley Additive Explanations (SHAP): I chose SHAP due to its axiomatic attribution (mathematical intensity) to assign weight to specific financial indicators. Its beginner-friendly visuals allow users to glance at a graph rooted in statistics to see which factor triggered the trade.
Figure 1.3 Small Clipping of SHAP Initialization
def create_shap(self, pb_val, rsi_val, margin, debt, group_name, is_deceptive = False): #pb_val & rsi_val are just placholders for now
feature_row = np.array([[pb_val, rsi_val, margin, debt]])
background = np.array([[0.5, 50, 0.1, 0.5]]) # netural starting point
explainer = shap.KernelExplainer(self.internal_model_logic, background) #run SHAP
shap_values = explainer.shap_values(feature_row)
final_values = np.array(shap_values[0]) if isinstance(shap_values, list) else shap_values
2) ELI5: I chose ELI5 to provide a natural language contrast. While SHAP is visual, this form of xAI is based purely on simplification through solid descriptions. This allows me to test whether non-experts prefer graphical or narrative representation. What SHAP Plot should be used?
Figure 1.4 Small Clipping of ELI5 Initialization
def create_eli5(self, shap_values, feature_names, group_name):
reasons = {
"Positioning (%B)": "where the price sits within the usual range",
"Market Momentum (RSI)": "the current market conditons of the stock's valuation",
"Business Quality (Margin)": "how much profit the company keeps from every dollar earned",
"Financial Risk (Debt)": "the company's current debt levels"
}
Types of SHAP Plots:
The following titles contain links to in-depth descriptions of the plot type as well as visualizations.
- Ranks features based on their effect for model predictions (x - axis representing SHAP values - a measure depicting quantitative influence)
- The y -axis is feature distribution, with the colour red representing high importance and blue with low low importance
- Each dot represents a specific data point’s SHAP value
- The graph looks like a beeswarm
- The SHAP bar plot presents each feature’s absolute SHAP values as bars in chart form.
- The taller the bar, the more significant the importance to the model’s decisions
- Positive values represent positive influence, and negative values represent negative influence.
- The force plot offers an in-depth perspective of SHAP values for singular occurrences.
- It shows the base value (expected model output) and demonstrates how each feature’s influence pushes the model’s predictions.
- Emphasizes positive and negative impacts better than the bar plot because by illustration of how each feature contributes to predictions through variance with changing values and how each decision evolves when features are added or removed.
- Useful visualization tool that displays the additive contributions of features to a model’s prediction for a specific instance
- A type of force plot that begins with a baseline value and shows each figure’s contribution to the overall prediction
- Creates a plot with instances on the x-axis and model inputs on the y-axis
- SHAP values are encoded on a colour scale
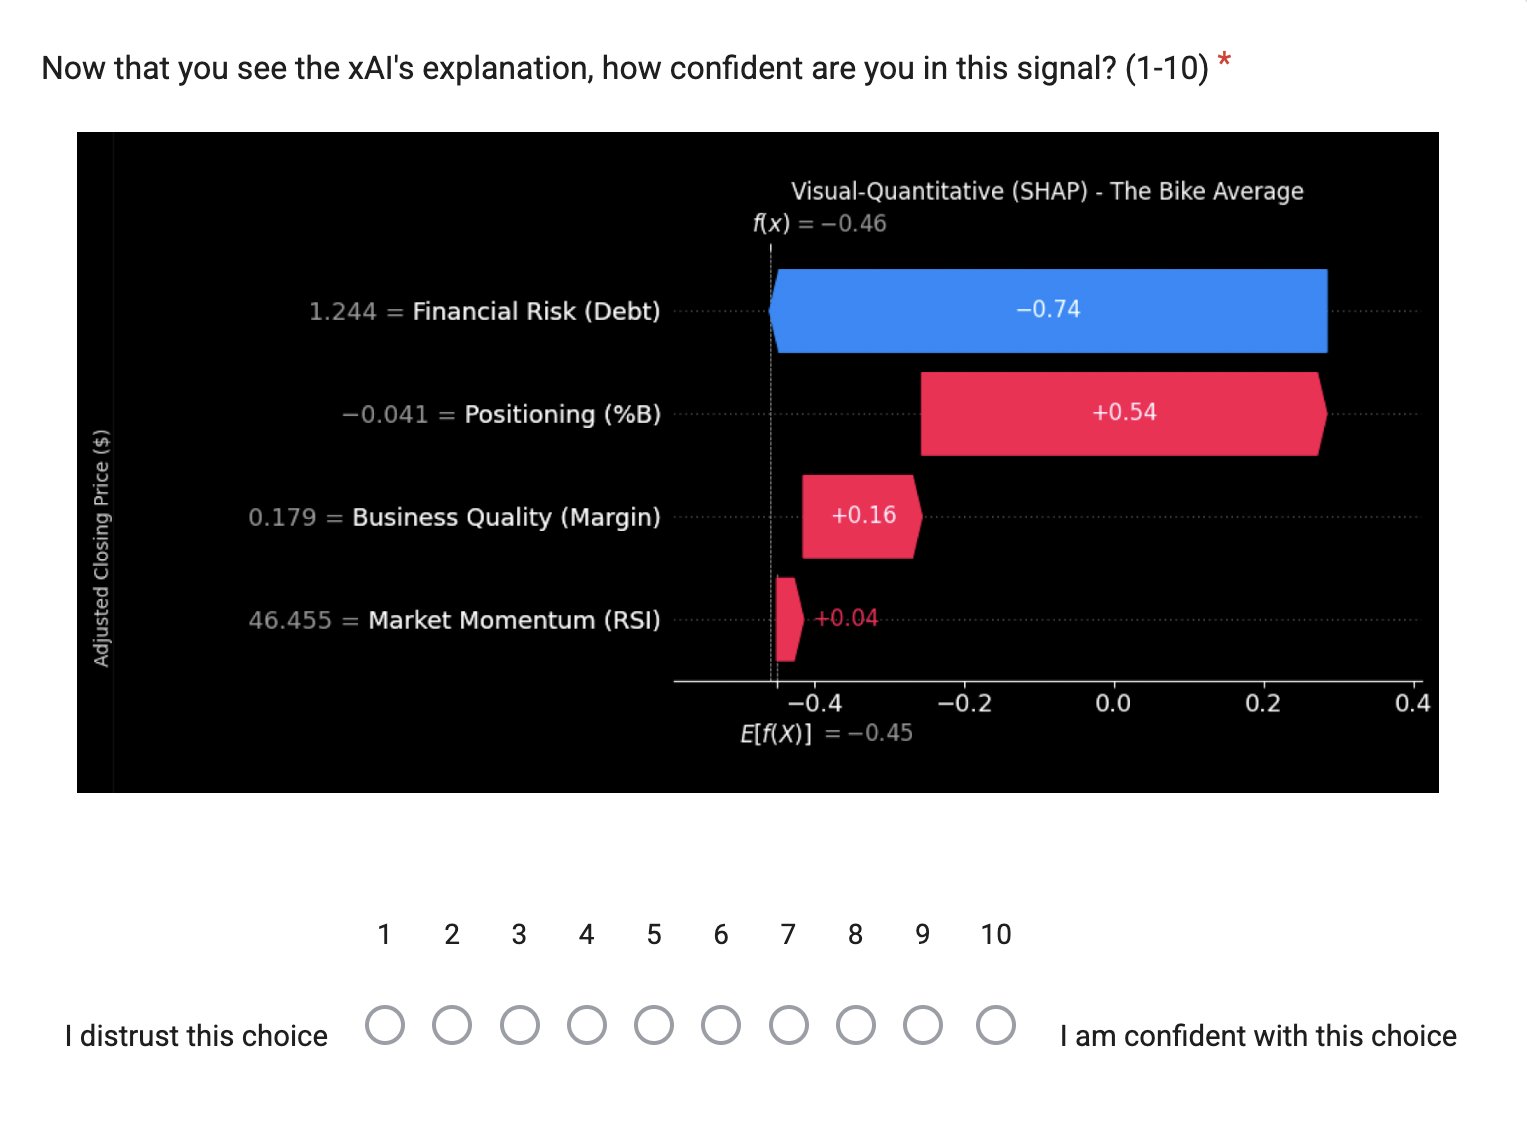
What will be the best implementation for my project? The “Waterfall” plot is simple, sleek and visually easy to comprehend, with its format not only representing the weight of each decision but also the final choice made by the algorithm, making it the perfect decision to use in my project.
1.2 Financial Ratios/Metrics Integration
After analyzing over 35 financial ratios/metrics within the categories of price, profitability, efficiency, liquidity, leverage, and risk-adjusted return, I selected 5 main metrics that would be integrated into my xAI explanations.
Financial Risk: Debt to Equity = Total Liabilities / Equity Compares a company’s total liabilities with its shareholder equity. It is used to indicate the extent of a business’s reliance on debt. What is the ideal amount? There isn’t a single amount, as the benchmarks on what is considered an ideal D/E Ratio varies on company size, sector and industry. A D/E ratio below 1 is considered safe, while 2+ may be viewed as risky.
Business Quality: Net Profit Margin = (Net Profit / Revenue) x 100 Indicates the bottom-line profit a business can retain for each dollar of revenue earned. It provides a holistic view of a company’s profitability because it considers all financial aspects, including operating expenses, cost of sales and non-operating expenses (e.g. interest, tax). What is the ideal percentage? There isn’t a single percentage, as the benchmarks on what is considered an ideal NPM vary from industry to industry. Generally, an NPM of 10% is good, and an NPM of 20%+ is great, and an NPM below 5% is considered undesirable.
Positioning: The location of the stock is in alignment with the Bollinger band’s brackets. If it is located above the median, the stock is considered overbought and overvalued and below is oversold and undervalued.
Market Momentum: The Relative Strength Index is a technical indicator in momentum trading that is a tool used to measure the speed and magnitude of a recent price change in a stock. Refer to the RSI Confluence Section.
Code Block 1.5 Metric Integration in SHAP & ELI5
class xAIProvider:
def internal_model_logic(self, data_array):
#data_array[:, 0] = %B (positioning)
#data_array[:, 1] = RSI (momentum)
#data_array[:, 2] = Profit Margin (quality)
#data_array[:, 3] = Debt Ratio (risking)

positioning = (0.45 - data_array[:, 0])
momentum = (40 - data_array[:, 1]) / 100
quality = data_array[:, 2] * 2 # higher margin is better
risk = -data_array[:, 3] #higher debt is worse

return positioning + momentum + quality + risk
Market Uncertainty: A Heuristic Extra to Aid Conceptualization The distance between the mean and the upper/lower Bollinger band(set at 2 standard deviations) that encompass 95% of the stock. The greater the bandwidth, the more volatile the stock/ETF is. This can easily be visualized by looking at the average of the higher and lower points of the index. What is the ideal amount? There isn't an ideal amount; however, compressed Bollinger bands are preferred to signify market stability.
1.3 Building the Algorithm + xAI
To engineer my product, I used the VSCode platform and the principles of Object-Oriented Programming(OOP) to separate the algorithm’s processing, interpretation and interface. This developing process took about 2 months.
i) Language: Python
Known for being the dominant language in the field of algorithmic trading, Python3 offers extensive libraries like pandas, numpy and scikit-learn for data manipulation, analysis, strategy backtesting and machine learning. Facilitating multiple API’s that fetch dynamic marketplace data to carry out orders. Thus, making it the ideal language for prototyping, research, and running such systems.
After performing visual scripting on the Unity platform, I was only introduced to language scripting in September, to JavaScript and Java for Computing Science 20. In October, when I decided to participate in CYSF, I took 2 online courses from Kaggle (“Python” and “Intro to Machine Learning”) to help me understand fundamental syntax and construction of machine learning.
ii) APIs
A set of rules and procedures enabling the creation of systems that access data of an operating system or application. To learn data manipulation and plotting from pandas, numpy and matplotlib, I referred to the YouTube videos made by “Bro Code.” For yfinance and SHAP, I used a variety of websites and YouTube videos. However, there was a lack of sources to convert data into a “wrapper” to fit SHAP, so I utilized an LLM to aid the niche conversion.
The following titles contain links to in-depth descriptions of the API.
Graph 1.0 APIs and Purpose
| API | Main Role | Purpose for project |
|---|---|---|
| yfinance | Data Sourcing | Sourced historical data from beginning November 1st, 2019, to ensure the Bollinger Bands Mean Reversion strategy was tested across multiple market conditions. |
| pandas | Data Cleaning | Used for data cleaning of the input received by the finance API. It handled missing data to prevent the code from crashing and managed the 2D dataframes for risk-stratification. |
| numpy | Data manipulation | Enabled quick math conversions to reduce the hassle of redundant loops and handled the math for internal SHAP logic. |
| matplotlib | Human Interface | Created the Interactive Scanner, enabling a cleaner output to display a clear signal associated with a specified section |
| SHAP | xAI Engine | Provided the Axiomatic Attribution. Shap calculated the mathematical weight of each factor (Financial Risk, Market Momentum e.t.c) and, when combined with plain English, produced an ELI5 response. |
| tabulate | Glossary Formatting | Enabled a dynamic glossary to provide users with the purpose of each element used to back up the algorithm’s choice. |
Code Block 1.6 Importing Libraries
import pandas as pd # manipulating stocks
import numpy as np #part of pandas
import matplotlib #human interface
import matplotlib.pyplot as plt #visual aid
matplotlib.use("TkAgg") #forces an interactive window
import matplotlib.dates as mdates # internal date numbers
import yfinance as yf #stock info from yahoo finance
import shap #xAI extension
import tabulate #glossary
Variables
i) The Objective
To investigate which form of xAI, a) visual-quantitative (SHAP) or b) narrative-qualitative (ELI5), best minimizes Gen Z user discomfort and improves logical apprehension of rule-based algorithmic trading signals.
ii) The Variables
i) Independent Variable
The xAI model utilized for explanation (SHAP Waterfall Plot, or ELI5 Text).
- Group A will then be shown an SHAP explanation
- Group B will then be shown an ELI5 explanation
ii) Dependent Variable
- Participant Trust Score (a scale of 1-10 in which 10 is the highest level of an individual's assurance with xAI output)
- Mental Model Accuracy (score on the “What-If” logic questions).
iii) Constant Variables
- Same Section 1 (Within-subject testing aspect of survey) for all participants
- Same interface used for both surveys
- The same grey coloured background, text font and size during the survey.
- Participants belonging to the specific age range of 13 - 18
- The same platform is used to create each independent variable (VSCode)
- Same glossary used with the same placement (on every page where a graph is present, located at the bottom)
- Same historical stock data within the same time frame(s)
- Same Bollinger Band parameters
- Same Risk-Stratified Index categories
Procedure
3. The Procedure
i) Phase 1: Data Engineering & Index Stratification
I will segment multiple stocks into 3 distinct Risk-Stratified Index Models (the “Triathlon” Portfolio) from a well-rounded portfolio by grouping them based on their market volatility:
- Swim (Conservative): Low-volatility assets filtered for high Net Profit Margin (NPM) and low Debt-to-Equity. They provide stability and slow growth to the portfolio.
- Bike (Balanced): Moderate-volatility assets that provide standard risk and growth.
- Run (Aggressive): High-volatility assets that are the pinnacle of “high-risk, high-reward”. When the markets are doing well, these stocks will propel this portfolio as they prioritize momentum and breakout potential.
Data will be sourced using the “yfinance” API, covering 5 months of historical price action to ensure robust data sampling.
ii) Phase 2: Algorithmic Logic (The “Heuristic Mapping”)
I will implement a Mean Reversion strategy using Bollinger Bands to act as the primary force behind the trading decisions.
- Input Features (X): Bollinger Band %b (relative position), RSI(Market Momentum), Band Width (Volatility), NPM, and Debt-to-Equity ratios.
- The SHAP Wrapper: A conversion of my manual strategy into an automated model that xAI tools can interpret
iii) Phase 3: xAI Implementation (The “Explanations”)
To make the algorithm transparent, I will implement 2 different systems:
- Shapley Additive Explanations (SHAP): Its use of axiomatic attribution (mathematical intensity) to assign weight towards specific financial indicators can contribute to excellent visuals centred on game theory. (Summary Plots)
- ELI5: I chose ELI5 to provide a natural language generator that translates the SHAP values into “simple English.” (e.g., “the AI is buying because…e.t.c) (Narrative Descriptions)
iv) Phase 4: Human-Focused Applications and Evaluation(The Pilot “Delta Trust” Study)
The final phase involves a survey that starts with a Within-Subjects(all subjects participate in a graph made from phase 2) design, followed by a Between-Subjects (the introduction of differences in content faced by each group from phase 3) split to analyze the effectiveness of xAI:
- Baseline: All participants are shown a “Black Box” trade signal (Plain chart + Buy/Sell) and have access to a glossary at the bottom of each page
- Diversion:
i) Group A will then be shown an SHAP explanation accompanied by the same graph from the same time period ii) Group B will be shown the ELI5 explanation, accompanied by the same graph from the same time period
- Metrics: I will measure the “Trust Delta” (confidence boosted by xAI result) and “Mental Model Accuracy” (the participant’s ability to predict how the AI would react to a change in the stock’s data). This feature helps detect the prior abilities of the individual as well as their applications after being exposed to the model
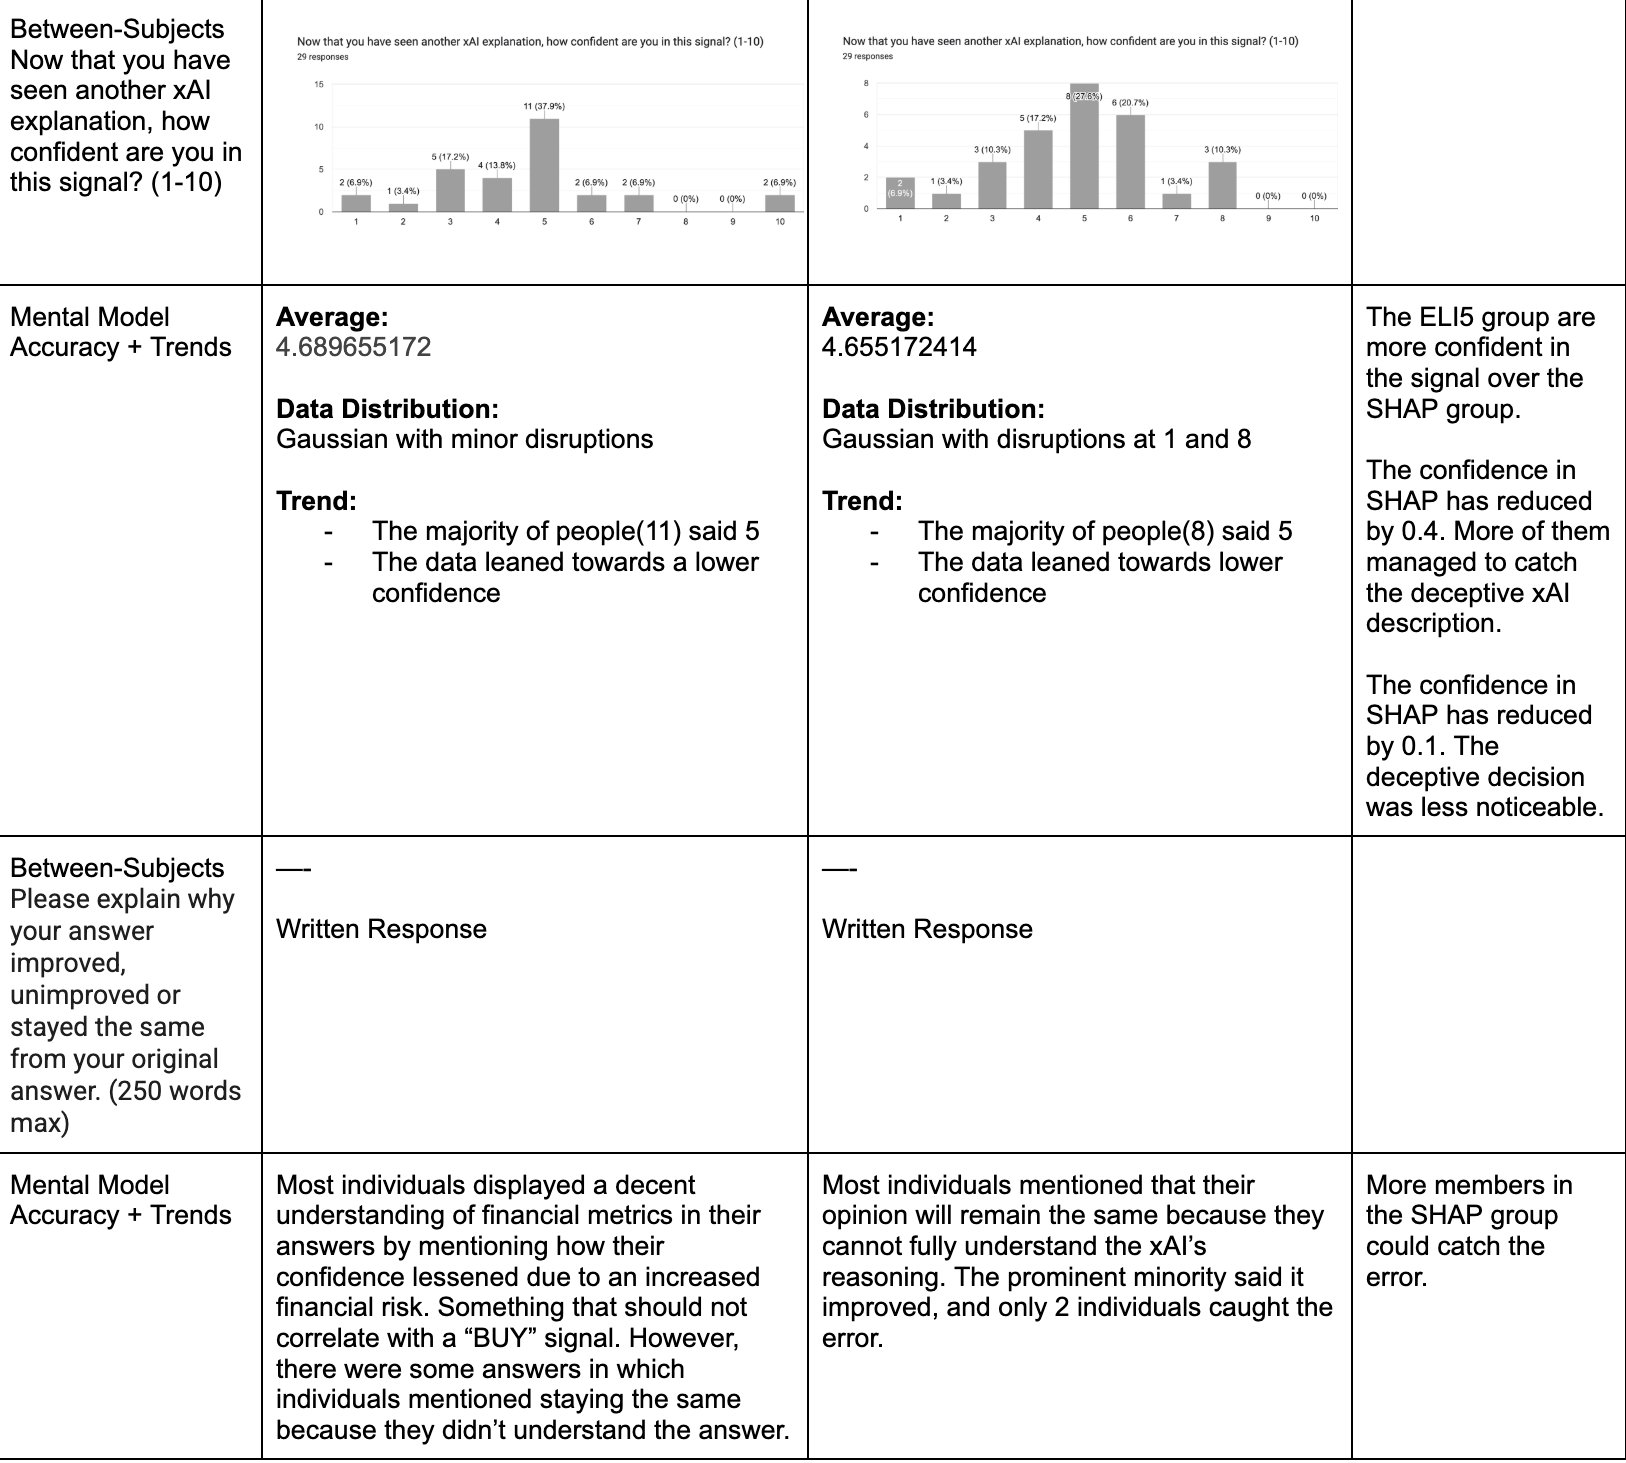
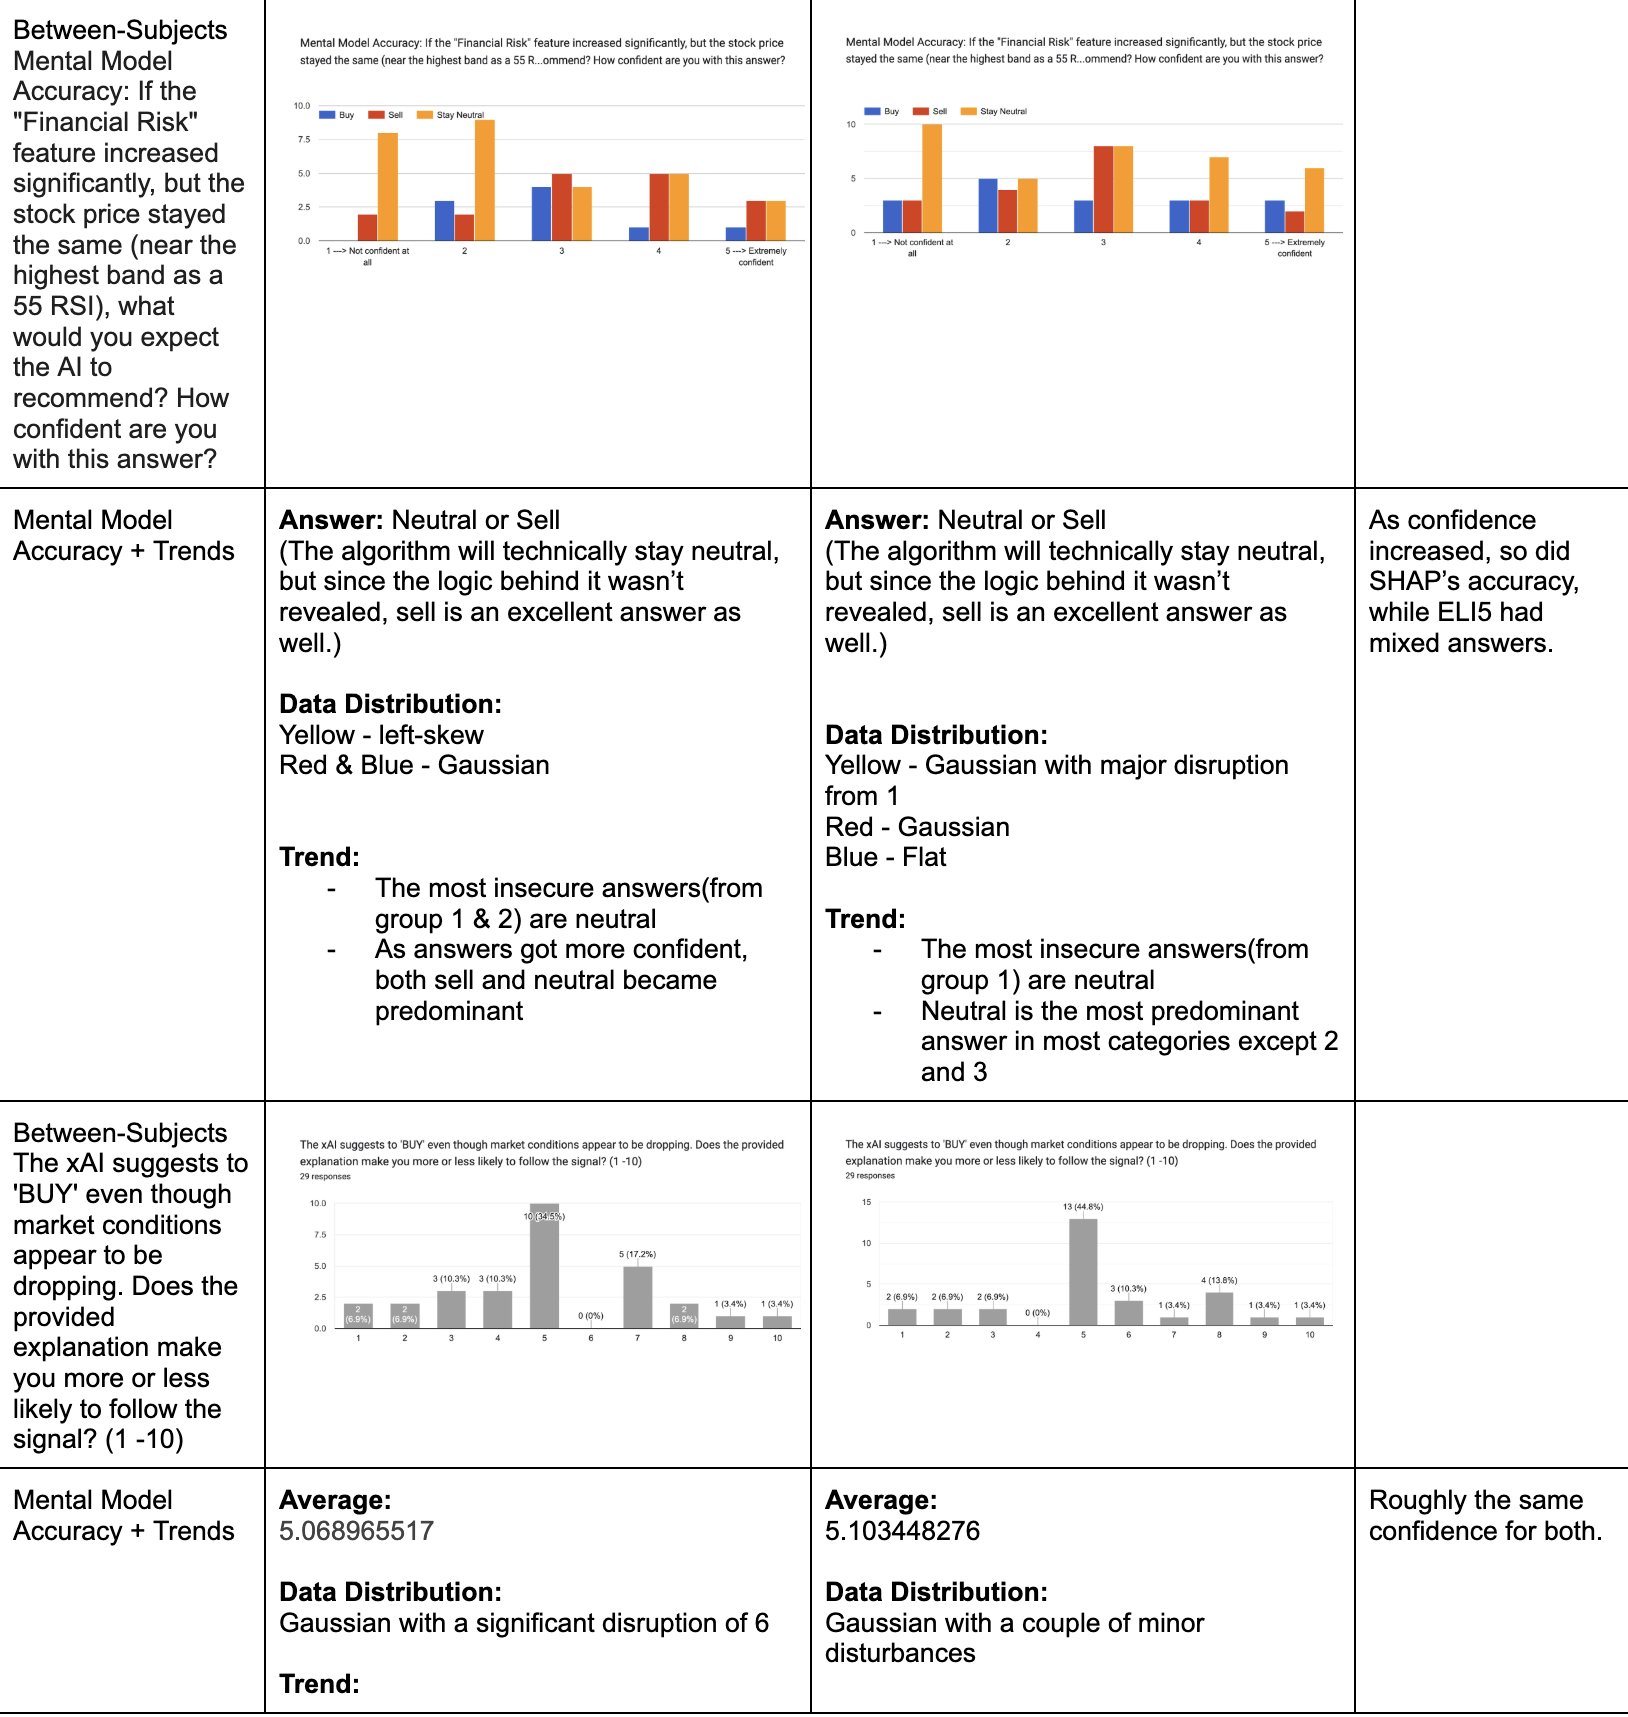
- Extra: Check for overtrust of xAI by including one wrong description(one without any implications of error) and see if it continues to boost or maintain confidence. Then I would implement another wrong description, and this time describe a mismatch between the signal and the xAI. To generate these errors, I will invert the original results through a true or false if statement.
The ideal amount would be 15+ people for each survey.
Figure 3.0 Sample of Within-Subjects Graph
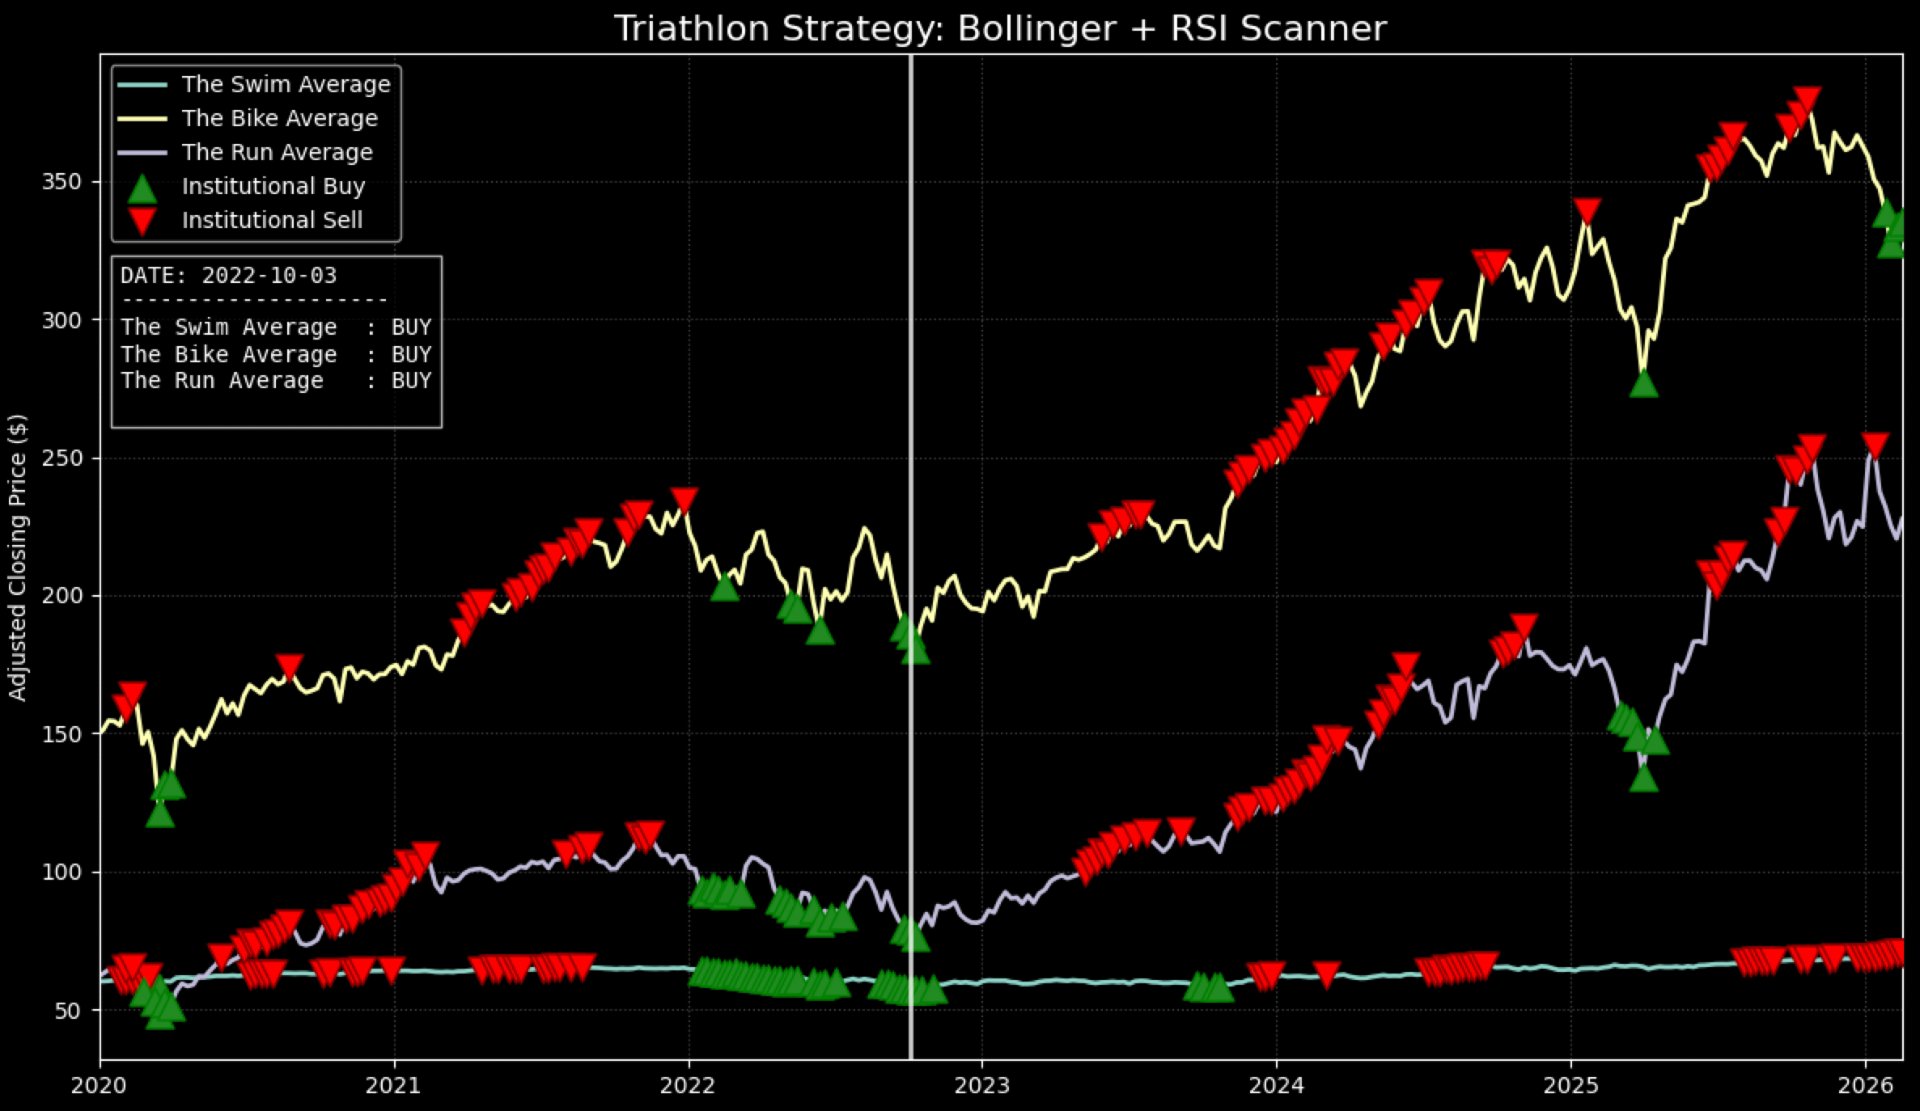
Figure 3.1 Sample of Group A (SHAP) xAI Graph
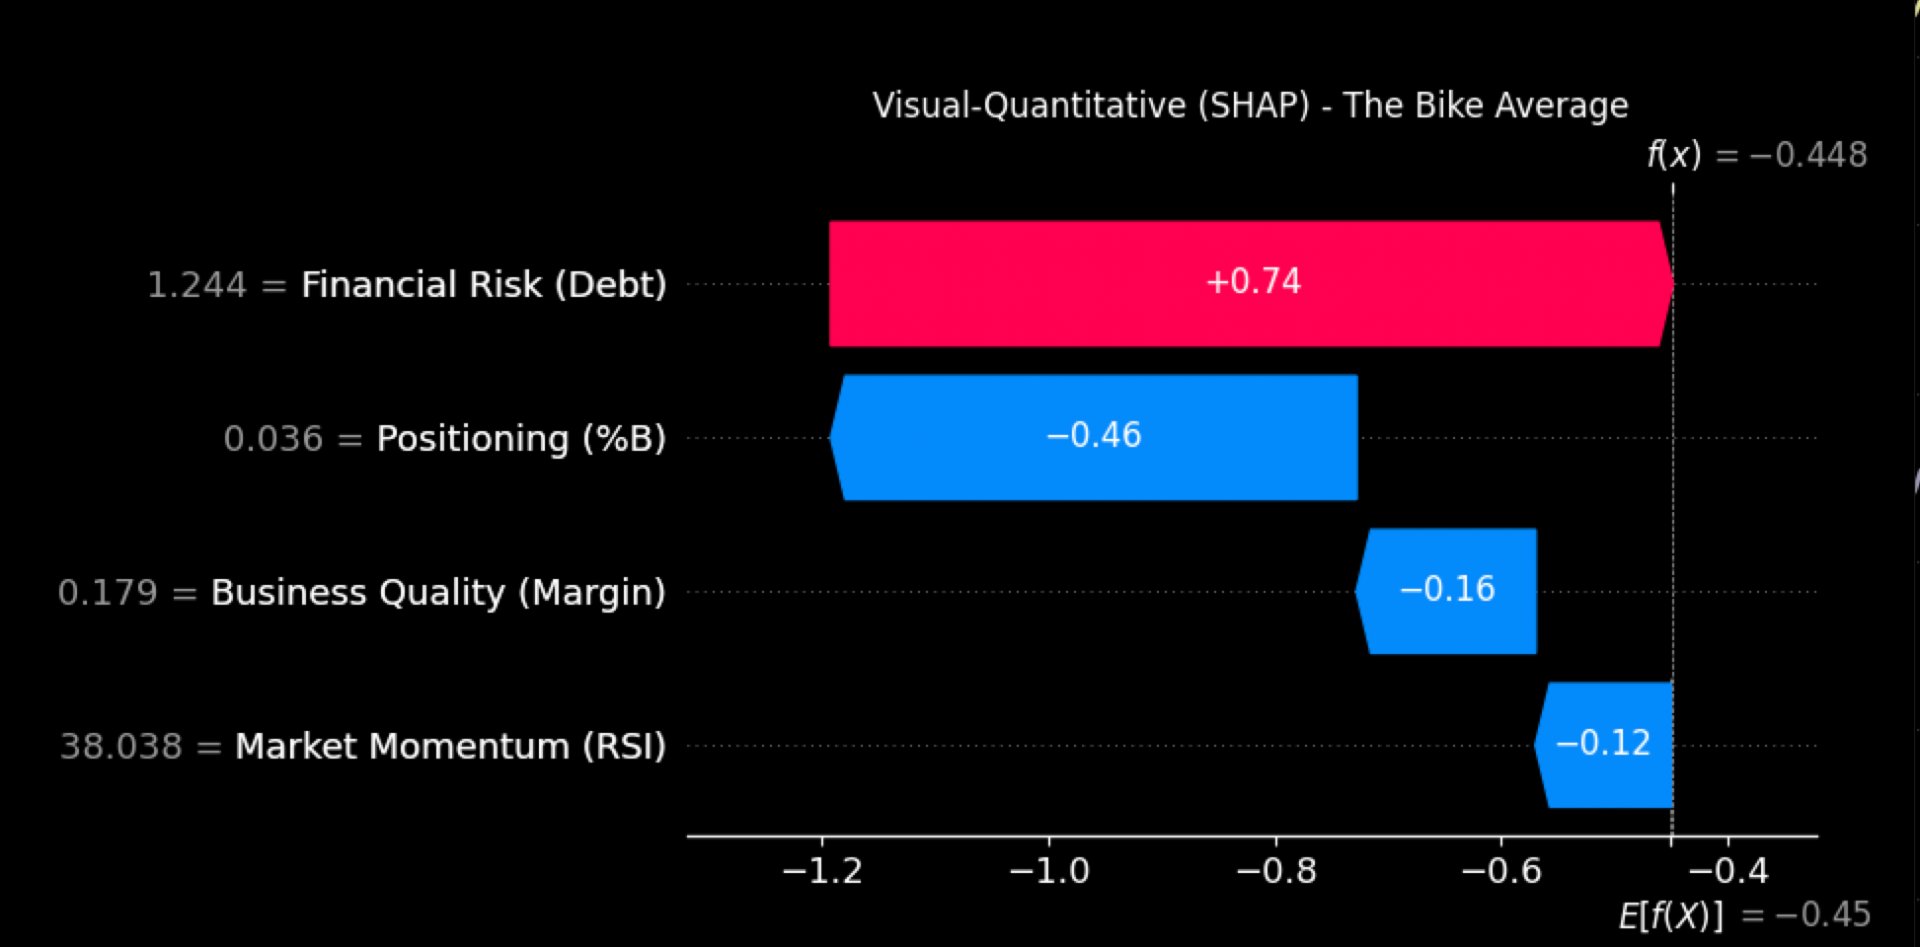
Figure 3.2 Sample of Group B (ELI5) xAI Graph
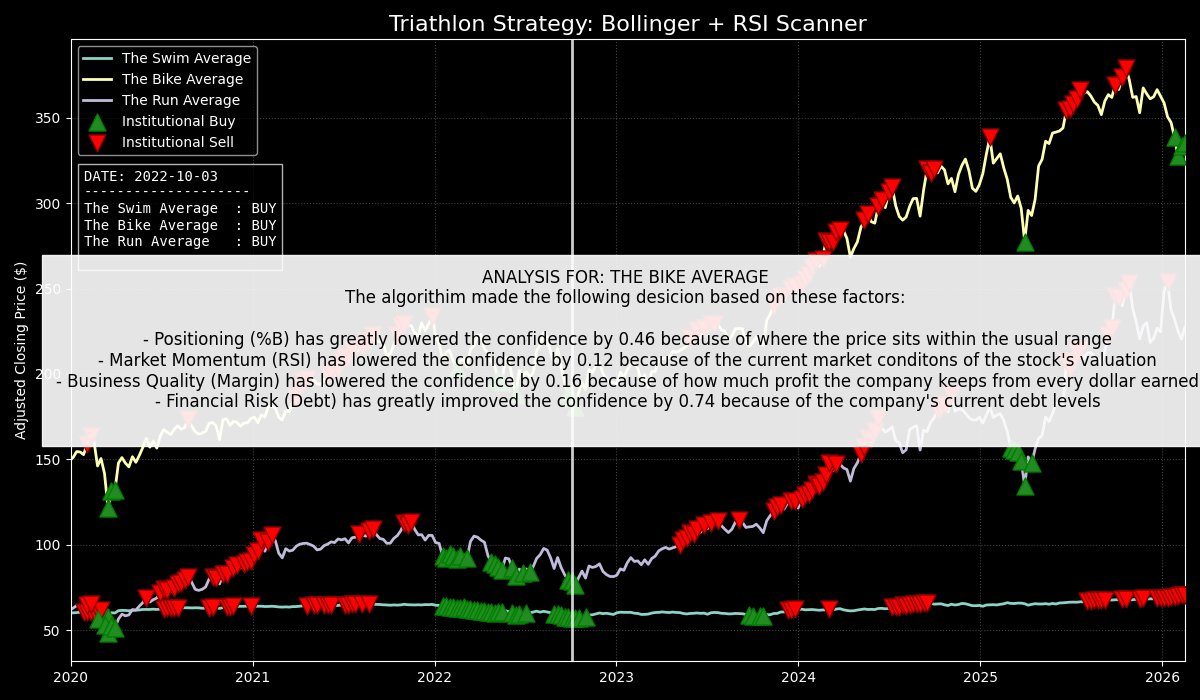
Figure 3.3 Glossary Provided at Bottom of Each Page
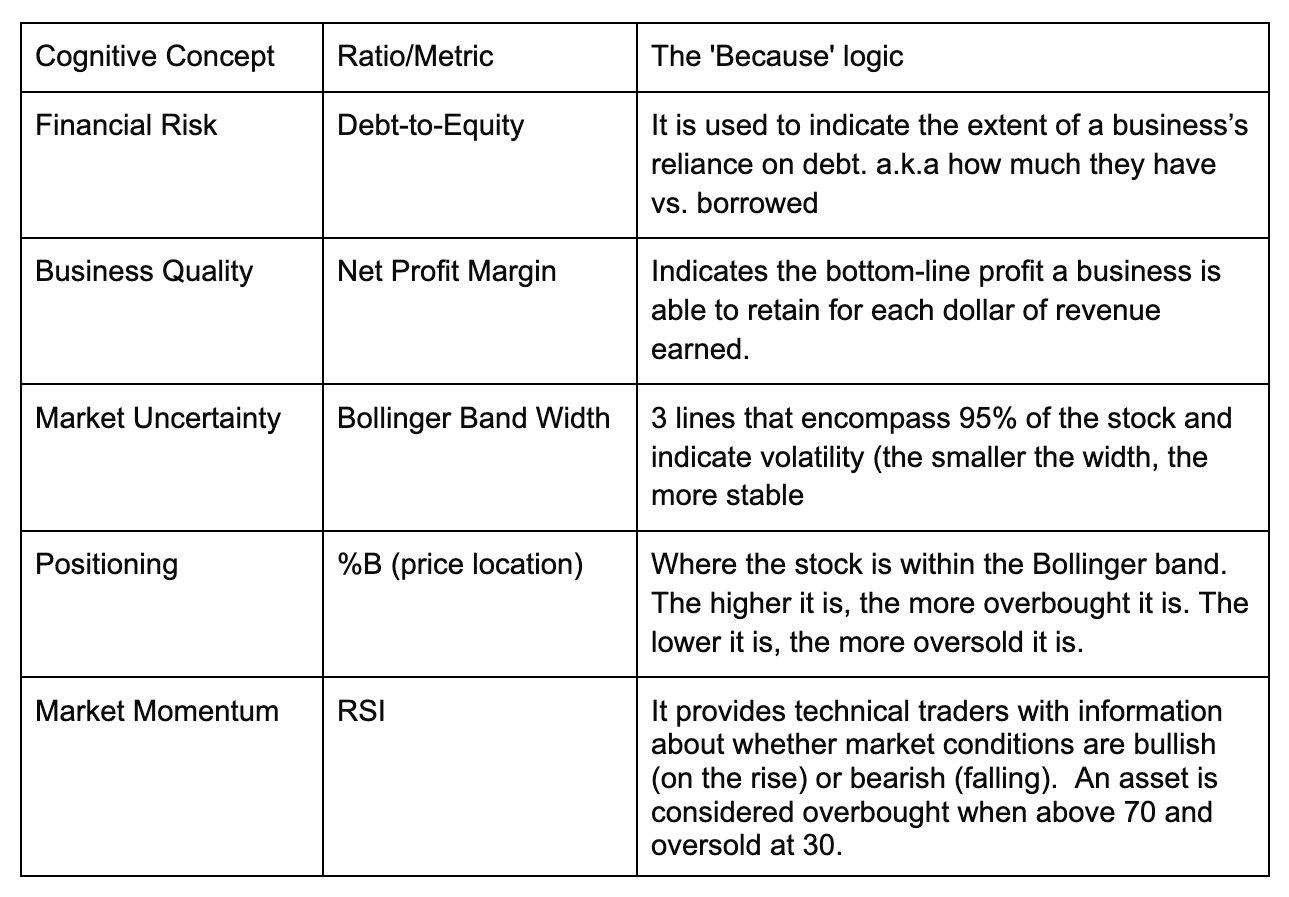
Figure 3.4 Sample Question from Survey
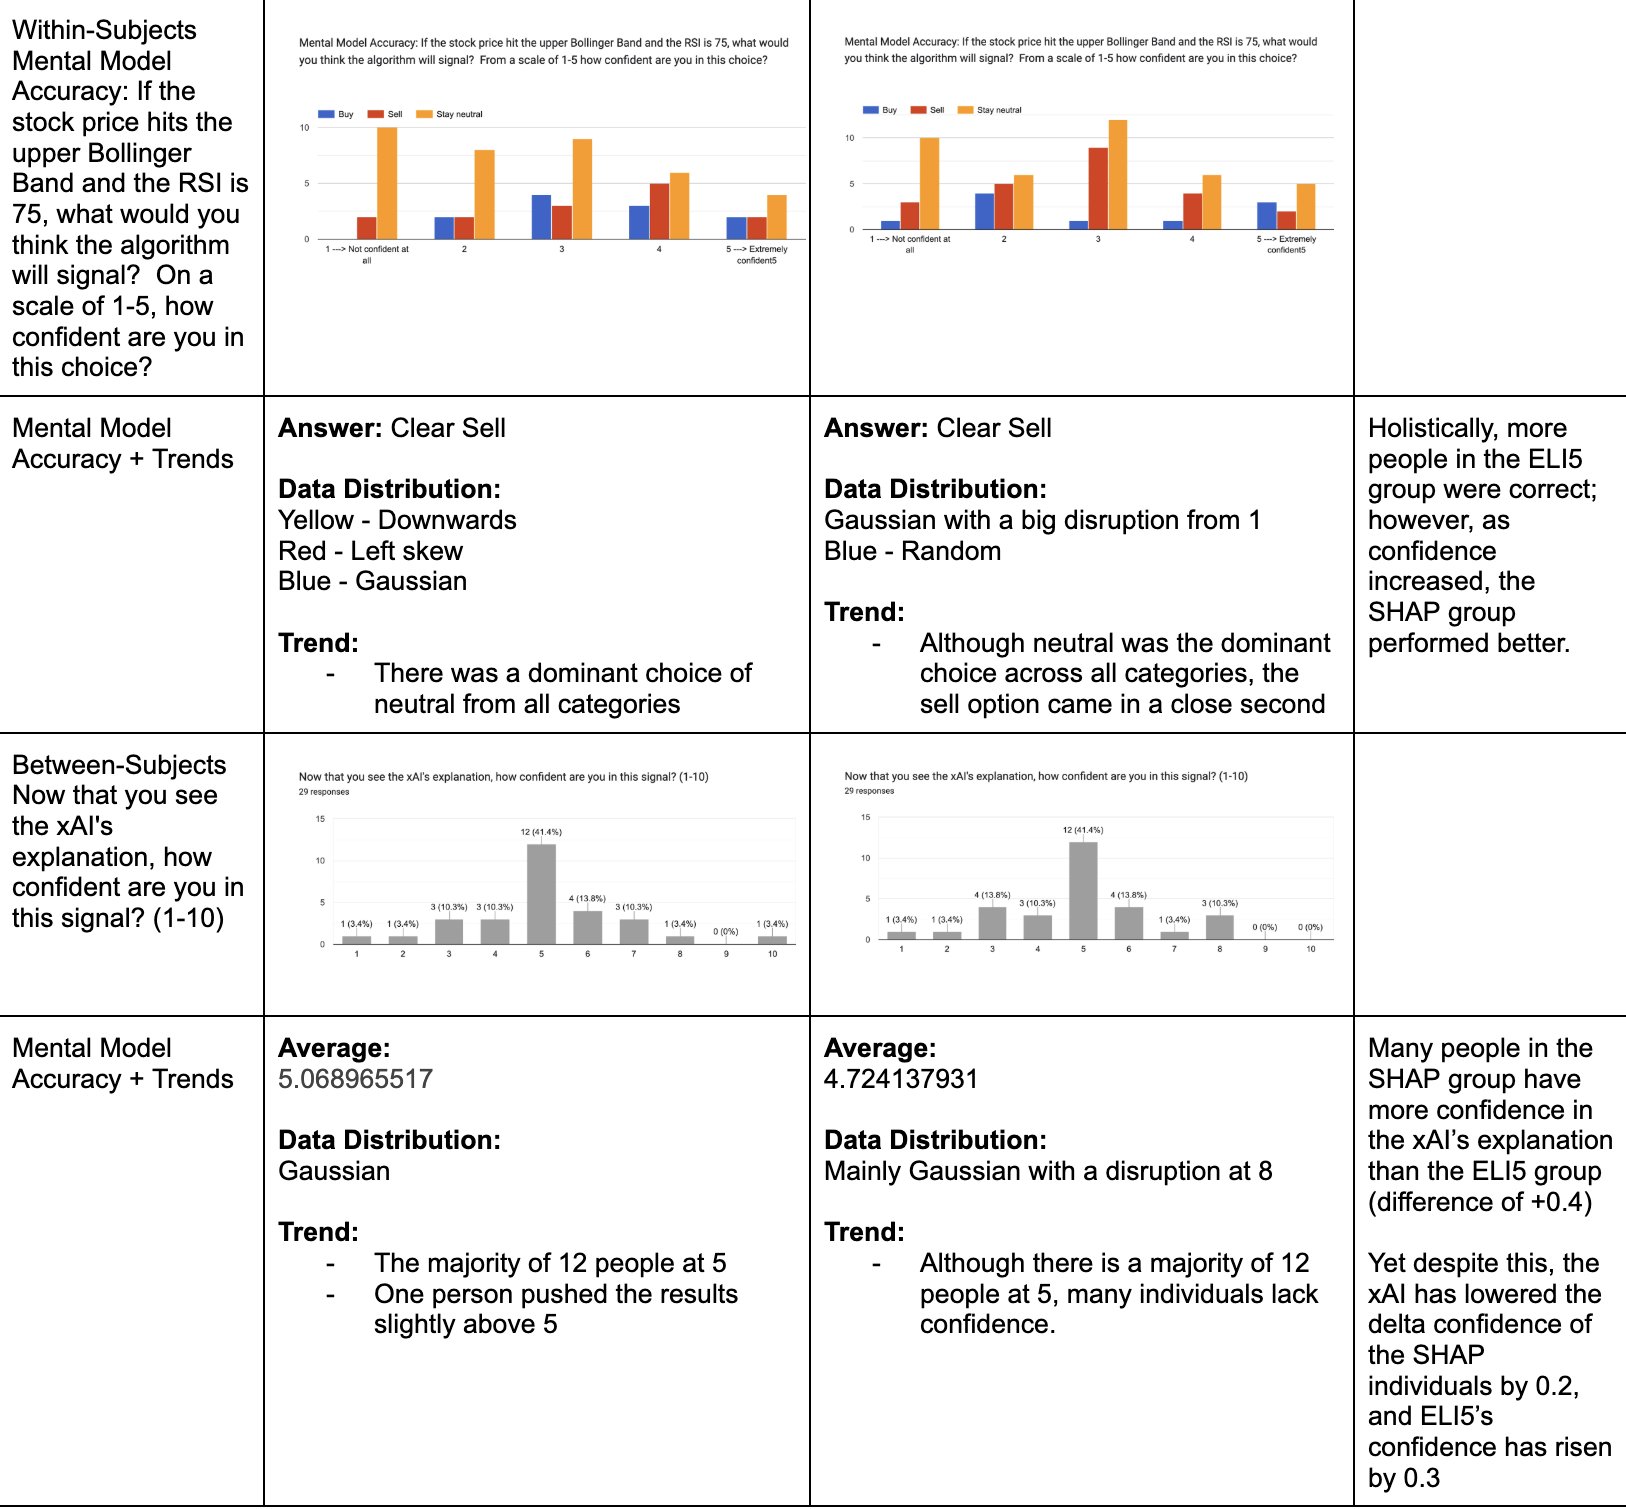
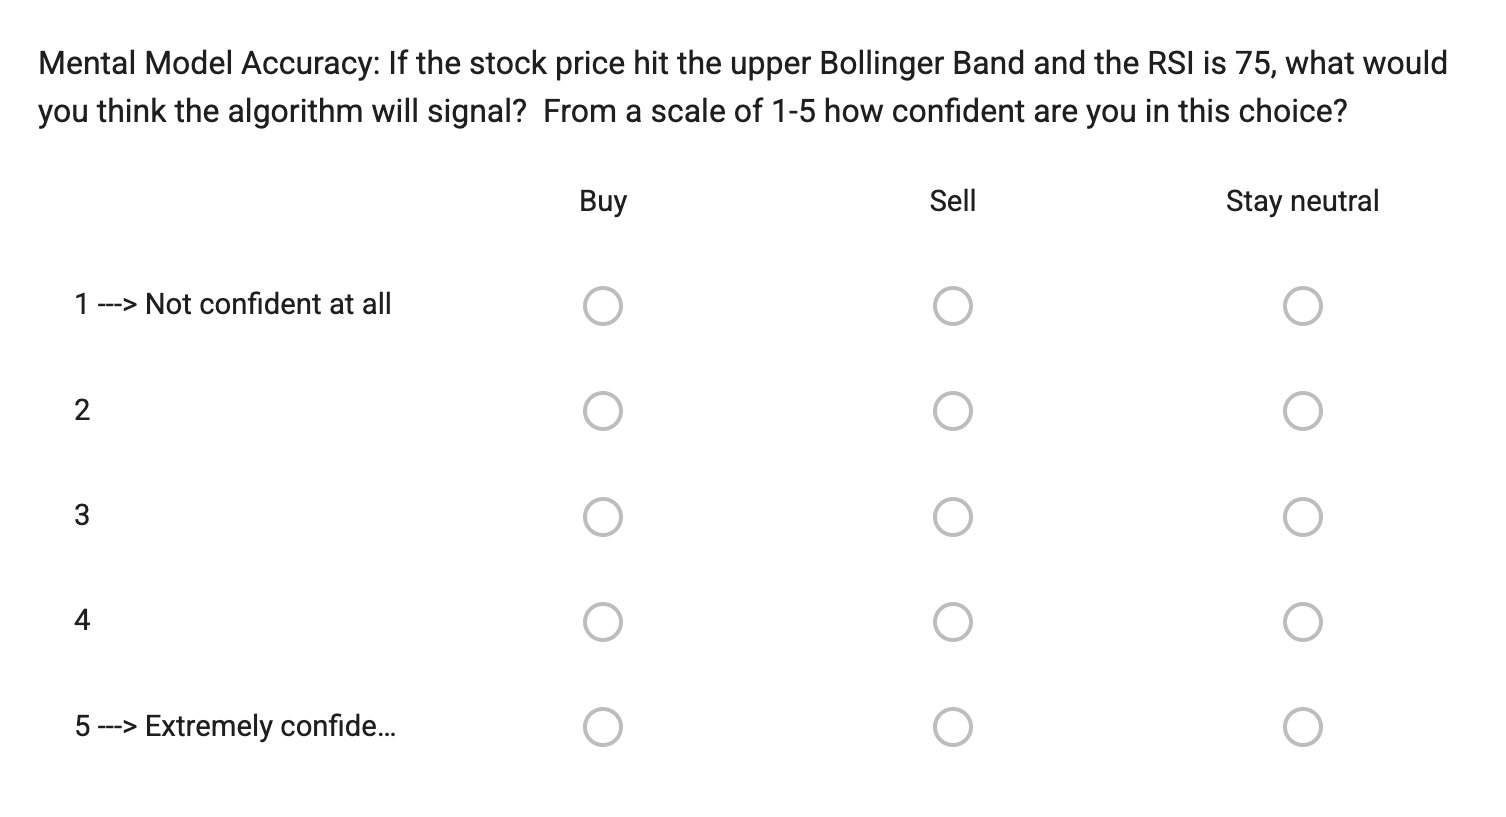 In the following style of question, some students ended up selecting one answer per row. Thus, as a result, I will review such questions holistically, examining the deviations between the answers of the unconfident and confident individuals in terms of composition and discrepancy. If a student selected "Buy" and "Neutral" with similar confidence, they are simulating the exact "hesitation" a real retail investor feels, and as a result, creating a more accurate curve.
Figure 3.5 Sample Question from ELI5
Observations
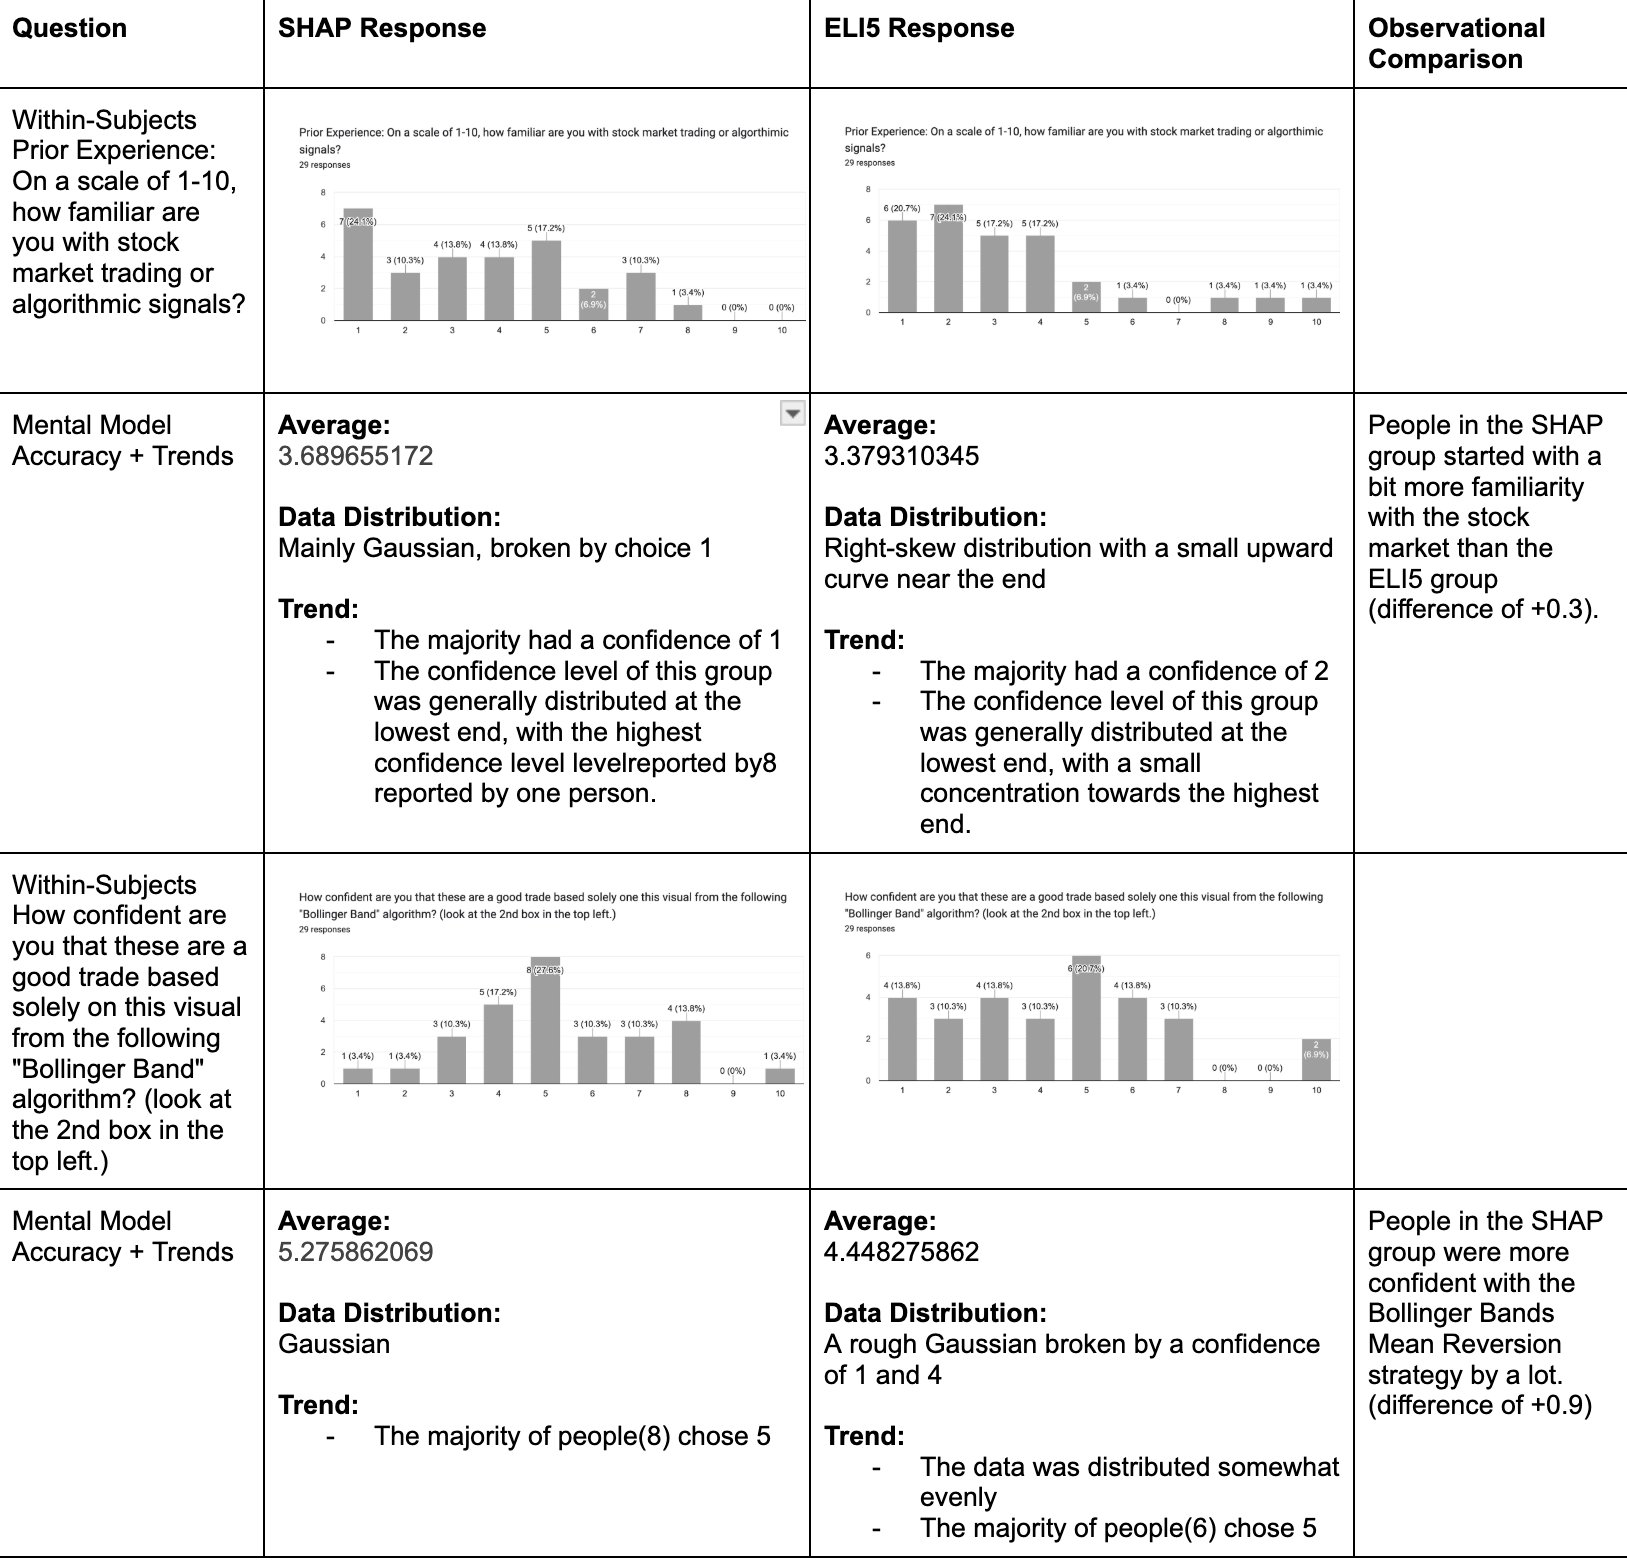
NOTE*** Each survey had 29 participants
i) Types of distributions
Gaussian/Normal The formation of a bell curve is caused by a majority of the data points clustering at the mean. This is the most common data distribution.
Right-skew A distribution in which data is clumped towards the left side.
Left-skew A distribution in which data is clumped towards the right side.
Downward Trend The data holds a linear or general progression downward.
Upward Trend The data holds a linear or general progression upwards.
ii) Results
The graph I created is not being saved correctly on this platform. For the best user experience, you can access observations here.
Analysis
Metacognitive Callibration describes an individual's ability to accurately assess their knowledge and/or performance. The more aware one is of their abilities, such as judging their correct performances as right and incorrect, as wrong present a high level of metacognitive calibration. The delta in an individual's confidence decreased by 0.2 when introduced to SHAP and increased by 0.1 in ELI5.
This increase may be due to a sense of familiarity between the narrative-qualitative style of ELI5 and LLM models, which, according to the Walton Family Foundation, as of April 2025, 47% of Gen-Z students use AI weekly. Such exposure and constant usage may lead to the development of an automation bias(a favorability towards AI explanations overpowering one’s own human judgment due to Desirable Difficulty; the natural inclination to take the easiest route) and, consequently, overtrust in AI systems.
In fact, when asked to explain the reasoning behind their answers on whether their trust increased, decreased or stayed the same after a discrete incorrect explanation. Most of them could not explain. Revealing the truth behind the quality of the explanation. The proper term for this description is the “Illusionary of Explanatory Depth” from AI fluency. Contrasting greatly with the well-reasoned explanations from SHAP individuals who realized the inconsistency between the metrics and the decision. The reason behind this may be that the SHAP group had to interpolate the data behind the decision from a visual and translate it into something understandable, whereas ELI5 already took the liberty of outputting a simplified explanation, in which ELI5 participants passively consumed the results and did not have to critically think about their answers.
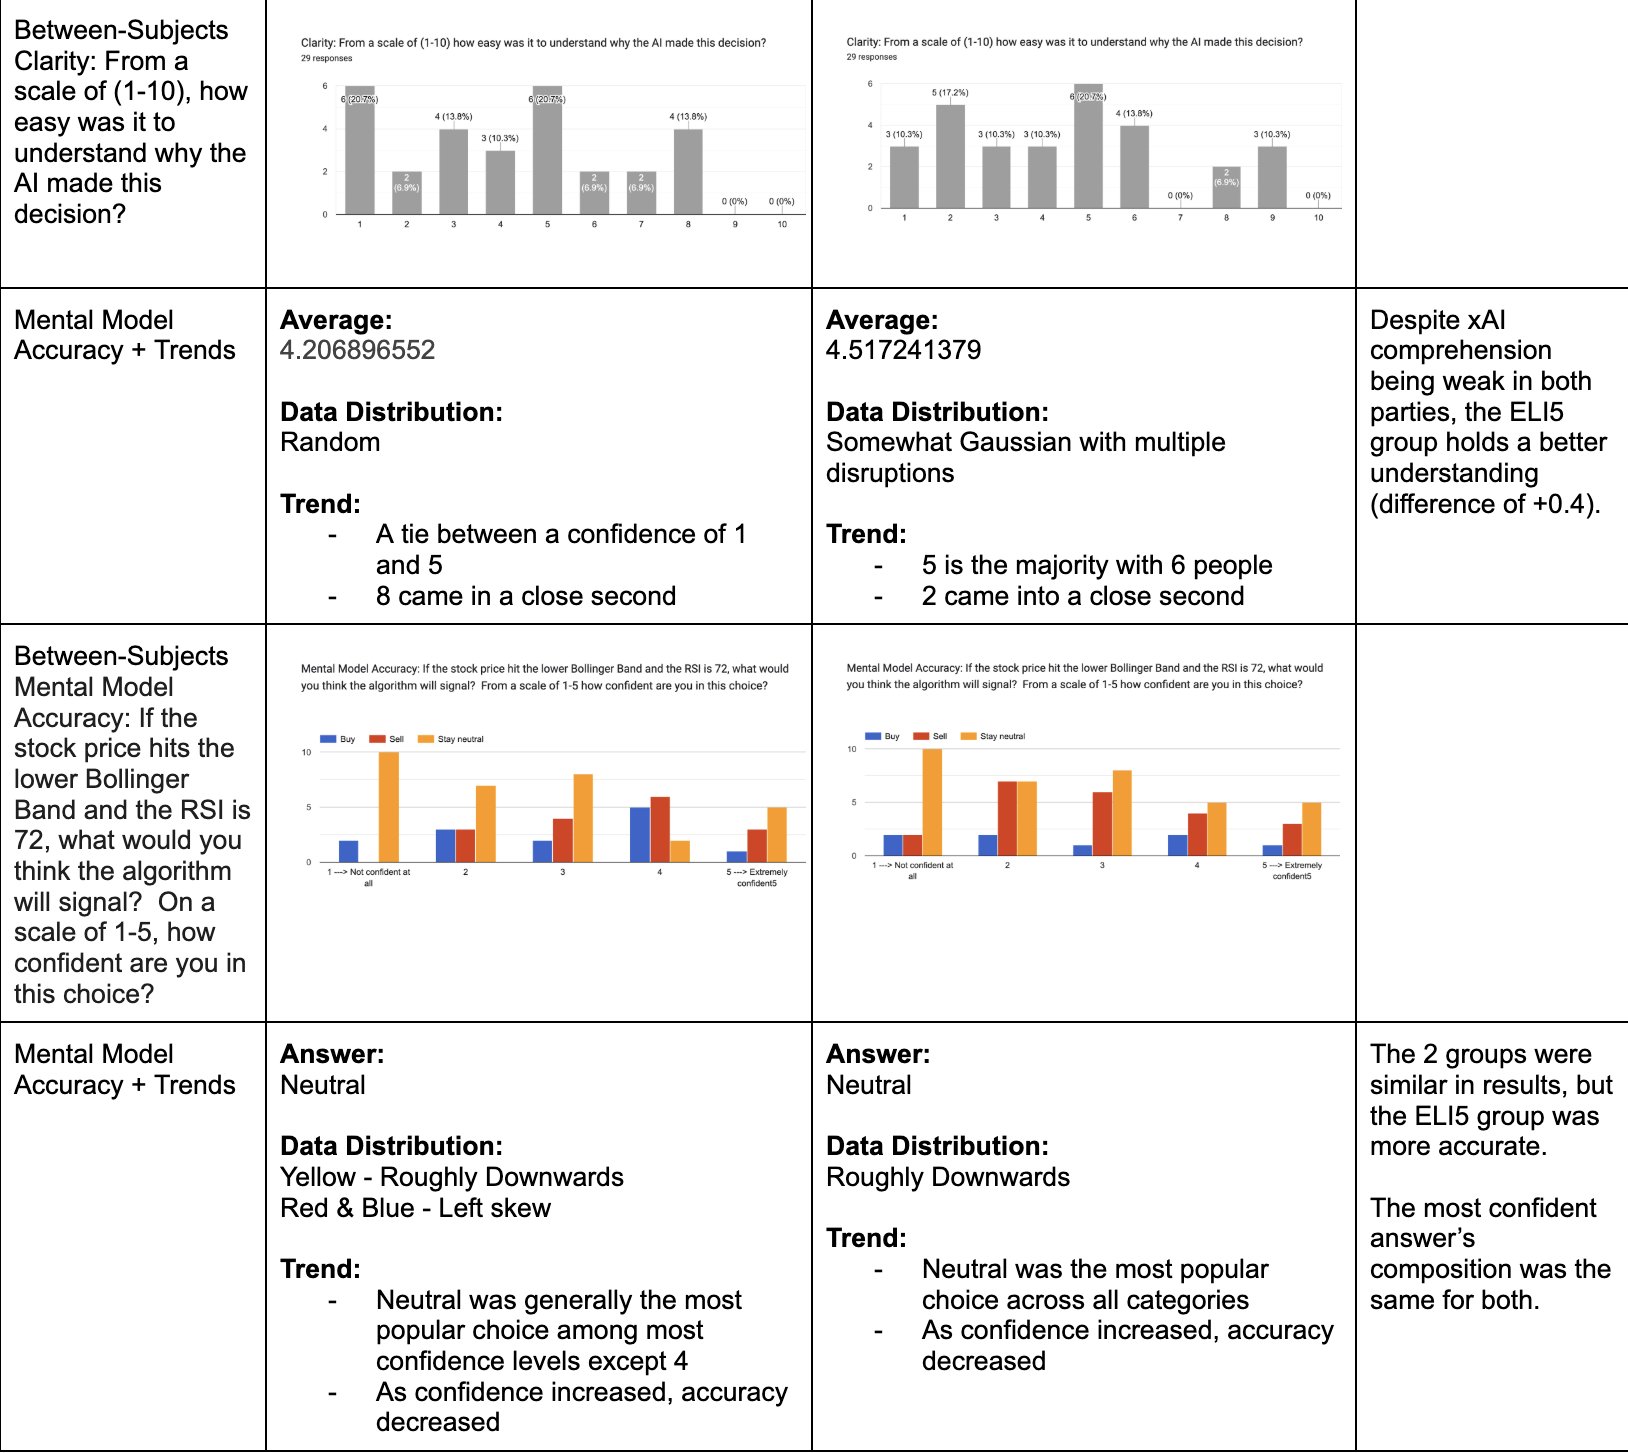
However, it is crucial to mention that the SHAP participants had a rough start, with their initial “Mental Model Accuracy” after xAI expostions. Being far behind ELI5, however, during the second assessment, their results substantially increased, being on par with ELI5 holistically and showcasing better competency as confidence increased. Such changes reveal the “Learning Curve of Interpretability,” where initial understanding and navigation may be difficult, but after slight progression, interpretability becomes much easier, parralleling with the NIH’s conclusion of how visual comprehension increases with exposure to said visuals. Since this is a pilot study, it is to be assumed that if given more “Mental Model Accuracy” questions, the SHAP group’s results will eventually surpass ELI5 in terms of accuracy.
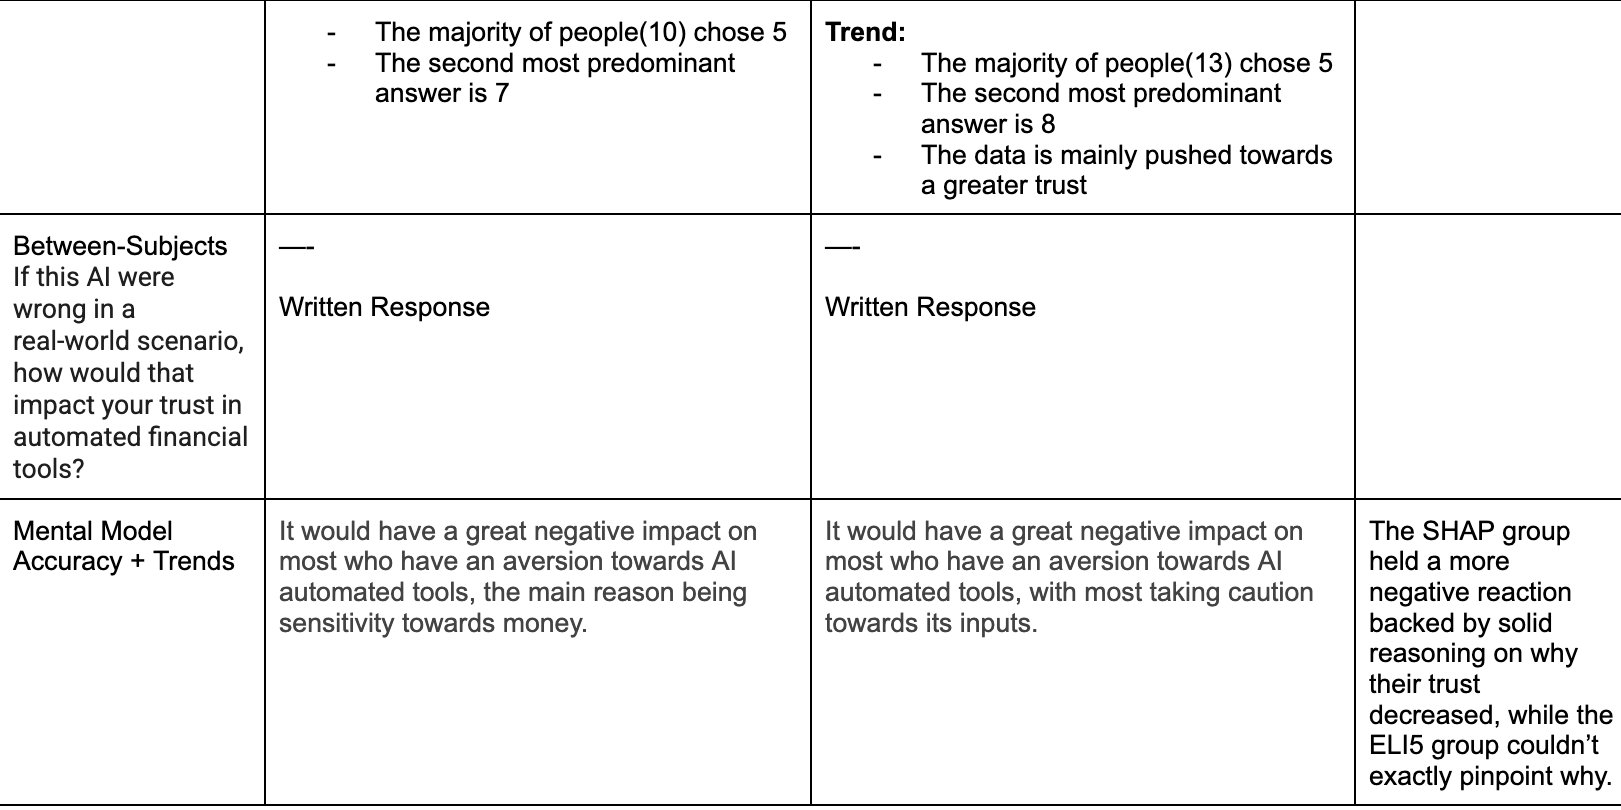
Finally, when asked, “If this AI were wrong in a real-world scenario, how would that impact your trust in automated financial tools?” a clear divergence in Trust Resilience emerged. The SHAP group viewed AI automation and tools more negatively, eliminating the tool from their finances. While the ELI5 group mentioned that they simply become more cautious of financial AI applications, something the SHAP group were already executing.
Conclusion
6.0 Summary of Analysis
Although ELI5 can enable a faster absorption of metrics and applications, it holds a low ceiling in which comprehensibility is stunted by the “Illusionary Explanation of Depth.” This study proves that although simplicity may seem like the best route to pursue when making AI accessible to younger Gen Z, it can inevitably be a liability due to its low ceiling. Meanwhile, SHAP may initially seem like a barrier to accessibility due to its complex composition in visual form, but it presents a pathway towards “Desirable Difficulty,” forcing one to critically think by converting the visual into an interpretable explanation. Its high ceiling is what financial literacy requires, yet at times may be challenging to achieve. Yet, with the right tools, like a simplified glossary and exposure, this problem can be mitigated. To conclude, for short-term interaction, ELI5 is an excellent tool; however, for long-term comprehension, SHAP is necessary.
6.1 Hypothesis revisit
My hypothesis is generally correct based on the assumptions taken; however, I missed a few key details. Although SHAP did demonstrate a higher level of retention, there was a temporal delay for the results to show, as they initially performed poorly compared to their ELI5 counterparts. The main display of enhanced understanding was through questions regarding the written explanations behind the reasoning of their answer.
Application
NOTE*** This study only included younger Gen Z participants, so findings chiefly reflect their responses and reactions to SHAP and ELI5. As a result, the results may not be generalizable to other age groups or demographics.
i) xAI Integration in Industries
This study proves that a “one-size-fits-all” ideology does not apply to efficient AI integration, but rather, they must follow a specialized framework best fit for their field of purpose.
Process Optimization(ELI5) For low-risk tasks, like a daily financial or medical screening, an associated ELI5 summary may be utilized to enhance efficiency and time-management. However, such practices must be utilized by industry professionals to prevent Automation Bias.
Cognitive Expansion For training (i.e. medical residency, interns, new hires), the visual-quantitative approach of SHAP may be extremely helpful in grasping complex concepts with multiple possible outputs. By triggering active interpolation, this type of tool, SHAP, can enable users to develop a well-built mental model before official participation in the workforce.
ii) Ethical UX Standardization in “High-Risk” Industries
Preventing False-Transparency Regulators (i.e. SEC, CSA) must focus on standardizing ELI5 outputs due to the potential for companies to alter the text to make a choice more appealing or further trigger the “Illusion of Explanatory Depth” effect, which can coax individuals into taking unwarranted risks without fully understanding its implications.
iii) Improving Technical Visual Literacy in schools
Educational Implementation During the study, even though the majority of SHAP individuals could interpolate from the given graph, there was still a predominant minority who lacked such skills. Creating a special unit in Jr.high or extending “CALM” in high school on advanced graph interpolation, not only for SHAP, but also for other financial statements as well, may be beneficial for future success.
Sources Of Error
i) Linguistic Error
In my ELI5 survey, a typographical error was present in the xAI output. Yet despite this, no one reported or pointed out the error. This mistake reveals that the participants’ trust was in the narrative fluency of the xAI rather than the proper syntax.
ii) Cognitive Fatigue
Because the survey involved advanced topics(i.e, Bollinger Bands, RSI) and retention of data, fatigue may have been a factor that influenced “Trust Delta” in the latter half of the survey. This was mitigated by the provision of a glossary and a “Within-Subjects” baseline for a more accurate comparison
iii) Environment
One of the variables out of my control was controlling the external environment in which the test was taken, such as temperature, noise, and time of day.
iv) Mental Model Accuracy
In the following style of question, some students ended up selecting one answer per row. Thus, as a result, I will review such questions holistically, looking at the deviations between the answers of the unconfident and confident in terms of composition and discrepancy. If a student selected "Buy" and "Neutral" with similar confidence, they are simulating the exact "hesitation" a real retail investor feels, and as a result, creating a more accurate curve.
Citations
The references section did not paste properly. Thus, please review it here.
References
Aboze, B. J. (2023, May 16). A comprehensive guide into SHAP (SHapley additive exPlanations) values. Deepchecks; Deepchecks AI. https://www.deepchecks.com/a-comprehensive-guide-into-shap-shapley-additive-explanations-values/ Accounting Stuff [@AccountingStuff]. (n.d.-a). 3 liquidity ratios you should know [Video]. Youtube. Retrieved March 3, 2026, from https://www.youtube.com/watch?v=4_GoWaMLGHI Accounting Stuff [@AccountingStuff]. (n.d.-b). 6 profitability ratios you should know [Video]. Youtube. Retrieved March 3, 2026, from https://www.youtube.com/watch?v=YxUK0nzf6eg Accounting Stuff [@AccountingStuff]. (n.d.-c). FINANCIAL RATIOS: How to analyze financial statements [Video]. Youtube. Retrieved March 3, 2026, from https://www.youtube.com/watch?v=3W_LwpeG8c8 An introduction to explainable AI with Shapley values — SHAP latest documentation. (n.d.). Readthedocs.Io. Retrieved March 3, 2026, from https://shap.readthedocs.io/en/latest/example_notebooks/overviews/An%20introduction%20to%20explainable%20AI%20with%20Shapley%20values.html API reference — pandas 3.0.1 documentation. (n.d.). Pydata.org. Retrieved March 3, 2026, from https://pandas.pydata.org/docs/reference/index.html Archer, C. (2024, December 12). What is a breakout trading strategy and how do you trade with it? IG. https://www.ig.com/au/trading-strategies/what-is-a-breakout-trading-strategy-and-how-do-you-trade-with-it-231024 bar plot — SHAP latest documentation. (n.d.). Readthedocs.Io. Retrieved March 3, 2026, from https://shap.readthedocs.io/en/latest/example_notebooks/api_examples/plots/bar.html beeswarm plot — SHAP latest documentation. (n.d.). Readthedocs.Io. Retrieved March 3, 2026, from https://shap.readthedocs.io/en/latest/example_notebooks/api_examples/plots/beeswarm.html Bio, R. (2025, November 5). Democratizing private markets. Kpmg.com; KPMG US. https://kpmg.com/us/en/articles/2025/democratizing-private-markets.html Bjork, E. L., Bjork, R., Roediger, H. L., Mcdermott, K. B., & Mcdaniel, M. A. (n.d.). C hapter Learning. Ucla.edu. Retrieved March 3, 2026, from https://bjorklab.psych.ucla.edu/wp-content/uploads/sites/13/2016/04/EBjork_RBjork_2011.pdf Bloomenthal, A. (2007, February 5). Gross profit margin: Formula and what it tells you. Investopedia. https://www.investopedia.com/terms/g/gross_profit_margin.asp Boesch, G. (2024, October 12). Unlocking the power of Explainable AI in modern tech. Viso.Ai. https://viso.ai/deep-learning/explainable-ai/ Bollinger bands definition. (n.d.). IG. Retrieved March 3, 2026, from https://www.ig.com/au/glossary-trading-terms/bollinger-bands-definition Bossi, F., Malizia, A. P., D’Arcangelo, S., Maggi, F., Lattanzi, N., & Ricciardi, E. (2023). Visual attention and memory in professional traders. Scientific Reports, 13(1), 20056. https://doi.org/10.1038/s41598-023-46905-3 Chen, A., Chung, I., Deng, K., Gao, S., Gu, E., Hou, D., Hou, S., Hou, T., Liu, C., Liu, S., Liu, T., Ma, A., Pagniello, M., Pan, T., Wang, J., Wang, L., Wang, X. H., Wu, N., Wu, S., … Zhou, E. (2025, December 5). "teens trust AI more than they shouldˮ A study of Canadian high school studentsʼ AI risk perception. Utoronto.Ca. https://ischool.utoronto.ca/wp-content/uploads/2026/01/Tao-Wang-FinalReport.pdf Chen, J. (2003a, November 18). Understanding Alpha in investing: Definition and examples. Investopedia. https://www.investopedia.com/terms/a/alpha.asp Chen, J. (2003b, November 24). What is mean reversion, and how do investors use it? Investopedia. https://www.investopedia.com/terms/m/meanreversion.asp Chen, J. (2003c, November 25). Maximize investments: Essential risk-adjusted return methods explained. Investopedia. https://www.investopedia.com/terms/r/riskadjustedreturn.asp Chen, J. (2008a, February 4). Mastering breakout trading: Key strategies for success. Investopedia. https://www.investopedia.com/articles/trading/08/trading-breakouts.asp Chen, J. (2008b, March 16). Understanding Dividend Per Share (DPS): Definition, formula, and importance. Investopedia. https://www.investopedia.com/terms/d/dividend-per-share.asp Cohn, N. (2020). Visual narrative comprehension: Universal or not? Psychonomic Bulletin & Review, 27(2), 266–285. https://doi.org/10.3758/s13423-019-01670-1 Current ratio calculator (Working capital ratio). (2020, September 12). BDC.Ca. https://www.bdc.ca/en/articles-tools/entrepreneur-toolkit/financial-tools/current-ratio Data Odyssey, A. [@adataodyssey]. (n.d.-a). Interpretable vs explainable machine learning [Video]. Youtube. Retrieved March 3, 2026, from https://www.youtube.com/watch?v=VY7SCl_DFho Data Odyssey, A. [@adataodyssey]. (n.d.-b). SHAP with python (code and explanations) [Video]. Youtube. Retrieved March 3, 2026, from https://www.youtube.com/watch?v=L8_sVRhBDLU Fernando, J. (2003a, November 18). Earnings per share (EPS): What it means and how to calculate it. Investopedia. https://www.investopedia.com/terms/e/eps.asp Fernando, J. (2003b, November 19). How Investors Use Arbitrage. Investopedia. https://www.investopedia.com/terms/a/arbitrage.asp Fernando, J. (2003c, November 23). Debt-to-equity (D/E) ratio formula and how to interpret it. Investopedia. https://www.investopedia.com/terms/d/debtequityratio.asp Fernando, J. (2003d, November 24). Inventory turnover ratio: What it is, how it works, and formula. Investopedia. https://www.investopedia.com/terms/i/inventoryturnover.asp Fernando, J. (2003e, November 25). Relative strength index (RSI): What it is, how it works, and formula. Investopedia. https://www.investopedia.com/terms/r/rsi.asp Fernando, J. (2003f, November 26). Debt-service coverage ratio (DSCR): How to use and calculate it. Investopedia. https://www.investopedia.com/terms/d/dscr.asp Fernando, J. (2003g, November 26). Dividend yield: Meaning, formula, example, and pros and cons. Investopedia. https://www.investopedia.com/terms/d/dividendyield.asp Fernando, J. (2003h, November 26). Price-to-earnings (P/E) ratio: Definition, formula, and examples. Investopedia. https://www.investopedia.com/terms/p/price-earningsratio.asp Fernando, J. (2003i, November 26). Return on equity (ROE) calculation and what it means. Investopedia. https://www.investopedia.com/terms/r/returnonequity.asp Fernando, J. (2003j, November 26). Sharpe ratio: Definition, formula, and examples. Investopedia. https://www.investopedia.com/terms/s/sharperatio.asp FMZQuant. (2024, May 8). The Bollinger Bands mean reversion strategy. Medium. https://medium.com/@FMZQuant/the-bollinger-bands-mean-reversion-strategy-d2ad8222cd3d Force Plot Colors — SHAP latest documentation. (n.d.). Readthedocs.Io. Retrieved March 3, 2026, from https://shap.readthedocs.io/en/latest/example_notebooks/tabular_examples/tree_based_models/Force%20Plot%20Colors.html Futures, O. (2025, January 16). Breakout trading: Identifying and trading price breakouts in futures market. The Trading Blog - Optimus Futures. https://optimusfutures.com/blog/breakout-trading/ Gen Z is using AI — but reports gaps in school and workplace support. (2025, April 8). Walton Family Foundation. https://www.waltonfamilyfoundation.org/about-us/newsroom/gen-z-is-using-ai-but-reports-gaps-in-school-and-workplace-support Gottfeld, A. (2025, May 22). Sortino Ratio: Formula, calculation, examples, and when to use. CashFlowFrog; Ariel Gottfeld. https://cashflowfrog.com/blog/how-to-calculate-sortino-ratio/ Hanley, R. (2003, November 25). Receivables turnover ratio: Formula, importance, examples, and limitations. Investopedia. https://www.investopedia.com/terms/r/receivableturnoverratio.asp Hargrave, M. (2003a, November 26). Standard Deviation Formula and Uses, vs. Variance. Investopedia. https://www.investopedia.com/terms/s/standarddeviation.asp Hargrave, M. (2003b, November 26). Understanding the return on assets (ROA) ratio for profitability. Investopedia. https://www.investopedia.com/terms/r/returnonassets.asp Hawkins, A. (2024, September 10). Inventory turnover ratio: Explanation + calculation. Extensiv.com. https://www.extensiv.com/blog/good-inventory-turnover-ratio Hayes, A. (2003a, November 18). Capital employed: Definition, analysis, calculation, and use to determine return. Investopedia. https://www.investopedia.com/terms/c/capitalemployed.asp Hayes, A. (2003b, November 19). What is the asset turnover ratio? Calculation and examples. Investopedia. https://www.investopedia.com/terms/a/assetturnover.asp Hayes, A. (2003c, November 21). Days payable outstanding (DPO): Definition and how it’s calculated. Investopedia. https://www.investopedia.com/terms/d/dpo.asp Hayes, A. (2003d, November 23). Understanding liquidity and how to measure it. Investopedia. https://www.investopedia.com/terms/l/liquidity.asp Hayes, A. (2003e, November 25). Dividend payout ratio: Definition, formula, and calculation. Investopedia. https://www.investopedia.com/terms/d/dividendpayoutratio.asp Hayes, A. (2003f, November 25). Operating margin: What it is and formula. Investopedia. https://www.investopedia.com/terms/o/operatingmargin.asp Hayes, A. (2003g, November 26). Return on capital employed (ROCE): Ratio, interpretation, and example. Investopedia. https://www.investopedia.com/terms/r/roce.asp Hayes, A. (2005, June 9). Conservative investing: Strategies, benefits, and risks. Investopedia. https://www.investopedia.com/terms/c/conservativeinvesting.asp Hayes, A. (2018, October 22). Days sales of inventory (DSI): Definition, formula, and importance. Investopedia. https://www.investopedia.com/terms/d/days-sales-inventory-dsi.asp heatmap plot — SHAP latest documentation. (n.d.). Readthedocs.Io. Retrieved March 3, 2026, from https://shap.readthedocs.io/en/latest/example_notebooks/api_examples/plots/heatmap.html How to use the Treynor ratio: Definition and formula. (2024, October 24). SmartAsset. https://smartasset.com/investing/treynor-ratio Kakade, S. (n.d.). Algorithms for VWAP and limit order trading. Upenn.edu. Retrieved March 3, 2026, from https://www.cis.upenn.edu/\~mkearns/talks/vwap.pdf Kenton, W. (2003a, November 20). What beta means for investors. Investopedia. https://www.investopedia.com/terms/b/beta.asp Kenton, W. (2003b, November 25). Treynor ratio: What it is, what it shows, formula to calculate it. Investopedia. https://www.investopedia.com/terms/t/treynorratio.asp Kenton, W. (2003c, November 26). Price/earnings-to-growth (PEG) ratio: What it is and the formula. Investopedia. https://www.investopedia.com/terms/p/pegratio.asp Kenton, W. (2003d, November 26). Sortino ratio: Definition, formula, calculation, and example. Investopedia. https://www.investopedia.com/terms/s/sortinoratio.asp Kenton, W. (2003e, November 26). Understanding Days Sales Outstanding (DSO): Key calculation and applications. Investopedia. https://www.investopedia.com/terms/d/dso.asp Kenton, W. (2009, February 4). Cash Ratio: Definition, Formula, and Example. Investopedia. https://www.investopedia.com/terms/c/cash-ratio.asp Leverage ratios. (2020, March 29). Corporate Finance Institute. https://corporatefinanceinstitute.com/resources/accounting/leverage-ratios/ Lumenalta. (2024, August 20). 9 AI problems: Common challenges and solutions (Updated 2026). Lumenalta. https://lumenalta.com/insights/ai-problems-9-common-challenges-and-solutions Matplotlib — visualization with python. (n.d.). Matplotlib.org. Retrieved March 3, 2026, from https://matplotlib.org/ McClain, C. (2026, February 24). How teens use and view AI. Pew Research Center. https://www.pewresearch.org/internet/2026/02/24/how-teens-use-and-view-ai/ Noble, L. (2021, March 24). What can profitability ratios say about your business? Simple Startup. https://simplestartup.com/blog/what-can-profitability-ratios-say-about-your-business/ Not-a-Bot. (2025, October 8). Overtrust: When AI feels smarter than it is. Medium. https://medium.com/@BeyondTheTuringTest/overtrust-when-ai-feels-smarter-than-it-is-c91b57926c25 NumPy. (n.d.). Numpy.org. Retrieved March 3, 2026, from https://numpy.org/ Palasciano, A. (2007, August 15). What is net profit margin? Formula and examples. Investopedia. https://www.investopedia.com/terms/n/net_margin.asp Passi, S., & Vorvoreanu, M. (n.d.). Overreliance on AI: Literature review. Microsoft.com. Retrieved March 3, 2026, from https://www.microsoft.com/en-us/research/wp-content/uploads/2022/06/Aether-Overreliance-on-AI-Review-Final-6.21.22.pdf Quantified Strategies [@QuantifiedStrategies]. (n.d.). Risk adjusted return: The 5 best ratios and formulas [Video]. Youtube. Retrieved March 3, 2026, from https://www.youtube.com/watch?v=uiDL71-QOZg QuantInsti Quantitative Learning [@quantinsti]. (n.d.-a). What is TWAP Trading Strategy? | How it Works? | Algo Trading Strategies [Video]. Youtube. Retrieved March 3, 2026, from https://www.youtube.com/watch?v=D0nxk7JsxfU QuantInsti Quantitative Learning [@quantinsti]. (n.d.-b). What is VWAP trading strategy? | algo trading strategies [Video]. Youtube. Retrieved March 3, 2026, from https://www.youtube.com/watch?v=ZGPwRRn55BI Seth, S. (2003, November 25). Understanding the quick ratio: Formula, examples, pros & cons. Investopedia. https://www.investopedia.com/terms/q/quickratio.asp Seth, S. (2014, October 10). Basics of algorithmic trading: Concepts and examples. Investopedia. https://www.investopedia.com/articles/active-trading/101014/basics-algorithmic-trading-concepts-and-examples.asp Sharpe Ratio. (2021, December 31). Wall Street Prep. https://www.wallstreetprep.com/knowledge/sharpe-ratio/ Smyth, L. W. (2025, October 16). Trust and resilience: The dynamic duo for overcoming adversity. Lorna Weston Smyth. https://lornawestonsmyth.com/trust-resilience-overcoming-adversity/ Tabulate. (n.d.). PyPI. Retrieved March 3, 2026, from https://pypi.org/project/tabulate/ Tahlan, R. (2025, March 22). Mastering the Moving Average Crossover Strategy: A Data-Driven Approach to profitable trading. Medium. https://raghuvansh.medium.com/mastering-the-moving-average-crossover-strategy-a-data-driven-approach-to-profitable-trading-4cd918e15ccf Thompson, C. (2003, November 23). Understanding Bollinger Bands: A key technical analysis tool for investors. Investopedia. https://www.investopedia.com/terms/b/bollingerbands.asp Thompson, C. (2014, May 20). How to use a moving average to buy stocks. Investopedia. https://www.investopedia.com/articles/active-trading/052014/how-use-moving-average-buy-stocks.asp Trust but verify: Peeking inside the “black box” of machine learning. (n.d.). Stanford Graduate School of Business. Retrieved March 3, 2026, from https://www.gsb.stanford.edu/insights/trust-verify-peeking-inside-black-box-machine-learning TWAP (time weighted average price). (n.d.). Crypto.com. Retrieved March 3, 2026, from https://help.crypto.com/en/articles/9291490-twap-time-weighted-average-price Types of explainable AI. (n.d.). Types of Explainable AI. Retrieved March 3, 2026, from https://courses.minnalearn.com/en/courses/trustworthy-ai/preview/explainability/types-of-explainable-ai/ Ushman, D. (2023, April 11). Moving Average Crossover Strategies: A complete guide. Trendspider.com; TrendSpider. https://trendspider.com/learning-center/moving-average-crossover-strategies/ Vipond, T. (2020, March 2). Profitability ratios. Corporate Finance Institute. https://corporatefinanceinstitute.com/resources/accounting/profitability-ratios/ waterfall plot — SHAP latest documentation. (n.d.). Readthedocs.Io. Retrieved March 3, 2026, from https://shap.readthedocs.io/en/latest/example_notebooks/api_examples/plots/waterfall.html Wayman, R. (2003, December 10). Evaluating EPS quality: Uncover earnings manipulations. Investopedia. https://www.investopedia.com/articles/analyst/03/091703.asp#:\~:text=from%2520Our%2520Partners-,Important,at%2520EPS%2520from%2520different%2520angles.%0Ahttps://www.investopedia.com/terms/p/price-earningsratio.asp%0Ahttps://www.investopedia.com/terms/p/pegratio.asp%0Ahttps://www.investopedia.com/terms/d/dividend-per-share.asp%0Ahttps://www.investopedia.com/terms/d/dividendyield.asp%0A Welcome to the SHAP documentation — SHAP latest documentation. (n.d.). Readthedocs.Io. Retrieved March 3, 2026, from https://shap.readthedocs.io/en/latest/ What is a good profit margin? Plus, tips to improve yours. (2024, April 11). Brex. https://www.brex.com/journal/what-is-a-good-profit-margin What is algorithmic trading? (2024, December 9). Financial Edge. https://www.fe.training/free-resources/capital-markets/what-is-algorithmic-trading/ What is Artificial Intelligence (AI)? (n.d.). Google Cloud. Retrieved March 3, 2026, from https://cloud.google.com/learn/what-is-artificial-intelligence What is explainable AI (XAI)? (2026, February 26). Ibm.com. https://www.ibm.com/think/topics/explainable-ai What is payables turnover. (n.d.). BDC.Ca. Retrieved March 3, 2026, from https://www.bdc.ca/en/articles-tools/entrepreneur-toolkit/templates-business-guides/glossary/payables-turnover Zeveney, A., & Marsh, J. K. (2016). The illusion of explanatory depth in a misunderstood field: The IOED in mental disorders. Annual Meeting of the Cognitive Science Society, 38(0). https://escholarship.org/uc/item/5b65181x (N.d.-a). Investopedia.com. Retrieved March 3, 2026, from https://www.investopedia.com/terms/l/liquidity.asp%0Ahttps://www.investopedia.com/terms/c/currentratio.asp#:\~:text=Analysts%2520also%2520must%2520consider%2520the%2520quality%2520of,the%2520company%2520may%2520be%2520headed%2520for%2520default.%0Ahttps://www.bdc.ca/en/articles-tools/entrepreneur-toolkit/financial-tools/current-ratio%23:\~:text=A%2520current%2520ratio%2520of%25201.0,is%2520not%2520always%2520best%2520practice.%0Ahttps://www.investopedia.com/terms/q/quickratio.asp%23:\~:text=The%2520ideal%2520quick%2520ratio%2520is,it%2520can%2520vary%2520by%2520industry.%0A (N.d.-b). Farseer.com. Retrieved March 3, 2026, from https://www.farseer.com/blog/cash-ratio-definition/#:\~:text=There's%20no%20single%20%E2%80%9Cgood%E2%80%9D%20cash,Quick%20Ratio (N.d.-c). Forbes.com. Retrieved March 3, 2026, from https://www.forbes.com/councils/theyec/2022/10/10/what-is-a-good-gross-profit-margin/ (N.d.-d). Plooto.com. Retrieved March 3, 2026, from https://www.plooto.com/blog/accounts-payable-turnover-ratio?srsltid=AfmBOorvOQmcCwBe7-6y_8Qut0yyar-8UC7iocTCgKHJ-zR6ELQORBuJ (N.d.-e). Investopedia.com. Retrieved March 3, 2026, from https://ww.investopedia.com/terms/d/debtequityratio.asp%0Ahttps://www.investopedia.com/terms/d/dscr.asp%0A%E2%80%8B%E2%80%8Bhttps://www.investopedia.com/terms/e/eps.asp (N.d.-f). Empirica.Io. Retrieved March 3, 2026, from https://empirica.io/blog/algorithmic-trading-a-complete-guide/ (N.d.-g). Empirica.Io. Retrieved March 3, 2026, from https://empirica.io/blog/vwap-algorithm/ (N.d.-h). Algorithmictrading.net. Retrieved March 3, 2026, from https://algorithmictrading.net/moving-average-trading-strategies/#:\~:text=A%20simple%20moving%20average%20(SMA,500%20Emini%20Futures%20(ES). (N.d.-i). Ust.com. Retrieved March 3, 2026, from https://www.ust.com/en/insights/ai-and-the-democratization-of-finance-making-wealth-building-accessible#:\~:text=Rethinking%20retirement%20planning,approaches%2C%20further%20simplifying%20the%20process (N.d.-j). Sciencedirect.com. Retrieved March 3, 2026, from https://www.sciencedirect.com/science/article/pii/S0388000122000407#:\~:text=Two%20groups%20of%20children%20with,of%20these%20results%20are%20discussed (N.d.-k). Researchgate.net. Retrieved March 3, 2026, from https://www.researchgate.net/figure/The-plot-illustrates-the-impact-of-individual-features-on-the-models-prediction-using_fig5_396748108 (N.d.-l). Scribbr.com. Retrieved March 3, 2026, from https://www.scribbr.com/statistics/probability-distributions/#:\~:text=The%20distribution%20is%20denoted%20by%20a%20capital,of%20%C2%B5%20and%20a%20variance%20of%20%CF%832 (N.d.-m). Researchgate.net. Retrieved March 3, 2026, from https://www.researchgate.net/publication/371577156_Metacognitive_calibration_a_methodological_expansion_and_empirical_application (N.d.-n). Nick-Chong-N__BnvQ_w18-Unsplash.Jpg. Retrieved March 4, 2026, from http://nick-chong-N__BnvQ_w18-unsplash.jpg
Acknowledgement
I would like to express my gratitude to my past science teacher, Mr.Worthington and my business teacher for taking the time out of their day to integrate my surveys into their classroom, aiding me in retrieving helpful data. I am also deeply thankful for Mr.Nikiforuk and Spencer Wojcichowsky for fostering the event at Ernest Manning. Most importantly, I want to thank my parents for their unwavering support and patience throughout the duration of this project. Additionally, I would like to extend my thanks to the CYSF staff for their organization of the event.