Programmable Living Bacterial Circuits.
Puneet Dhillon
STEM Innovation Academy Jr. High SW
Grade 9
Presentation
No video provided
Problem
Abstract
This project investigates whether living bacterial biofilms can be engineered to function as programmable electrical networks by combining chemical properties with spatial patterning. Using Escherichia coli K12 grown on LB agar, conductive environments were created by incorporating graphite and ferric chloride (FeCl₃) into the growth system. The biofilms were grown inside precisely patterned channels formed in the agar using custom 3D-printed molds designed in Autodesk Fusion 360. Three geometries which include triangles, squares, and hexagons were used to test whether the geometric structure influences the organization of bacterial curli fibers and the resulting electrical output (current and power) of the biofilm. Electrical output was measured at 12, 24, 48, and 72 hours using an Arduino Nano which was connected to an INA219 which measured recording voltage, current, and calculated power from the graphite electrodes embedded in the gel.
Results showed that both the media type of the growth medium and the geometry of the patterned channels significantly affected electrical output. Biofilms grown in media containing both graphite and FeCl₃ produced the highest electrical signals, particularly when combined with hexagonal channel geometries. Statistical analysis using two-way ANOVA demonstrated significant main effects for media and geometry as well as a significant interaction between the two variables, showing that electrical performance depends on the combination of the base media and the geometric design. These findings demonstrate that bacterial biofilms can be organized into controllable conductive pathways, supporting my idea of programmable living electrical circuits.
1. Introduction and Objectives
1.1 Project Title and Scope Statement
Project Title: “Programmable Living Bacterial Circuits.”
Scope Statement: This background research hopes to review the biological, chemical, materials science, and theoretical principles required to design and create programmable living conductors formed by protein fibres and by microbial templating or mineralization of conductive substances (including metal nanoparticles and graphite) in Escherichia coli K12. This section will be tailored towards guiding microbial construction into circuits, utilizing patterned hydrogels, and building on the foundations of electron transfer models, nucleation/mineralization chemistry, hydrogel-biofilm interactions, curli biogenesis, and theoretical theories that determine conductivity, stability, and experimental performance. The purpose of this section is to revise previous research and theoretical frameworks to aid in the development of the experimental procedure.
1.2 Motivation and Global Issue
The growing problem of electronic waste (e-waste), environmental demand for a more ecological, sustainable conductor, and the urgent global need for a low-cost, biodegradable circuit led to the motivation for this project.
1.2.1 Scale and Growth of the E-waste Problem
Electronic waste, commonly known as “e-waste,” is becoming a fast-growing, global issue contributing a large amount to the worldwide waste stream. This prevalent, environmentally damaging problem is dangerous, difficult to handle, and expensive to get rid of [1]. Recent data indicate that e-waste production reached a record of approximately 62 million metric tons in 2022, an 82% increase from 2010, and is expected to rise by an additional 32% to 82 million tons in 2030. Substantial resources worth billions of dollars were wasted and disposed of; e-waste recycling only provides 1% of the demand for rare earth metals. In addition, less than a quarter (22.3%) of 2022’s e-waste was recorded to be appropriately collected and recycled. This raises hazards of contamination to communities throughout the world and leaves the US with $62 billion worth of recoverable natural resources all left unaccounted for [2]. The majority of this waste, however, is dumped, burned, or processed in unregulated areas where hazardous metals like lead, cadmium, and mercury pollute the land, water, and soil [3]. This waste is extremely toxic to all forms of life, with children being the most vulnerable. According to the World Health Organization (WHO, 2024), “E-waste contains several known neurotoxicants, including lead and mercury, that may disrupt the development of the central nervous system during pregnancy, infancy, childhood, and adolescence... may also impact the structural development and function of the lungs... may cause irreparable harm and affect them for the rest of their lives.”
1.2.2 Environmental Costs for Metal Conductors and the Need for Sustainable Alternatives
The environmental demand for electronics is not just about disposal and recycling methods but rather the water-intensive energy required to mine copper. These mining processes largely contribute to greenhouse gas emissions and immense pollution [4]. Copper extraction alone has an extremely significant CO₂ footprint and could possibly lead to scarcity of resources such as water, along with heavy-metal contamination, and acid mining and tailings lead to environmental depletion [5], [6], [7]. These are the primary reasons that demand biological approaches, including microbial biofilms, curli-based nanofibers, and engineered living materials. The majority of these pathways, however, remain largely unexplored at the level of patterned-like conductors.
2. Historical Context
2.1 Evolution of Bioelectronics and Biologically Derived Conductors
The idea that living organisms, particularly microbes, could play a vital role in electrical systems and bioelectronics (the study of biological systems for electronic functions) has transformed from a theoretical idea to an experimental reality. In 1911, M.C. Potter first reported that microbial metabolism reacting with organic compound degradation could yield measurable electricity, highlighting that microorganisms could generate electricity under specific conditions [8]. However, for many decades research on bioelectric conductors remained vastly untouched. It wasn’t until the second half of the 20th century that materials science and bioelectronics began to emerge. The demonstration of metallic-like conductivity in iodine-doped polyacetylene in the late 1970s by Alan J. Heeger, Alan MacDiarmid, and Hideki Shirakawa, research that would eventually earn them the 2000 Nobel Prize in Chemistry, opened the possibility that organic materials might outdo metals and semiconductors in terms of electrical conductance [9].
2.2 Comparison of Inorganic Conductors and Biomaterials
In modern electronics, metals such as copper or silver and carbon-based conductors (e.g., graphite, graphene, and carbon nanotubes) are extremely popular because of their extremely high conductivity, copper's conductivity being around 5.8001×10⁷ S/m (siemens per meter) under standard conditions [10]. Graphite also conducts electricity due to the covalent bonds that exist between three carbon atoms, resulting in layers of hexagonal patterns in its atomic structure (its conductivity being around 10³ S/m) [11]. In contrast, biologically derived conductors such as protein-based fibres and microbial nanowires are renewable, potentially biodegradable, and can self-assemble under specific conditions. These biological conductors do have major flaws, including much lower conductivity, being more sensitive to environmental conditions (moisture, pH, ionic strength, etc.), and often having poor structural weaknesses. For example, according to research led by Malvankar et al., in 2011, report “...metallic-like conductivity in films of the bacterium Geobacter sulfurreducens and also in pilin nanofilaments (known as microbial nanowires) extracted from these bacteria. These materials have electronic conductivities of ∼5 mS cm(-1)...” [12]. Thus, although traditional materials offer high performance and stability, bioelectronics offer new kinds of electronics, ones that are flexible, biodegradable, self-assembling, and more sustainable. The following table summarizes the advantages, limitations, usages, and conductivity of different conductors.
| Conductor type | Typical Conductivity (S/m) | Key advantages | Key limitations | Uses |
|---|---|---|---|---|
| Metals (e.g., copper, silver) | \~5.8001 × 10⁷ S/m |
|
|
|
| Carbon-based conductors (e.g., graphite, graphene, and CNTs) | \~10³ to 10⁵ (graphite/carbon mats) to about \~10⁶ to 10⁷ (CNT/graphene film) [13] |
|
|
|
| Biomaterials (e.g., protein fibres, microbial nanowires) | \~10⁻² to 10⁰ S/cm, e.g., microbial nanowires 5 × 10⁻² |
|
|
|
*Conductivity values vary widely depending on material quality, processing, and structure; listed values represent typical values under standard conditions.
3. Bacterial Cell Biology 3.1 Prokaryotic Cell Envelopes To understand how bacteria can build materials outside of their cells, we first need to understand how bacterial cells are built internally with different structures and their functions. The “cell envelope” is a term that refers to the outermost layer of the bacterial cell, and its functions include protecting the cell, communicating with the environment, maintaining the cell’s shape and structure, and permitting the proper metabolism, growth, and replication of the cell [14]. Major structures include:
-
Inner (Plasma/cytoplasmic) membrane
-
Phospholipids and embedded proteins make up the prokaryotic cell’s innermost lipid bilayer. This membrane surrounds the cytoplasm and controls the movement of small molecules, ions, and proteins between the cytosol and the periplasm [15].
- Phospholipids play a vital role in the plasma membrane. Since lipids are fats, they are composed of fatty acid chains attached to a glycerol backbone. [15] As illustrated in fig. 3.1.1.1, a lipid is composed of a hydrophilic head and hydrophobic tails. The tails contain saturated and unsaturated fatty acids. Saturated fatty acids only contain single carbon-to-carbon bonds, leading to a straight and uniform chain. Whereas unsaturated fatty acids are more kinked or bent due to one or more carbon-carbon double bonds [16].
 Fig. 3.1.1.1: A diagram of a phospholipid (Image Credit: OpenStax Biology) [17]
- The inner membrane is present in both gram-positive and gram-negative bacteria. It is a fundamental component of the prokaryotic cell as it separates internal metabolic parts from the external environment. Fig. 3.1.1.2 reinforces the structure of the components in the inner membrane.
 Fig. 3.1.1.2: The inner membrane illustrating the phospholipid bilayer (Image Credit: Khan Academy) [18]
-
Peptidoglycan Layer (Cell Wall)
-
The peptidoglycan layer is a mesh-like area that is constructed by the covalent bonding of repeating disaccharide units, typically N-acetylglucosamine (NAG) and N-acetylmuramic acid (NAM) connected via β-1, 4 glycosidic bonds, with peptide side chains [24].
- Disaccharides are simple sugars made of two monosaccharide units connected through a glycosidic bond.
- N-acetylglucosamine is a naturally occurring amino acid that is derived from a glucose monosaccharide. It has the chemical formula C₈H₁₅NO₆. It is a key component in constructing the cell wall in bacterial and fungal cells [25].
- N-acetylmuramic acid is also a sugar derivative that plays a significant role in the bacteria cell wall, specifically the peptidoglycan layer. Its chemical formula is C₁₁H₁₉NO₈ [26].
- β-1, 4 glycosidic bonds are important covalent linkages that connect different sugar carbohydrates with other groups.
- In gram-positive bacteria this layer can be very thick (many stacked layers), forming the major structural support for the cell.
-
In gram-negative bacteria, this layer is extremely thin (often one to a few layers) and lies between the inner membrane and the outer membrane [22].
-
Periplasmic Space (in gram-negative bacteria)
-
This space is a gel-like compartment that is located between the inner (cytoplasmic) membrane and the outer membrane. According to Michael S. Donnenberg, the author of Principles and Practice of Infectious Diseases, “...the periplasm, an aqueous environment containing a high concentration of proteins and the peptidoglycan, which probably forms a hydrated gel.” [19] This area contains the Peptidoglycan Layer (Cell Wall) and a numerous number of soluble proteins such as binding proteins (for nutrients and ions), enzymes (periplasmic enzymes), and other important functional proteins (transporters, etc.) [20].
- This compartment is different depending on the type of bacteria. Gram-negative bacteria have a large, distinct periplasmic space between the inner and outer membranes, while gram-positive bacteria have a much smaller periplasmic space (or none) located between the inner membrane and the thick peptidoglycan cell wall [21]. This difference between the periplasmic spaces is depicted in Fig. 3.1.1.4.
 Fig. 3.1.1.4: Periplasmic space between gram-negative and gram-positive bacteria (Image Credit: Microbe Online) [23]
4) Outer membrane (in Gram-negative bacteria)
Fig. 3.1.1.4: Periplasmic space between gram-negative and gram-positive bacteria (Image Credit: Microbe Online) [23]
4) Outer membrane (in Gram-negative bacteria)
- A second lipid bilayer is located on the outside of the peptidoglycan layer; however, this layer is asymmetrical; it is not composed of phospholipids on both sides. The inner section of the membrane is composed of phospholipids, while the outer segment primarily contains lipopolysaccharides, lipoproteins, and outer-membrane proteins [22].
- Lipopolysaccharides (LPS), also known as endotoxins, play a crucial role in constructing outer membranes for gram-negative bacteria. They contain a lipid anchor, a core oligosaccharide, and an O antigen polysaccharide [24], [27].
- The outer membrane plays an important role by serving as a permeability barrier that restricts the flow of large hydrophobic molecules, toxins, detergents, etc. It also aids by stabilizing the inner membrane.
3.2 Surface Structures and Extracellular Matrix Components
Bacterial surface structures and extracellular substances are an essential part of how microbes adhere, organize, and mechanically construct communities such as biofilms, which directly impact the formation of physical properties of living conductors in this project. Pili/pilus and fimbriae are thin, hair-like protein tubes that extend outwards from the cytoplasmic membrane of prokaryotes such as bacteria [28]. They are composed of repeating pilin subunits that extend from the cell's surface. These structures commence the initial adhesion phase to the surfaces and other cells. They are crucial to early biofilm formation; for example, type I pili in Escherichia coli significantly enhance the attachment to both biotic and abiotic surfaces [29]. Curli fimbriae are a special class of amyloid protein fibers found in enteric bacteria and serve as structural adhesions and control both cell-cell and cell-surface contacts in developed biofilms [30]. Flagella, composed of flagellin proteins, are long, whip-like filaments that primarily provide motility and also contribute to surface approach and stable contact prior to biofilm matrix deposition.
The extracellular polymeric substance (EPS) matrix is produced by successful biofilm communities and is a highly complex and hydrated network of organic polymers (polysaccharides, proteins, and DNA) created by microorganisms [32]. It is composed mainly of exopolysaccharides, which act as a ‘molecular glue’ joining cells to surfaces and each other, contributing to mechanical adhesion and resistance to chemical and physical stresses [33]. Extracellular DNA (eDNA) is released through active secretion and flows through the matrix and acts as a structural connector between the cells. Extracellular proteins join EPS components and reinforce the matrix structurally, while enzymes within the EPS enable modelling of the biofilm in response to environmental changes [34].
3.3 Biofilm Lifecycle, Regulation, and Spatial Design
Biofilm transformation is a multi-step process in which planktonic bacteria transition from free-living cells to surface-attached embedded organisms. Initially, the individual cells loosely associate with a surface through reversible physical contact. But as they sense the surface, they switch physical characteristics, adhesions, and extracellular structures [35]. This initial phase is not stable and is accompanied by adhesions. After the bacteria have attached to the surface, they begin to reproduce and multiply rapidly. During this time, they also produce a slimy matrix that is composed of extracellular polymeric substances (EPS). These act as a barrier from the external environment, shielding the bacteria. As the culture matures, parts of the biofilm dry out and break free from the main biofilm. They land in new areas, and the bacteria begin to secrete nutrients, starting the life cycle of a new biofilm [34], [36], [37]. The diagram below illustrates the life cycle of a biofilm from formation to maturity.
 Fig. 3.3.1: Life cycle of a biofilm (Image Credit: Qualitru) [35]
4. Curli System and Extracellular Amyloid Fibers
4.1 Curli Fibers Function and Importance
Curli fibers are a class of extracellular functional amyloid protein fibers primarily produced by Gram-negative enteric bacteria such as Escherichia coli and Salmonella spp., where they form a major structural component of the biofilm extracellular matrix (ECM) and regulate adhesion and environmental stresses. Structurally, curli are long fibrils with a cross-β sheet conformation assembled through biogenesis in which monomeric subunits are secreted and polymerized on the cell surface [30], [38]. Unlike pathological amyloids, which are associated with human neurodegenerative diseases such as Alzheimer's or Parkinson's, which are caused by misfolded proteins building up in tissues, curli represent functional amyloids, which serve physiological roles. They promote surface adhesion, cell-cell attachment, and biofilm structural support [30], [39]. The fig. below depicts the formation of curli through CsgA subunits.
 Fig. 4.1.1: Formation of amyloid curli fibers within prokaryotic cells (Image Credit: National Library of Medicine) [30]
4.2 Electron Transport in Protein Fibers
Electron transport in biological materials can be explained utilizing three theoretical mechanisms: (i) thermally activated hopping or tunneling between localized redox-activated sites, (ii) through-bond conduction along partially conjugated pathways made by aromatic amino acids, and (iii) metal-controlled electron transfer when transition metals or cofactors (substances essential for enzyme activity) are directed towards protein scaffolds [40].
(i) In most traditional proteins electrons move by hopping or tunneling between cofactors or redox-active sites. The rates of electron transfer decrease exponentially as distance increases [41], [42]. A commonly used formula is the exponential distance dependence of the electron transfer rate:
kₑₜ = k₀e^-𝛽R
Where:
- kₑₜ is the rate constant for the electron transfer process
- k₀ is the exponential factor
- 𝛽 is the decay constant, which shows how quickly the rate decreases as the distance increases
- R is the distance between the electron donor and acceptor.
[43], [44], [45]
(ii) In amyloid and fibrous proteins, additional methods of electron transfer arise. These include stacks of aromatic residues (e.g., phenylalanine, tyrosine, and tryptophan), which can allow partial through-bond or π-π assisted transport, producing conductivities higher than expected for simple polypeptides, a rare phenomenon seen in protein-electronics [46], [47].
(iii) If metal ions or clusters are controlled (for example, through histidine, cysteine, or acidic residues), electrons can also move through metal hopping or mixed protein-metal methods, eventually leading to biological electron transfer chains [46], [48].
5. Microbial Nanowires
5.1 Definition and Types of Microbial Nanowires
Microbes that participate in extracellular electron transfer (EET) have a diversity of extracellular conductive appendages, each structurally different from one another yet fully functional and aimed at transporting electrons from the cell to the external matrix [49]. One well-known example of this includes protein nanowires produced by Geobacter species; these are threadlike pili composed of pilA subunits that have been shown to be highly conductive and crucial for the reduction of insoluble Fe(III) oxides. They also play a crucial role in long-range electron transport in electroactive bacteria [51]. Conductivity in these nanowires is believed to arise from the dense packing of aromatic amino acids and specific cytochromes (a protein class containing iron molecules that catalyze redox reactions) that facilitate charge distribution over micrometer scales [52]. [50], [53]
6. Biomineralization\, Microbial Metal Reduction\, and Templating Chemistry
6.1 Fundamental Concepts in Biomineralization
Biomineralization refers to the natural process by which living organisms precipitate inorganic minerals from their environments, often because of biological activity that changes local chemical conditions or directs crystal formation. In microbial systems, researchers have discovered two main pathways: biologically induced mineralization (BIM) and biologically controlled mineralization (BCM) [55]. In BIM, the metabolic activities of microbes change the surrounding microenvironment in ways that lead to mineral precipitation without direct genetic control over the minerals' nucleation. For example, changes in local pH from microbial metabolism can produce carbonate or metal oxide precipitation on or near cell surfaces or within biofilms [54], [56]. In contrast, in BCM, organisms apply precise biological regulation over mineral formation, controlling where, when, and how minerals nucleate, grow, and assemble [58]. One classic example includes magnetosome formation in magnetotactic bacteria, where vessels inside cells guide iron uptake and magnetite crystal formation into similar chains with precise size and morphology [57].
Microorganisms are capable of producing different types of biominerals, including iron oxides and hydroxides [59], [60]. In many microbial systems, the role of organic matrices, mainly extracellular polymeric substances composed of polysaccharides, proteins, nucleic acids, and lipids, is critical for nucleation and growth [61]. EPS provides functional groups such as carboxyl, phosphate, and sulfate, which bind to metal cations, concentrating ions locally, and lowering the energetic barrier for mineral nucleation [62].
6.2 Chemical and Thermodynamic Factors of Microbial Metal Reduction
In microbial systems, metal ion reduction is controlled by redox (reduction oxidation) chemistry and thermodynamic principles. Electrons must flow from a donor with a more negative potential to an acceptor with a more positive reduction potential to create a spontaneous (thermodynamically favourable) reaction [63]. Microorganisms generate electrons through metabolism into electron transport proteins and redox-active enzymes. It reduces a suitable acceptor such as a metal ion, e.g., Fe³⁺ → Fe²⁺ [64]
Standard reduction potentials (E⁰) provide a qualitative measure of the tendency of an ion or substance to gain electrons (be reduced) or lose electrons (be oxidized). A higher positive E⁰ indicates a stronger tendency to gain electrons. For example, silver ions (Ag⁺ + e⁻ → Ag⁰) have a relatively high standard reduction potential of ≈ +0.80 V, which demonstrates strong oxidizing power, making them largely reducible by microbial electron donors with a lower potential [65]. In contrast, other metal ions such as Fe³⁺/ Fe²⁺ (≈ +0.77 V) or MnO₂/Mn²⁺ (≈ +0.38 V) are also biologically reducible but depend on local conditions such as pH and temperature [66]. Table of common metal redox values and reduction potential (standard conditions, 25°C and pH 7)
| Metal Redox Couples | Approx. E⁰ (V) | Reduction tendency |
|---|---|---|
| Ag⁺ + e⁻ → Ag⁰ | + 0.80 | Highly favorable → Readily reduced |
| Fe³⁺ + e⁻ → Fe²⁺ | +0.77 | Favorable → Common microbial acceptor |
| Na⁺(aq) + e⁻ → Na(s) | -2.71 | Favorable → Common oxidizer |
| Cu²⁺(aq) + 2e⁻ → Cu(s) | +0.34 | Less favorable → Reducer |
| AgCl(s) + e⁻ → Ag(s) + Cl⁻(aq) | +0.22 | Less favorable → Reducer |
*Note: Exact E⁰ values may vary with pH and other conditions. [67]
6.3 Carbon-based Templating: Graphite/Graphene Integration with Biofilms
In carbon-based substances, electrically conductive carbon allotropes such as graphite nanoplatelets (xGnP), graphene oxide (GO), and carbon nanotubes (CNTs) serve as effective conductive fillers because of their inherent sp² carbon bonding and high aspect ratios [69]. These enable the formation of interconnected electron pathways at low concentrations. Graphite and graphene consist of covalently bonded carbon atoms in planar hexagonal lattices with delocalized π-electron systems that encourage electrical conduction along the sheet plane. CNTs are cylindrical tubes of sp² carbon that have an extremely high aspect ratio that assists with network formation [68]. Graphene and GO also introduce oxygen-containing functional groups such as hydroxyl and carboxyl, which allow for more organic chemical interactions such as hydrogen bonding, π-π stacking, and covalent linkage with organic polymers [70]. Graphene is one of the strongest materials due to its single layer of carbon atoms bonded together in a 2-dimensional honeycomb lattice. It forms strong sigma (σ) bonds along with delocalized pi (π) bonds. Graphene's structure is depicted in fig. 6.3.1.
 Fig. 6.3.1: The structure of graphene (Image Credit: Wikipedia) [71]
Within a biofilm matrix, extracellular polymeric substances can inactivate graphite or graphene through hydrophobic interactions and π-π stacking between aromatic substances and sp² carbon surfaces, allowing for even dispersion.
7. Materials Science and Design for Living Conductors
7.1 Hydrogel Principles
Hydrogel scaffolds are three-dimensional, hydrophilic polymer networks that hold large amounts of water and provide a soft, hydrated environment through which nutrients and cells interact with one another [73]. The physical properties, pore size, stiffness, diffusivity, and surface chemistry all determine how cells stick to move within, etc. And therefore, determine shape patterns of biofilm formation and growth guidance for living conductors [74]. Hydrogels differ vastly based on what they are composed of. Natural hydrogels derived from polysaccharides (e.g., alginate, agarose) or proteins (e.g., collagen, gelatin) demonstrate higher biocompatibility and inherent bioactivity that encourage cell adhesion and biofilm formation due to their high resemblance to extracellular matrices. They, however, have lower mechanical strength and higher degradability, which reduce pattern stability in the long run [75]. Synthetic hydrogels, constructed from materials such as poly(ethylene glycol) or polyacrylamide, provide precise control over pore size and mechanical stiffness with excellent consistency [76].
7.2 Adhesion, Mechanical Integrity, and Durability
Adhesion and mechanical integrity are extremely important for ensuring that biologically derived conductors such as protein fibers or mineralized networks remain stable and functional under real-world stresses such as bending, swelling, drying, and deformation [77]. In hydrogel systems, strong adhesion between different phases and the surrounding polymer network prevents cracking by allowing for stress transfer across the gel [78]. Studies show that chemically enhanced hydrogels significantly increase interfacial shear strength compared to unmodified systems, illustrating how molecular-scale bonding influences mechanical performance [79].
8. Electrical Theories Relevant to Biological and Combined Systems
8.1 Key Electrical Parameters and Definitions
Conductivity and resistance are crucial physical properties that describe a material's inherent ability to conduct or oppose the flow of electric current. Electrical resistivity (symbol ρ, units Ω⋅m) demonstrates how strongly a material resists current. A high resistivity means the material opposes current (as in insulators), while a low resistivity means it allows current to pass through easily (as in conductors). Electrical conductivity (symbol σ, units Siemens per meter, S/m) is defined as the inverse of resistivity, σ = 1/ρ, and represents how willingly a material permits the flow of a charge under an applied electric field, regardless of its geometric shape or size. [80]
In contrast to these material-level properties, electrical resistance (symbol R, units Ω) and conductance (symbol G, units S) describe the behavior of a specific object or component [81]. Resistance measures the opposition to current in a particular conductor and depends not only on the material's resistivity but also on the conductor's geometry. For a uniform conductor of constant cross-sectional area A and length L, resistance is directly proportional to length and inversely proportional to cross-sectional area according to the formula below:
R = p (L/A)
This explains why thinner wires resist more than short, thick wires [82]. Fig. 8.1.1 illustrates this formula.
 Fig. 8.1.1: The relationships between the area and length of a pipe affecting resistance (Image Credit: lumenlearning.com) [83]
8.2 Microscopic Conduction Methods in Biological Materials
In biological and biohybrid systems, electron transport occurs through different microscopic mechanisms depending on distance and molecular structure. Quantum tunneling is more effective over very short distances (a few nanometers) where electrons cross barriers, and the probability of quantum tunneling decreases exponentially as distance increases [84]. For longer paths, hopping proves to be more efficient as electrons jump between localized states, showing stronger temperature dependence and weaker distance dependence than tunneling [85].
Method
9. Overview of the Experimental Process
9.1 Research Question
The purpose of this research and the central question guiding the design of the experiment methodology is as follows: Is it possible to construct a biologically assembled, self-organizing conductive material by directing extracellular protein fiber formation and biomineralization in a living microbial system, in such a way that electrical conductivity appears as a property of the material itself rather than as an externally supplied feature.
This central question is further subdivided into more dependent design questions:
- Can living cells be engineered to form a stable network of extracellular fibers that serve as a material scaffold instead of a biological product?
- Is it possible to create a repeatable, identical, non-random material structure by using a precisely shaped mold to control their form?
- Is it possible to include conductive mineral components into a scaffold while maintaining a rigid structure?
- Does this approach show advantages in terms of flexibility, scalability, or uniqueness versus non-living or externally made conducting systems?
These subdivisions of the central question are illustrated in fig. 9.1.1
 Fig. 9.1.1: Initial tree diagram of guiding questions
9.2 Initial Design
9.2.1 Theoretical Design
In the context of engineered living materials, the demand for adaptable, self-organizing, and repairable conductive systems instead of externally constructed conductors initiated this project. The primary goal of this project is to determine whether electrical conductivity can be achieved internally through material property rather than traditional external nonliving material. Traditional conductive material systems, including metal traces, polymer-based conductors, and carbon-containing substances, are costly and nonrenewable. Once assembled, their geometry, composition, and functional capacity remain fixed, and any structural damage results in lower performance and permanent loss in functionality. In contrast, living things possess the ability to grow, organize, and repair.
The central requirement of this is the formation of a continuous, organized network without external support. In order to fulfill this requirement, the system must include i) a biologically generated scaffold that can change geometries, ii) a mechanism through which conductive components can be immobilized and organized within the scaffold, and iii) an environment that maintains spatial structure throughout the assembly process.
9.2.2 Experimental Design
The experimental design has been broken down into 4 phases, each of which plays an important part in contributing to the experimental success of this design. The purpose of this section is to shift from principle to feasibility by evaluating the design and decomposing it into smaller phases. These phases are presented below in chronological order.
9.2.2.1 Phase I Media Preparation
Design Objective: The primary objective of Phase 1 is to create a stable base environment that is capable of supporting microbial growth and sturdy material formation. Unlike traditional electrical experiments that rely on solid substances, this project uses a hydrated and soft hydrogel to more closely simulate the conditions required for living materials. Experimental design: This phase focuses on preparing and establishing the growth medium, in this case LB agar, into the petri dish in a way that ensures [86]:
- Uniform nutrients throughout the matrix
- Similar thickness and geometry
- Allow for patterning in the future.
Materials utilized:
- Nutrient-rich biological medium in the form of a gel.
- A simple sugar that encourages biofilm growth.
- A metal-nonmetal compound that can relatively easily be reduced to a conductive metal.
- Source of carbon in complex geometry that supports electrical conductivity.
- Sterile environment and dishes in which this phase will be conducted.
Actions performed: In this phase, a hydrated biological medium is prepared and placed into the experimental dish in a controlled manner to form a uniform layer.
Significance: Unlike traditional bioelectronic experiments, which begin with pre-shaped electrodes or solid conductors, this project instead begins by constructing the environment itself, allowing the conductor to be produced within the material itself.
9.2.2.2 Phase II Patterning
Design Objective: Phase 2 creates a method to organize the system of biological medium by changing the petri dish from a uniform environment into an organized scaffold. This scaffold directs biological construction. The goal here is not only to observe the biofilm but also to direct and guide it.
Experimental design: Patterning is used to:
- Create boundaries in which conductivity will be measured.
- Control the geometry of the media matrix.
- Create a repeating pathway
Materials utilized:
- Patterning template ideally 3D printed to ensure accuracy.
Actions performed: In this phase, the patterning template is placed onto the medium before it fully sets. This template is removed once the medium reaches its solid, gel-like consistency.
Significance: Most microbial fuel cells rely on lots of biofilm formation present in high densities, which forms unpredictably on electrodes. This design differs as it:
- Does not utilize pre-made electrodes.
- Uses geometry as a controlled variable.
9.2.2.3 Phase III Introduction of Bacterial Cells
Design Objective: The objective of phase 3 is to begin biological activity within the patterned scaffold. This allows cellular processes and extracellular fiber assembly.
Experimental design: Rather than adding the bacteria cells randomly, this step ensures they are introduced in a controlled manner to see if they can actively build structures within a set environment rather than just acting as stationary objects.
Materials utilized:
- Bacterial cells that are safe, nonpathogenic, have rapid growth, and are able to quickly produce proteins.
Actions performed: A liquid bacteria culture is carefully injected into the patterns of the biological medium.
9.2.2.4 Phase IV Evaluation and Testing.
Design Objective: The purpose of Phase 4 is to determine whether the phases before successfully produced a functional living conductor and to test its characteristics and properties.
Experimental design: Rather than focusing on a single property, this stage purposefully examines multiple properties, including:
- Structural integrity
- Patterning outcome
- New conductive behavior
- Stability and adaptability
Materials utilized:
- Measurement probes
- Imaging
- Comparison to control samples
Actions performed: In this phase, imaging tools such as microscopes and electrical probes attached to electrodes in the dish are utilized to evaluate different characteristics of the living conductor.
Significance: Testing the system directly evaluates the engineered living conductor for:
- Soft electronics
- Self-assembly
- Structural integrity
- Patterning ability
- Repeatability in the matrix
Material Considerations
| Phase number | Name of the required material | Description | Function | Relative cost excluding shipping and taxes. |
|---|---|---|---|---|
| Phase I | LB agar powder | Sterile LB agar is required. For this project, 2 grams of LB agar were dissolved in 140 ml of water. This created a 1.43% weight/volume (w/v) achieving a stable and solid gel | LB agar acts as the biological medium on which the bacteria will grow. In contrast to the LB broth, the LB agar provides a solid gel for the bacteria. The LB agar is specialized for the kind of bacteria utilized in this project; it has the necessary nutrients and amino acids that are required for E. coli K12. | \~ $32.50 for 20 grams. *Can be bought from a local biotech company. |
| Phase I | Glucose powder | Fine glucose (dextrose) powder with the formula C₆H₁₂O₆ is required. This can be regular supermarket grade, as it will be sterilized. | The glucose powder helps support biofilm formation in the E. coli bacteria. The glucose provides additional nutrients, which allow the bacteria to thrive and create biofilm colonies. | \~ $10 for 500 grams. *Can be bought from the supermarket. |
| Phase I | Iron (III) Chloride solution | Liquid iron (III) chloride solution, more commonly known as ferric chloride. This can be bought from stores that sell industrial supplies under the name of "etchant solution." | Iron (III) chloride has the formula FeCl₃. Iron (III) chloride is composed of metal and nonmetals. This compound serves as a metal reducer. The bacteria will reduce FeCl₃ into iron metal. They could then possibly use this to conduct electricity. | \~ $22 for 1000 ml. *Can be bought off Amazon |
| Phase I | Graphite powder | Fine graphite powder ideally sieved to be less than 100 micrometres. The finer the particles, the better, as they will remain suspended in the LB agar longer to provide uniform conductance throughout the matrix. Approximately 3 grams are used for every 140 ml. | The graphite particles are used to help support the conductivity of bacteria. They interact with the bacteria through biofilm formation and allow the bacteria to transport electrons. | \~ $30 for 500 grams. *Alternatively, it can be made by scraping pencil leads and then sieving them. |
| Phase I | Sterile water | Clean sterile water. Tap water is not recommended. | Sterile water is used to create the LB agar solution, which will solidify into a gel. | \~ $0 if you have bottled water. |
| Phase I | Petri dishes | Sterile plastic petri dishes are utilized. They should be autoclavable. I used the dishes measuring 100x15 mm. | These are used as experimental dishes where the experiment is conducted. The LB agar is poured in these plates along with the bacteria and patterning template. | \~ $50 for 50 plastic dishes. *Buy from a local science company, or you can order them from places like Amazon. |
| Phase I | Media bottles | Media bottles are essentially glass bottles. I used 250 ml bottles. Ensure that the media bottles are autoclavable. | All solutions, agar mixtures, broth, etc. Are autoclaved (heated to remove all bacteria) in these bottles. They play an important role in ensuring the experiment remains sterile. | \~ $40 for 8 250 ml media bottles. *The media bottles could be replaced by clear glass jars, but be careful. |
| Phase I | Autoclave | The autoclave that you decide to use must be large enough to hold your media bottles without them touching the top. Commercial autoclaves cost thousands of dollars, so a regular pressure cooker can be used instead. | The autoclave serves an important purpose, as it sterilizes all equipment and chemical solutions before use. This is extremely important, as external bacteria could interfere with the results of the experiment | \~ $0 assuming you have access to a standard pressure cooker. *An instant pot could be utilized. |
| Phase I | Isopropyl alcohol | A solution of isopropyl alcohol, ideally 99%, is utilized to help keep the environment sterile. | The isopropyl alcohol is sprayed on the equipment and in the air to kill external bacteria. If the conditions were not sterile, the experiment could not work. | \~ $9 for 400 ml. *Isopropyl alcohol from the pharmacy works perfectly. Do note that you will need a lot of it, so ensure you have it in stock. |
| Phase I | Graduated cylinder | A 100 ml graduated cylinder is used. | The graduated cylinder is used to measure all solutions. | \~ $20 *A regular measuring cup could be used but is not recommended due to its poor accuracy. |
| Phase I | Lab scale | A lab scale that has a 0.1 -gram resolution is required. A regular kitchen scale will not work. | The lab scale is used to measure and weigh out all the dry reagents. | \~ $20 *The lab scale can be bought from Amazon |
| Phase number | Name of the required material | Description | Function | Relative cost excluding shipping and taxes. |
|---|---|---|---|---|
| Phase II | 3D printer | A 3D printer is required to make the designs required for this project. In the project, the Bambu Lab A1 Mini and the Creality Ender V2 were used. Ensure that the printers used are compatible with a 0.4 mm resolution nozzle tip, as this was used during the printing process. | The 3D printer is used to create the designs for the project. These designs include the templates that are utilized. The templates are used to create an offset in the LB agar medium in which the bacteria will be channeled through | \~ $0 assuming you have access to a 3D printer. *If you have no access, there are many 3D printing services that may be readily available. Ensure these designs are printed with 100% infill and support and with a 0.4 mm nozzle tip. The files are attached in the Experimental Procedure section. |
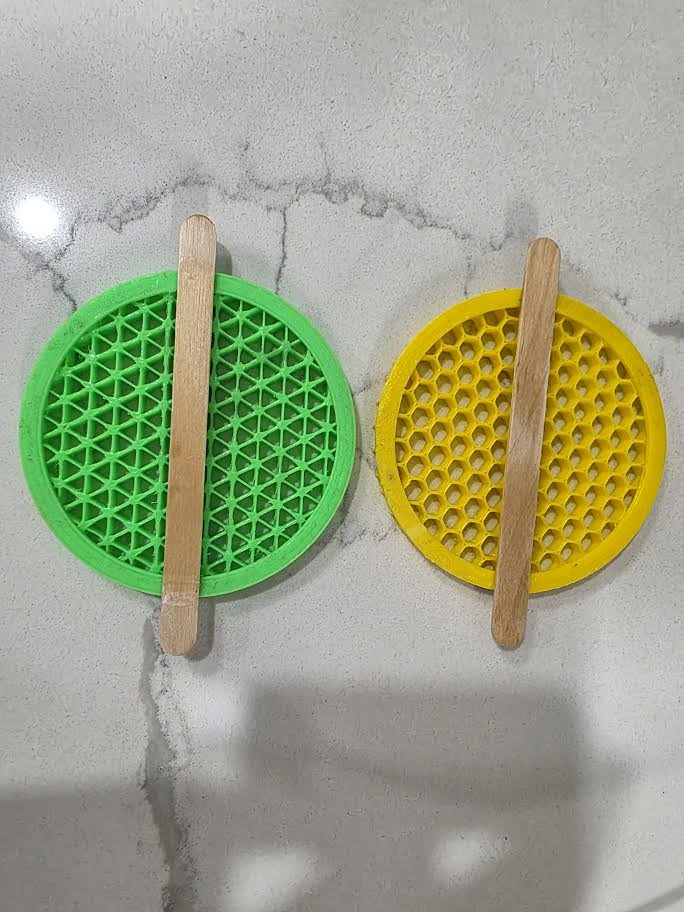
| Phase II | 3D-designed templates | 3D-designed templates are required for this project. The designs utilized in this experiment were modelled on Fusion 360 and printed on a Bambu Lab A1 Mini. These designs went through many variations until they fulfilled all required criteria. | The templates were used to create an imprint in the LB agar. The liquid bacteria culture was injected into these channels. The templates were made by tessellating different polygons: triangles, squares, and hexagons. The templates were adjusted to ensure that they fit into the petri dishes with the correct depth. | \~ $0 if you have access to Fusion 360. |
| Phase II | Isopropyl alcohol | A solution of isopropyl alcohol, ideally 99%, is utilized to help keep the environment sterile. | The isopropyl alcohol is sprayed on the equipment and in the air to kill external bacteria. In this phase, the alcohol is mainly used to disinfect the 3D-printed templates before they are embedded in the LB agar. | \~ $9 for 400 ml. *Isopropyl alcohol from the pharmacy works perfectly. Do note that you will need a lot of it, so ensure you have it in stock. |
| Phase II | Popsicle sticks | Regular popsicle sticks. | The popsicle sticks are glued onto the template to hold them at the correct height when they are submerged into the agar. | \~ $5 |
| Phase number | Name of the required material | Description | Function | Relative cost excluding shipping and taxes. |
|---|---|---|---|---|
| Phase III | Escherichia coli K-12 | E. coli K12 bacteria are used as the primary bacteria to determine if bacterial metabolism, biofilm formation, etc. support electrical current. E. coli K12 is used for a number of reasons. They include being nonpathogenic, having high protein production, and reproducing easily. All these factors make it an ideal candidate for this project. The E. coli K12 used in this project was ordered from a biotech company. | The E. coli K12 utilized was injected into the embedded channels created by the template. The bacteria were grown on plain media and transferred into a liquid broth culture, which was then utilized. The bacteria serve as the main source of conductivity in the entire project. | \~ $26 for one vial of the bacteria. *Bought from a biotech company. |
| Phase III | Micropipette | A P100 micropipette was utilized. This means its capacity is 10-100 µl, which is the amount of liquid bacteria required per petri dish | The micropipette is utilized to measure the correct amount of liquid bacteria culture, which is then injected into the wells created by the 3D-printed templates. The micropipette is essential, as the correct and precise amount of liquid is required to ensure the experiment remains constant and that the amount of liquid does not become a manipulating variable. | \~ $30 for one P100 micropipette. *The micropipette cannot be replaced, as it is extremely important. A good-quality micropipette can be bought off Amazon. |
| Phase III | Micropipette tips | Micropipette tips that are made for the micropipette P100 series are required. | The micropipette tips are replaced after each use to ensure sterility. If they are bought unsterile, they can be sterilized in an autoclave. | \~ $20 for a pack of 100 unsterile micropipette tips. *Can be bought from Amazon. |
| Phase III | Isopropyl alcohol | A solution of isopropyl alcohol, ideally 99%, is utilized to help keep The isopropyl alcohol is sprayed on the equipment and in the air to kill external factors and make the environment sterile. | The isopropyl alcohol is sprayed on the equipment and in the air to kill external bacteria. If the conditions were not sterile, the experiment could not work. | \~ $9 for 400 ml. *Isopropyl alcohol from the pharmacy works perfectly. Note that you will need a lot of it, so ensure you have it in stock. |
| Phase number | Name of the required material | Description | Function | Relative cost excluding shipping and taxes. |
|---|---|---|---|---|
| Phase IV | Graphite rods | Very thin graphite rods are utilized as electrodes. Ideally, these rods should be very thin, greater than or equal to 0.2 mm, and less than or equal to 0.7 mm. | The graphite rods act as electrodes. They are placed in the LB agar a few millimetres apart. These graphite rods are connected to the INA219 sensor. | \~ $10 for 5 rods *Can be bought off Amazon. Additionally, pencil leads greater than 0.2 mm in diameter can be utilized. |
| Phase IV | INA 219 sensor | An INA219 sensor is utilized for measurement. Note that some sensors may come disassembled, and you will have to solder the pins that are provided. | An INA219 sensor is wired to an Arduino module, which is then coded. The INA219 sensor reads data such as voltage, current, etc. From the graphite rods that are inserted into the agar matrix. | \~ $12 for two sensors. *Can be bought from Amazon. Only one sensor is required. |
| Phase IV | Arduino module | An Arduino Uno or Arduino Nano is required. Any other model works as long as it has the fundamental components. | An Arduino is required to read the data from the INA219 sensor. It then provides an output of the required data. | \~30$ for one official Arduino board. |
| Phase IV | Alligator clips, Jumper wires | Generic alligator clips and jumper wires are needed. | Alligator clips and jumper wires are required to connect the sensor to the board and the graphite rods. | \~ $15 |
| Total number of items plus miscellaneous | Total cost of all materials excluding shipping and taxes. |
|---|---|
| 23 estimated materials are required, covering chemicals, bacteria, and other equipment. | It is approximately $400, encompassing all materials, chemicals, and equipment. |
Experimental Method
Phase 1: Media Preparation
Phase 1 of this project focuses on the creation and preparation of a stable media that is able to support E. coli K12 growth and curli fibre self-assembly. This phase creates the foundation for all future experiments, as the physical and chemical properties of the medium directly affect bacterial growth, biofilm development, and eventual conductive properties.
Materials Biological Materials
- Pre-sterilized LB agar powder (2% w/v) was ordered in 2 g batches to ensure enough media for all experimental petri dishes, allowing a safety net for potential loss or contamination.
- D-glucose (0.2 g per 25 mL medium) for biofilm development.
- FeCl₃ (300 µL per dish, added after sterilization) as a metal ion to encourage conductive interactions between the bacteria.
Equipment and Consumables
- Sterile 100 x 15 mm polystyrene Petri dishes (50 total) from Prolab Scientific.
- Sterile glassware including beakers (500 mL), graduated cylinders (100 mL, 50 mL), magnetic stir bars, and sterile pipettes.
- Instant Pot used for media sterilization under controlled pressure and temperature conditions.
- Heat-resistant gloves, lab coats, and biosafety-approved eyewear to ensure sterility and safety.
- Sterile mixing tools, spatulas, and autoclave-safe containers.
Other Materials
- Fine graphite powder.
- Distilled water, autoclaved and cooled before media preparation.
Procedure Step 1: Calculation and Preparation of Media Volumes
Seven different media types were prepared for this phase, each in 75 mL portions, enough to fill three Petri dishes at 25 mL per dish. This gave 21 dishes for the main experiment. To allow for mistakes or contamination, extra dishes were made, bringing the total to 35 dishes and 875 mL of media. This extra volume ensures that if anything goes wrong, I can repeat the experiment without delay.
The LB agar concentration was chosen at 2% because it creates a gel firm enough to hold patterns for bacterial growth but soft enough for curli fibres to penetrate the medium. This was tested using regular agar agar to determine the best consistancy. Glucose was added because it aids in biofilm growth, which is essential for later forming conductive pathways in the bacterial network.

 Step 2: Sterilization of Base Medium
LB agar powder was combined with distilled water in a 500 mL beaker along with a magnetic stir bar to prevent clumping. Clumps can cause uneven gel thickness which would affect bacterial growth. The mixture was then sterilized using an Instant Pot, which allowed pressurized thermal sterilization without the risks of overboiling or evaporation. After sterilization, the medium was cooled to about 50°C. This temperature is warm enough to keep the agar liquid for pouring but cool enough to avoid killing bacteria when they are added later.
Challenges: During initial attempts, uneven heating caused some portions of the medium to start solidifying too early, creating inconsistencies in texture. To fix this, the medium was stirred gently during cooling.
 Step 3: Preparation of Media Variations
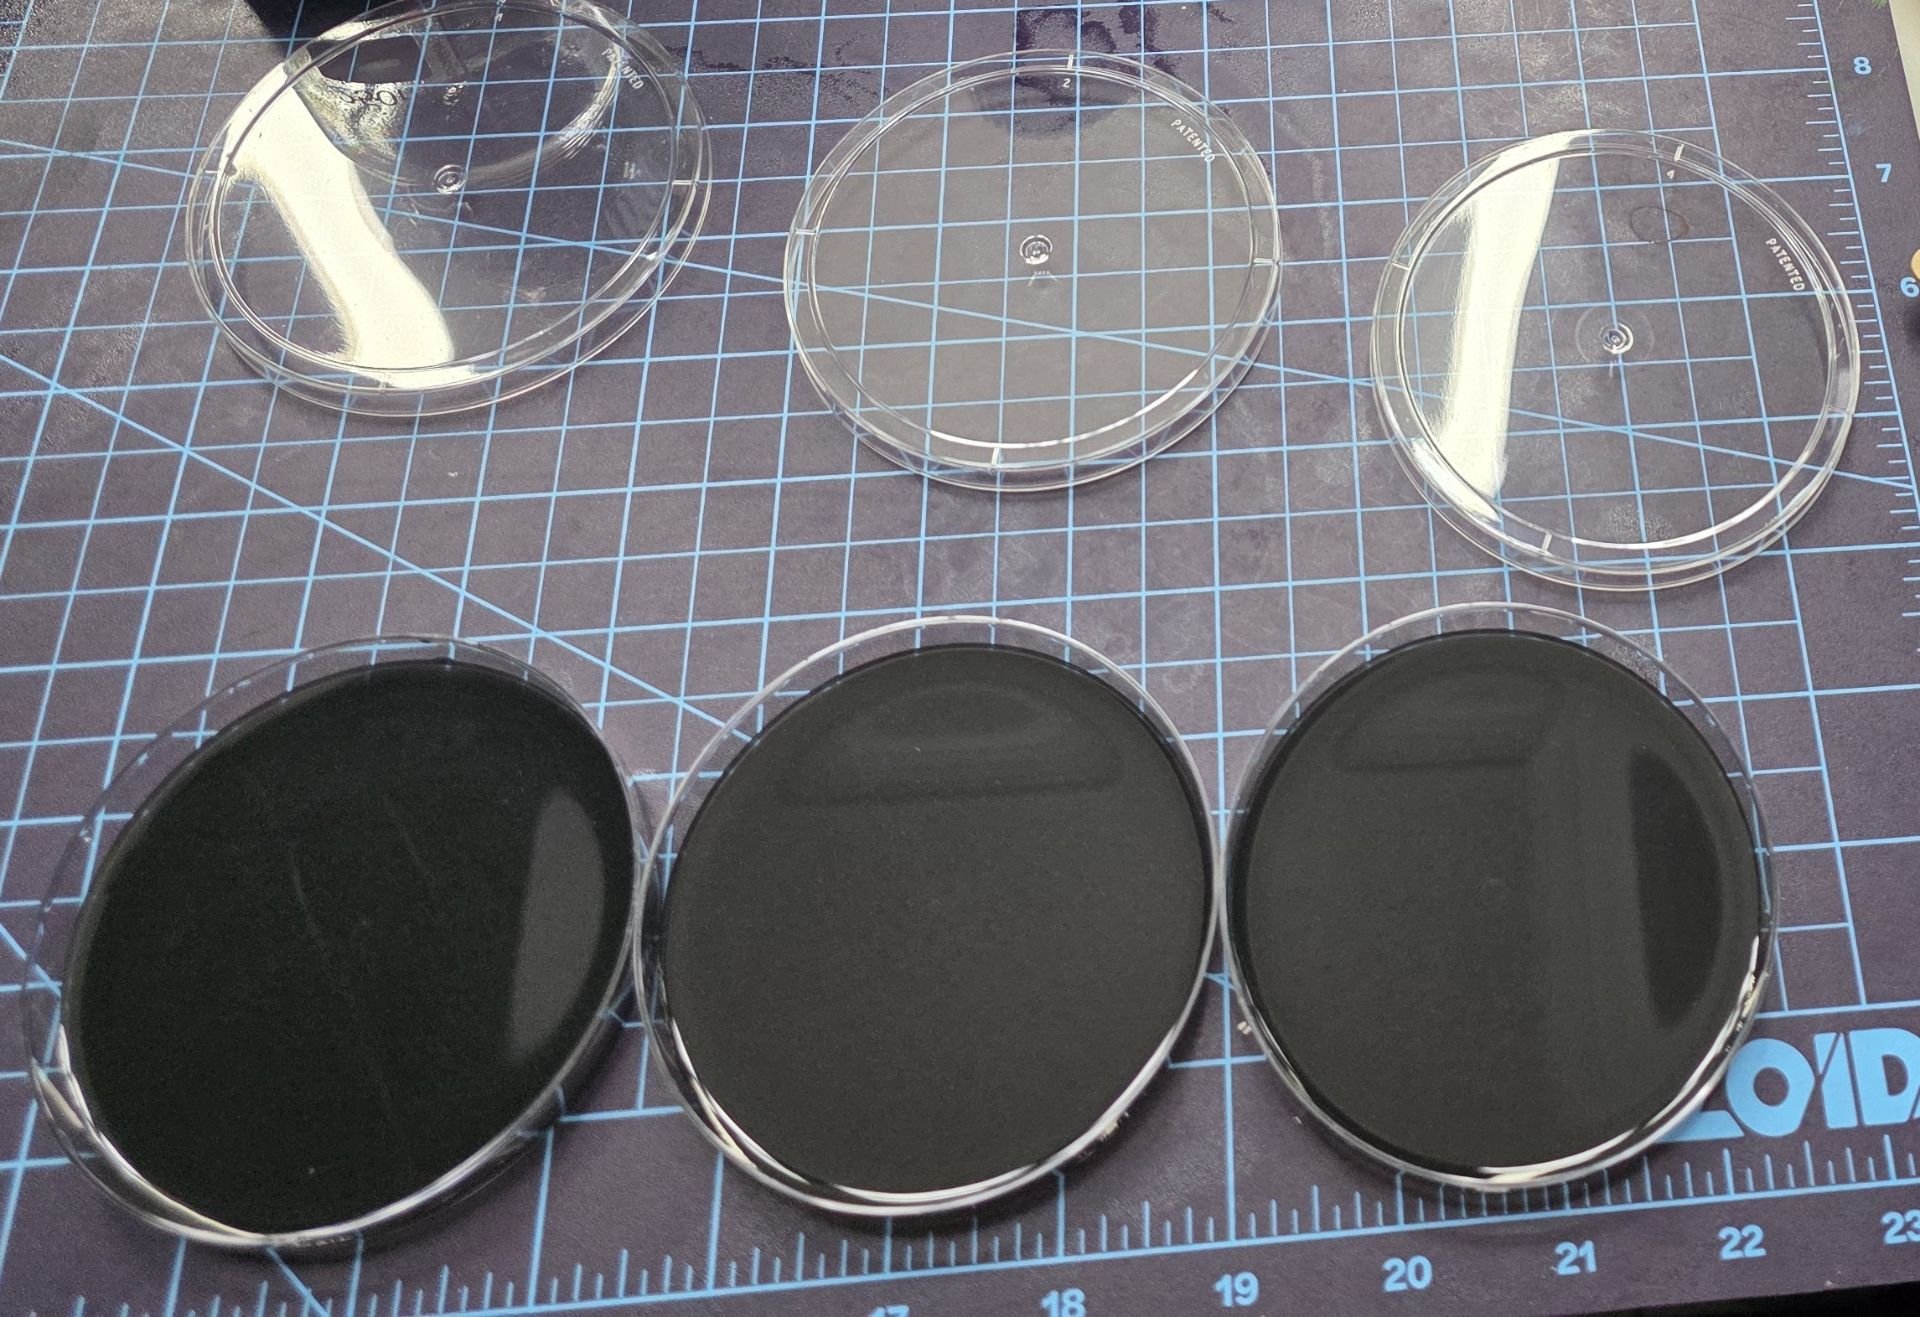
Seven media types were prepared to test how different materials would affect curli fibre assembly and conductivity:
- Plain LB agar – serves as a baseline for bacterial growth.
- LB agar + E. coli K12 – tests natural biofilm formation.
- LB agar + graphite + E. coli K12 – introduces carbon particles to enhance conductivity.
- LB agar + FeCl₃ + E. coli K12 – incorporates metal ions after solidification to create conductive interactions.
- LB agar + graphite + FeCl₃ + E. coli K12 – combines carbon particles and metal ions for hopefully better conductive effects..
- LB agar + graphite (control) – Sees the effect of graphite without bacterial contribution.
- LB agar + FeCl₃ (control) – Sees the effect of metal ions without bacterial contribution.
Each variation was prepared with precise measurements: solids were weighed to the nearest 0.01 g and liquids to the nearest 10 µL.
Challenges: Graphite incorporation was hard because fine particles tended to sink due to their greater density. This was solved by suspending the graphite in a small amount of sterile water and mixing it immediately before pouring. This step ensured the graphite was evenly distributed in the agar. Along with this, the mixtures containing graphite were poured in layers to better ensure they appeared consistently throughout the gel.
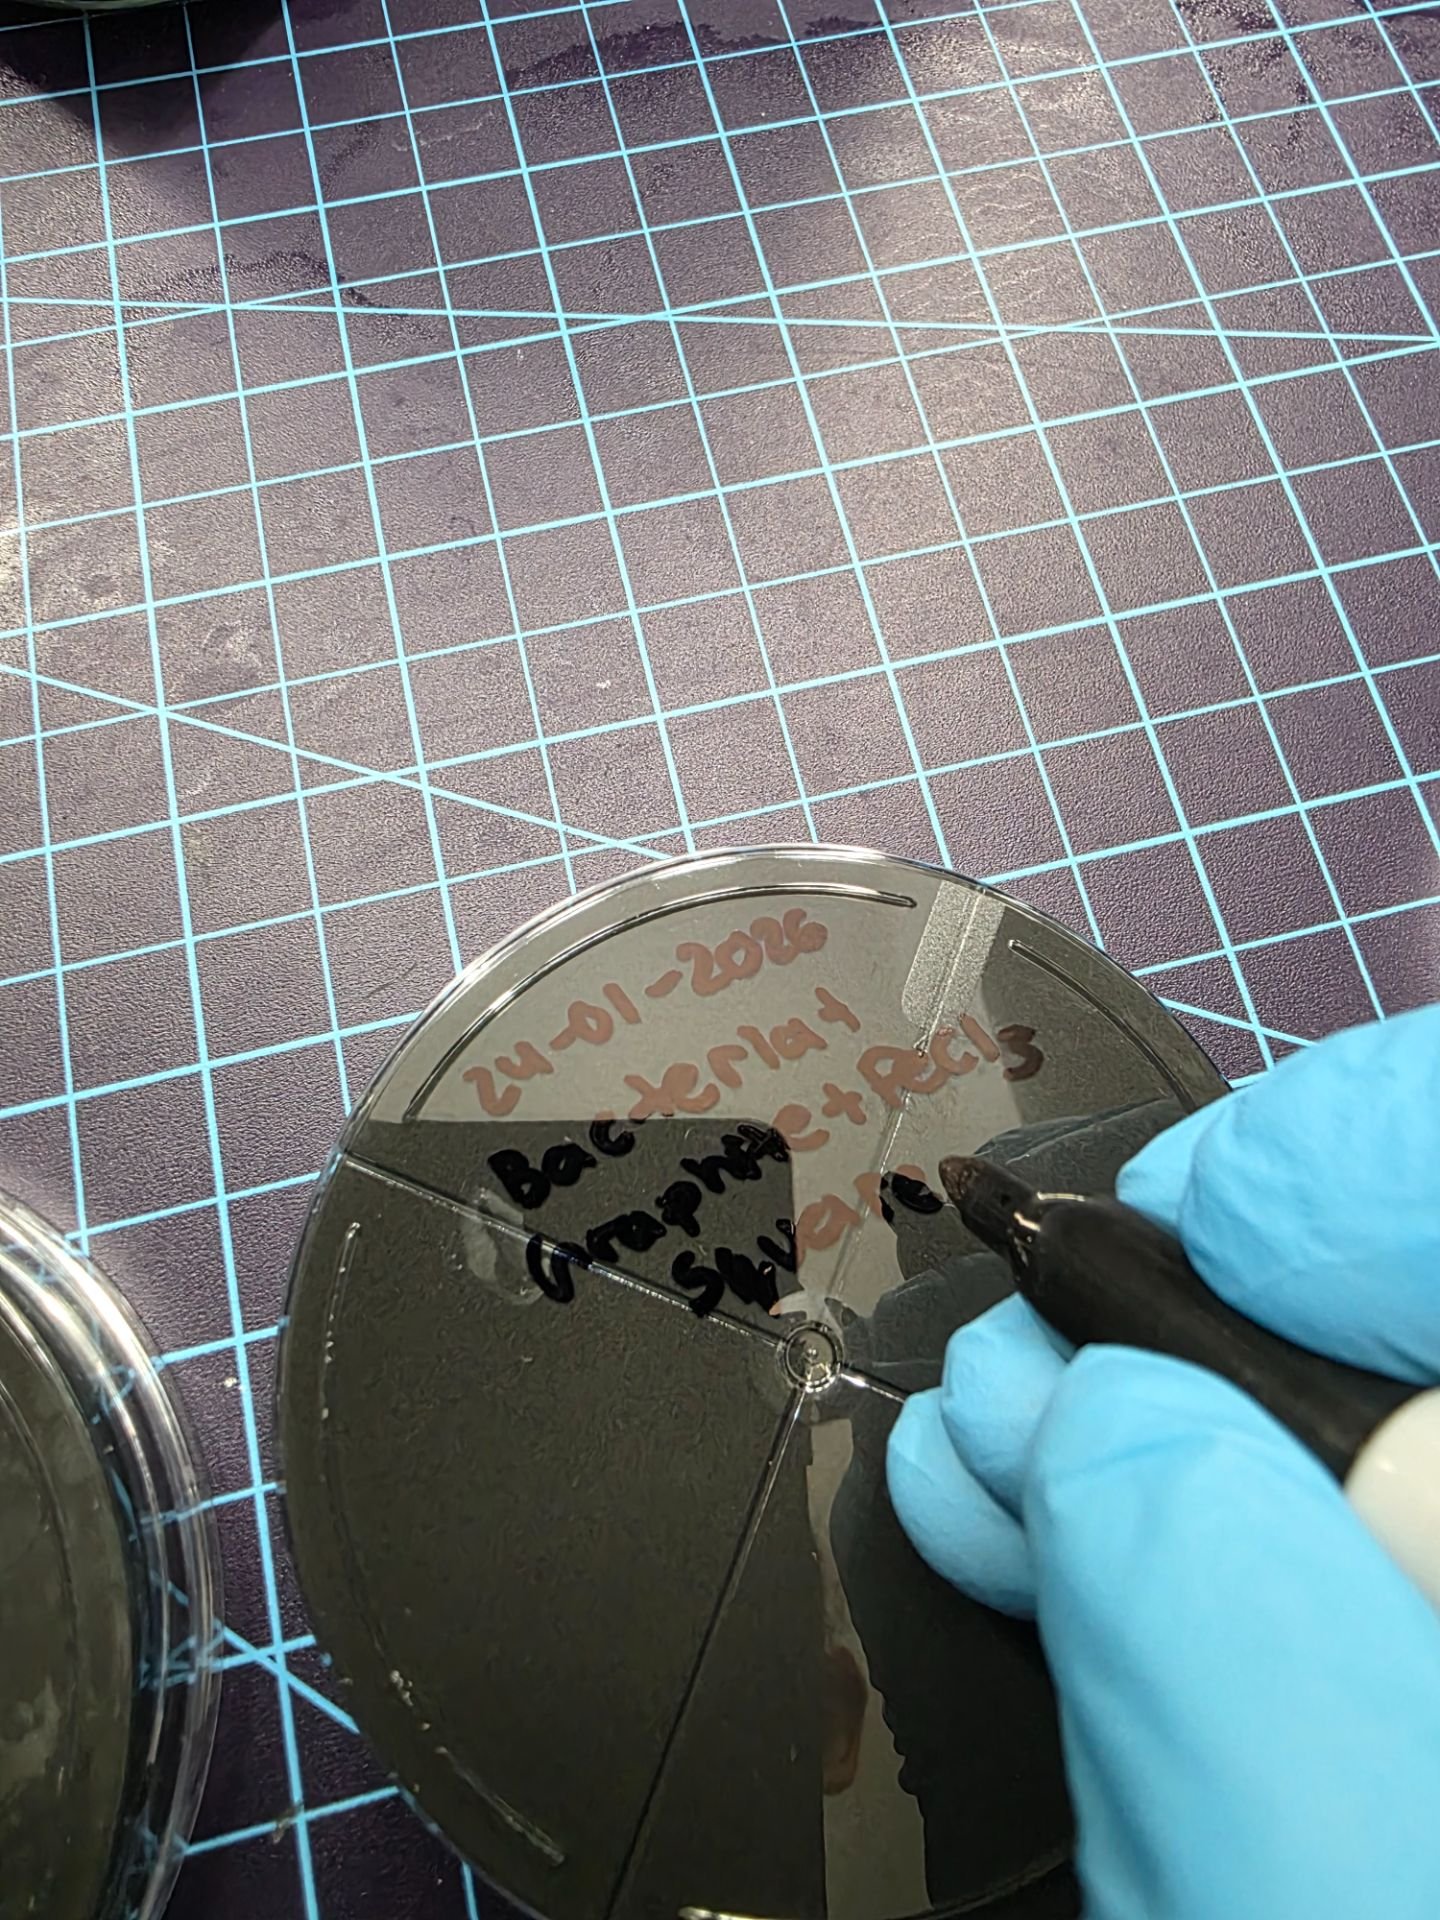
Step 4: Pouring Petri Dishes
Media was poured slowly into sterile Petri dishes to a depth of 25 mL to ensure enough depth. Air bubbles were avoided because they can create inconsistencies in bacterial growth or conductive path formation. Each dish was labelled with the type of medium and the date using a sharpie. The dishes were not allowed to solidify as phase two required them to be in a hot liquid state.
Challenges: Some media formed thin edges around the dishes. This was corrected by gently “shaking” the dishes in circular motions after pouring. Slight condensation sometimes appeared on lids, so dishes were inverted during solidification to prevent water droplets from disturbing the agar surface.
Step 5: Adding Metal Ions After Solidification
FeCl₃ was added carefully after the agar solidified, in 300 µL amounts per the required dish using asterile micropipette. Adding the metal ions post-solidification had two major benefits: it reduced exposure to toxic fumes during heating, and it allowed the ions to directly interact with bacterial growth paths, which would increase conductivity without harming the bacteriaL cells. FeCl₃ was dropped along the bacterial growth areas to directly interact with conductive pathway formations.
Throughout Phase 1, several challenges were created and were addressed:
- Uneven media solidification – solved by gentle stirring during cooling.
- Graphite sedimentation – fixed by pre-suspending particles in sterile water and immediate mixing.
- Condensation interference – solved by inverting dishes during solidification.
- FeCl₃ – adding it after solidification reduced exposure.
Phase 2 — Geometric Patterning of the Media
Phase 2 of this project focuses on patterning the agar medium before any bacteria are added.
Materials
Design and Modeling
Autodesk Fusion 360 was used to design all geometric patterning tools. This software allows for parametric modelling, meaning dimensions can be precisely controlled and adjusted while maintaining proportional relationships between features. This ensured that all replicates were identical.
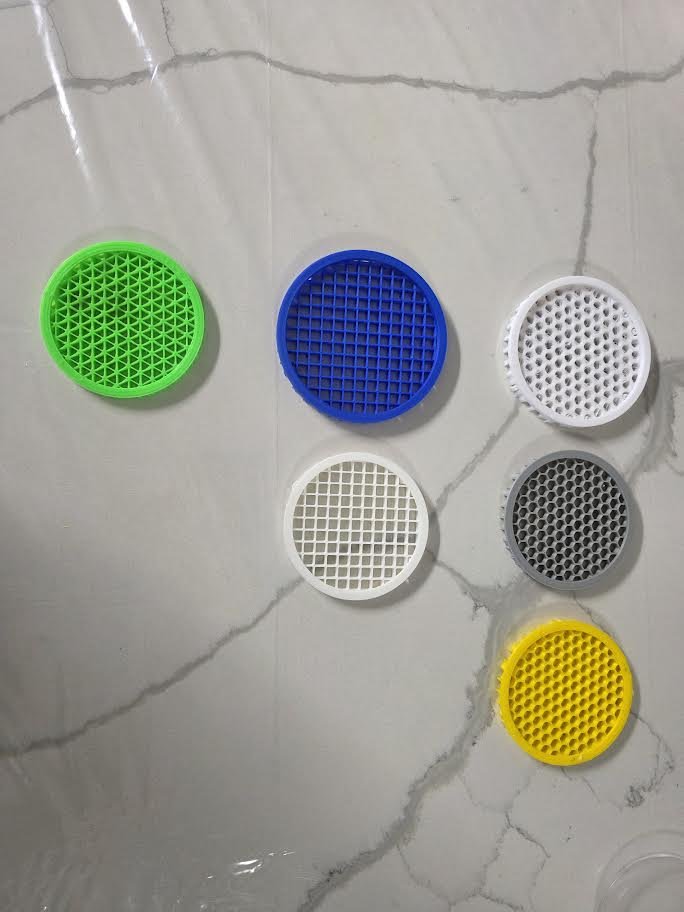
Three repeating geometric patterns were designed:
- Triangular tessellation
- Square grid lattice
- Hexagonal honeycomb structure
3D Printing Equipment and Materials
- Fused Deposition Modeling (FDM) 3D printer
- PLA (polylactic acid) filament
- STL design files exported from Fusion 360
- Printing specifications included:
- Layer height: 0.4 mm
- Infill density: 100%
- Moderate print speed for edge accuracy
- Calibrated nozzle temperature for smooth extrusion
- Optimized bed temperature to prevent warping
- Full infill was intentionally chosen to maximize structural rigidity and prevent deformation when inserted into warm agar.
Cleaning and Preparation Materials
- Distilled water
- 70% ethanol
- Sterile wipes
- Sterile workspace
Because PLA cannot withstand autoclave temperatures, chemical sterilization using ethanol was used instead.
Procedure
Step 1: Fusion 360 DEsign
All geometric shapes were first designed in Fusion 360 using parametric constraints. Channel widths were kept consistent across triangles, squares, and hexagons to ensure that any differences observed later would be due to shape rather than size. The channel width was created to be 0.8 mm wide. The shapes were designed with a uniform extrusion depth (of approximately 20 mm, accounting for air space) and a flat base to ensure even penetration into the agar. Smooth vertical walls were included to minimize tearing, and a slight 1–2° taper was added to reduce suction resistance towards the agar during removal.
Triangle side lengths were matched to square side lengths, and hexagon dimensions were precisely the same to maintain similar spacing between channels. Several early digital models were modified because thin walls appeared structurally weak. Wall thickness was increased to prevent damage to the model during printing and the experimental procedure.
 Challenges: Early CAD designs included thin triangular points that broke during printing. This was fixed by increasing wall thickness and reinforcing structural connections within the model.
 Step 2: 3D Printing of Patterning Tools
The designs were finalized and were exported as STL files and printed using an FDM 3D printer. Each model was printed with 100% infill to ensure structural integrity.
During early models, hollow or low-infill prints slightly deformed when inserted into warm agar, affecting channel depth. Increasing the infill to 100% removed this deformation and ensured consistent penetration across models.
Challenges: Initial prints with lower infill densities warped slightly under heat exposure from the agar. Switching to fully solid prints (100% infill) solved this issue and improved consistency.
 Step 3: Cleaning the Models
Before use, each printed insert was rinsed with distilled water to remove residues and stringing from printing. It was then submerged in 70% ethanol to reduce contamination and it was allowed t=o dry in a sterile environment.
Step 4: Timing
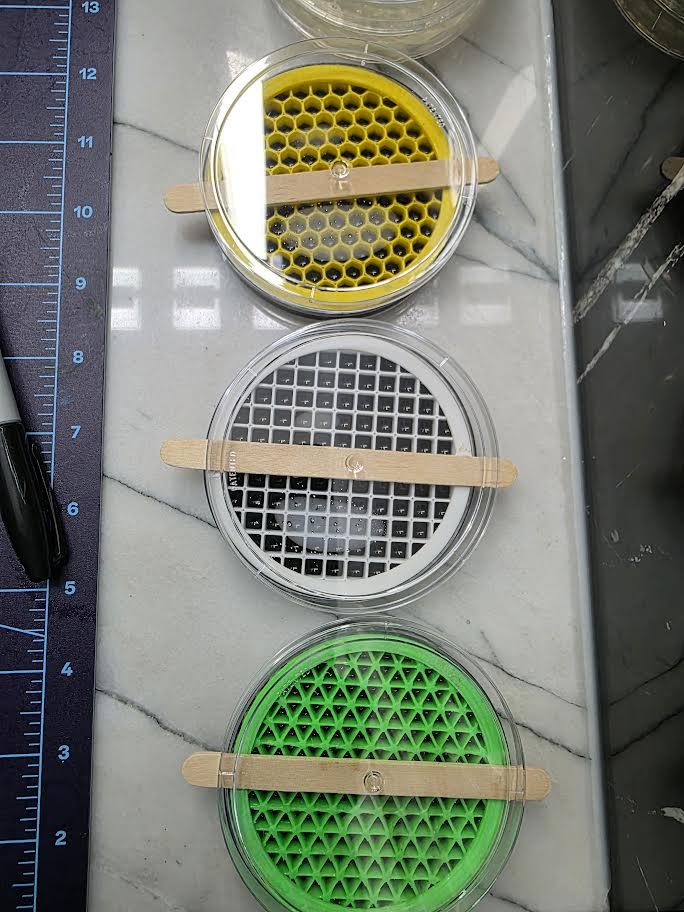
Inserting the patterning tool required exact timing with agar pouring from Phase 1. After sterilized agar was poured into 100 x 15 mm Petri dishes at 25 mL per dish, it remained semi-liquid at approximately 50–55°C.
This temperature was critical. If the insert was placed too early, currents in the liquid agar distorted channel walls. If inserted too late, the agar began solidifying, and surface tearing occurred.
Challenges: During initial attempts, insertion timing varied between plates, leading to inconsistent channel formation. This was corrected by properly adjusting the timing of the insertion part.
 Step 5: Cooling
Dishes were allowed to cool at room temperature under sterile conditions for approximately 20–30 minutes. Quick cooling was avoided because it could cause gel stress, surface cracking, or other conditions.
Step 6: Removal of Patterning Tools
After complete solidification, the models were CAREFULLY removed using a slow pulling force only. Twisting was avoided because previous trials showed that rotating motion caused cuts in the channels.
Once the models were removed, the agar plates were carefully checked to see if any major damage had been done. If so, those plates were repeated.
Throughout Phase 2, several challenges fixed:.
- Timing issues – solved by creating a 60–90 second insertion window.
- Print problems – fixed by increasing wall thickness and using 100% infill.
Phase 3 — Bacterial Cells Incorporation
Phase 3 is where the experiment finally becomes biological. In Phases 1 and 2, the agar plates were prepared and shaped with specific geometric channels, but they were still sterile. In this phase, E. coli K12 bacteria are grown and carefully added into those channels.
Materials Biological Materials
- E. coli strain K12, sourced from a well-known supplier, was selected for its rapid growth characteristics and well-known curli fibre production. (received embedded in a sterile agar slab).
- Fresh plain LB agar plates (2% w/v) for isolating colonies.
- Beef broth mixture (0.8 g powder in 50 mL distilled water) for liquid culture growth.
Equipment and Consumables
- Sterile Petri dishes prepared in previous phases.
- Sterile inoculation loops.
- P100 micropipette (set to 300 µL).
- Sterile pipette tips (new tip for every dish).
- Sterile centrifuge tubes.
- Instant Pot for sterilizing broth.
- Disinfected workspace and cleaning supplies.
Procedure Step 1: Isolating Single Colonies
The E. coli K12 strain originally arrived inside an agar slab, which meant the bacteria were spread unevenly. Before adding them into the patterned channels, isolated colonies had to be grown. Fresh plain LB agar plates were prepared using the same method from Phase 1. Once the agar hardened, a sterile inoculation loop was used to transfer a small sample from the original slab onto the new plate.
A four-quadrant streaking method was used. The bacteria were first spread across one section of the plate. Then the loop was sterilized, and streaking continued into the next section to dilute the bacteria. This was repeated until the fourth quadrant. This process helps separate individual bacterial cells so they can grow into isolated colonies. The plates were incubated at 30°C for about 1-2 days. After incubation, clearly separated colonies were visible.
Challenges: At first, the colonies were too crowded because not enough dilution happened between quadrants. This was fixed by sterilizing the loop more carefully and using the loop more lightly.
 Step 2: Preparing the Liquid Growth Medium
To add bacteria evenly into the channels, a liquid culture was needed. A broth was prepared by dissolving 0.8 g of beef broth powder into 50 mL of distilled water. The mixture was stirred until fully dissolved and then sterilized in the Instant Pot under pressure. After sterilization, it was left to cool in a clean area. The broth was poured into two sterile centrifuge tubes. One tube was used for growing bacteria, and the second stayed sealed as a backup control to check for contamination. Before adding bacteria, the broth was checked carefully. It needed to be completely clear. If it looked cloudy before inoculation, it meant contamination.
Challenges: During one attempt, the broth looked slightly cloudy before bacteria were added. That batch was thrown out, and extra care was taken with sterilization and handling the next time.
Step 3: Growing the Liquid Culture
A single, well-isolated colony from the streak plate was chosen. It was important to pick one colony that was separate from the others to keep the culture consistent. Using a sterile loop, the colony was placed into the broth tube. The tube was gently shaked to mix the bacteria evenly.
The culture was incubated at 30°C for about 2-3 days. Over time, the broth changed from clear to cloudy. This cloudiness showed that the bacteria were multiplying.
 Step 4: Preparing the Patterned Plates
Before adding bacteria, all patterned agar plates were checked again. The plates were brought to room temperature to prevent water droplets from forming during inoculation.
The P100 micropipette was set to exactly 100 µL. This process was repeated three times so that 300 µL of broth was transferred. A new sterile tip was used for each plate to prevent cross-contamination between different geometries.
Step 5: Targeted Channel Inoculation
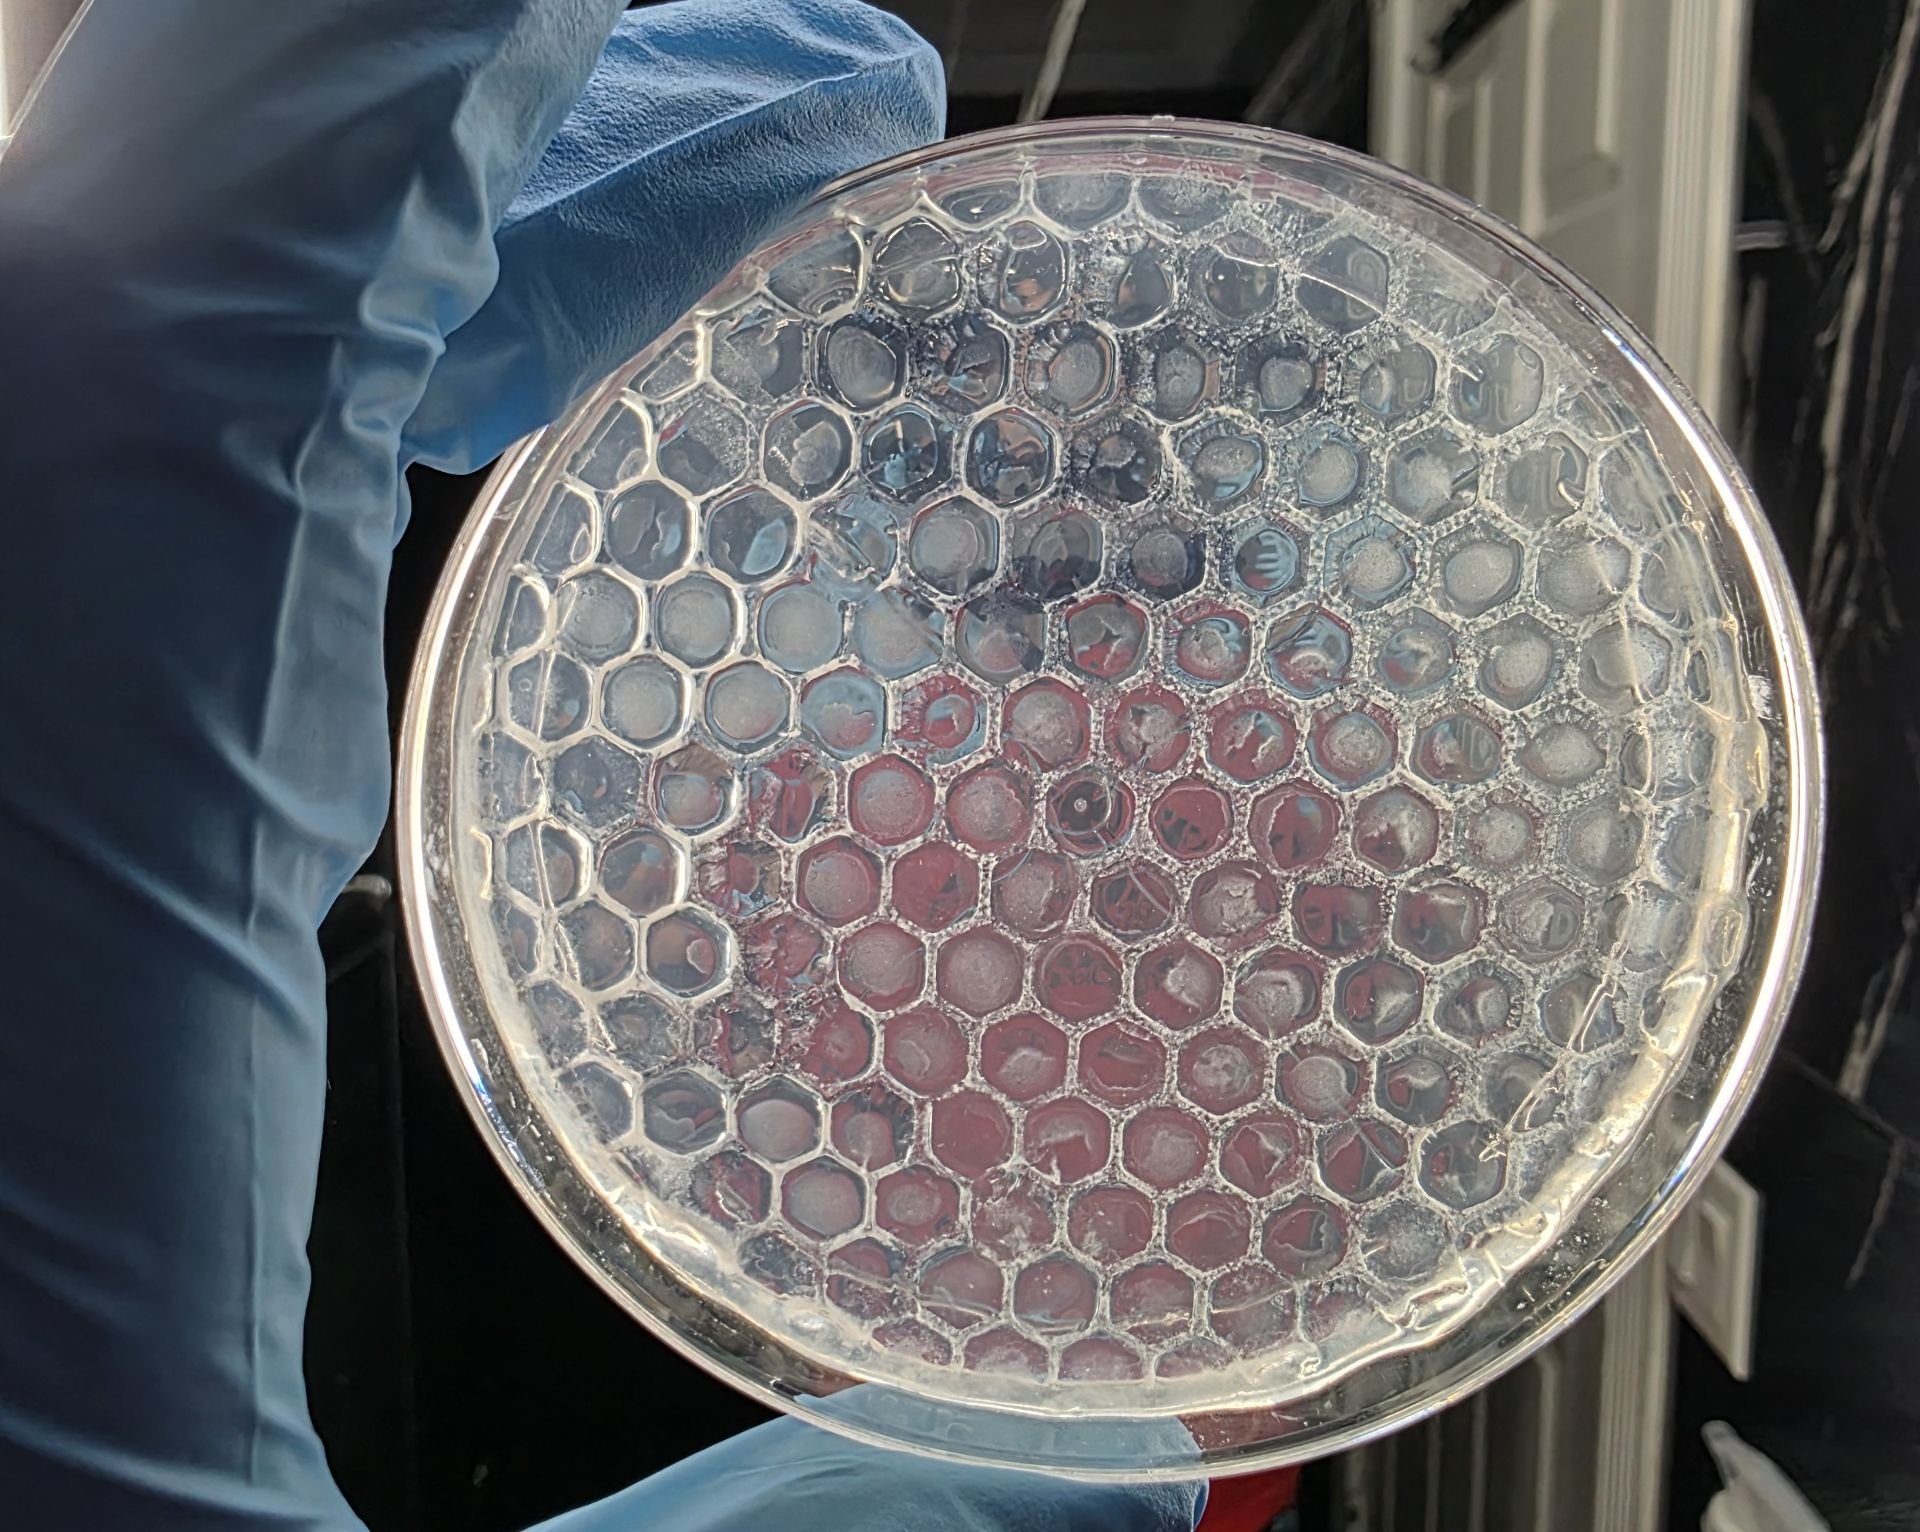
Using the micropipette, 300 µL of liquid culture was drawn up. The tip was carefully positioned at the entrance of each channel. The bacteria were slowly poured along the channel so the liquid would flow through the pathway. If the liquid did not spread evenly, the plate was gently swirled to help disperse it through the channel. Each dish received exactly 300 µL. Keeping the volume the same was very important to make sure every plate started with the same amount of bacteria.
 Step 6: Incubation After Inoculation
After inoculation, the plates were incubated at 30°C (ideally 37°C). They were placed upside down to prevent condensation from dripping into the channels.
Growth was checked at 12 hours, 24 hours, 48 hours, and 72 hours.
- At 12 hours, bacteria began attaching inside the channels.
- At 24 hours, growth spread further along the pathways.
- At 48 hours, visible bacterial colonies filled the channels.
- At 72 hours, clear bacterial lines were formed, and the colony matured.

Phase 4 — Electrical Evaluation
Phase 4 is where the experiment changes from biological growth to electrical testing. In the previous phases, the agar was prepared and inoculated with bacteria. By this point, the channels had visible bacterial growth. The purpose of Phase 4 was to test whether that growth could produce measurable electrical conductivity over time.
Materials Biological Materials
- Previously inoculated patterned agar dishes (7 media types × 3 geometries).
- Bacterial growth localized within channel structures.
Electrical Components
- Arduino Nano microcontroller.
- INA219 high-side current sensor module.
- Graphite rod electrodes (two per test).
- Connecting wires.
- USB power supply.
- Optional external test resistor (if required).
Equipment and Supplies
- Computer for serial data logging.
- Disinfectant wipes.
- Gloves.
- Structured data recording sheets.
Procedure
Step 1: Electrical System Setup
An Arduino Nano was used to measure electrical activity. It was connected to an INA219 current sensor module. This sensor was chosen because it can measure voltage, calculate current, and determine power all in one system.
 The Arduino was powered through USB and connected to a computer for data collection through the serial monitor.
The program uploaded to the Arduino allowed it to:
- Initialize the sensor.
- Measure bus voltage.
- Measure load voltage.
- Calculate current (mA).
- Calculate power (mW).
- Send all readings to the computer screen for recording.
Here is the code that was uploaded to the sensor:
#include <Wire.h>
#include <Adafruit_INA219.h>
Adafruit_INA219 ina219;
void setup(void)
{
Serial.begin(115200); w
hile (!Serial) {
delay(1);
}
// Initialize INA219
if (!ina219.begin()) {
Serial.println("Failed to find INA219 chip");
while (1) { delay(10); }
}
// OPTIONAL: uncomment ONE if you want higher precision
// ina219.setCalibration_32V_1A();ina219.setCalibration_16V_400mA();
// ---- Serial Plotter header ----
Serial.println("Bus_V(V)\tLoad_V(V)\tCurrent_mA\tPower_mW"); }
void loop(void)
{
float shuntvoltage;
float busvoltage;
float current_mA;
float loadvoltage;
float power_mW;
shuntvoltage = ina219.getShuntVoltage_mV();
busvoltage = ina219.getBusVoltage_V();
current_mA = ina219.getCurrent_mA();
power_mW = ina219.getPower_mW();
loadvoltage = busvoltage + (shuntvoltage / 1000.0);
// ---- Output for Serial Plotter (numbers only) ----
Serial.print(busvoltage);
Serial.print("\t");
Serial.print(loadvoltage);
Serial.print("\t");
Serial.print(current_mA);
Serial.print("\t");
Serial.println(power_mW);
delay(1500); // adjust for smoother/faster graph
}
Before testing any biological samples, the system was checked to make sure readings were stable and reasonable.
Challenges: At first, some readings fluctuated slightly due to loose wiring. All connections were tightened and rechecked before each session to ensure stable signals.
Step 2: Electrode Preparation and Placement
Graphite rods were used as electrodes because they are conductive and do not easily corrode in moist agar.
For each dish, two graphite rods were inserted into the gel along the patterned channel. The insertion points were kept symmetrical and consistent across all dishes. The distance between electrodes was kept the same (\~10 mm) to ensure fair comparison between plates.
The rods were inserted vertically into the gel at a consistent depth. Three different locations along each dish were tested to reduce the effect of variation.
 Step 3: Measurement at Points
Electrical testing was performed at:
- 12 hours after inoculation
- 24 hours
- 48 hours
- 72 hours
At each time point, plates were opened. If condensation was present, it was gently removed before testing to prevent interference.
The electrodes were inserted at specific positions. After insertion, the system was allowed to stabilize for about 5-10 seconds before recording data. This ensured the readings were not affected by immediate disturbances. For each dish, measurements were taken at three different channel locations. Each session lasted about 2-5 minutes per dish to allow careful and accurate recording.
Step 4: Data Collection
For every dish and each measurement site, the following were recorded:
- Bus Voltage (V)
- Load Voltage (V)
- Current (mA)
- Power (mW)
- Geometry type
- Media type
- Time after inoculation
All data were recorded manually during testing and then entered into digital EXCEL spreadsheets afterward. Each entry was double-checked immediately after measurement to prevent any errors.
Replication Structure
Each of the 21 patterned dishes went through the following: 4 time-point measurements 3 site measurements per time point This resulted in: 4 × 3 = 12 readings per dish Across all dishes: 21 × 12 = 252 total measurement events This level of accuracy and detail helped reduce random error and background noise.
Observations Over Time
- At 12 hours, most plates showed very little measurable current. This was expected because bacterial growth was still in early stages.
- At 24 and 48 hours, some media types began showing increased electrical response. This suggested that biofilm development may have improved conductive pathways.
- At 72 hours, certain media conditions (especially those containing graphite or FeCl₃) showed more stable and measurable readings compared to basic LB agar.
These trends were recorded carefully without changing the testing procedure.
 Safety and Handling
During testing:
Safety and Handling
During testing:
- Gloves were worn at all times.
- Electrodes were disinfected between dishes.
- The microcontroller and wiring were kept away from moisture.
Analysis
Raw Data
All raw data collected during this experiment can be accessed through the links provided below. The dataset includes every recorded measurement taken during Phase 4 testing. Specifically, it contains load voltage (V), measured current (mA), and calculated power (mW) values for each dish, at every time point (12, 24, 48, and 72 hours), and for all three measurement sites per plate.
Raw Data:
Data after 12 hours of innoculation: https://docs.google.com/spreadsheets/d/1foEqiZOEHapHxXZFfNt5qFmPv6ckWWmukzdmxxShPs/edit?usp=sharing
Data after 24 hours of innoculation: https://docs.google.com/spreadsheets/d/1dVe3suJCzO0ow2pOk7isDwmJEye3nLyEM37CPaLThSo/edit?usp=sharing
Data after 48 hours of innoculation: https://docs.google.com/spreadsheets/d/1sdxVxHLJJ_1Qy2I7MjTXN7XntDG30hqOOs-LlKFA0WU/edit?usp=sharing
Data after 72 hours of innoculation: https://docs.google.com/spreadsheets/d/1A_-dGNgCz7ZXY0kCrcmRjTITZ3TD0xtfIERWaLeThkg/edit?usp=sharing
Basic Data
The graphs below show the raw data collected from one of the experimental test groups. This group included LB agar, E. coli K12 bacteria, and liquid Iron (III) chloride (FeCl₃). Out of all the conditions tested, this combination produced the highest current readings and, as a result, the highest conductance values. All graphs were made in Google Colab (Python).


 The conductance (G) graph shows the electrical output at 12 hours and 72 hours for both the baseline group (Agar only) and the bacteria + FeCl₃ group. Across all three geometries (triangle, square, and hexagon) if bacteria was added it caused a substantial increase in conductance compared to the baseline. The differences in conductance (ΔG) between each pair are shown on top of the boxes in scientific notation so they are easy to read.
This graph helps us understand how bacterial growth affects electrical performance over time. At 12 hours, the bacteria are just starting to grow, so the increase in conductance is fairly small. Comparing the baseline to the bacteria + FeCl₃ group clearly shows that the bacteria, along with the metal ion addition, play a huge role in increasing conductivity. It also suggests that the shape of the channels the triangle, square, or hexagon affects how well the current flows throughout the biofilm.
 The conductivity (σ) graph shows how well the patterned biofilm conducts electricity, taking into account the geometries of the channels. This allows us to directly compare the performance of the material itself, instead of the raw current measurements. Even when errors like how far the electrodes were inserted are considered, the addition of bacteria always increased the conductivity (σ) across all geometries. This effect was seen at both 12 hours and 72 hours, showing that bacterial growth improves the electrical output of the biofilm over time.
Statistical Analysis
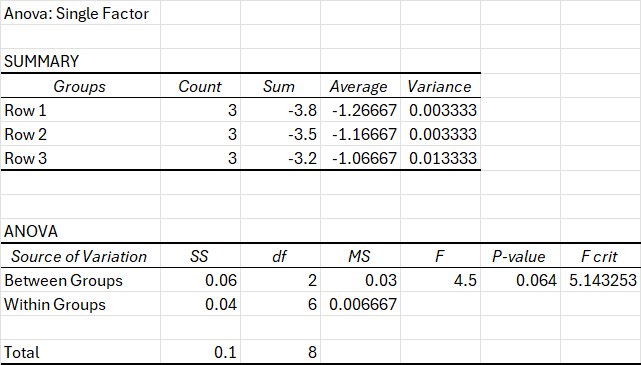 Null Hypothesis (H₀)
There is no significant difference in mean electrical output among the three geometries (Geometry 1, Geometry 2, and Geometry 3) under fixed media conditions (LB + Graphite + FeCl₃) at 72 hours.
Null Hypothesis (H₀)
There is no significant difference in mean electrical output among the three geometries (Geometry 1, Geometry 2, and Geometry 3) under fixed media conditions (LB + Graphite + FeCl₃) at 72 hours.
In statistical form: H₀: μ₁ = μ₂ = μ₃
Alternative Hypothesis (H₁) At least one geometry produces a mean electrical output that is significantly different from the others under the different media conditions at 72 hours.
In statistical form: H₁: At least one μ differs
A one-way ANOVA was conducted to determine whether geometry significantly affected electrical output under fixed media conditions (LB + Graphite + FeCl₃) at 72 hours. Three geometries were compared (n = 3 per group). The mean outputs were −1.27 for Geometry 1, −1.17 for Geometry 2, and −1.07 for Geometry 3. Although there was a clear increase in mean values across geometries, the analysis did not reach statistical significance at α = 0.05. The ANOVA shows F(2,6) = 4.50, p = 0.064, with Fcrit = 5.14. Because the calculated F-value did not exceed the critical F-value and the p-value was greater than 0.05, the null hypothesis cannot be rejected. Therefore, under these experimental conditions, geometry did not produce a statistically significant difference in electrical output at 72 hours. However, the relatively low p-value (0.064) could mean their is a strong value towards significance, implying that geometry may influence conductivity and that additional tests could prove this idea.
Spreadsheet used: https://docs.google.com/spreadsheets/d/1OYEnxaxaTvcA93x0RLP0wRxCGEAB3EIcuF5Nb_8PNdQ/edit?usp=sharing
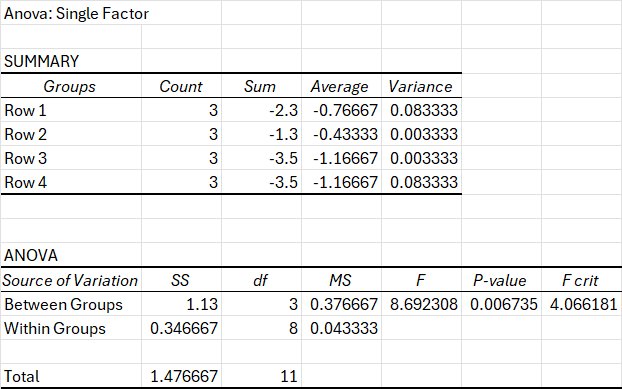 Null Hypothesis (H₀)
There is no significant difference in mean electrical current among the four media conditions (LB, LB + Graphite + bacteria, LB + FeCl₃ + bacteria, and LB + Graphite + FeCl₃ + bacteria) at 72 hours under square geometry.
Null Hypothesis (H₀)
There is no significant difference in mean electrical current among the four media conditions (LB, LB + Graphite + bacteria, LB + FeCl₃ + bacteria, and LB + Graphite + FeCl₃ + bacteria) at 72 hours under square geometry.
In statistical form: H₀: μ₁ = μ₂ = μ₃ = μ₄
Alternative Hypothesis (H₁) At least one media condition produces a mean electrical current that is significantly different from the others at 72 hours under square geometry.
In statistical form: H₁: At least one μ differs
A one-way ANOVA was conducted to determine whether media composition significantly affected electrical current under fixed geometry (Square) at 72 hours. Four bacterial media conditions were compared (n = 3 per group): LB + Bacteria, LB + Graphite + Bacteria, LB + FeCl₃ + Bacteria, and LB + Graphite + FeCl₃ + Bacteria. The mean current values were −0.77 for LB, −0.43 for LB + Graphite, −1.17 for LB + FeCl₃, and −1.17 for LB + Graphite + FeCl₃. The analysis shows a statistically significant effect of media on electrical current at α = 0.05, with F(3,8) = 8.69, p = 0.0067, and Fcrit = 4.07. Because the calculated F-value exceeded the critical F-value and the p-value was less than 0.05, the null hypothesis was rejected. Thus, under these experimental conditions, different media produced a statistically significant difference in electrical current at 72 hours. These ideas show that different media affect electrical output, aiding the hypothesis that environmental conditions (media types) greatly effect programmable electrical output in the system.
Spreadsheet used: https://docs.google.com/spreadsheets/d/1kwqrrnYZ1umMvKjvFyeYvW3Ci8es3-V0Lp8R9OL8mgI/edit?usp=sharing
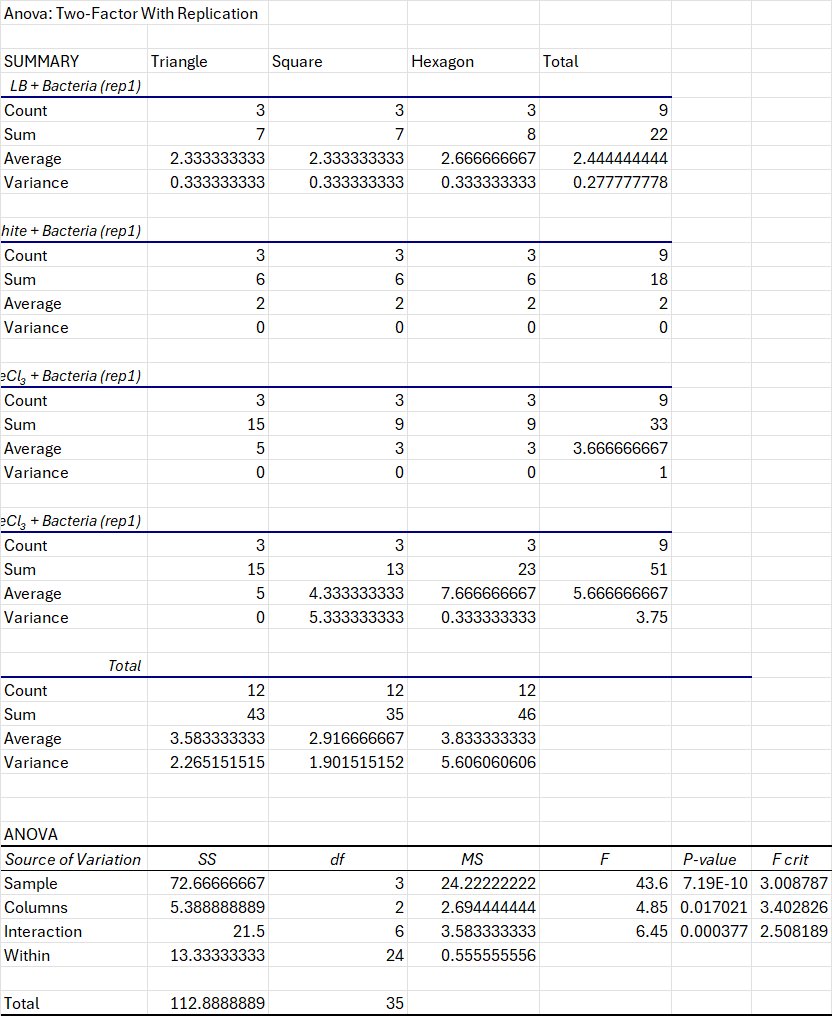 To understand how both geometry and media affect the electrical output of E. coli biofilms after 72 hours, a Two-Way ANOVA with replication was used. The two independent variables were geometry (Triangle, Square, Hexagon) and media composition (LB + Bacteria, LB + Graphite + Bacteria, LB + FeCl₃ + Bacteria, LB + Graphite + FeCl₃ + Bacteria). The dependent variables measured were power output and current, with three tests per group. The goal of this analysis was to answer three questions:
- Does the type of media affect electrical output?
- Does the geometry of the channels affect electrical output?
- Do media and geometry together interact to change electrical output in a way that could “program” the biofilm’s conductivity?
The null hypotheses for this analysis were:
- Media Main Effect (H₀₁): Electrical output does not differ between the four media types.
- Geometry Main Effect (H₀₂): Electrical output does not differ between the three geometries.
- Interaction Effect (H₀₃): There is no interaction between geometry and media; the effect of media is independent of geometry.
The Two-Way ANOVA results showed some apparent trends: Media Main Effect: F(3,24) = 43.60, p < 0.0001. This means that the type of media significantly affects electrical output. Media with different particles like graphite and FeCl₃ clearly improved conductivity. The average power outputs were:
- LB + Bacteria: 2.44 mW
- LB + Graphite + Bacteria: 2.00 mW
- LB + FeCl₃ + Bacteria: 3.67 mW
- LB + Graphite + FeCl₃ + Bacteria: 5.67 mW
This shows that combining conductive materials produces a great increase in electrical performance. Geometry Main Effect: F(2,24) = 4.85, p = 0.017. This shows that the shape of the channels also affects electrical output, even when the media is the same. Average outputs were:
- Triangle: 3.58 mW
- Square: 2.92 mW
- Hexagon: 3.83 mW
This could mean that the geometry of biofilm within the channels changes how effectively the electrical current flows. Essentially, the geometry “guides” the bacteria and curli fibers, affecting conductivity.
Interaction Effect (Geometry × Media): F(6,24) = 6.45, p < 0.001. This means that media and geometry don’t just work independently; they interact! For example:
- LB + FeCl₃ + Bacteria produced similar outputs in Triangle and Square (\~3–3.7 mW), but Hexagon gave slightly higher output.
- LB + Graphite + FeCl₃ + Bacteria showed much higher output in Hexagon (\~7.67 mW) compared to Triangle (\~5.0 mW) and Square (\~4.33 mW).
This shows that the media type and geometry work together to control conductivity.
Within-group Variation: The residual variance was low (0.556 mW²), meaning that measurements were consistent.
Overall, these results show that it is possible to “program” living circuits by carefully combining the media types with specific geometric patterns. Media type is the main factor controlling conductivity, but geometry helps increase this conductive effect.
Spreadsheet used: https://docs.google.com/spreadsheets/d/1biMs9MwXW1upAoZ0f5IOnF5ObTebaQZkDOmHUk7JLag/edit?usp=sharing
Multi-Scale Validation
The central hypothesis of this project is that spatially controlled curli fibre production allows for the formation of organized extracellular networks, therefore improving electron transport efficiency and effectiveness in Escherichia coli bacteria.
A three-system analysis approach will be used to move this study from observation to confirmation:
- Structural confirmation at the molecular level
- Nanoscale characterization
- Verification of electrochemical transport
These analyses will be conducted using Scanning Electron Microscopy (SEM), Fourier Transform Infrared Spectroscopy (FTIR), and Electrochemical Impedance Spectroscopy (EIS). These techniques allow for a direct connection between extracellular components, protein structure, and electron transport. Due to scheduling conflicts all the results obtained from the machines listed above are currently in progress but will be available during my CYSF presentation.
I. Structural Confirmation at the Molecular Level via Fourier Transform Infrared Spectroscopy (FTIR)
Theoretical Foundation
Curli fibres, as previously mentioned, are extracellular amyloid-like protein structures created by many intermolecular β-sheet stackings. The electrical and structural properties of these amyloid fibres are higly dependant on their structural organization. Therefore, confirming β-sheet exist are essential to proving that control produced the expected molecular structures and patterns.
By measuring the absorption of infrared radiation corresponding to bond-specific energy transitions, FTIR spectroscopy determines molecular vibrational modes. All wavelength information is collected at the same time using the interferometric method, and it is then turned into a frequency absorbance spectrum using Fourier transformation.
Vibrational Analysis
The Amide I band (1600–1700 cm⁻¹) will serve as the main region for analysis. This band is created mainly from C=O vibrations within the peptide backbone and is highly sensitive to structural arrangement. Expected markings include:
- β-sheet structures: \~1620–1640 cm⁻¹
- α-helix structures: \~1650–1660 cm⁻¹
Because amyloid fibres typically show strong intermolecular hydrogen bonding and β-sheet stacking, bacterial samples that have successful curli accumulation should show the following:
- Increased density in the 1620–1640 cm⁻¹ range
- Narrower bandwidth showing sameness in structure.
- Increased β-sheet/α-helix ratio
Spectral Processing
Raw spectra will undergo:
- Baseline correction
- Vector normalization
- Second derivative enhancement to resolve overlapping peaks
- Gaussian/Lorentzian peak fitting
I will statistically compare the groups to confirm if the spatial control significantly increases the number of β-sheet compared to controls. This will confirm that any observed structural changes or improved electrical output (current and power) exist due to curli proteins, not just random background noise.
II. Nanoscale Characterization via Scanning Electron Microscopy (SEM)
Why Structural Quantification Is Important
Electrical conductivity in biological systems depends not only on protein existance but also on network numbers, density, percolation pathways, and inter-fibre spacing. A system may demonstrate excess protein formation yet is unable to produce a continuous conductive pathway.
Therefore, high-resolution nanoscale imaging is required to determine whether spatial control produces the following:
- Increased fiber packing density
- Better network formation
Electron–Matter Interaction
SEM utilizes a focused beam of accelerated electrons that interacts with the specimen surface, producing emissions that can be detected, including secondary electrons and backscattered electrons.
Secondary electrons, created from the top nanometers of the surface, provide high-resolution image detected by the machine. Their emission probability is determined by geometry, media type, and conductivity values.
Because biological samples are usually non-conductive, sputter coating with a conductive metal layer is needed to prevent a charge increase that would distort imaging.
Preserving Structural Details
To preserve extracellular matrix components:
- Chemical fixation with glutaraldehyde will preserve proteins
- Ethanol dehydration will remove water without an osmotic shock on the surface of the sample.
This procedure will ensure that fibre placement and density show biological organization rather than prepared and distorted specimens.
Quantitative Analysis
SEM images will be analyzed using computers. The following qualities will be analyzed:
Fiber Density
Fibres per unit area will be measured using skeletonization.
Porosity
The ratio of non-fibre area to total area will be used to determine the fraction of non-fibre area.
Network Connectivity
Graph-theory modelling will determine percolation baseline values which will see whether conductive pathways are repeatable across the entire biofilm.
III. Electrochemical Transport Validation via Electrochemical Impendance Spectroscopy (EIS)
Theoretical Foundations
How easily electrons move through a bacterial biofilm to a surface depends on three things: how hard it is for them to jump the gap (charge resistance), how much energy is stored at that gap (double-layer capacitance), and how fast they can travel through the biofilm.
EIS allows for a separation of resistive and capacitive parts by applying a sinusoidal (having sine wave) disruption across multiple angular frequencies.
The response of the system is described by the following formula:
Z(ω) = Z' + Z''
Where: Z' = real (resistive) component Z'' = imaginary (capacitive/inductive) component
Three-Electrode Arrangement
The electrochemical cell will be composed of:
- Working electrode coated with the biofilm from each different media type and geometry.
- Ag/AgCl electrode used for reference
A small amount of AC voltage (5–10 mV) will be applied to avoid destroying the biofilm structure.
Equivalent Circuit Modeling
An equivalent circuit made up of the following components is used to model biofilm systems:
- Resistance of the solution (Rs)
- Resistance to charge transfer (Rct)
- Capacitance of two layers (Cdl)
Conclusion
This project demonstrates that it is possible to build programmable living electrical networks using E. coli K12 biofilms by combining different geometries and media types. Seven different media types were tested: LB + Bacteria, LB + Graphite + Bacteria, LB + FeCl₃ + Bacteria, LB + Graphite + FeCl₃ + Bacteria, LB, LB + Graphite, and LB + FeCl₃. The results clearly showed that the physical environment had a huge impact on electrical output. Different media combinations produced much higher conductivity than others. At the same time, the shapes of the channels (triangle, square, and hexagon) also greatly affected how well the biofilm and E. coli conducted electricity. The Two-Way ANOVA showed that both media and geometry had major effects. Thus, the combination of chemical materials (media type) and geometries worked together to increase electrical output. The Hexagon pattern plus the LB + Graphite + FeCl₃ + Bacteria produced the highest power and current values. Overall, the data shows that both the media type and the geometry design can be changed to control how much electricity the biofilm produces, which was the main goal of this project.
Along with this, measuring the system at 12, 24, 48, and 72 hours allowed to see how conductivity changed over time. Earlier, the electrical output (current) was lower because the biofilm was still forming. As time increased and the bacteria continued to grow and organize within the channels, the conductivity increased. Graphite and FeCl₃ helped improve conductive values, especially when different geometries were used. The statistical testing showed that these differences were not random but consistent. This project shows a new way of thinking about living materials. The results demonstrate that living biofilms can be designed to have specific conductance values.
Citations
[1] Tackling informality in e-waste management: The potential of cooperative enterprises. (2025, August 30). International Labour Organization. Retrieved November 24, 2025, from https://www.ilo.org/publications/tackling-informality-e-waste-management-potential-cooperative-enterprises
[2] E-Waste Monitor. (2024, December 12). The Global E-Waste Monitor 2024 - E-Waste Monitor. Retrieved November 24, 2025, from https://ewastemonitor.info/the-global-e-waste-monitor-2024/
[3] World Health Organization: WHO. (2024, October 1). Electronic waste (e-waste). Retrieved November 24, 2025, from https://www.who.int/news-room/fact-sheets/detail/electronic-waste-(e-waste
[4] Recycling, G. A. (2025, November 18). The Environmental Impact of Mining vs. Recycling Electronics - Global Ardour Recycling. My WordPress. Retrieved November 26, 2025, from https://globalardour.co.uk/the-environmental-impact-of-mining-vs-recycling-electronics/
[5] Sustainable Copper. (n.d.). International Copper Association. Retrieved November 26, 2025, from https://internationalcopper.org/sustainable-copper/
[6] Federal Metals Inc. (2022\, August 11). How does copper mining affect the environment? | Calgary. Federal Metals Inc. | Federal Metals Inc. Retrieved November 26\, 2025\, from https://federalmetals.ca/how-does-copper-mining-affect-the-environment/
[7] Recycling, G. A. (2025b, November 18). The Environmental Impact of Mining vs. Recycling Electronics - Global Ardour Recycling. My WordPress. Retrieved November 26, 2025, from https://globalardour.co.uk/the-environmental-impact-of-mining-vs-recycling-electronics/
[8] Potter, M. C., & Waller, A. D. (1911). Electrical effects accompanying the decomposition of organic compounds. Proceedings of the Royal Society of London Series B Containing Papers of a Biological Character, 84(571), 260–276. https://doi.org/10.1098/rspb.1911.0073
[9] Nobel Prize in Chemistry 2000. (n.d.). NobelPrize.org. Retrieved November 27, 2025, from https://www.nobelprize.org/prizes/chemistry/2000/popular-information/
[10] Nondestructive Evaluation Physics : Materials. (n.d.). Www.nde-Ed.org. Retrieved November 27, 2025, from https://www.nde-ed.org/Physics/Materials/Physical_Chemical/Electrical.xhtml
[11] Carbon, E. (2024, September 30). Graphite Electrical Conductivity –A Complete Guide. East Carbon. Retrieved November 27, 2025, from https://www.eastcarb.com/graphite-electrical-conductivity/?
[12] Malvankar, N. S., Vargas, M., Nevin, K. P., Franks, A. E., Leang, C., Kim, B., Inoue, K., Mester, T., Covalla, S. F., Johnson, J. P., Rotello, V. M., Tuominen, M. T., & Lovley, D. R. (2011). Tunable metallic-like conductivity in microbial nanowire networks. Nature Nanotechnology, 6(9), 573–579. https://doi.org/10.1038/nnano.2011.119
[13] Cesano, F., Uddin, M. J., Lozano, K., Zanetti, M., & Scarano, D. (2020). All-Carbon conductors for electronic and electrical wiring applications. Frontiers in Materials, 7. https://doi.org/10.3389/fmats.2020.00219
[14] Cell Envelope - an overview | ScienceDirect Topics. (n.d.). Www.sciencedirect.com. Retrieved November 28, 2025, from https://www.sciencedirect.com/topics/agricultural-and-biological-sciences/cell-envelope
[15] Libretexts. (2024, November 23). 3.5: lipid molecules - phospholipids. Biology LibreTexts. Retrieved November 28, 2025, from https://bio.libretexts.org/Bookshelves/Introductory_and_General_Biology/General_Biology_(Boundless)/03%3A_Biological_Macromolecules/3.05%3A_Lipid_Molecules_-_Phospholipids
[16] Toxopeus, J. (2024, April 10). 5.1 Membrane components and structure. Online Textbook for Biol 395. Retrieved November 29, 2025, from https://pressbooks.atlanticoer-relatlantique.ca/advcellbiol/chapter/5-1-membrane-components-and structure/#:~:text=The%20lipid%20bilayer%20is%20in,therefore%20they%20increase%20membrane%20fluidity.
[17] Rye\, C.\, Wise\, R.\, Jurukovski\, V.\, DeSaix\, J.\, Choi\, J.\, & Avissar\, Y. (2016\, October 21). 3.3 Lipids - Biology | OpenStax. Retrieved November 29\, 2025\, from https://openstax.org/books/biology/pages/3-3-lipids
[18] Khan Academy. (n.d.). Retrieved November 29, 2025, from https://www.khanacademy.org/science/biology/structure-of-a-cell/prokaryotic-and-eukaryotic-cells/a/plasma-membrane-and-cytoplasm
[19] Bennett, John E, et al. Mandell, Douglas, and Bennett’s Principles and Practice of Infectious Diseases. 8th ed., Philadelphia, Elsevier / Saunders, 2015.
[20] Salton, M. R., & Kim, K. (1996). Structure. Medical Microbiology - NCBI Bookshelf. Retrieved November 30, 2025, from https://www.ncbi.nlm.nih.gov/books/NBK8477/
[21] Tankeshwar, Acharya. “Differences between Gram Positive and Gram Negative Bacteria - Microbeonline.” Microbeonline, 28 Dec. 2018, microbeonline.com/general-and-differential-characteristics-of-gram-positive-and-gram-negative-bacteria/. Accessed 30 Nov. 2025.
[22] Salton, Milton R.J., and Kwang-Shin Kim. “Structure.” Nih.gov, University of Texas Medical Branch at Galveston, 1996, www.ncbi.nlm.nih.gov/books/NBK8477/. Accessed 30 Nov. 2025.
[23] “Bacteria Basics – Part 2.” ReAct, www.reactgroup.org/antibiotic-resistance/course-antibiotic-resistance-the-silent-tsunami/part-2/bacteria-basics/. Accessed 30 Nov. 2025.
[24] Le, N., Pinedo, V., Lopez, J., Cava, F., & Feldman, M. F. (2021). Killing of Gram-negative and Gram-positive bacteria by a bifunctional cell wall-targeting T6SS effector. Proceedings of the National Academy of Sciences, 118(40). https://doi.org/10.1073/pnas.2106555118
[25] Chen, J.-K., Shen, C.-R., & Liu, C.-L. (2010). N-Acetylglucosamine: Production and Applications. Marine Drugs, 8(9), 2493–2516. https://doi.org/10.3390/md8092493
[26] PubChem. (n.d.). N-acetylmuramic acid. PubChem. Retrieved December 2, 2025, from https://pubchem.ncbi.nlm.nih.gov/compound/82756
[27] Farhana, A., & Khan, Y. S. (2023, April 17). Biochemistry, lipopolysaccharide. StatPearls - NCBI Bookshelf. Retrieved December 4, 2025, from https://www.ncbi.nlm.nih.gov/books/NBK554414/
[28] Libretexts. (2023, August 31). 2.5C: Fimbriae and Pili. Biology LibreTexts. Retrieved December 11, 2025, from https://bio.libretexts.org/Bookshelves/Microbiology/Microbiology_(Kaiser)/Unit_1%3A_Introduction_to_Microbiology_and_Prokaryotic_Cell_Anatomy/2%3A_The_ProkaryoticCell_Bacteria/2.5%3A_Structures_Outside_the_Cell_Wall/2.5C%3A_Fimbriae_and_Pili
[29] Kreve, S., & Reis, A. C. D. (2021). Bacterial adhesion to biomaterials: What regulates this attachment? A review. Japanese Dental Science Review, 57, 85–96. https://doi.org/10.1016/j.jdsr.2021.05.003
[30] Barnhart, M. M., & Chapman, M. R. (2006). Curli biogenesis and Function. Annual Review of Microbiology, 60(1), 131–147. https://doi.org/10.1146/annurev.micro.60.080805.142106
[31] Karimi, A., Karig, D., Kumar, A., & Ardekani, A. M. (2014). Interplay of physical mechanisms and biofilm processes: review of microfluidic methods. Lab on a Chip, 15(1), 23–42. https://doi.org/10.1039/c4lc01095g
[32] Flemming, H., Van Hullebusch, E. D., Little, B. J., Neu, T. R., Nielsen, P. H., Seviour, T., Stoodley, P., Wingender, J., & Wuertz, S. (2024). Microbial extracellular polymeric substances in the environment, technology and medicine.
[33] Nature Reviews Microbiology, 23(2), 87–105. https://doi.org/10.1038/s41579-024-01098-y Figure - PMC. (n.d.). Retrieved December 14, 2025, from https://pmc.ncbi.nlm.nih.gov/articles/PMC4657554/figure/F1/
[34] Xu, R.-Z., Cao, J.-S., Feng, G., Luo, J.-Y., Wu, Y., Ni, B.-J., & Fang, F. (2021). Modeling molecular structure and behavior of microbial extracellular polymeric substances through interacting-particle reaction dynamics. Chemical Engineering Journal Advances, 8, 100154–100154. https://doi.org/10.1016/j.ceja.2021.100154
[35] Stages of biofilm formation | QualiTru. (n.d.). QualiTru Sampling Systems. Retrieved December 15\, 2025\, from https://qualitru.com/five-main-phases-of-biofilm-development/
[36] Hernández\, A. (2024). Biofilms: What Are They\, Formation\, Removal\, and More | Osmosis. Osmosis. https://www.osmosis.org/answers/biofilm
[37] Journals, I. R. (2025b, July 11). Biofilm Formation Mechanisms, Stages, and Implications in Health and Disease - Innovative Research Journals. Innovative Research Journals. Retrieved December 22, 2025, from https://blog.irjpl.org/biofilm-formation-mechanisms-stages-and-implications-in-health-and-disease/
[38] Hobley, L., Harkins, C., MacPhee, C. E., & Stanley-Wall, N. R. (2015). Giving structure to the biofilm matrix: an overview of individual strategies and emerging common themes. FEMS Microbiology Reviews, 39(5), 649–669. https://doi.org/10.1093/femsre/fuv015
[39] Adcox, H. E., Vasicek, E. M., Dwivedi, V., Hoang, K. V., Turner, J., & Gunn, J. S. (2016). Salmonella extracellular matrix components influence biofilm formation and gallbladder colonization. Infection and Immunity, 84(11), 3243–3251. https://doi.org/10.1128/iai.00532-16
[40] Gray, H. B., & Winkler, J. R. (2003). Electron tunneling through proteins. Quarterly Reviews of Biophysics, 36(3), 341–372. https://doi.org/10.1017/s0033583503003913
[41] Cahen, D., Pecht, I., & Sheves, M. (2021). What Can We Learn from Protein-Based Electron Transport Junctions? The Journal of Physical Chemistry Letters, 12(47), 11598–11603. https://doi.org/10.1021/acs.jpclett.1c02446
[42] Beratan, D. N. (2019). Why are DNA and protein electron transfer so different? Annual Review of Physical Chemistry, 70(1), 71–97. https://doi.org/10.1146/annurev-physchem-042018-052353
[43] Figure 6: Distance dependence of the energy transfer rate for different. . . (n.d.). ResearchGate. https://www.researchgate.net/figure/Distance-dependence-of-the-energy-transfer-rate-for-different-initial-population_fig1_349025573
[44] Kang, Y. K., Iovine, P. M., & Therien, M. J. (2011). Electron transfer reactions of rigid, cofacially compressed, π-stacked porphyrin–bridge–quinone systems. Coordination Chemistry Reviews, 255(7–8), 804–824. https://doi.org/10.1016/j.ccr.2010.12.011 [45] On the Mechanism of Photoinduced Electron Transfer in Bridged Donor/Acceptor Systems: Ferrocenophane/Nileblue and Rhodamine6G Endcapping the DNA Duplex Till von Feilitzsch. (n.d.). Retrieved December 25, 2025, from https://mediatum.ub.tum.de/doc/601346/601346.pdf
[46] Gray, H. B., & Winkler, J. R. (2009). Electron flow through proteins. Chemical Physics Letters, 483(1–3), 1–9. https://doi.org/10.1016/j.cplett.2009.10.051
[47] Giese, B., Graber, M., & Cordes, M. (2008). Electron transfer in peptides and proteins. Current Opinion in Chemical Biology, 12(6), 755–759. https://doi.org/10.1016/j.cbpa.2008.08.026
[48] Gray, H. B., & Winkler, J. R. (2021). Functional and protective hole hopping in metalloenzymes. Chemical Science, 12(42), 13988–14003. https://doi.org/10.1039/d1sc04286f
[49] Hu, Y., Wang, Y., Han, X., Shan, Y., Li, F., & Shi, L. (2021). Biofilm Biology and Engineering of Geobacter and Shewanella spp. for Energy Applications. Frontiers in Bioengineering and Biotechnology, 9. https://doi.org/10.3389/fbioe.2021.786416
[50] Reguera, G. (2018). Microbial nanowires and electroactive biofilms. FEMS Microbiology Ecology, 94(7). https://doi.org/10.1093/femsec/fiy086
[51] Garbini, G. L., Caracciolo, A. B., & Grenni, P. (2023). Electroactive bacteria in natural ecosystems and their applications in microbial fuel cells for bioremediation: a review. Microorganisms, 11(5), 1255. https://doi.org/10.3390/microorganisms11051255
[52] Wang, F., Gu, Y., O’Brien, J. P., Yi, S. M., Yalcin, S. E., Srikanth, V., Shen, C., Vu, D., Ing, N. L., Hochbaum, A. I., Egelman, E. H., & Malvankar, N. S. (2019). Structure of Microbial Nanowires Reveals Stacked Hemes that Transport Electrons over Micrometers. Cell, 177(2), 361-369.e10. https://doi.org/10.1016/j.cell.2019.03.029
[53] Reardon, P. N., & Mueller, K. T. (2013). Structure of the Type IVa Major Pilin from the Electrically Conductive Bacterial Nanowires of Geobacter sulfurreducens. Journal of Biological Chemistry, 288(41), 29260–29266. https://doi.org/10.1074/jbc.m113.498527
[54] Frankel, R. B. (2003). Biologically induced mineralization by bacteria. Reviews in Mineralogy and Geochemistry, 54(1), 95–114. https://doi.org/10.2113/0540095
[55] Taylor & Francis. (n.d.). Biomineralization - Knowledge and references | Taylor & Francis. https://taylorandfrancis.com/knowledge/Engineering_and_technology/Chemical_engineering/Biomineralization/
[56] Abdullah, S. M., Kolo, K., Konhauser, K. O., & Pirouei, M. (2022). Microbial domains and their role in the formation of minerals. In Microbiology monographs (pp. 1–39). https://doi.org/10.1007/978-3-030-80807-5_1
[57] Nudelman, H., Lee, Y., Hung, Y., Kolusheva, S., Upcher, A., Chen, Y., Chen, J., Sue, S., & Zarivach, R. (2018). Understanding the biomineralization role of Magnetite-Interacting Components (MICs) from magnetotactic Bacteria. Frontiers in Microbiology, 9, 2480. https://doi.org/10.3389/fmicb.2018.02480
[58] Bazylinski, D., & Frankel, R. B. (2000). Biologically-Controlled mineralization of magnetic iron minerals by magnetotactic bacteria. ResearchGate. https://www.researchgate.net/publication/47801294_Biologically-Controlled_Mineralization_of_Magnetic_Iron_Minerals_by_Magnetotactic_Bacteria
[59] Silme, R. S., & Baysal, Ö. (2021). Bacterial volatile organic compounds and gene-induced host-defense pathways. In Elsevier eBooks (pp. 23–33). https://doi.org/10.1016/b978-0-12-824523-1.00002-x
[60] Skinner, H. C. W. (2005). Biominerals. Mineralogical Magazine, 69(5), 621–641. https://doi.org/10.1180/0026461056950275
[61] Chen, Y., Feng, Y., Deveaux, J. G., Masoud, M. A., Chandra, F. S., Chen, H., Zhang, D., & Feng, L. (2019). Biomineralization forming process and bio-inspired nanomaterials for biomedical application: A review. Minerals, 9(2), 68. https://doi.org/10.3390/min9020068
[62] Gahlawat, G., & Choudhury, A. R. (2019). A review on the biosynthesis of metal and metal salt nanoparticles by microbes. RSC Advances, 9(23), 12944–12967. https://doi.org/10.1039/c8ra10483b
[63] Lloyd, J. R. (2003). Microbial reduction of metals and radionuclides. FEMS Microbiology Reviews, 27(2–3), 411–425. https://doi.org/10.1016/s0168-6445(03)00044-5
[64] Kracke, F., Vassilev, I., & KröMer, J. O. (2015). Microbial electron transport and energy conservation – the foundation for optimizing bioelectrochemical systems. Frontiers in Microbiology, 6, 575. https://doi.org/10.3389/fmicb.2015.00575
[65] Campaña, A. L., Saragliadis, A., Mikheenko, P., & Linke, D. (2023). Insights into the bacterial synthesis of metal nanoparticles. Frontiers in Nanotechnology, 5. https://doi.org/10.3389/fnano.2023.1216921
[66] Liebensteiner, M. G., Tsesmetzis, N., Stams, A. J. M., & Lomans, B. P. (2014). Microbial redox processes in deep subsurface environments and the potential application of (per)chlorate in oil reservoirs. Frontiers in Microbiology, 5, 428. https://doi.org/10.3389/fmicb.2014.00428
[67] Standard Reduction Potential Table. (n.d.). https://chemprof.tripod.com/redtable.htm
[68] Moni, P., Wilhelm, M., & Rezwan, K. (2017). The influence of carbon nanotubes and graphene oxide sheets on the morphology, porosity, surface characteristics and thermal and electrical properties of polysiloxane derived ceramics. RSC Advances, 7(60), 37559–37567. https://doi.org/10.1039/c7ra01937h
[69] Graphene vs Graphite. (n.d.). Ossila. https://www.ossila.com/pages/graphene-vs-graphite
[70] Bhattacharya, M. (2016). Polymer Nanocomposites—A Comparison between Carbon Nanotubes, Graphene, and Clay as Nanofillers. Materials, 9(4), 262. https://doi.org/10.3390/ma9040262
[71] Wikipedia contributors. (2025, November 20). Graphene. Sigma and Pi Bonds - Graphene - Wikipedia. https://en.wikipedia.org/wiki/Graphene#/media/File:Graphene_-_sigma_and_pi_bonds.svg
[72] Zhu, J., & Marchant, R. E. (2011). Design properties of hydrogel tissue-engineering scaffolds. Expert Review of Medical Devices, 8(5), 607–626. https://doi.org/10.1586/erd.11.27
[73] El-Sherbiny, I. M., & Yacoub, M. H. (2013). Hydrogel scaffolds for tissue engineering: Progress and challenges. Global Cardiology Science and Practice, 2013(3), 38. https://doi.org/10.5339/gcsp.2013.38
[74] Zhao, L., Zhou, Y., Zhang, J., Liang, H., Chen, X., & Tan, H. (2023). Natural Polymer-Based Hydrogels: From polymer to biomedical applications. Pharmaceutics, 15(10), 2514. https://doi.org/10.3390/pharmaceutics15102514
[75] Ho, T., Chang, C., Chan, H., Chung, T., Shu, C., Chuang, K., Duh, T., Yang, M., & Tyan, Y. (2022). Hydrogels: Properties and applications in biomedicine. Molecules, 27(9), 2902. https://doi.org/10.3390/molecules27092902
[76] Ding, Y., Yu, L., & Mao, Z. (2024). Adhesion mechanisms and design strategies for bioadhesives. Colloids and Interface Science Communications, 63, 100809. https://doi.org/10.1016/j.colcom.2024.100809
[77] Bovone, G., Dudaryeva, O. Y., Marco-Dufort, B., & Tibbitt, M. W. (2021). Engineering Hydrogel Adhesion for Biomedical Applications via Chemical Design of the Junction. ACS Biomaterials Science & Engineering, 7(9), 4048–4076. https://doi.org/10.1021/acsbiomaterials.0c01677
[78] Hoare, T. R., & Kohane, D. S. (2008). Hydrogels in drug delivery: Progress and challenges. Polymer, 49(8), 1993–2007. https://doi.org/10.1016/j.polymer.2008.01.027
[79] Holloway, J. L., Lowman, A. M., VanLandingham, M. R., & Palmese, G. R. (2014). Interfacial optimization of fiber-reinforced hydrogel composites for soft fibrous tissue applications. Acta Biomaterialia, 10(8), 3581–3589. https://doi.org/10.1016/j.actbio.2014.05.004
[80] Wikipedia contributors. (2025, December 17). Electrical resistivity and conductivity. Wikipedia. https://en.wikipedia.org/wiki/Electrical_resistivity_and_conductivity?utm_source=chatgpt.com
[81] Libretexts. (2025, July 16). 9.4: Resistivity and Resistance. Physics LibreTexts. https://phys.libretexts.org/Bookshelves/University_Physics/University_Physics_(OpenStax)/University_Physics_II_-Thermodynamics_Electricity_and_Magnetism(OpenStax)/09%3A_Current_and_Resistance/9.04%3A_Resistivity_and_Resistance
[82] Conductor resistance - Energy Education. (n.d.). https://energyeducation.ca/encyclopedia/Conductor_resistance
[83] Resistance and resistivity | Physics. (n.d.). https://courses.lumenlearning.com/suny-physics/chapter/20-3-resistance-and-resistivity/
[84] Amdursky, N., Marchak, D., Sepunaru, L., Pecht, I., Sheves, M., & Cahen, D. (2014). Electronic transport via proteins. Advanced Materials, 26(42), 7142–7161. https://doi.org/10.1002/adma.201402304
[85] Safavi-Mirmahalleh, S., Yazdi, M. K., Saeb, M. R., & Salami-Kalajahi, M. (2025). Conductive hydrogels: bioelectronics and environmental applications. Current Opinion in Solid State and Materials Science, 34, 101213. https://doi.org/10.1016/j.cossms.2024.101213
[86] Tuttle, A. R., Trahan, N. D., & Son, M. S. (2021). Growth and Maintenance of Escherichia coli Laboratory Strains. Current Protocols, 1(1), e20. https://doi.org/10.1002/cpz1.20
Acknowledgement
This project would not exist without the support of several very important people who guided and helped me every step of the way.
First, I would like to thank my sister, who supported me through every stage of this project. She helped in countless ways, from patiently testing parts of the experiment to helping build the final project board. Her time and dedication meant so much to me.
I would also like to thank my parents. Their constant encouragement and guidance pushed me through the most challenging moments. They supported me in every way possible and always believed in me, even when things didn’t go as planned.
Next, I would like to thank my aunt for her significant contributions. She helped me connect with potential mentors and provided access to important facilities that made parts of this project possible.
I would like to sincerely thank the Chemistry Department at the University of Calgary for allowing me to use their FTIR Spectroscopy machine for analysis. Their generosity gave me access to advanced tools that aided my research.
I am also grateful to the Dean of Science at Mount Royal University for providing access to additional advanced equipment that supported my experimental work.
Lastly, I would like to thank my friends for their encouragement and support throughout this entire journey. Their motivation helped me stay focused and confident.