The Micro-Guard Microplastic Collector
Grade 8
Presentation
Problem
Abstract
Approximately 51 trillion plastic particles, mostly microplastics, are present in the ocean at this time. Plastics with a diameter of less than 5 mm are known as microplastics. In addition to harming humans physically and endangering organisms when consumed, these plastics can release harmful chemicals into the environment. Plastic is being produced at an accelerating rate, which means that millions of metric tons of plastic will eventually find their way into freshwater systems and the ocean, posing a severe and accumulating risk to living organisms.
In response to this urgent threat, I created the Microguard Microplastic Collector, an innovative, affordable, autonomous, and do-it-yourself (DIY) underwater robot designed specifically to detect and filter microplastics in water bodies in real time. I wanted to create a solution to stop the problem at its root, where microplastics start accumulating in bodies of water located in urban areas. My objective in creating the Microguard Microplastic Collector was to develop an enhanced solution to the problem by creating a robot that is autonomous, efficient at detecting and filtering microplastics, and can be built under $500 per unit. My final robot used UV light and a light intensity sensor module to detect the microplastics, a custom 3D printed filter to filter the microplastics, and a TF-Luna Lidar distance sensor for autonomous control. I used the Arduino coding language (c++) to code my robot parts.
In the end, my robot completed all of my objectives and even exceeded them. The final robot cost was $484 CAD, and my robot can detect and filter all 6 types of plastic (Low-Density Polyethylene, Polyethylene, High-Density Polyethylene, Polypropylene, Polyvinyl Chloride, Polyethylene Terephthalate, and Polystyrene) in real-time. My robot is also fully autonomous, making it suitable for non-human environments.
Introduction
Microplastics and their Effects
Since they are inexpensive, easy to make, have stable chemical properties, and are water resistant, plastics are used widely throughout the world, and their production has been rising each and every year. Plastics that are frequently used include nylon, polypropylene, polystyrene, and polyurethane. The physical, chemical, and biological effects of the environment cause these plastics to break down gradually. Plastics are easily broken apart by environmental forces, but it may take more than a century for these plastics to decompose entirely. Due mainly to plastics' low cost and broad range of applications, the world plastics industry has grown quickly since the 1950s, with annual global plastic production increasing by 4%. Ten percent or so of the waste plastics eventually find their way into the ocean through different channels, which account for about 60% to 80% of marine waste, and they are even as high as 90% to 95% in some areas.
Furthermore, there is a significant increase in the quantity of plastics dumped into the ocean as a result of both the growing global population and the rising demand for plastic products. Microplastics are causing widespread and largely unnoticed harm to humans and the environment. Since their introduction as a commodity resource in the middle of the 20th century, plastics have seen an exponential rise in use. Just a small percentage of the world's plastic waste—more than 6.3 billion metric tons—is being disposed of responsibly. Merely 9% of the total plastic waste has been recycled, while the remaining 12% has been burned. Most of the remaining 79% have entered aquatic environments.
Our oceans currently contain up to 51 trillion microplastic particles, the majority of which come from fishing gear, single-use plastics, and plastic packaging. As single-use plastics and plastic packaging have grown in popularity, microplastics have become more prevalent. Oceanic animals frequently eat plastics when they mistake them for prey or other food. Plastics can have detrimental effects on all organisms in the food chain once they enter the body of a single organism. A phenomenon called biological magnification means that a predator will ingest more plastic than it will its prey.
It's becoming more likely that seafood polluted with plastic will end up on the dinner table as plastic pollution makes its way up the marine food chain. An individual with a high shellfish diet may ingest up to 11,000 microplastic particles annually on average. Even so, people who live in nations with lower average seafood consumption still swallow roughly 1,800 microplastics annually. It is estimated that at least 50,000 microplastic particles are consumed by humans globally through food and water. Plastic pollution has negatively impacted more than 400 animal species, either by entanglement or ingestion. Fish, turtles, zooplankton, shellfish, seabirds, and mammals have all been shown to be affected by them.
What is a microplastic, and where do they come from?
Plastic particles smaller than five millimetres are referred to as microplastics. There are two types of these particles: primary and secondary. Primary microplastics are produced plastic particles that are initially smaller than 5 mm; they are typically utilized in abrasives, manufacturing plastic powders, and personal hygiene items like microbeads. Typically, primary microplastics are pellets or microbeads. Secondary microplastics are particles that come from plastics disintegrating in the waste stream due to exposure to the environment, breaking down from use, and breaking down into smaller pieces from larger plastic particles. Typically, secondary microplastics are found as fragments or as synthetic textile fibres. Due to the widespread usage of plastics across all fields, microplastics can be discovered in sediment from rivers and the ocean as well as in lakes, rivers, and the ocean itself. Microplastics have entered the food chain through these routes and have since been detected in a variety of forms that humans may consume, such as drinking water, aerosolized dust particles, fish, and other marine mammals. Littering, sewage, and unlawful dumping all contribute to the large amount of plastic waste that ends up in the rivers and oceans. Every piece of plastic that enters the ecosystem, regardless of source, eventually breaks down into microplastics. Exposure to natural elements like the sun can cause plastic pollution, degrading the material. Also, microplastics will weather and erode over long distances affecting many places, even remote areas like the Arctic. In essence, the degradation and small size of these plastics are what cause them to spread and pose risks to biological life.
Current research against this problem
- Lab-Based Methods - Spectroscopy
a. Raman Spectroscopy
- Raman spectroscopy is a scientific technique that uses laser light to analyze the molecules in a sample. When it comes to identifying microplastics, it can distinguish between different types of plastics, such as polyethylene or polypropylene, based on their distinct molecular patterns. This capability provides researchers with valuable information about the composition of microplastics in environmental samples.
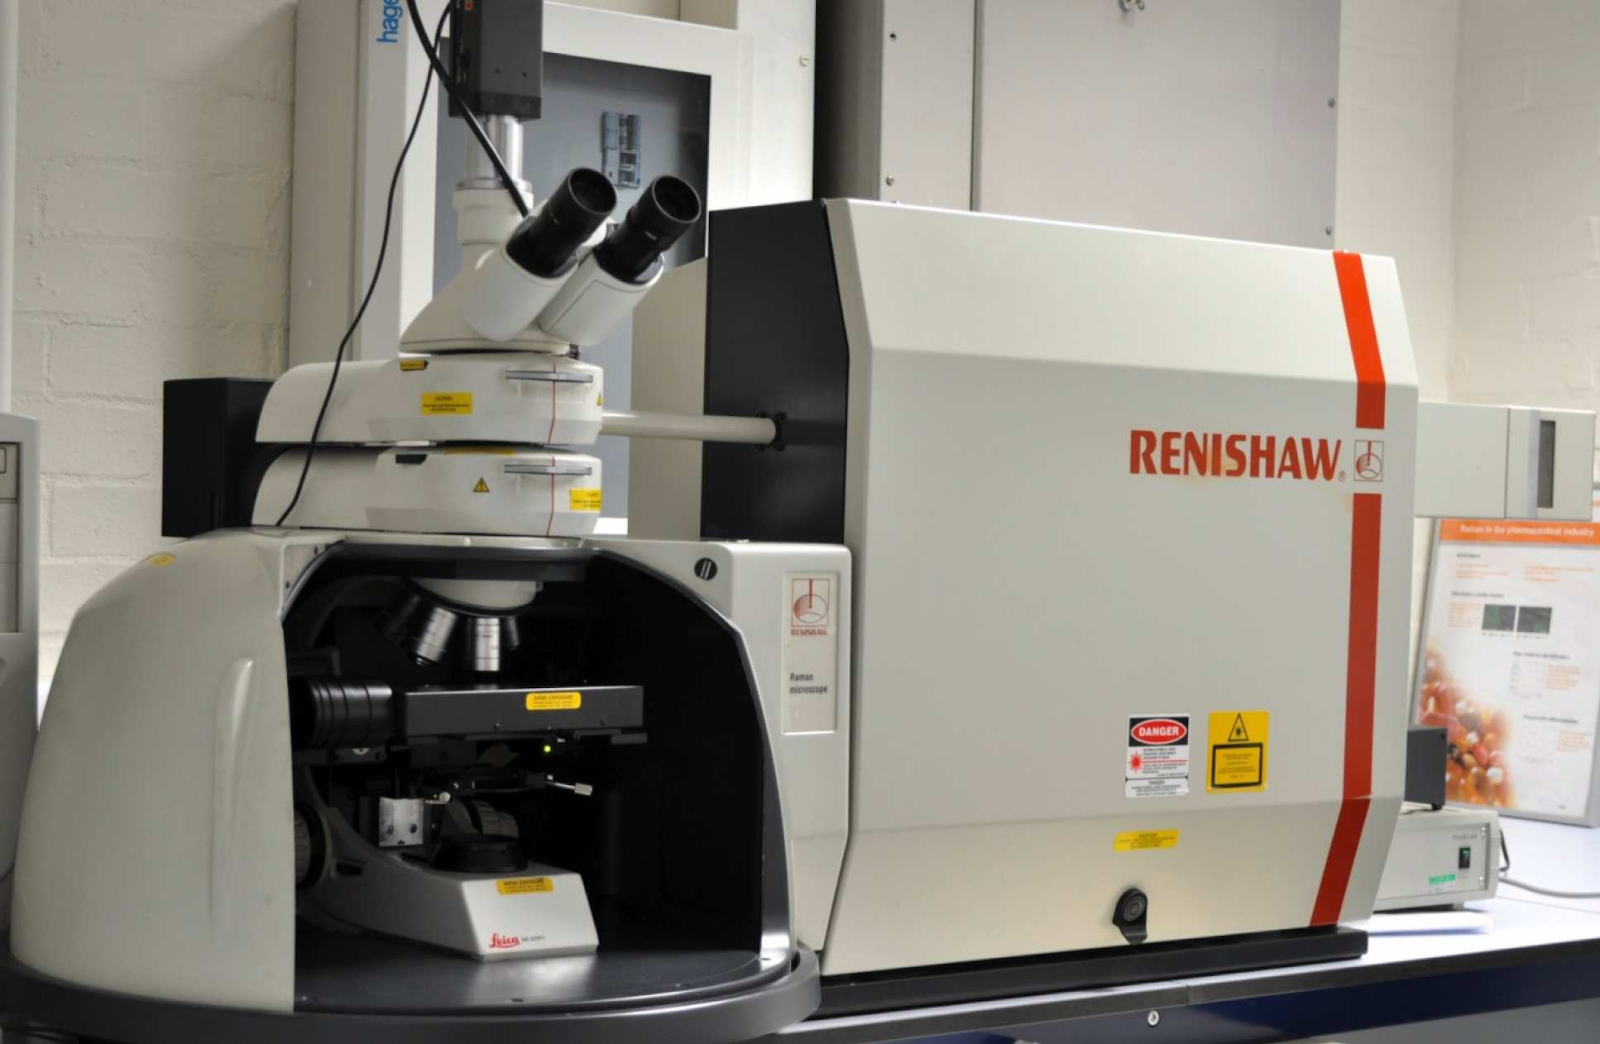
Figure 1: Raman Spectroscopy machine setup demonstrating a non-portable nature. The large size and complex structure make it impractical for mobile applications. Source: Imperial College of London.
- Infrared Spectroscopy
- Fourier-transform infrared spectroscopy (FTIR) is a sophisticated method used to analyze the vibrations of molecules in a sample. In this technique, the sample is exposed to infrared radiation emitted by a light source, leading the molecules to absorb specific wavelengths based on their vibrational modes. Within an FTIR system, an interferometer divides the infrared light into two beams—one traverses the sample, and the other goes through a reference material. Upon recombining, these beams generate an interference pattern, transformed into an infrared spectrum through Fourier transformation. This resulting spectrum displays absorption peaks that correspond to the chemical bonds and molecular structures present in the sample.
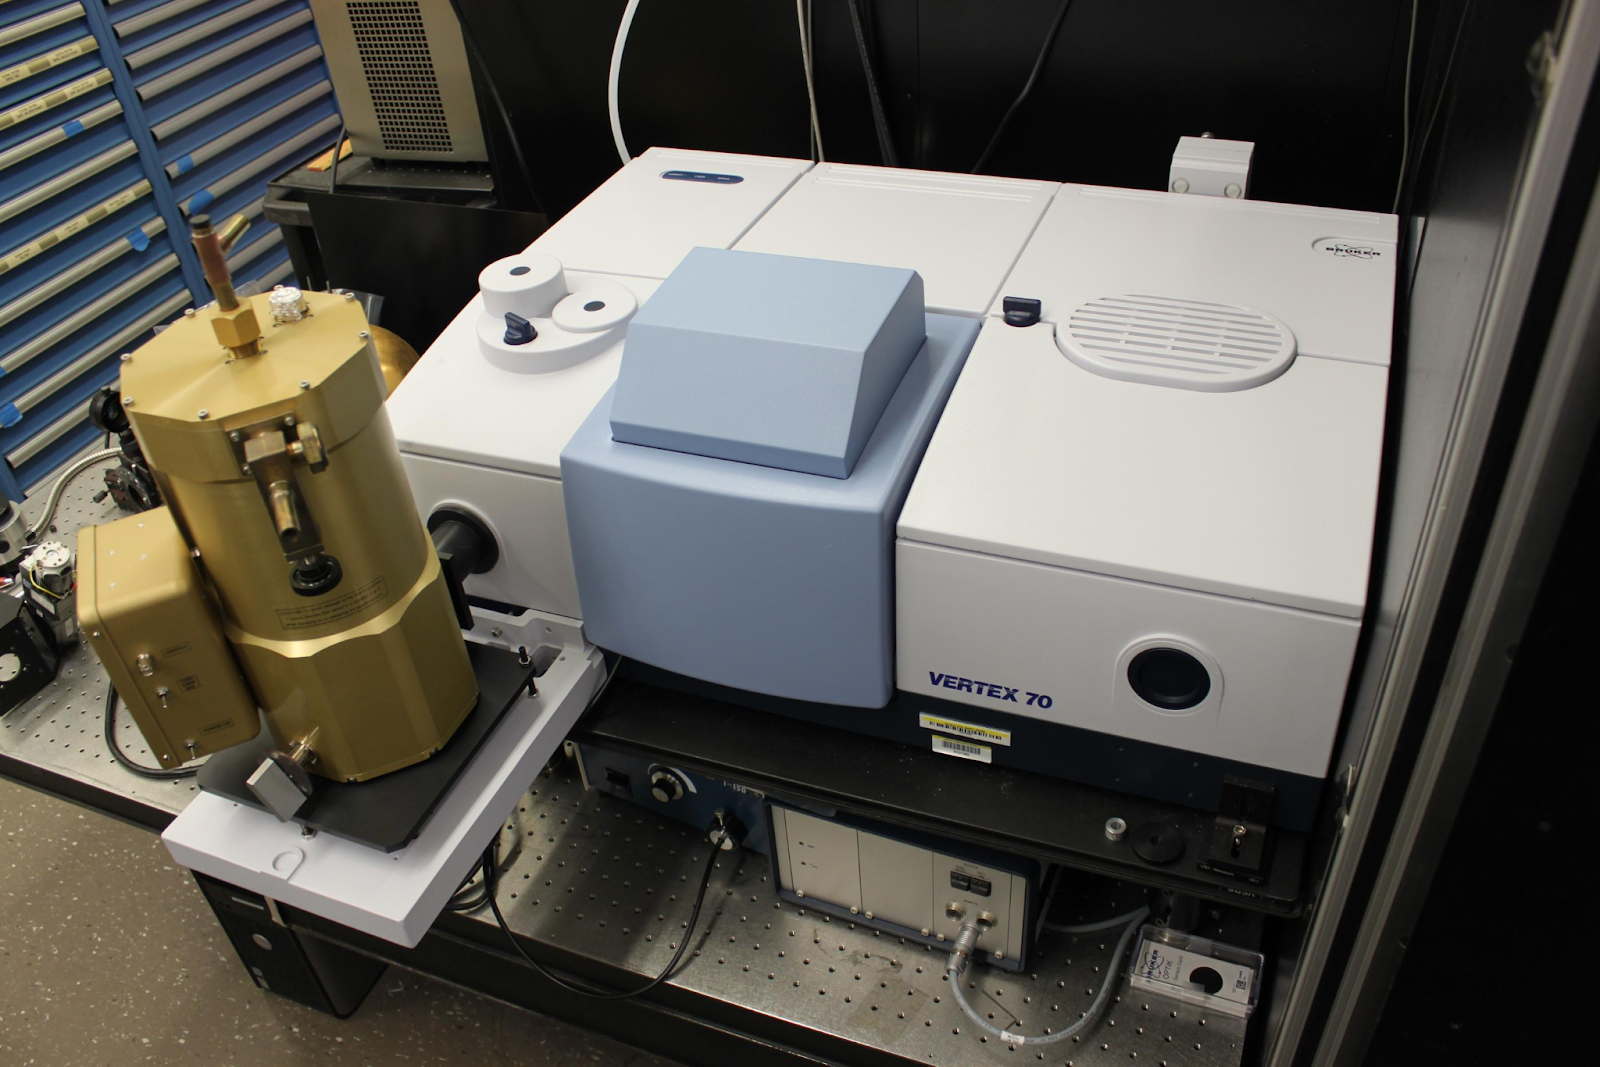
Figure 2: Infrared Spectroscopy machine, characterized by its substantial size and fixed configuration, indicating its lack of portability. Source: National Institute of Standards and Technology.
While both spectroscopy methods are great, and they can efficiently determine differences between plastic, they do have some drawbacks that don't align with the objectives of my project. Firstly, spectroscopy methods are lab-based and are extremely expensive (costs over $50,000), with the need for specialized equipment and trained personnel. This makes it less accessible to researchers or organizations with limited resources, just like me. Additionally, the process of spectroscopy requires somebody to collect samples in advance and transport them to a laboratory for analysis under these instruments which can introduce delays and sample contamination. Moreover, this process is ineffective at actually collecting the microplastics as you have to know where the microplastics are. This pre-collection step adds logistical complexity and may not provide real-time insights into the extent of microplastic pollution in a given environment. The combination of high costs and the need for pre-collection can limit the scalability and practicality of using spectroscopy for large-scale monitoring efforts.
2. Filtering and Cleanups
Another approach to cleaning up microplastics, which I include in my design, is simple filtering. Although this method works well, it has a big drawback: a filter by itself can't tell microplastics apart from other materials like organic matter. And since it is open to anything, when undesired objects, such as organic materials and non-plastic debris, can become stuck in the filters, this becomes a serious problem. The only way to solve the problem is to routinely clean the filters, which presents additional maintenance difficulties. Furthermore, while praiseworthy, depending only on volunteer human cleanups is ineffective and time-consuming. For example, prior efforts to address plastic pollution in Calgary rivers, such as the Bow River microplastic cleanup in 2016, required significant effort over several months from numerous individuals and organizations, in addition to a substantial $50,000 cleanup fee. And all of that work to not even fully finish the project!
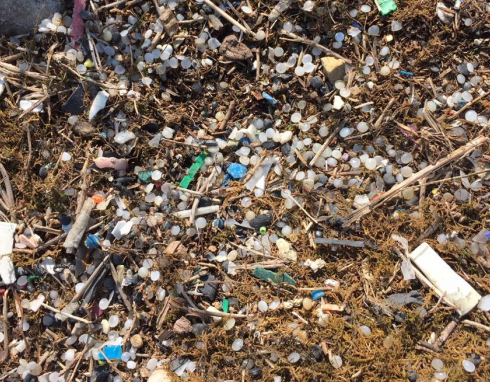
Figure 3: Plastic Pellets at the Chestermere Lake from 2018, illustrating the pervasive contamination of aquatic ecosystems. Source: City of Calgary Water Resources
Figure 4: Volunteer conducting 2016’s Bow River Plastic Cleanup, removing plastic waste from the banks of the Bow River. Source: City of Calgary Water Resources
3. Government Bans
Many world leaders have also proposed bans on single-use plastics in their countries. However, while this method may be feasible, we must still address the problem of the current microplastics in our lakes and oceans, as we can’t disregard them due to a ban. This is where my project comes in.
Objectives
I have three main objectives by which I will measure the success of my project, which are as follows:
- Cost-effectiveness
- Real-Time Use
- Autonomous Control
The first criterion is cost-effectiveness, in terms of resources needed to complete the project. The ROV is designed to be cost-effective, carrying a budgetary cap of $500. I also intend to design my project so that it can be easily replicated with limited resources and can be done at home. This emphasis on accessibility would allow for widespread replication and implementation across many other communities' lakes and ponds in the world. The second objective is around the real-time use of the ROV. The ROV must be able to efficiently and precisely detect and filter microplastics in water bodies in real-time, which means when it detects a microplastic, it filters it immediately, which directly addresses the urgent issue of microplastic pollution. Thirdly, I wanted to create an ROV that can work without the supervision of a human, hence being autonomous. Thus, multiple units can be set out without constant human oversight. These three criteria set a standard for a sustainable and efficient project aimed at creating a positive and lasting influence on both environmental conservation and community engagement.
Final Project Question
How can I design and construct a low-cost, autonomous, and efficient underwater robot (remotely operated vehicle; ROV) that can detect and collect microplastics in real-time?
Method
Construction of the Robot
Robot Parts
Researching, Designing, and Constructing the parts of the robot
Shell
At the beginning of my ROV journey, I explored pre-made underwater robots, thinking I could modify them to my own needs. My main requirement was finding one with an SDK (software development kit) so I could code it to do what I wanted. SDK is a software where you can add your own code to the robot. However, underwater drones with SDKs were rare and expensive. I found one called the BlueEye Pioneer from Blue Eye Robotics, but it was very pricey, starting at $20,000. The cheapest alternative was Chasing Drones underwater robots, but its $500 “Dory” model had a faulty camera and no SDK. Faced with these limitations, I decided to build my ROV to meet my specific needs and allow for tailored solutions to any questions that might arise. In constructing the ROV, I researched submersibles and underwater aerodynamics. To start my project off, I had to figure out the incasing, or the shell of the robot. Initially, I considered 3D printing for the casing, and in this process, I educated myself on 3D modeling platforms such as TinkerCAD and Fusion360 solely through YouTube videos. However, after doing some tests on waterproofing the 3D prints, I discovered that the 3D printing filament isn't waterproof due to microscopic pores in the printed material.
Figure 1. Microscopic Animated view of a 3D print shows small pores in a print
Figure 2. Cross-section of a 3D print shows that over time water can go through it
Water can seep through these tiny openings over time, especially under high pressure. To solve this, I opted for a simple yet effective solution: a regular airtight food storage container. This uncomplicated approach proved surprisingly effective underwater, showcasing good aerodynamics, and a very good watertight seal. Unlike 3D prints, plastic doesn't have pores, preventing water infiltration.
Figure 3. Rubbermaid Brilliance storage container acting as the main casing for my robot
I tested this process by submerging the plastic container underwater. I moved it around, up and down, side to side, and no water came through it. As you can see in Figure 3, the main reason for this is the robust rubber seal which keeps the container airtight and watertight. I also submerged the container for many hours, and no water seeped through it. This container also worked surprisingly well in terms of underwater aerodynamics. It moved through the water seamlessly, but of course, in future versions, I can work to make a more aerodynamic shape, such as a “teardrop”. My encasing was strong and could easily withstand submersion and water pressure.
Code board and language
After realizing that off-the-shelf SDK Bots weren't suitable for my project, and determining the design of my shell, I went into the first step of electronics—the code board and programming language. Keeping accessibility in mind, I aimed to choose a coding platform that was user-friendly and open to modifications. After lots of research, I narrowed down my options to Arduino or a Raspberry Pi. Raspberry Pi showed impressive computing power, functioning as a mini-computer with an operating system. This made it ideal for projects involving extensive data processing or complex algorithms. Additionally, its built-in Ethernet, Wi-Fi, and Bluetooth capabilities impressed me. On the other hand, Arduino included analog inputs, making it better suited for projects requiring sensor readings or motor control. Another key consideration was cost—Arduino boards were significantly more budget-friendly compared to Raspberry Pi devices. Arduino boards were available for around $15, while Raspberry Pi devices were priced at approximately $150 during that period. While Raspberry Pi was undoubtedly superior in performance, the high cost was a deterrent at the time. My decision leaned towards Arduino due to its affordability and pins suited for my application. However, I acknowledged that Raspberry Pi's capabilities would be beneficial for more complex tasks in the future. I planned to reevaluate my choice when Raspberry Pi prices became more reasonable, considering the potential advancements and improvements it could offer to my project. After buying my Arduino, I had to learn the language of the board, which is C++. I educated myself in under 10 hours by just YouTube videos! I also had a class in school related to robotics so I learned there as well.
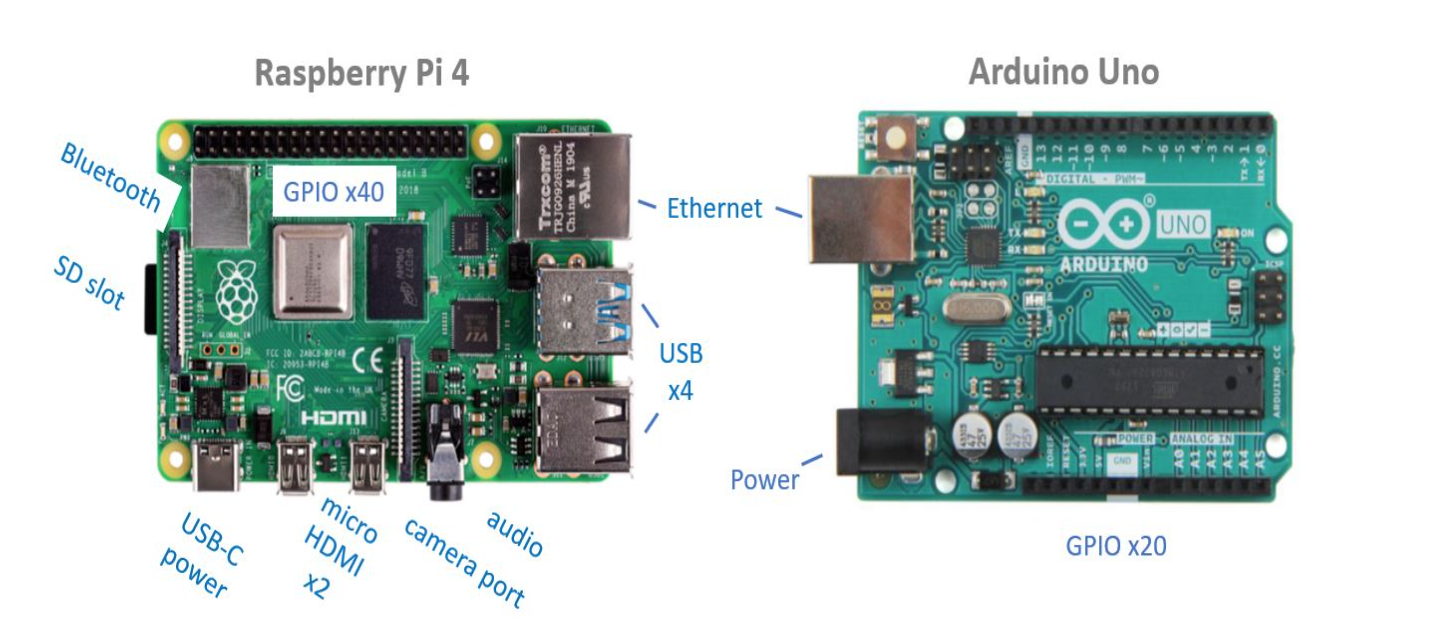
Figure 4. Comparison of Arduino Uno to Raspberry Pi 4. While Raspberry Pi is considerably better, the Arduino Uno possessed specific capabilities tailored to what I needed in my project
Electronics and Other Components
After planning and building both my code board and casing for the robot, I needed to first understand the fundamental electronic principles of robotics. For this purpose, I opted to purchase the Elegoo kit, an affordable Arduino kit encompassing essential components like wiring, batteries, LEDs, resistors, and more. The entire kit costs around $50, and I used and learned each component. Online tutorials from various YouTube channels played a crucial role in enhancing my understanding of electronic principles and addressing issues like short circuits. I also learned with tutorials and a school class focused on robotics and engineering, providing a solid foundation to enhance my underwater robot. After I fully mastered the Arduino, I had to move on to the components of my robot. To start, I needed motors. I found reasonably priced motors from a company called Apis Queen, costing only $32 for both clockwise and counterclockwise motors. The choice of using both types of motors was influenced by the Law of Angular Momentum. If both motors were clockwise for example, then the robot would never go forward and constantly be turning. After acquiring the motors, I attached them to both sides of the robot and started wiring the Arduino to respond to controls. In the initial stages of the project, I opted for a controller, utilizing two joysticks (later I made autonomous control - I made a simple controller to check for any problems). When both joysticks were pushed forward, the machine moved forward. If the left joystick was pushed forward, the machine turned left, and when the right joystick was pushed forward, the machine turned right. Similarly, both joysticks pushed backward made the machine move backward. To enable this control, I required a lengthy cable(as I would be going into deep depths of water), leading me to a 100-ft ribbon cable online. This cable consisted of 4 wires which helped me connect them to my breadboard. I drilled a hole into the middle of the container for this step. For the battery, I chose the URGENEX 1000 mAh Li-po RC lithium battery. This battery stood out for its durability and offered a runtime of 10 hours under my circumstances. I also added an on/off switch to my robot to make the turning-on process much easier than having to take the container lid off every time I wanted to turn on/off the robot. I attached the on/off switch to the bottom left of the lid of the container. Now that I had all my main materials, I had to code the bot and attach specific Arduino components to make my robot work. Of course, there are breadboards, jumper wires, etc. But the most important component for all of my motor control was the “H-Bridge” or an L293D component (Fun Fact: It is called an “H-Bridge” because it looks like an “H” on a circuit diagram). An H-bridge is a crucial electronic circuit for motor control and controls a load's direction and speed. By manipulating the state of its switches, the H-bridge makes bidirectional current flow through the load, enabling control over the motor's rotation. It creates voltage control by adjusting the timing of transistor switching, which is important for regulating motor speed and power. Additionally, the H-bridge supports dynamic braking to swiftly halt the motor's rotation, taking away kinetic energy. Pulse Width Modulation (PWM) further enhances speed control by rapidly switching transistors on and off. All of the code for these components will be explained later. Finally, to put everything together, I bought many different adhesives. I started with gorilla glue’s silicone sealant. While this did work well, a silicone sealant is very flexible and prone to being cut. So I double-layered the glue, the first layer being silicone sealant, and the second layer being JB’s Marine Epoxy Weld. This epoxy was extremely strong and water-resistant.
Final Robot Method
Circuit parts:
- 1 (400 contact- small) solderless breadboard, and 1 (800 contact - Large) solderless breadboard. Jumper wires.
- 2- Axis Analog Joystick(2).
- L293D H-Bridge integrated circuit
- Apis Queen brushed Underwater thrusters (2). 1 clockwise and 1 counterclockwise (If both propellers spin in the same direction, then due to conservation of angular momentum, the ROV will roll in the opposite direction.)
- 7.4 V Lithium Battery and Crazepony 2-in-1 USB Balance Charger Cable 1A
- Waterproof rocker switch (This switch lets you turn your ROV on and off without removing the lid)
- 4-conductor ribbon cable
- Spring or screw quick connectors (These are useful for connecting thicker wires that do not fit into the breadboard, like the motor and battery wires)
- Rubbermaid Brilliance 14.7-inch Clear, airtight plastic food storage container
You also need a computer with:
- Access to the Arduino IDE (either installed local version or web-based editor).
- USB port. You will need an adapter or different cable if your computer only has USB-C ports.
Other parts, hardware, and tools:
- Gorilla glue Waterproof silicone sealant
- Flex Tape & Flex Glue
- JB’s Marine Weld
- Gorilla Super Glue
- Disposable gloves
- Eye protection
- Wire strippers
- Drill and drill bits
- Stainless steel hardware, such as nuts, bolts, and washers, for mounting thrusters and accessories. (Sizes will vary depending on your attachments.)
- Plastic cable clips
- Fishing bobber
- Materials to adjust the buoyancy of your ROV, such as foam, pool noodles, etc. (more buoyant), or heavy objects like metal bars or rocks (less buoyant)
Method:
The written method is good, but it is much easier to look at the Tinkercad simulation I made. This way, you can even play around with the controls. (Note that Tinkercad does not have a joystick part, so the diagram uses potentiometers as a substitute)
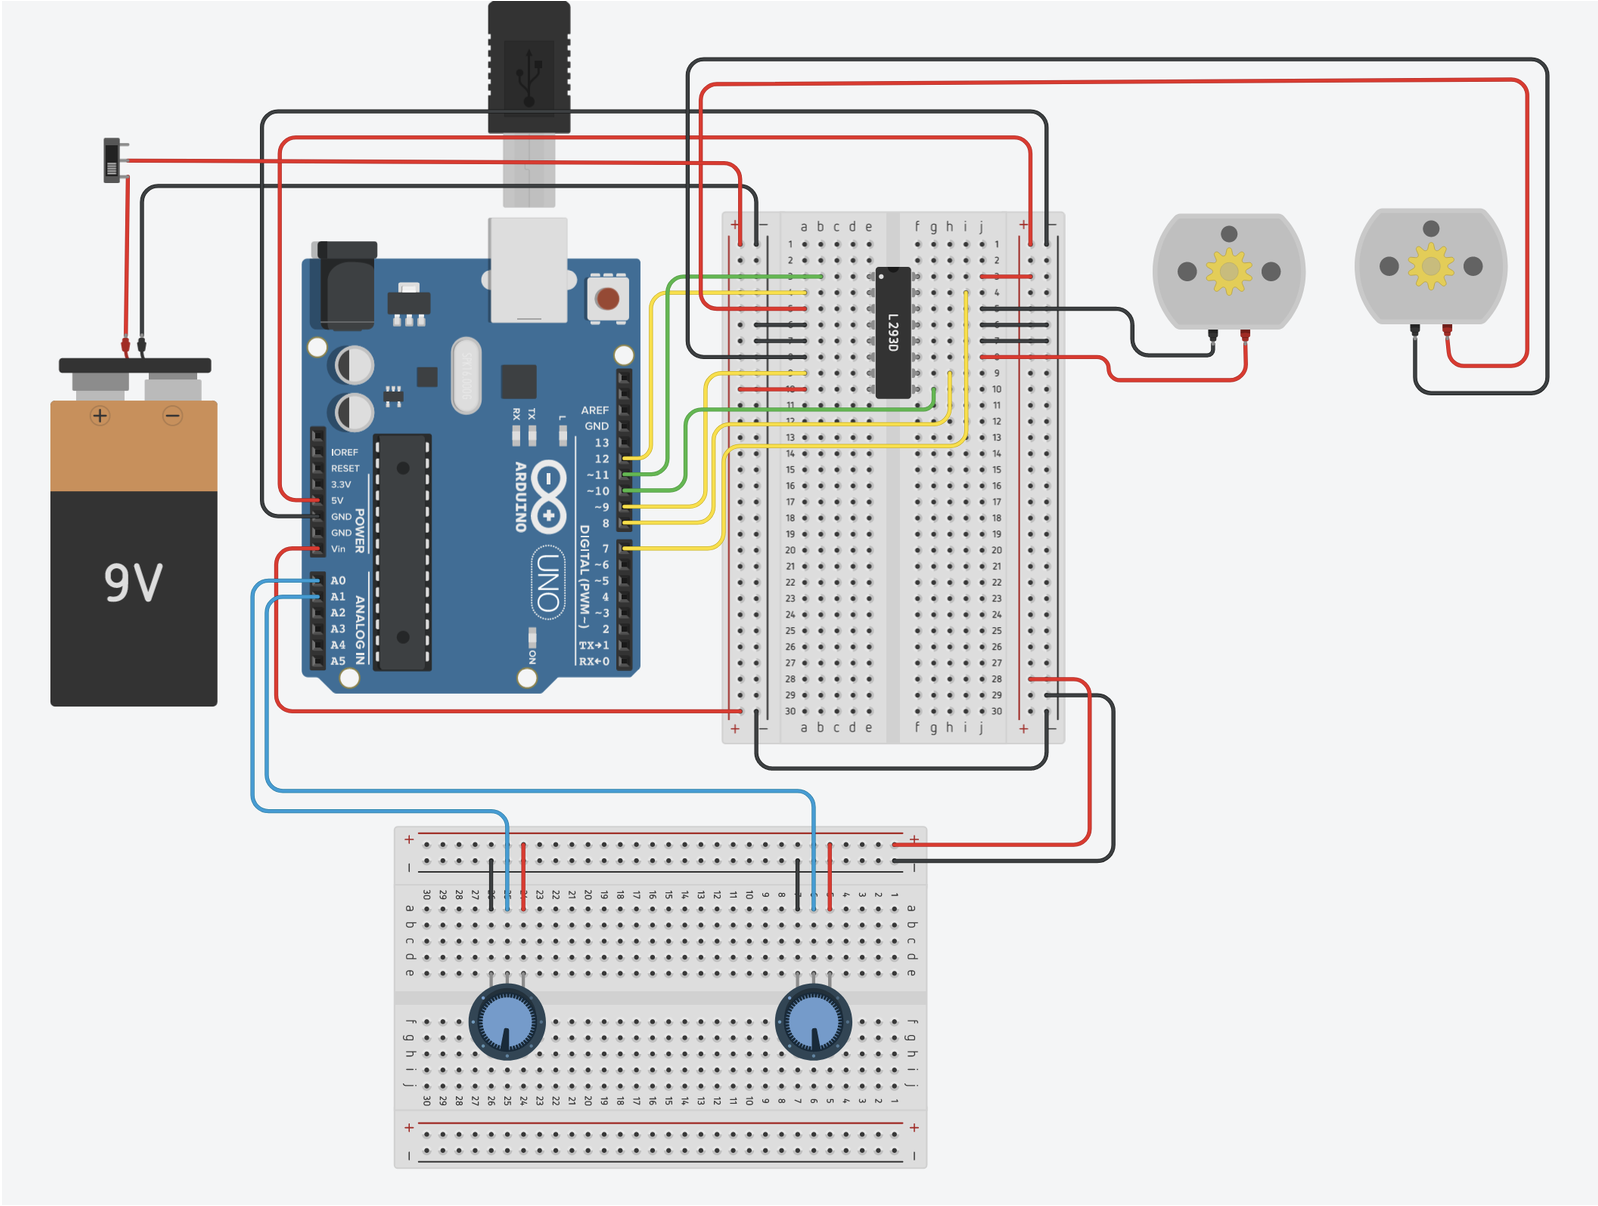
Figure 5. TinkerCAD simulation - not with the sensors and autonomous control
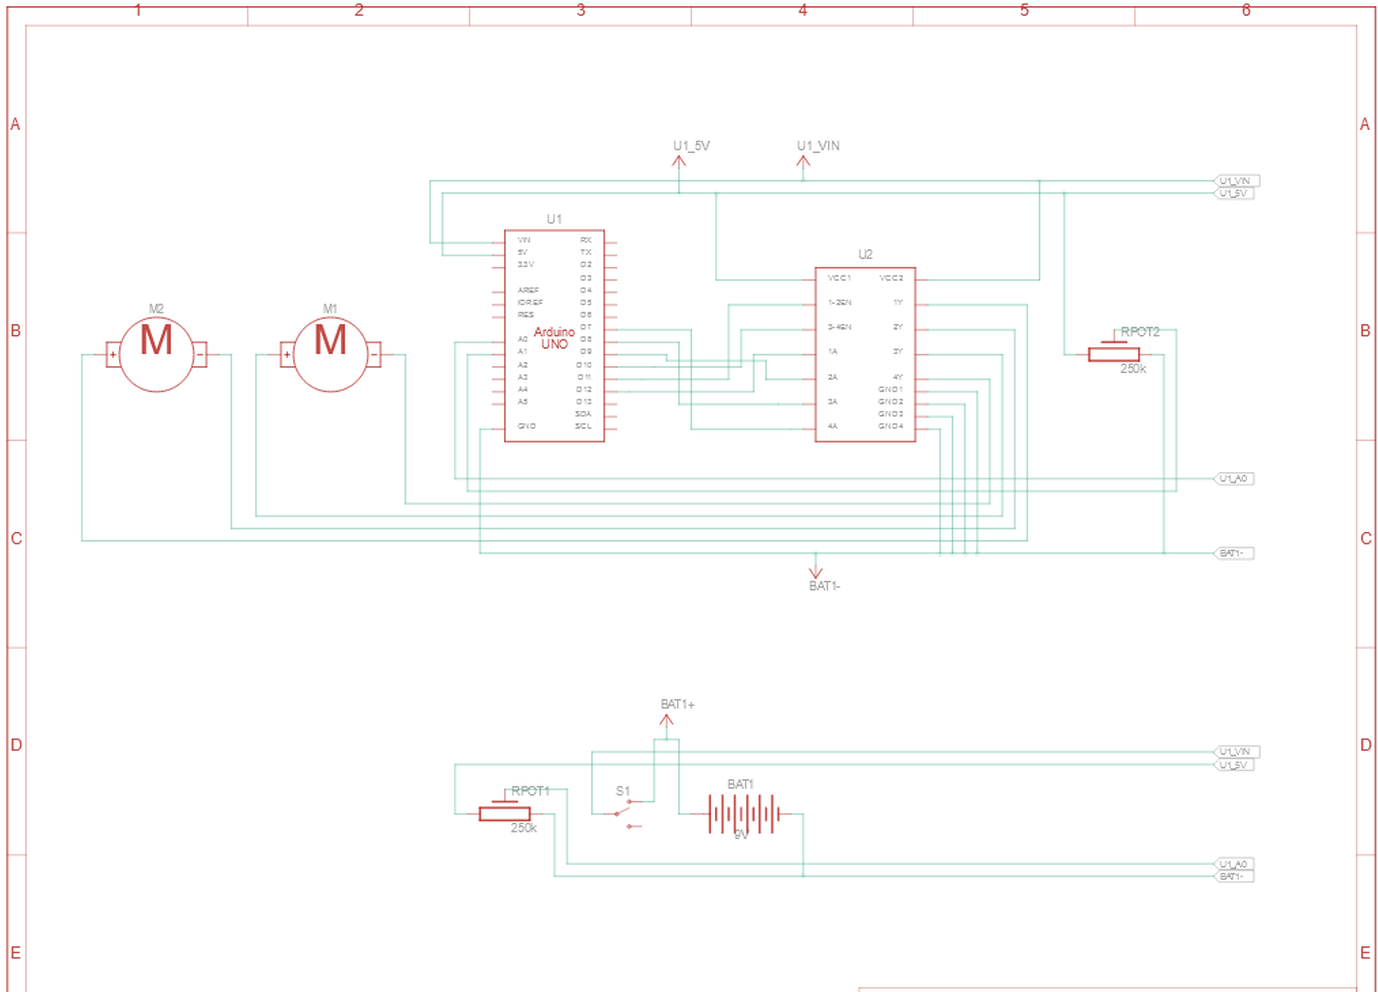
Figure 6. Circuit Diagram - not with the sensors and autonomous control
- Charge your batteries so they are ready for use later.
- H-bridge (pins numbered counter-clockwise from the top left)
- Pin 1 to Arduino pin 11
- Pin 2 to Arduino pin 12
- Pin 3 to the right motor negative wire
- Pin 4 to ground
- Pin 5 to ground
- Pin 6 to the right motor positive wire
- Pin 7 to Arduino pin 9
- Pin 8 to 7.4 V from the battery
- Pin 9 to Arduino pin 10
- Pin 10 to Arduino pin 8
- Pin 11 to left motor positive wire
- Pin 12 to ground
- Pin 13 to ground
- Pin 14 to left motor negative wire
- Pin 15 to Arduino pin 7
- Pin 16 to 5 V from Arduino
- Left joystick
- L/R+ to 5 V from Arduino
- L/R to Arduino analog pin A0
- GND to ground
- Right joystick
- L/R+ to 5 V from Arduino
- L/R to Arduino analog pin A1
- GND to ground
- Battery
- Double-check all of your wiring before connecting the battery.
- Connect the positive wire to the Arduino's Vin pin.
- Connect the negative wire to the Arduino's GND pin.
- Recommended: connect the switch in series with the battery's positive wire so you can easily turn your ROV on and off without unplugging wires.
- Make sure all breadboard ground buses are connected to Arduino GND so the entire circuit has a common ground. (Do not connect the left and right side power buses on the main breadboard to each other. This will create a short circuit between the 5 V supply from the Arduino and the 7.4 V supply from the lithium battery)
- Download the code (the code is provided and explained at the end of this tutorial)
- Make any required changes to the code as needed, such as adding code to control additional motors or sensors. In my case, early in the project, the motors weren’t responding to the signals because not enough voltage was going in them). I fixed this by mapping the code (making a large value to a smaller value, so the program has something easier to work with)
- Upload the code to your Arduino.
- Test your motor controls. It can be hard to see which way the propellers are spinning, but you can put your hand near them to see which way they are blowing air.
- If needed, make any required corrections to your circuit or code. For example, if a motor is spinning backward, you can reverse the two control wires connected to the Arduino or switch the two assigned pins in the code.
- Once you have your circuit working, you are ready to start mounting parts to your waterproof container.
- You should carefully plan out where everything will go before you start drilling holes in your container.
- After drilling holes, remove any sharp burs from their edges, since these could cut the insulation on wires that you push through the holes.
- After you have drilled all the required holes for mounting hardware, passing wires through, etc., follow the instructions for your glue (I used double layer - silicone sealant then epoxy) to seal around the edges of the holes. Make sure you wait for the glue to dry completely before you continue.
- After the silicone sealant has dried, it is time to conduct leak testing to make sure your container is completely watertight. Fill a container of water (sink, bathtub, etc.) large enough to completely submerge your ROV. Remove the Arduino, breadboard, and battery from the container. Put the lid on the container, making sure that it is sealed tightly. Slowly submerge your ROV in the water. Watch carefully for any air bubbles coming out of the container, or water leaking into the container, especially around any holes that you drilled and the edges of the lid. Hold your ROV underwater and gently move it around and rotate it as you continue to watch for leaks. Remove your ROV from the water. Use a towel to completely dry off the exterior. Check to see if any water has accumulated inside the container. If you find any leaks, you will need to patch them (by adding more silicone sealant) and repeat your testing until all leaks have been sealed. If your container leaks around the lid, you may need to use a different container (to be extremely safe - I even sealed the container shut)
- If all works, then you have a working ROV!
Autonomous Driving
Researching, Designing, and Constructing the autonomous control aspect of the robot
After fully completing my robot with motor control, I then wanted to move on to autonomous control, as it was one of my objectives in this project. To do this, I went for a method of distance mapping. I tested three main sensors, the first two being ultrasonic and the final one being lidar. With autonomous control, a human doesn't have to be constantly monitoring the robot, allowing for more microplastics to be collected with fewer humans needed. In the end, the lidar sensor worked the best, and you'll see my process, code, and instructions further on.
First Prototype: Ultrasonic Distance Sensor
An ultrasonic sensor is an instrument that measures the distance to an object using ultrasonic sound waves. I used the basic Arduino HC-SR04 Ultrasonic Distance Sensor. The HC-SR04 is an affordable ($8.74 CAD) and easy-to-use distance measuring sensor that has a range from 2cm to 400cm (about an inch to 13 feet).
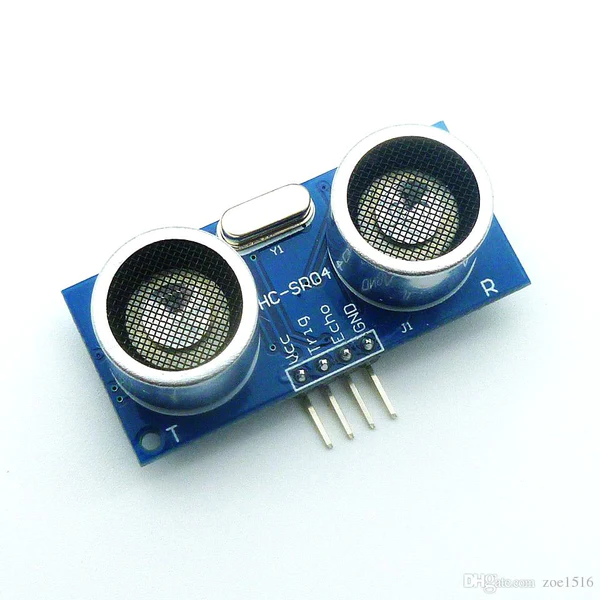
Figure 7. HC-SRO4 Ultasonic Distance Sensor.
The sensor is composed of two ultrasonic transducers. One is a transmitter that outputs ultrasonic sound pulses and the other is a receiver that listens for reflected waves. It emits an ultrasound at 40 000 Hz which travels through the air and if there is an object or obstacle in its path, it will bounce back to the module. Considering the travel time and the speed of the sound, you can calculate the distance.
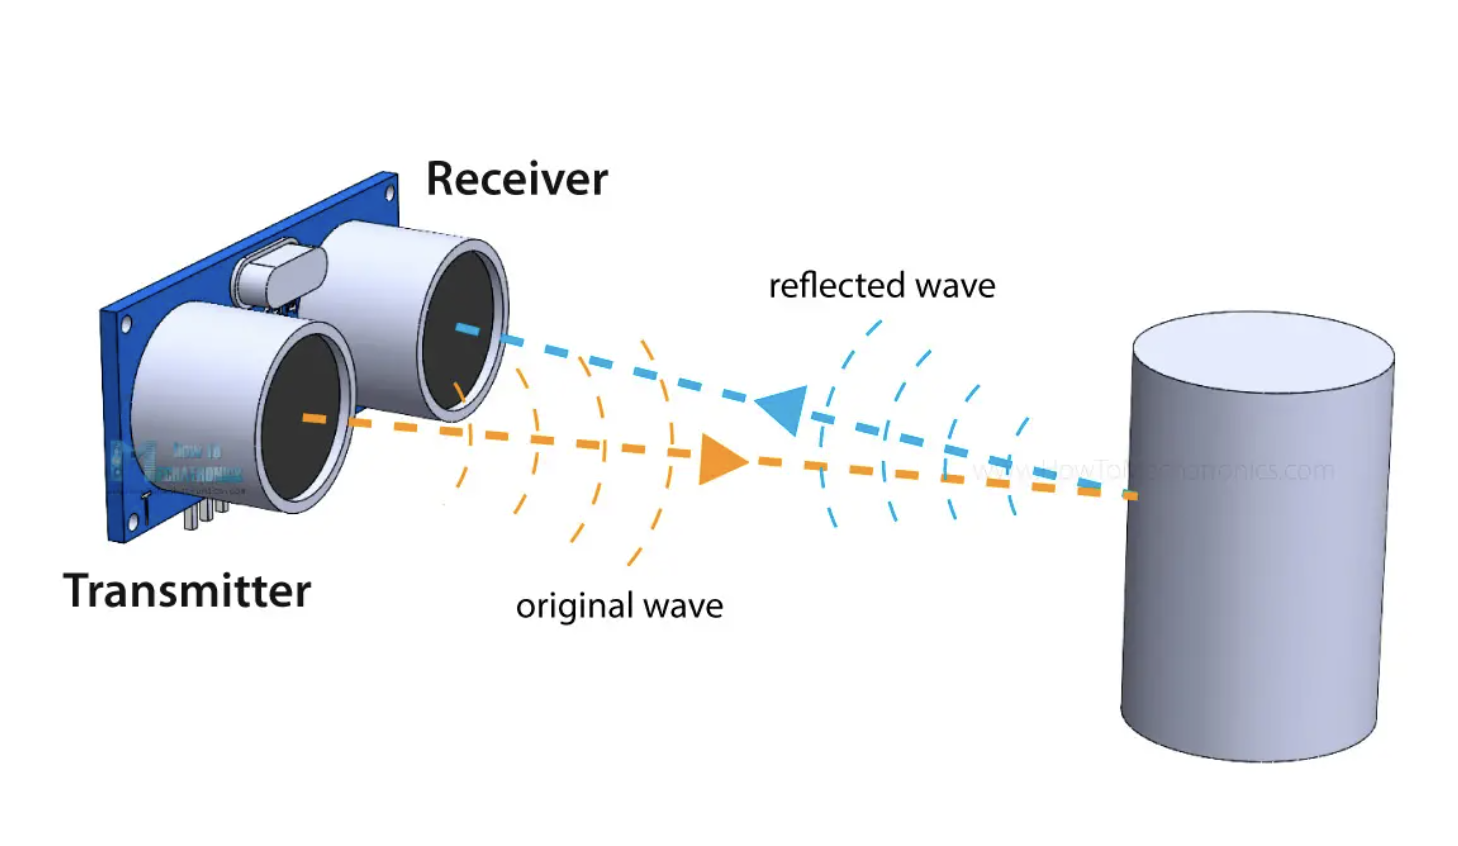
Figure 8. Explanation of Ultrasound Waves
The problem: As you can see the ultrasonic distance sensor is great because it is cheap and easy to use. However, since it uses sound to measure distance, putting it in the container will just mean the sound will bounce around in the container not giving a reliable measurement. Sound waves are not strong enough to go through the container.
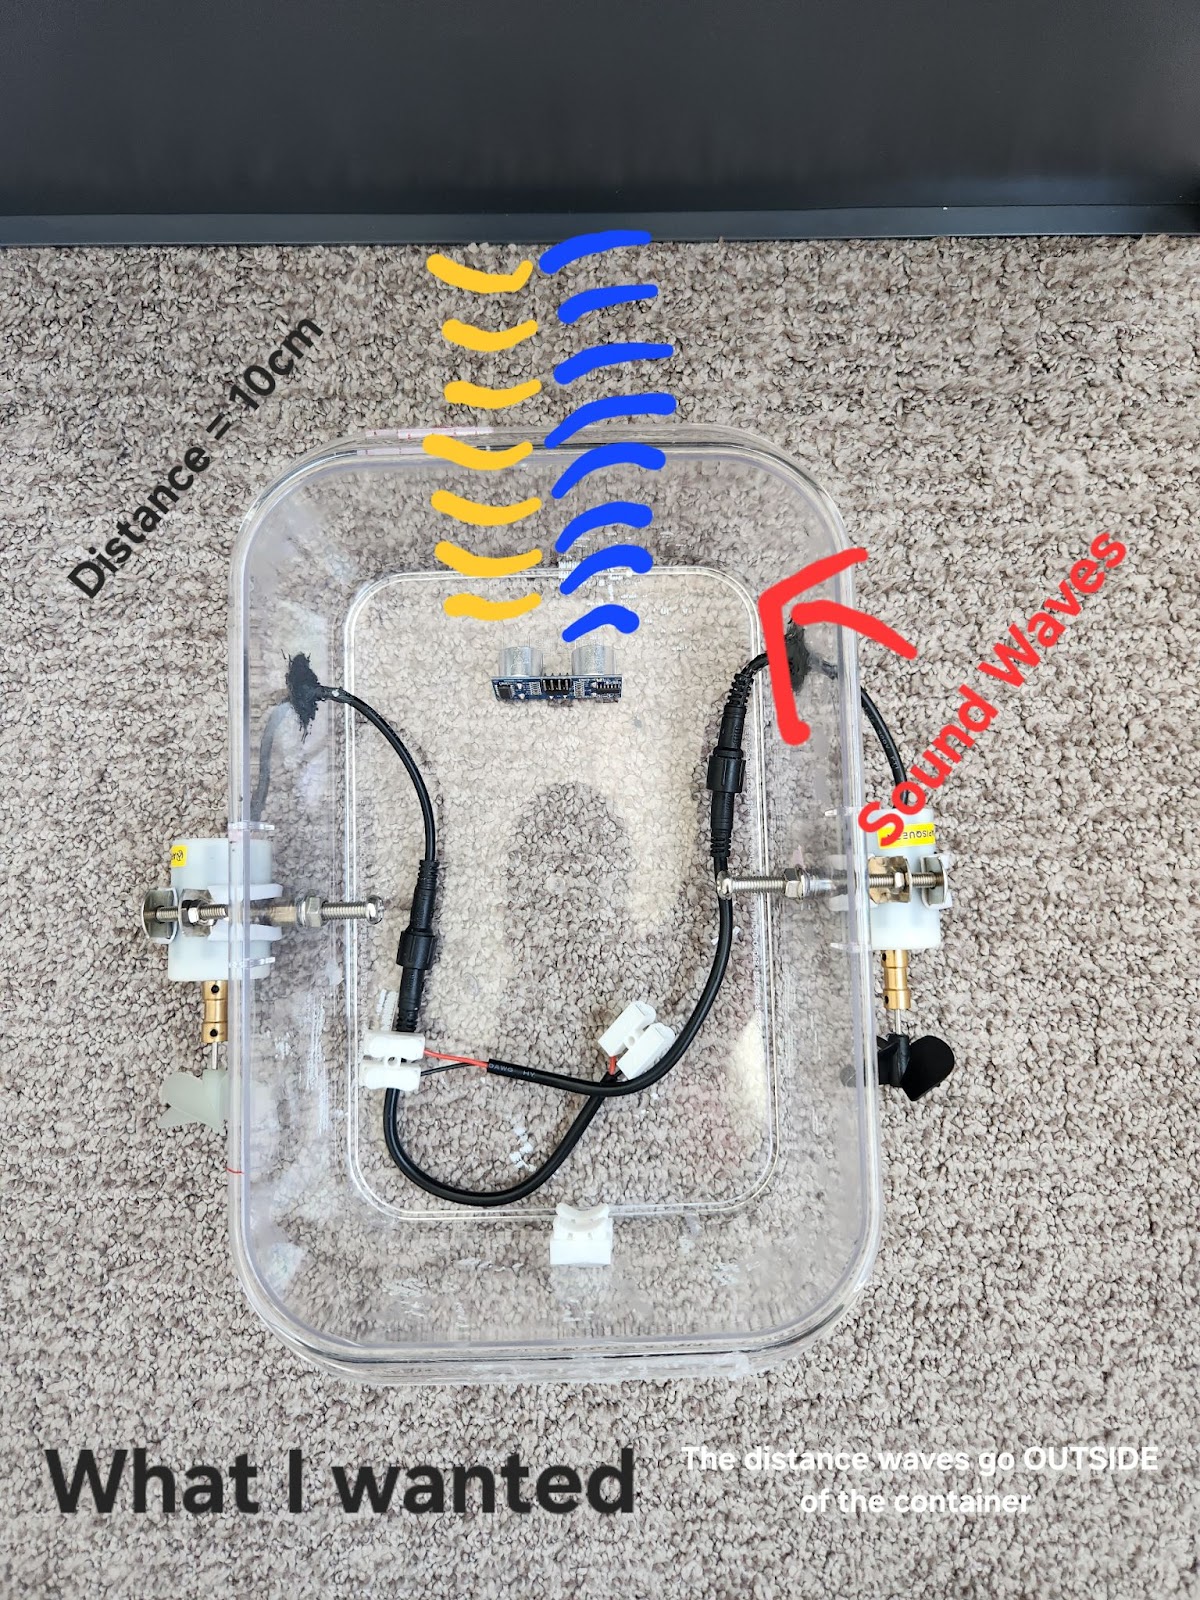
Figure 9. What I expected to happen with the ultrasonic sensor
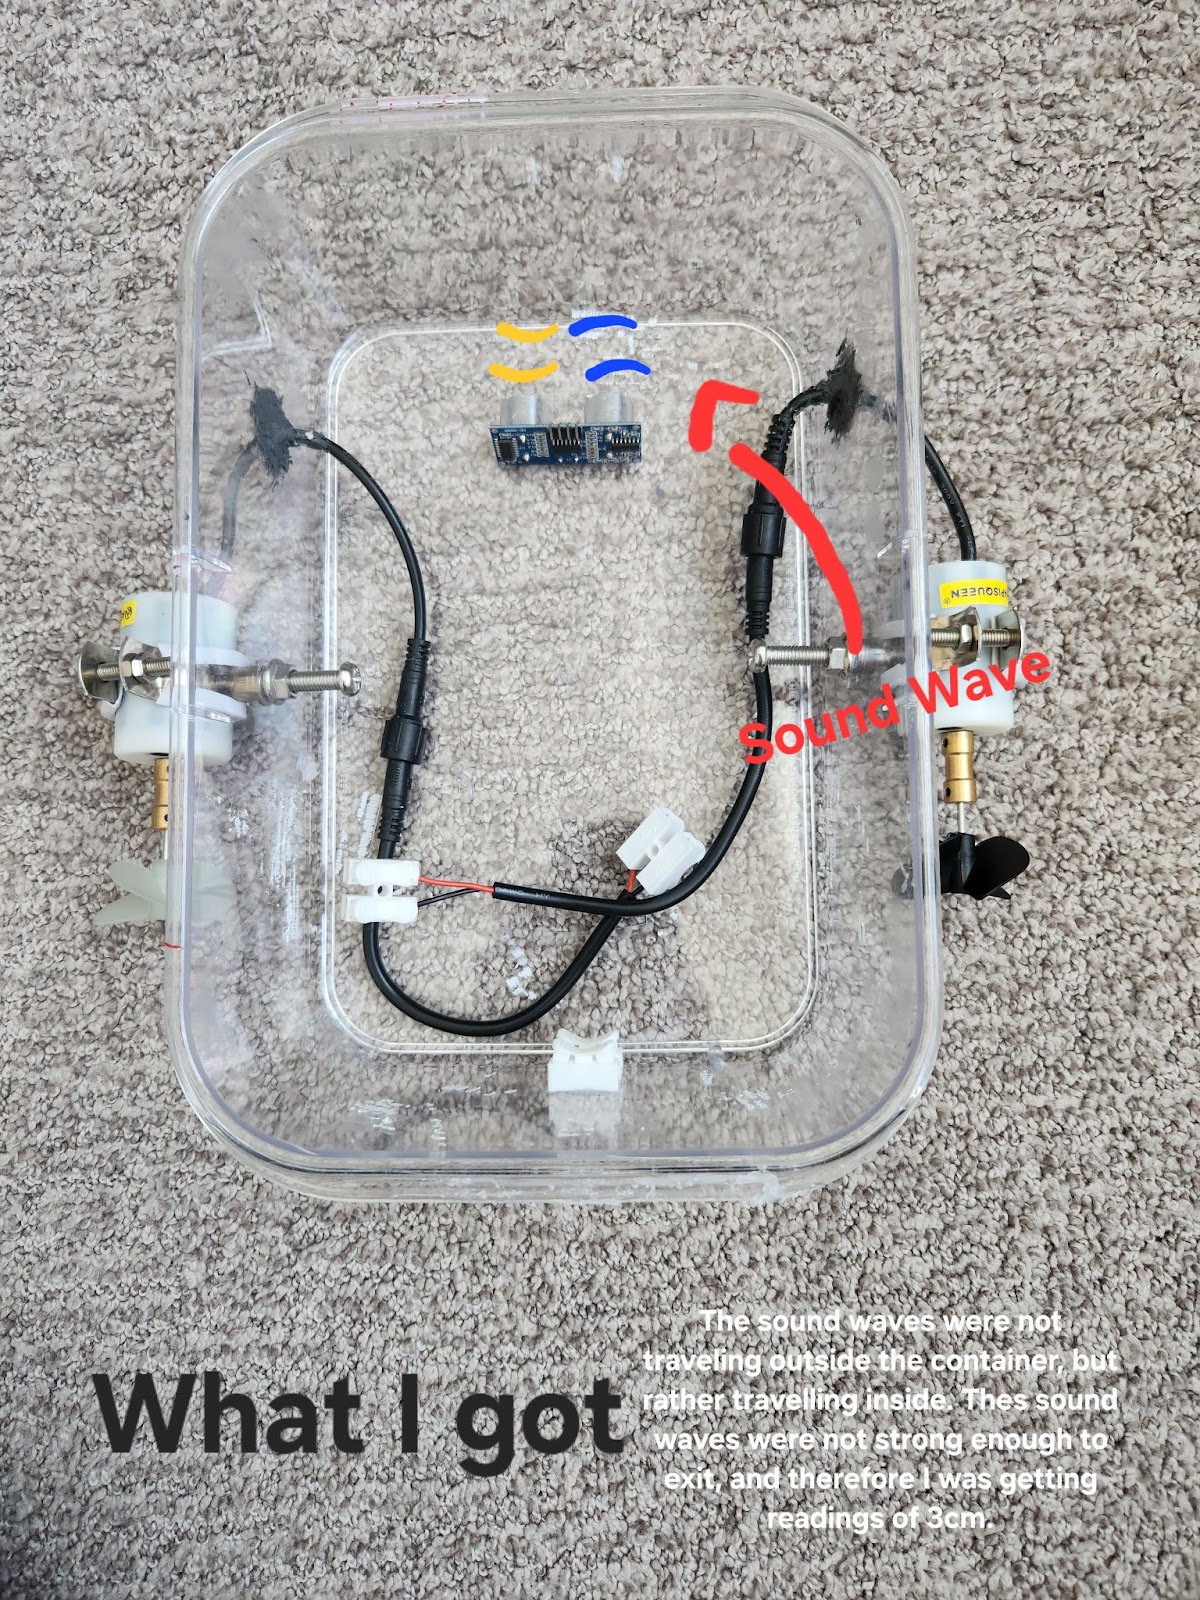
Figure 10. What actually happened with the ultrasonic sensor
Second Prototype: Waterproof Ultrasonic Distance Sensor
I wanted to use an ultrasonic distance sensor that was waterproof as the sound waves still worked outside of the container. when I began researching waterproof ultrasonic distance sensors there were not very many. The ultrasonic sensors that were available had a rating called IP67 which means that they are working underwater for only a specific amount of time. In the case of what I saw, they only worked for around 30 minutes. Of course, I wanted to make these ultrasonic distance sensors work for as long as possible because I wouldn't be taking my machine off and on the water again over and over. The ones that were rated IP68 (IP68 means the sensor can be submerged underwater for any amount of time) range from 200-300 dollars which of course isn't in my budget and it is not worth it.
This led me to a sensor called the A02YYUW. The A02YYUW is an ultrasonic distance sensor that bears some resemblance to the HC-SR04 in that it has the same receiver and transmitter. The device is enclosed in a rubber-like material and is fully waterproof.
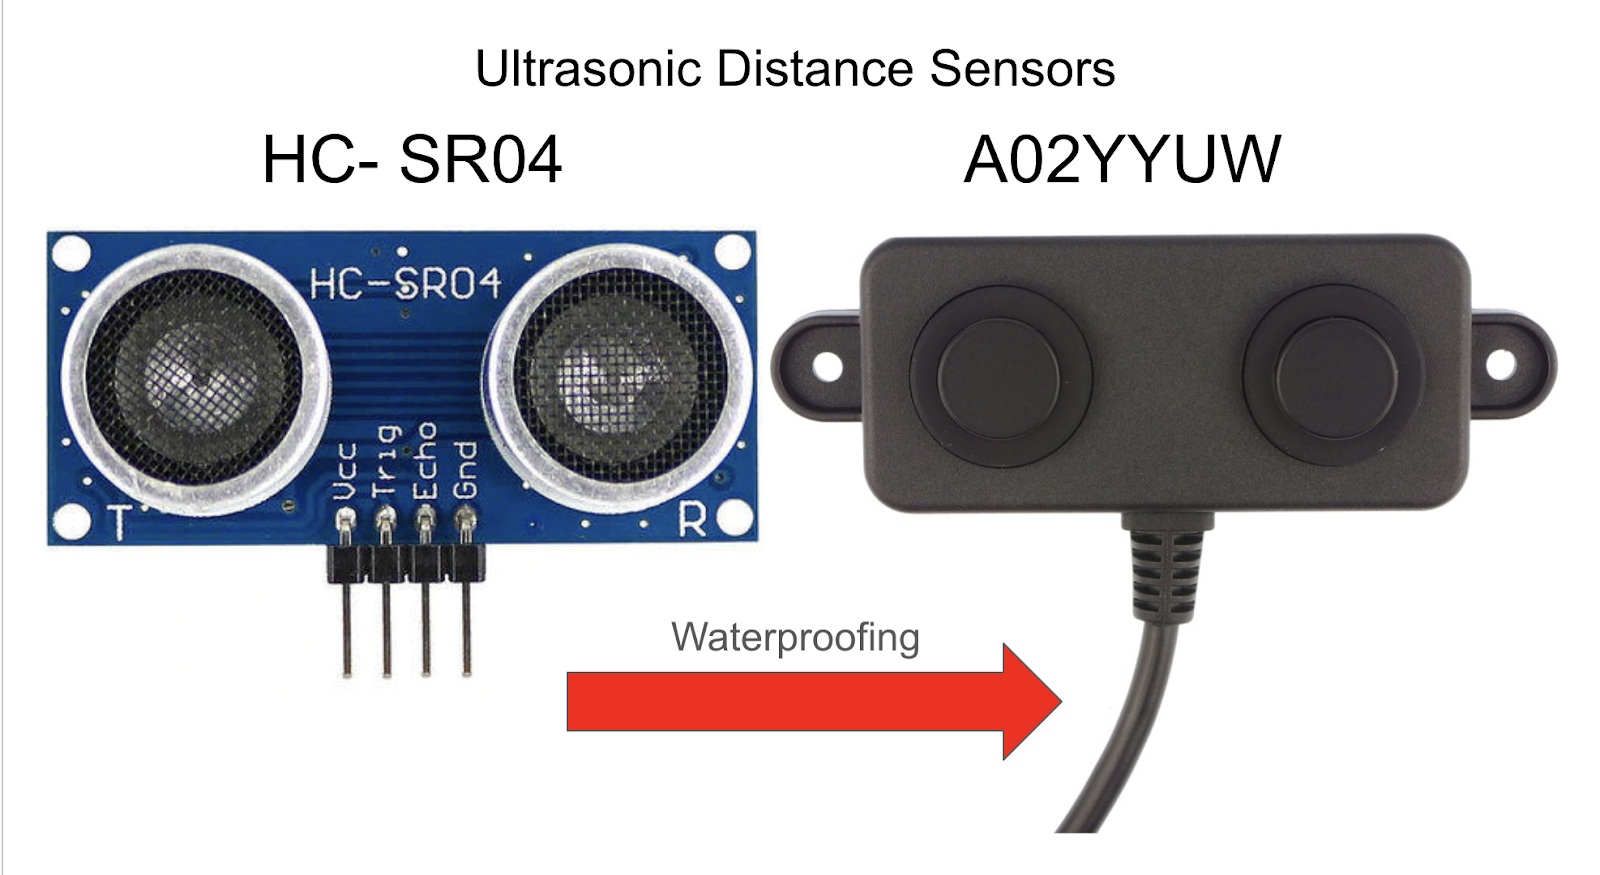
Figure 11. Difference between normal ultrasonic sensor and waterproof ultrasonic sensor
I still did get one of the sensors to check if it really worked and to my surprise, it didn't even turn on! Maybe because I didn't get it from the right dealer? But after looking at a YouTube video online, the sensor could work but it does not work underwater. The YouTube video said that it can only work above water if it's reading signals from for example the shore to the bottom, which of course is not what I'm planning for.
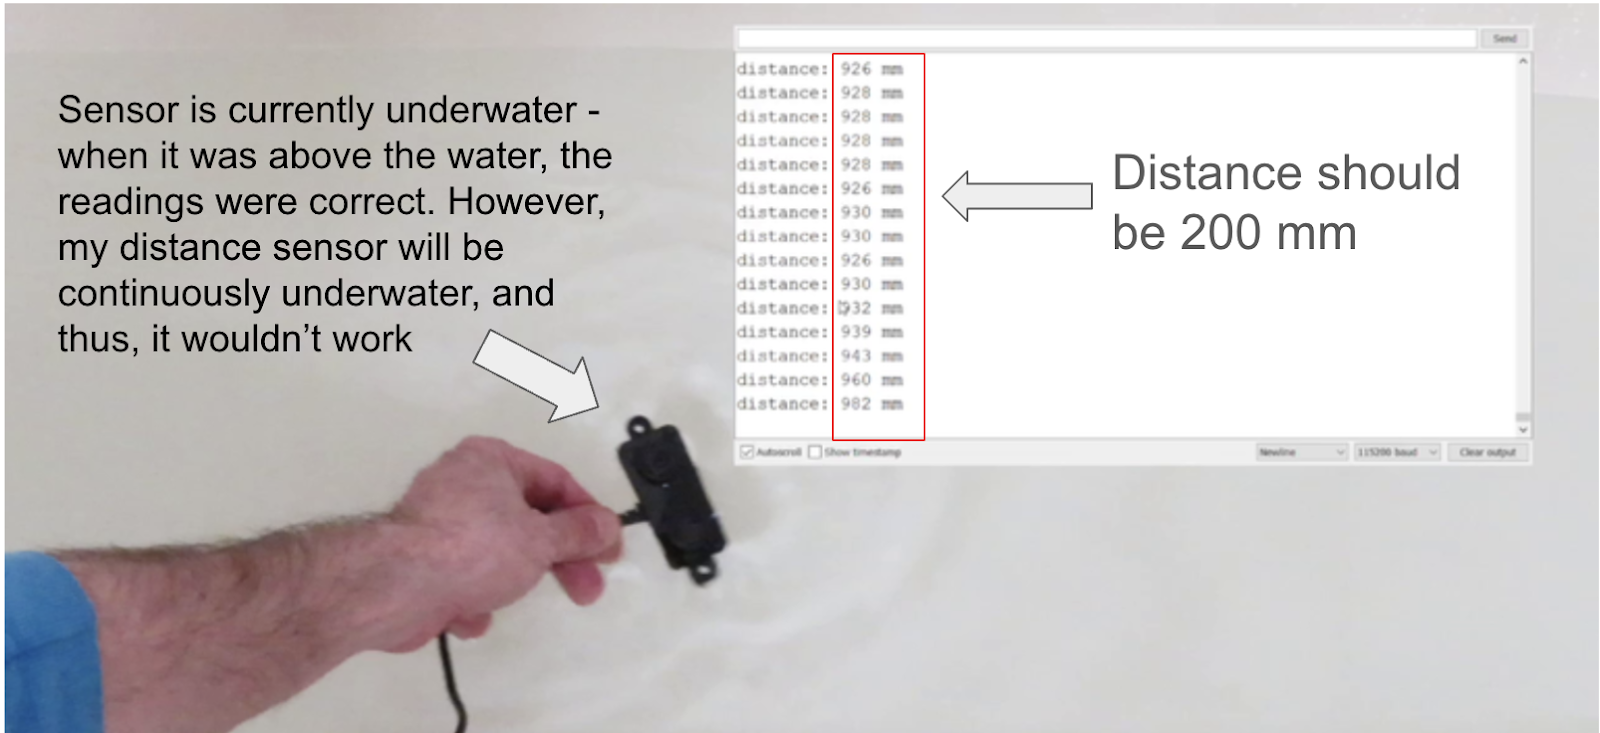
Figure 12. Testing the A02YYUW waterproof ultrasonic sensor underwater. It appears to not work.
Since the A02YYUW (Waterproof Ultrasonic Distance Sensor) is just a rubber-incased version of the HC-SR04(normal ultrasonic distance sensor), then the code and wiring are the same. Let's look at the wiring diagrams:
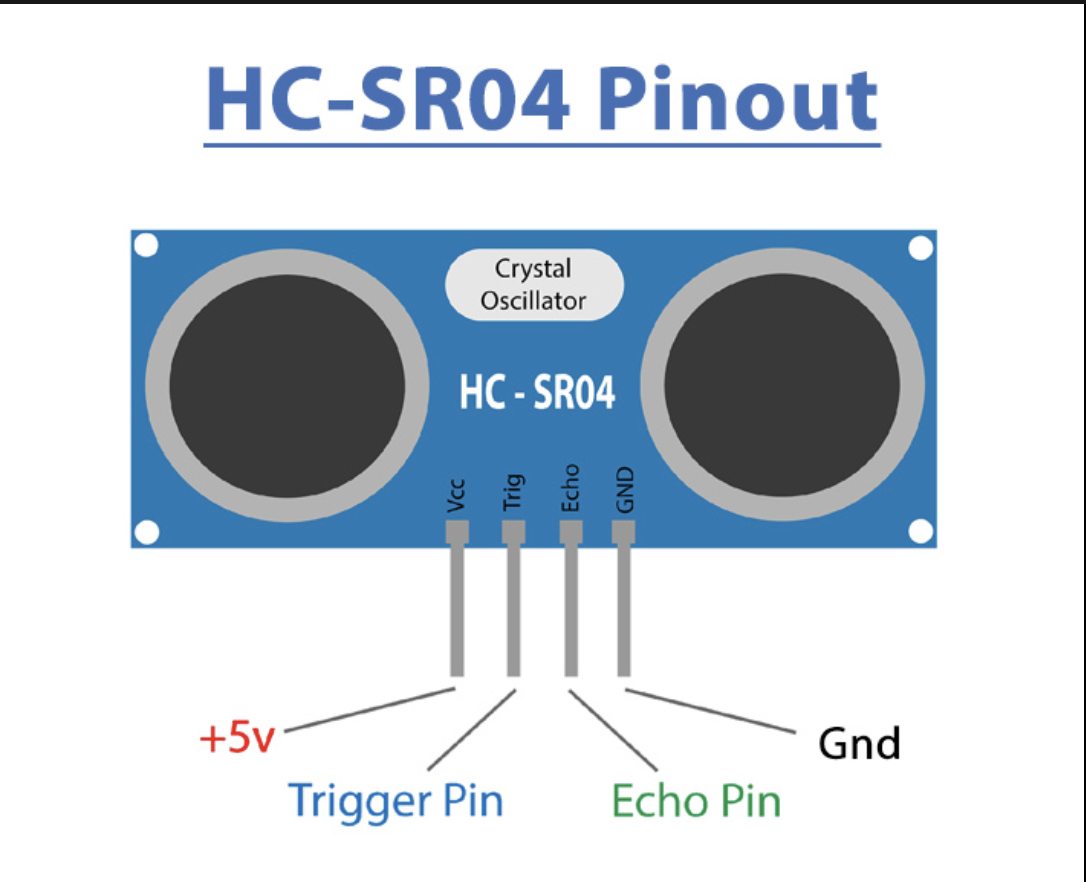
Figure 13. Pinout of the ultrasonic distance sensor
The sensor has 4 pins. VCC and GND go to 5V and GND pins on the Arduino, and the Trig and Echo go to any digital Arduino pin. Using the Trig pin we send the ultrasound wave from the transmitter, and with the Echo pin we listen for the reflected signal.
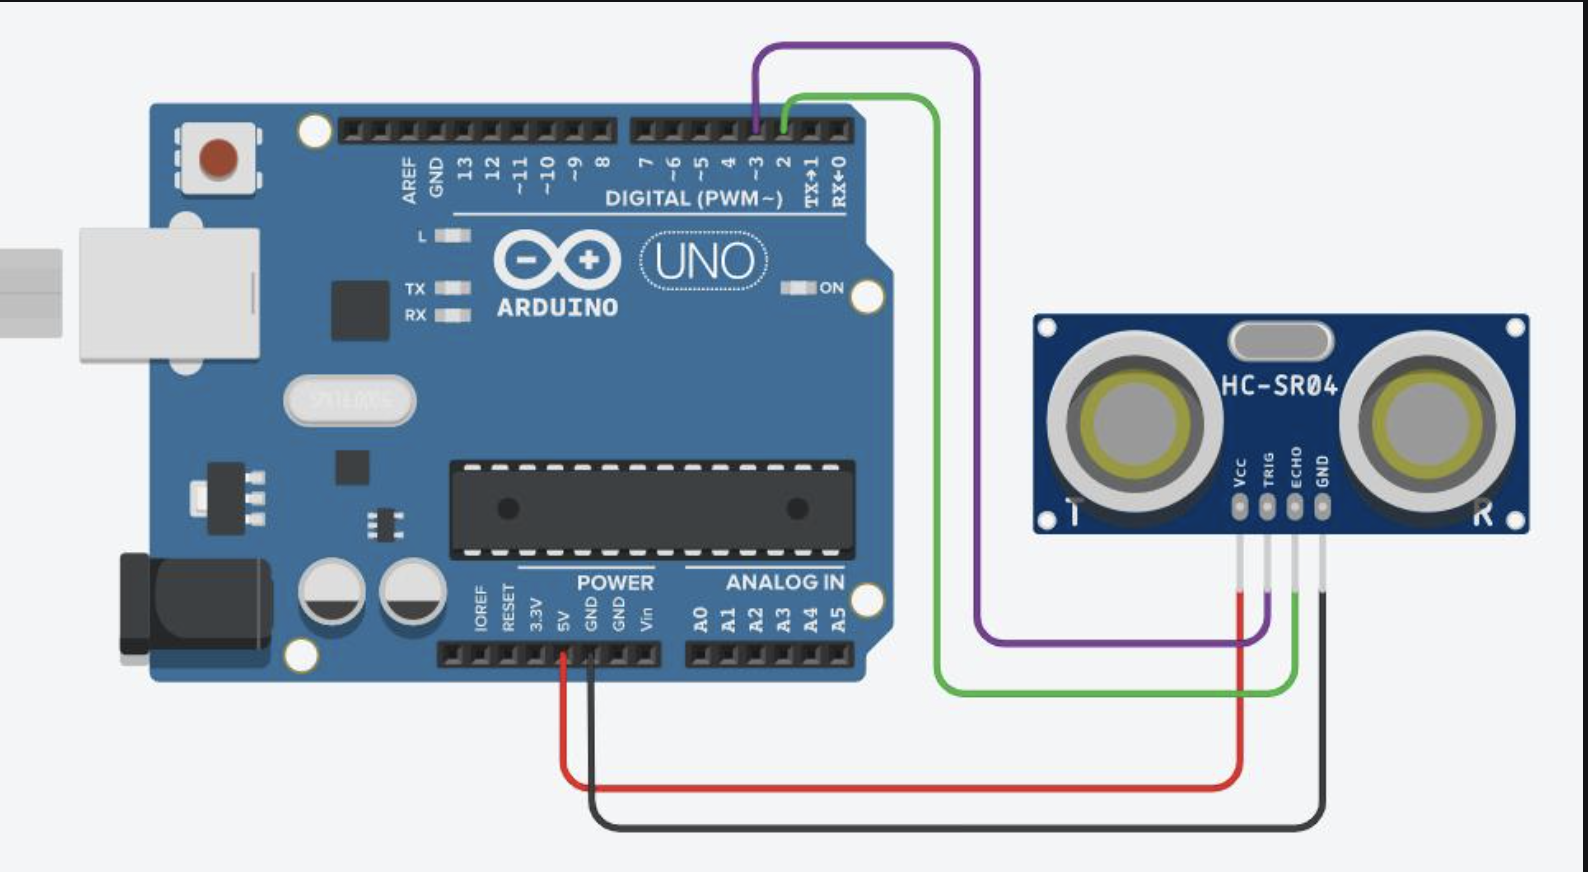
Figure 14. Wiring for the Ultrasonic Distance Sensor
Third Prototype (Final Prototype): TF Luna Lidar Sensor
Figure 15. TF Luna Lidar Distance Sesing Sensor
In design 3, I decided to take a different route in distance-sensing and autonomous driving control which was lidar sensors. Essentially, a lidar sensor is using lasers instead of sound waves to detect distance, this was helpful because the laser actually made it outside the container. The difference between laser and sound was that sound wasn't so powerful and it bounced around in the container but laser is powerful so it can go easily through the plastic. Now of course the laser isn't too strong that it will penetrate the plastic but it is just strong enough to go through it. TF-Luna is a single-point ranging Lidar based on the TOF principle. With its unique optical and electrical design, it adopts an 850nm infrared light source to achieve stable, accurate, and highly sensitive distance measurements. After seeing this work I decided to figure out the values and what code I was going to be putting in the robot for this distancing to work, my final result was I wanted the bot to move if an object was 20 cm or less from the bot. This way I could get a signal early on so the bot doesn't break under any circumstances.
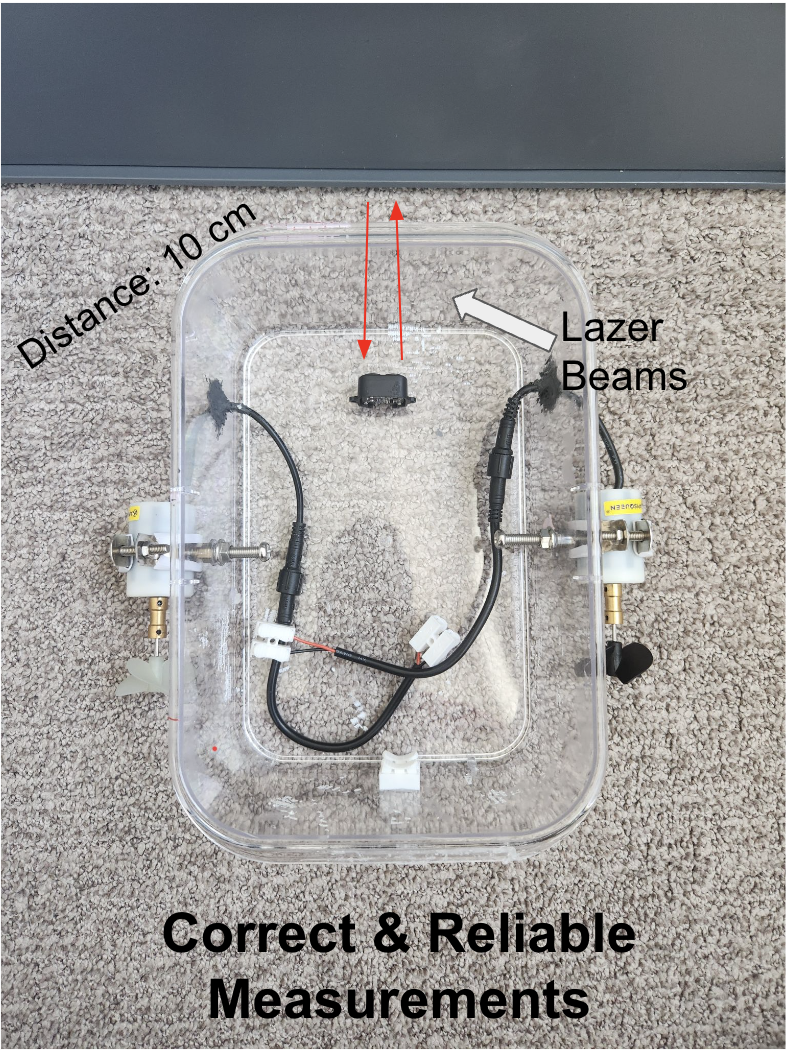
Figure 16. Picture showing how the TF-Luna’s laser went through the plastic to get an accurate and reliable measurement for distance sensing
Pinout and Wiring Diagram for TF-Luna Lidar Sensor Module:
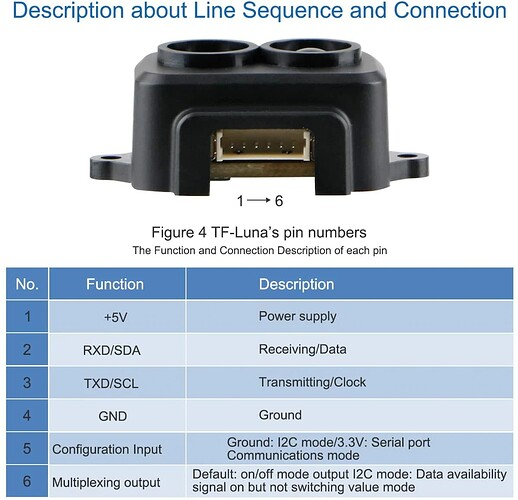
Figure 17. Pinout for the TF-Luna Lidar Distance Sensor
In my Arduino, I only use 4 of these pins, as pins 5 and 6 are not necessary. Pins 1 and 4 are necessary(power for the sensor), and pins 2 and 3 are connected to the Arduino RXD and TXD pins. A fun fact about these pins is that RXD and TXD don't allow for a serial monitor, so you can't see what values the sensor is getting. But I easily mitigated this problem by turning the Arduino LED on when an object is closer than 20 cm and turn off when an object is farther than 20cm. I also tried this with my motors, and it worked!
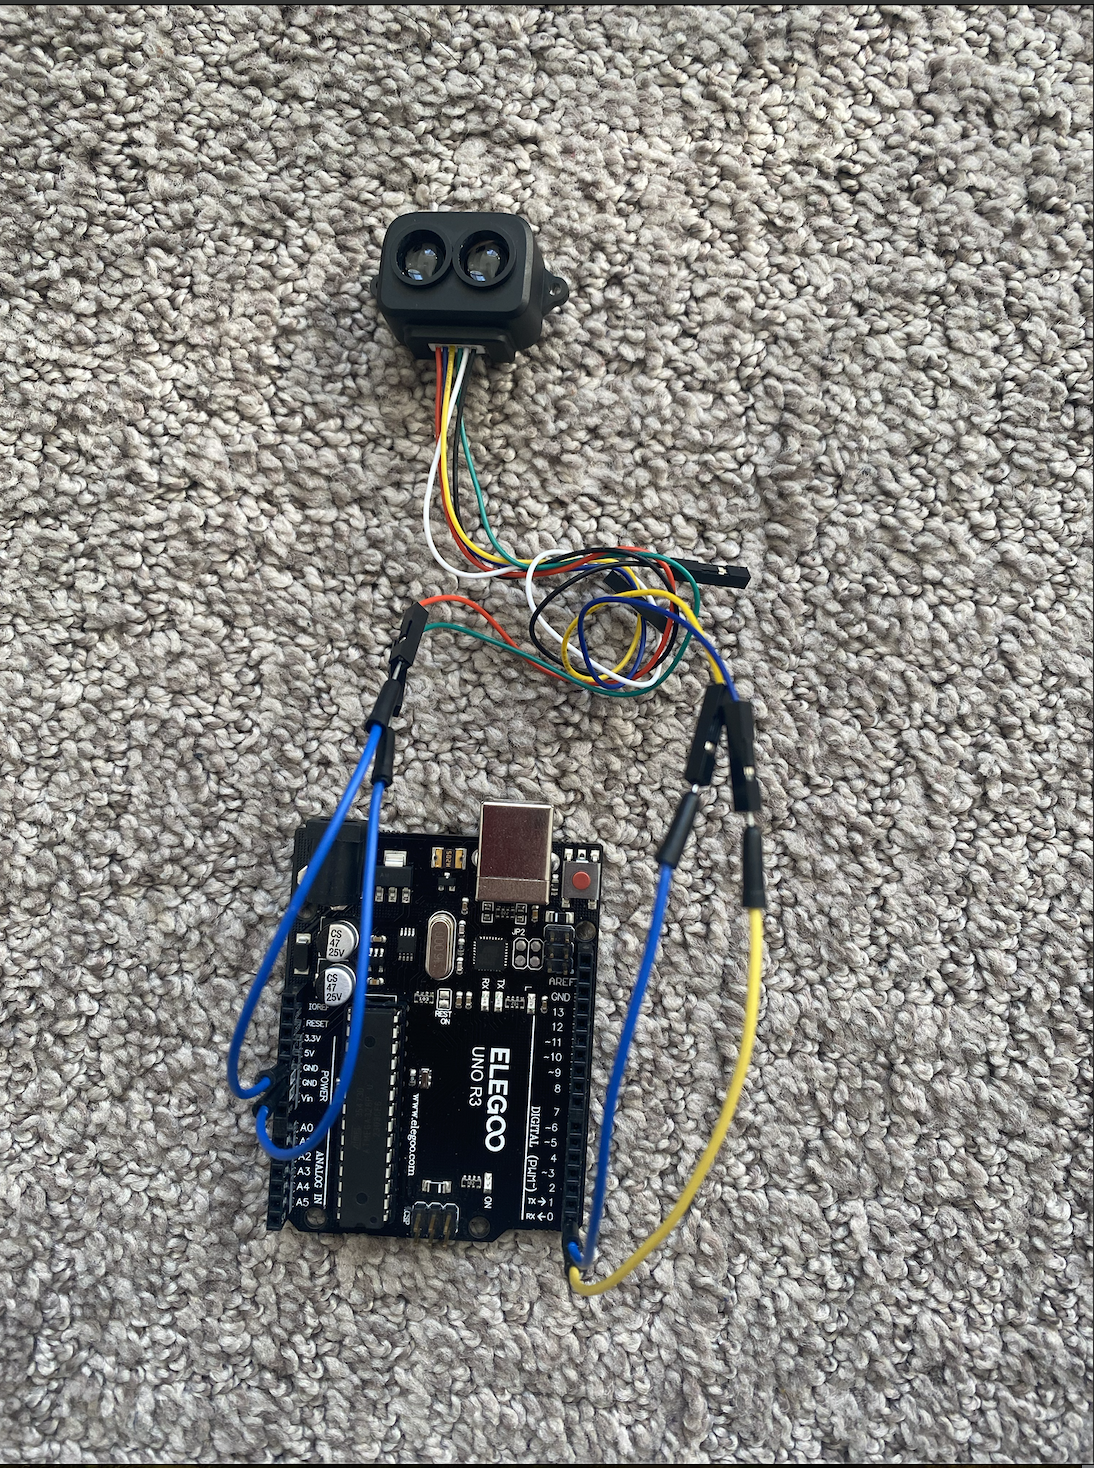
Figure 18. Circuit for the TF-Luna Lidar Distance Sensor (The sensor is not on the TinkerCAD platform)
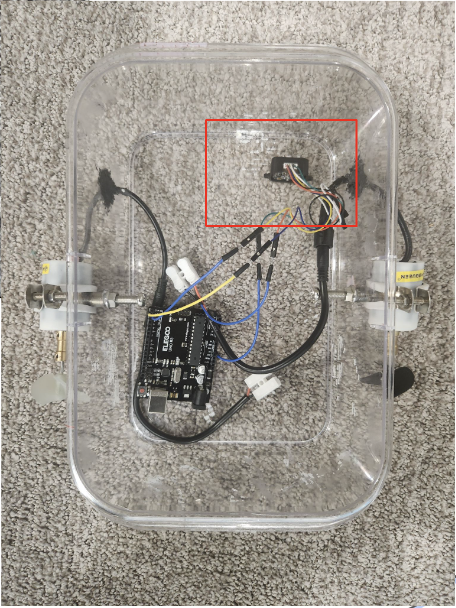
Figure 19. TF-Luna Sensor attached to the ROV (highlighted in red box)
Microplastic Sensing
Researching, Designing, and Constructing the detection sensors for the robot
1st Attempt at Sensing Microplastics: Machine Learning
After looking at the current problems of detecting microplastics, I began creating one of my own. I began with machine learning and image processing, mainly because it was a very hot topic at the time and I was curious to know more about it. But before I explain my results, we must first understand the basics.
What is Machine Learning?
Machine Learning and Image Processing Machines can imitate human learning thanks to an artificial intelligence (AI) technique called "deep learning." Humans use connections between what they have seen in the past and what they are currently viewing to identify different materials. Machines are trained to perform similar tasks much faster. Deep learning AI models gather information from tens of thousands of captured images of specific material categories that must be split up during the sorting procedure. Deep learning in humans simulates the activity of multiple layers of neurons in the human brain to help learners understand complex tasks. Similarly, during machine learning, the system learns how to connect the artificial neurons in order to classify objects. The process of applying operations to an image in order to extract pertinent information is known as image processing. This type of signal processing uses an image as the input and either the image itself or some of its characteristics as the output. When processing an image, there are three basic steps to take: - Adding an Image - Examining and modifying the picture - Producing a result based on image analysis.
How did I make my model?
This program was created in Google Colaboratory, a free platform that allows Python to run without the need for any setup. The model in this study is trained to identify plastics using a deep learning algorithm. I used an ESP32 camera to look at images in real time. To identify large plastics, I used open-source models and then used the neural network, YOLOv5-S, to analyze the images quickly. The top-performing model was YOLOv5-S, which maintains near-real-time speed while operating at a Mean Average Precision (mAP) of 0.851 and an F1-Score of 0.89. The images were formatted into the Darknet and YOLOv5 PyTorch required sizes, 416x416. When my model is uncertain as to what the object is, it says “unidentified”, and when the model has a 80% or higher chance that an image is plastic, it labels the image as “trash_plastic”. At the start, I used an open-source model and created a model to identify bigger pieces of plastic, and then I moved to smaller and smaller plastic pieces. However, it just got less accurate by utilizing smaller and smaller pieces. In the end, my first model, which could detect large plastic objects, like bags and cans, was at an accuracy of a whopping 98%! But as I went into smaller and smaller pieces of plastic, the percentage went lower. This was because a spec of plastic can look identical to a spec of wood, for example. If a human can’t decipher the difference, the machine is unlikely to. My model to identify plastic relied on looking at their texture and colour, as in some cases these characteristics are different than organic matter. However, this was proven not to be a very reliable method, and the final accuracy for this was 32%. Nonetheless, I still learned valuable aspects of computer vision from this area that can help me in future projects.
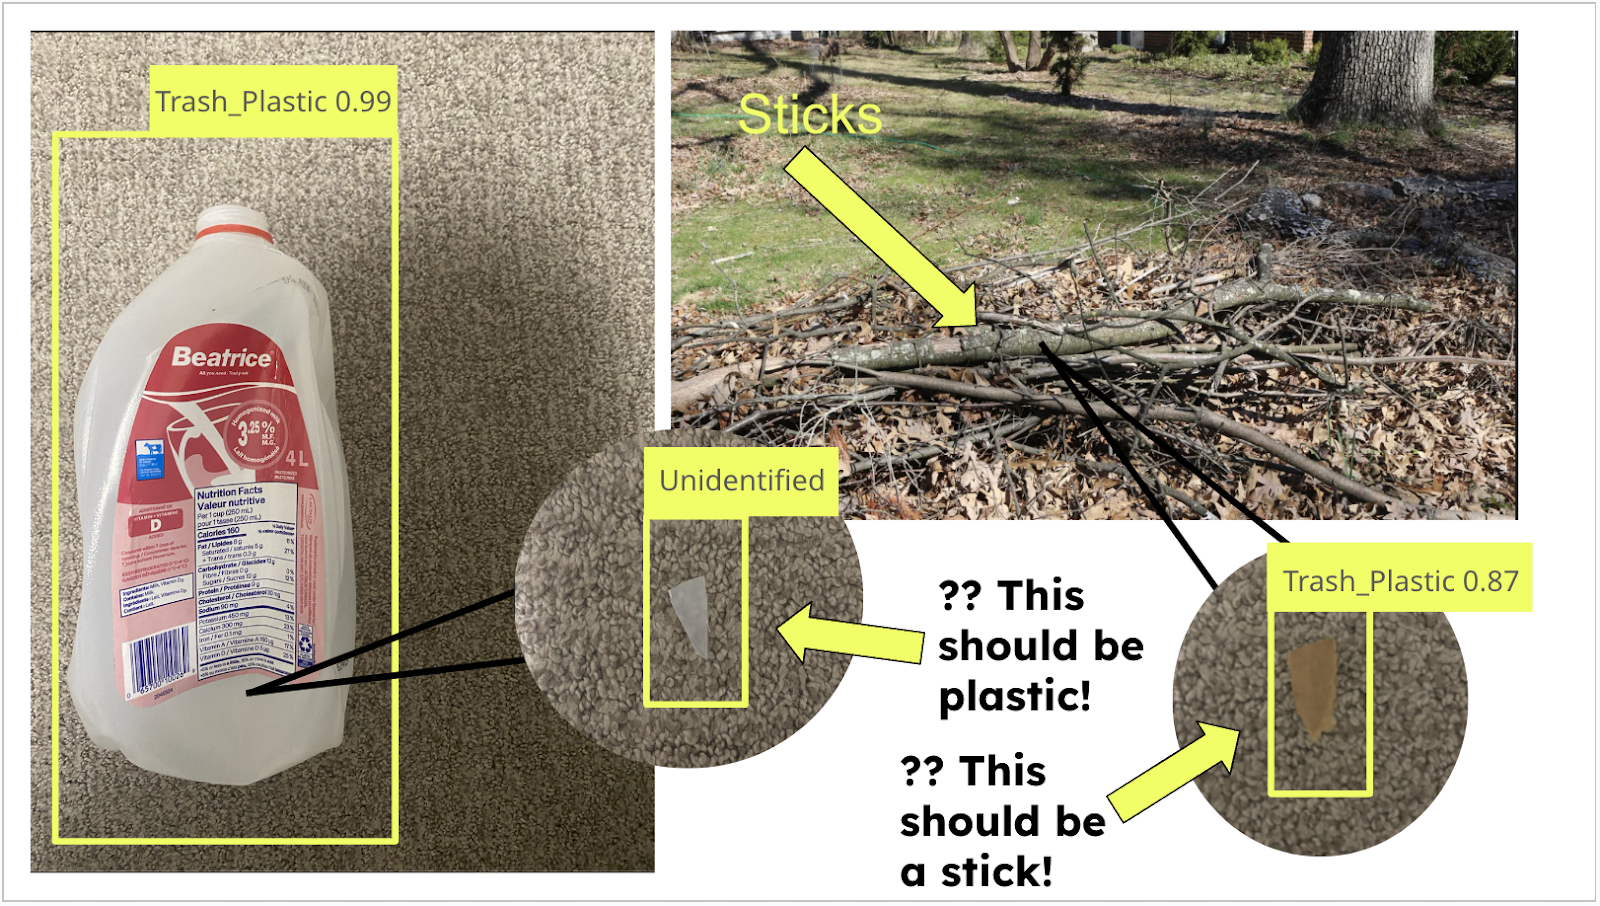
Figure 20. This picture shows how my model can detect bigger pieces of plastic, such as a milk carton. However, it can not detect small specs of it. The model said that a spec of a mil carton is “unidentified”. I compared it with a small piece of a stick which the model said was a piece of plastic! These results are of course not correct, which led me to switching my idea of machine learning to identify microplastics
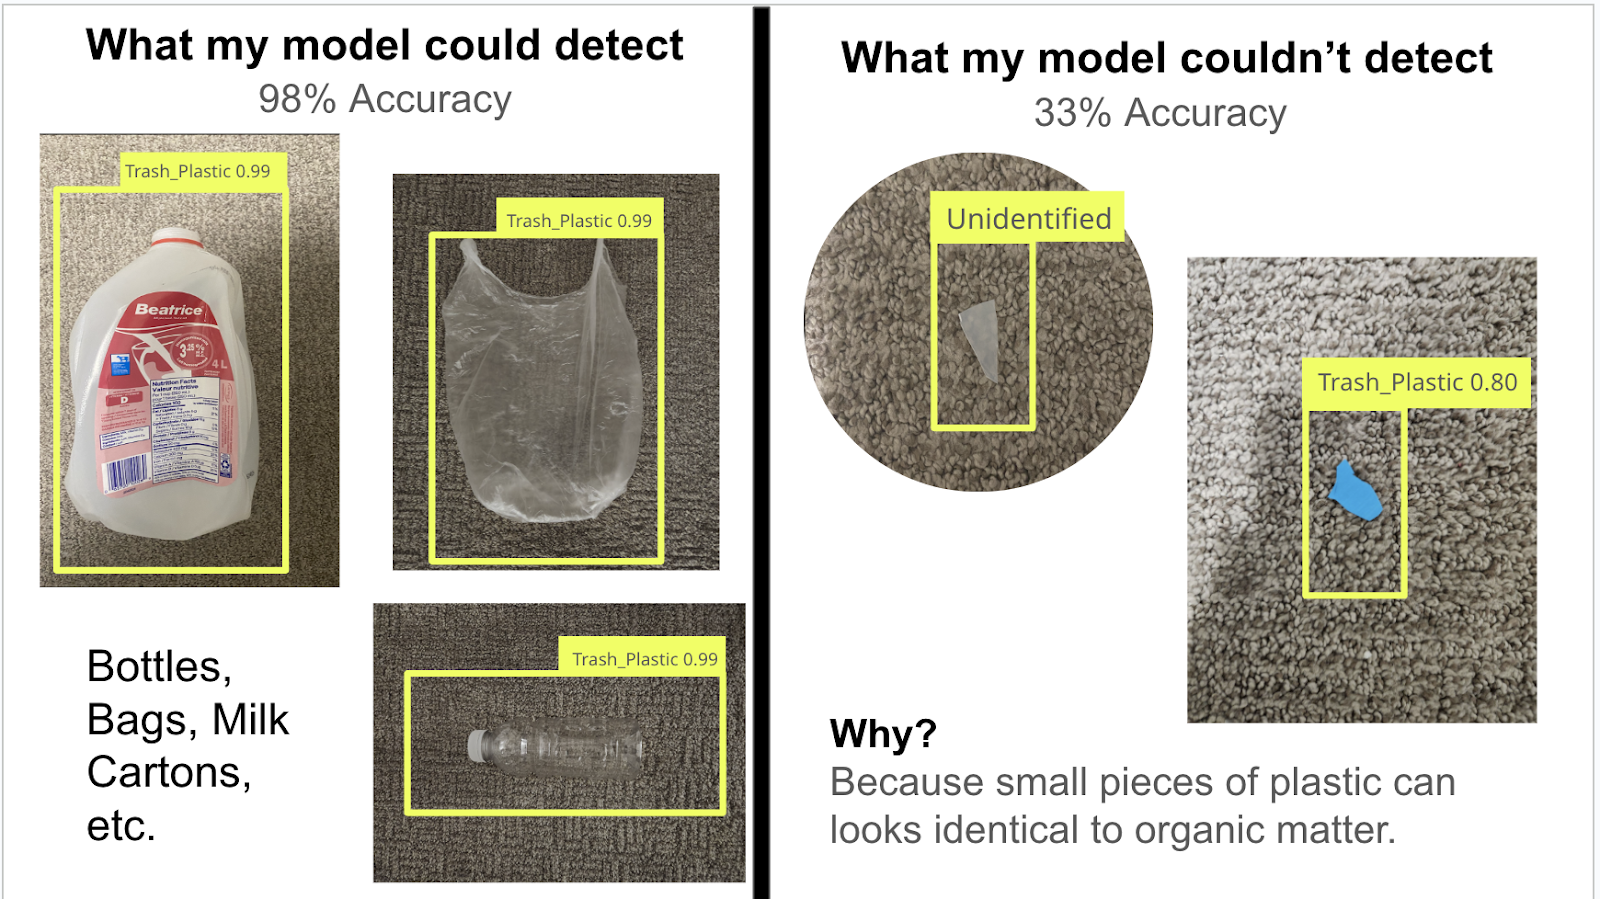
Figure 21. This figure shows how my model could easily detect plastic bottles, bags, etc. But it could not readily detect smaller pieces of plastic. The AI thinks the blue object is plastic, but only with 80% certainty (borderline until it is deemed as “unidentified”), which is right, but again it is not certain enough. The final microplastic machine learning model accuracy was 33%.
2nd Attempt at Sensing Microplastics: UV Sensing
The UV sensing technique involved two components: a TCS3200 Arduino Sensor and a 365-nanometer UV flashlight. The TCS3200 Arduino Sensor has a built-in photodetector in it, making it perfect for what I need in my project. I bought a 365 nm UV flashlight because that is the range where plastics are affected the most.
Figure 22.
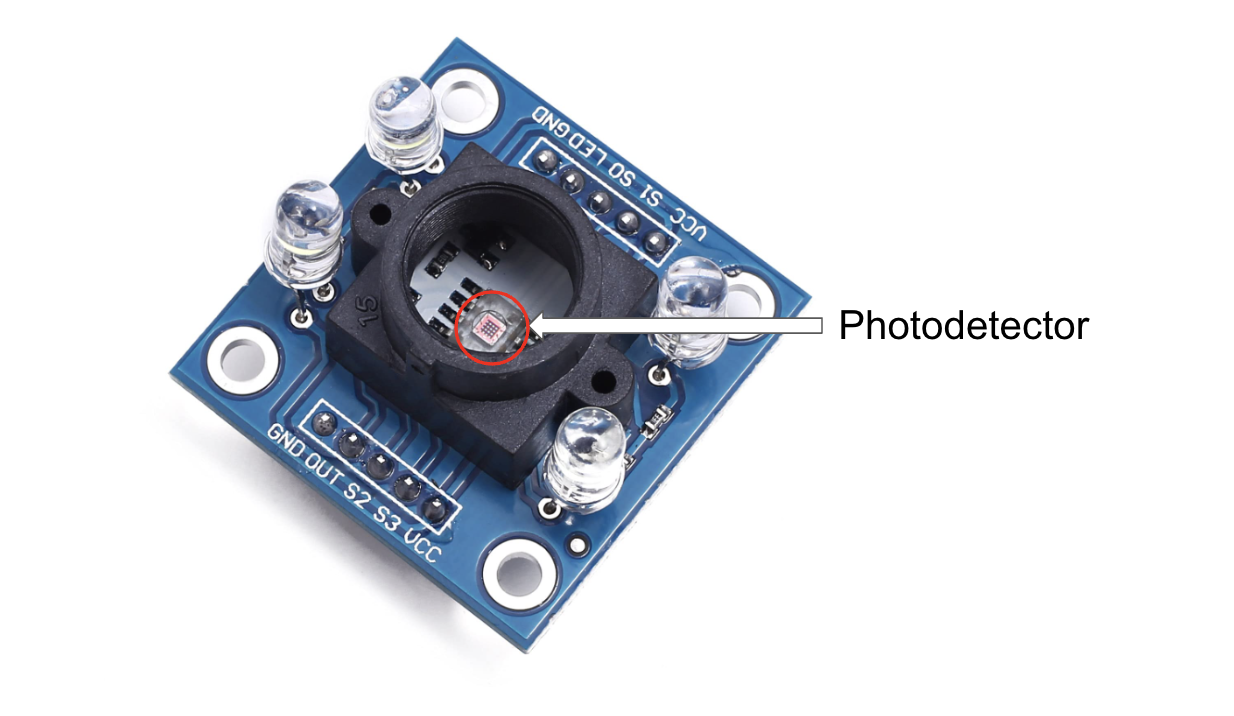
Figure 23. Pinout
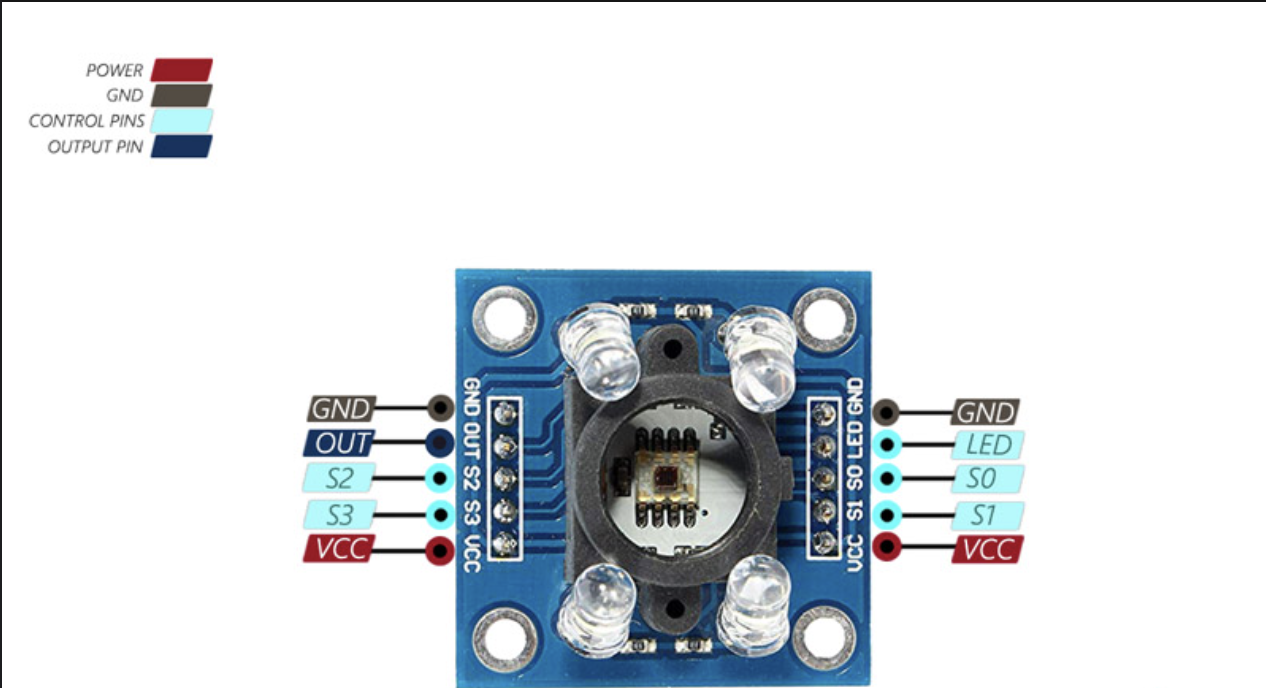
Figure 24. Wiring
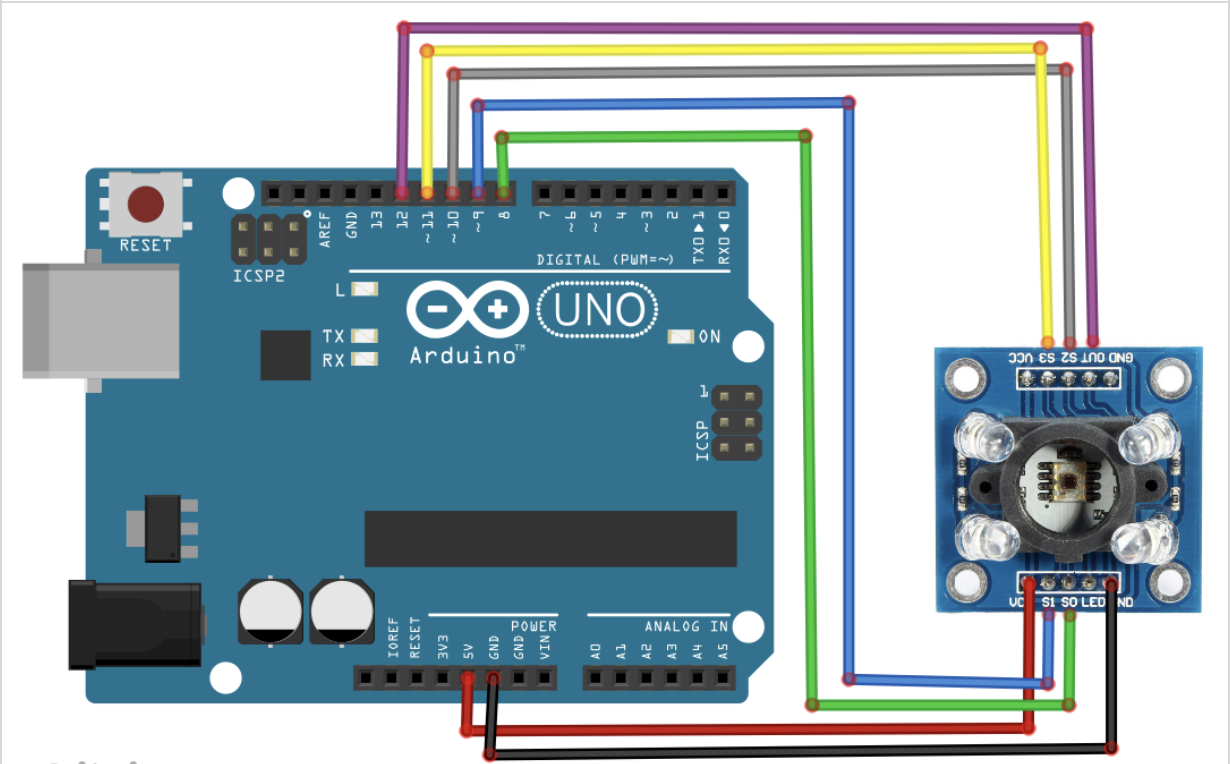
Figure 25.
After this, I attached my UV sensors to my robot:
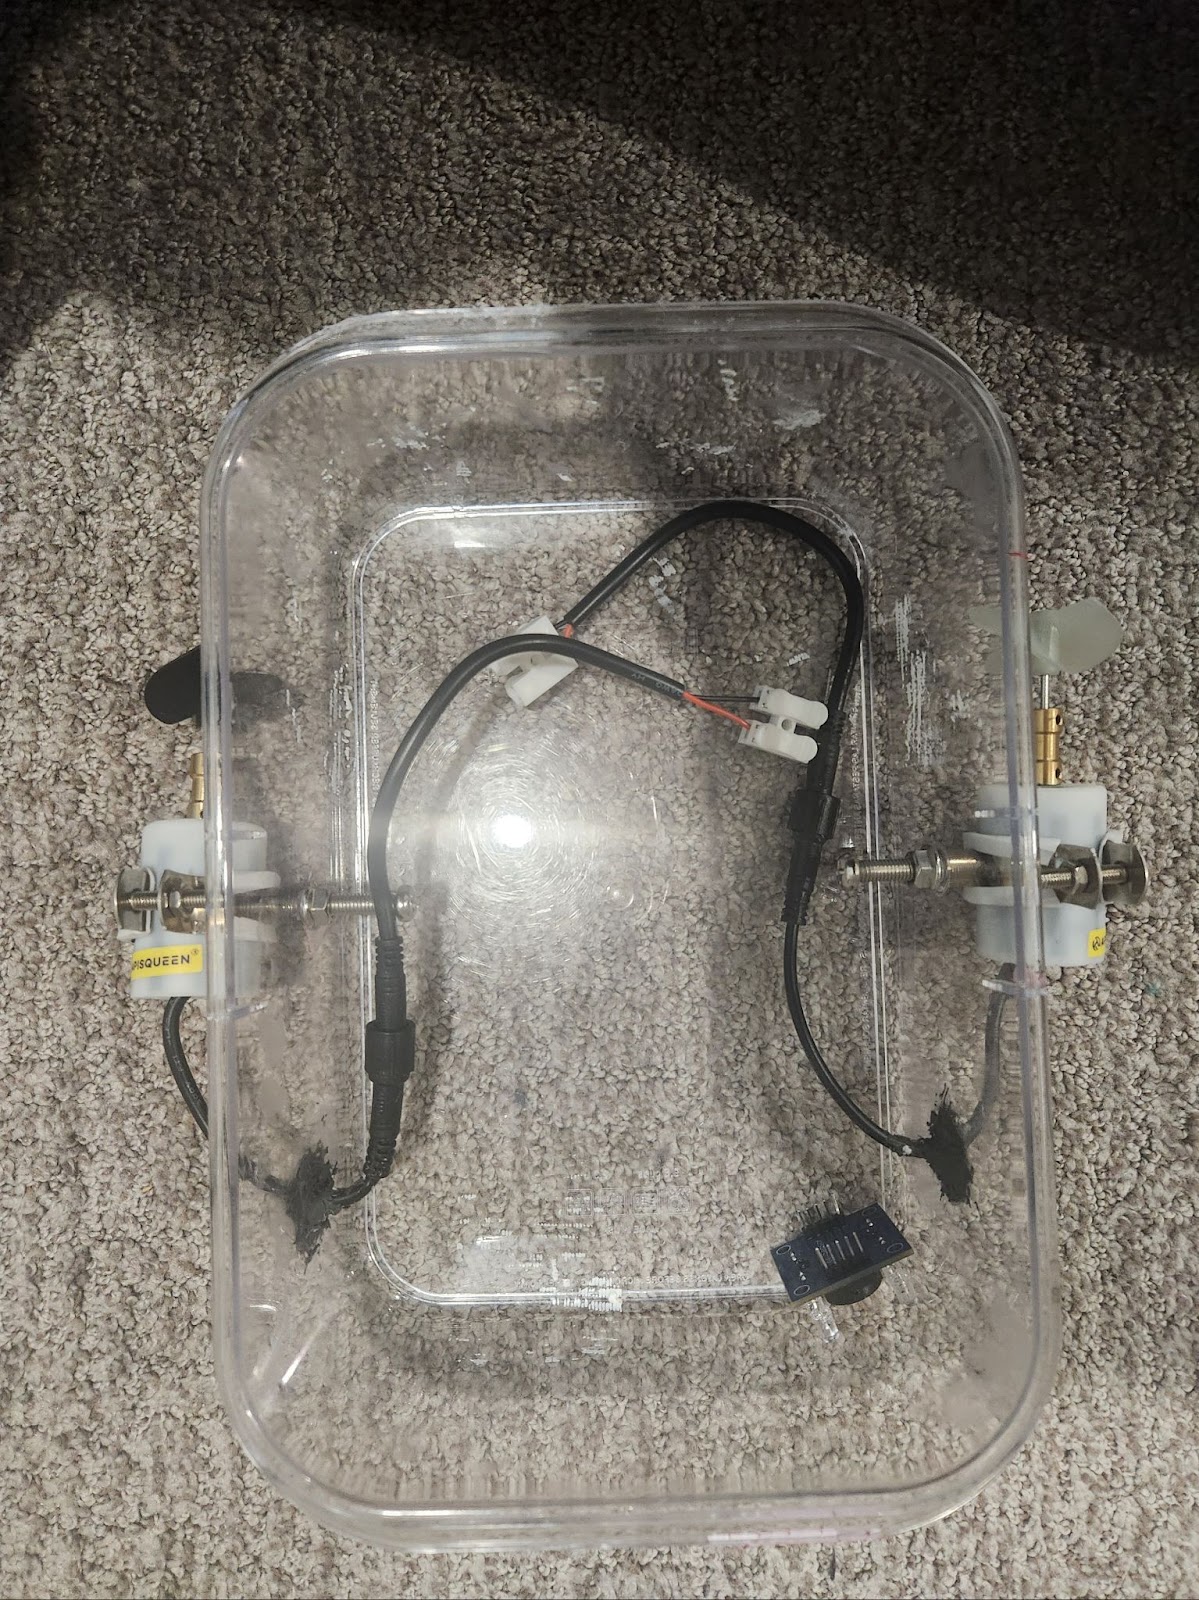
Figure 26. Step 1: Attach light intensity sensor to the top left corner of the robot
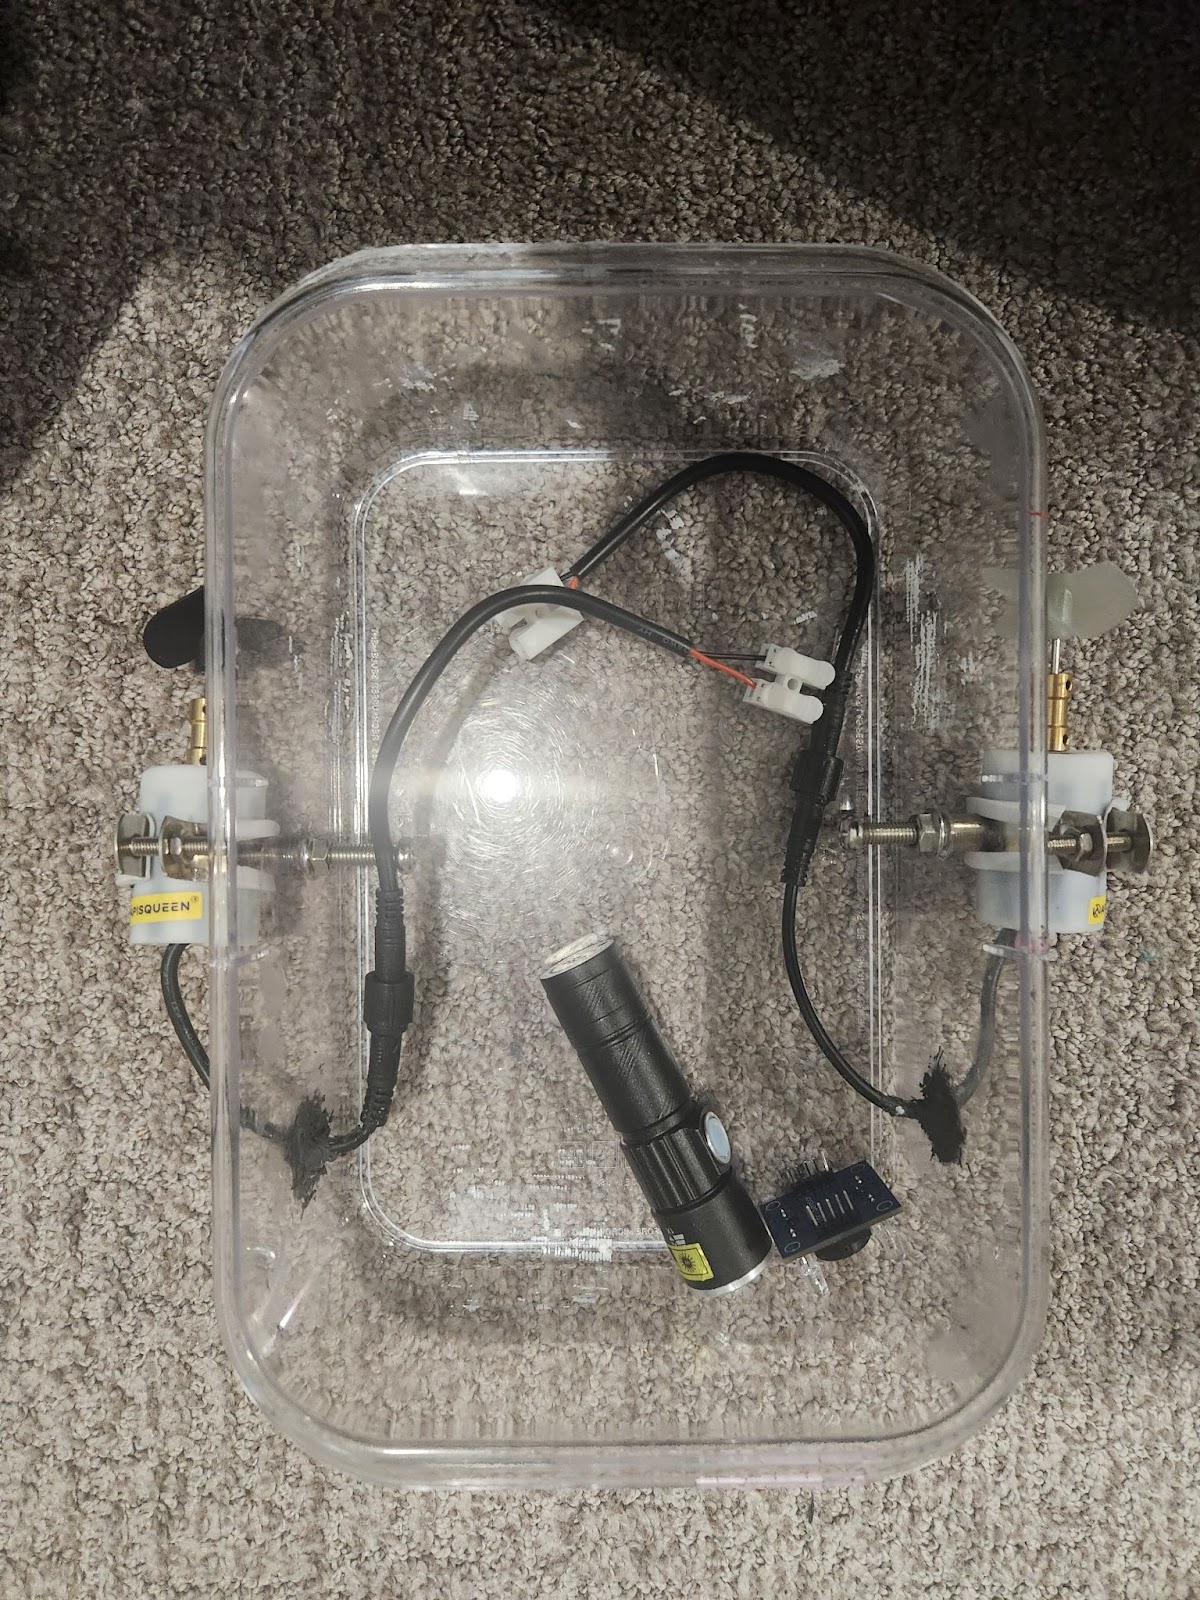
Figure 27. Step 2: Attach the UV flashlight right beside the light intensity sensor so both are in the same range
Figure 28. Photodetector device which captures light signals, used for various applications from communication to sensing. Source: Wikipedia
I began by testing how UV affected the plastics. I positioned the UV light and the photodetector together so they were both in the same target range. I then put a piece of plastic approximately 7 centimetres away from the robot. The full range exceeds 15 centimetres, but I found that the best results come if the plastic is 7 cm away from the robot. Then I started testing my plastics. I first collected clear plastics from each of the 6 plastic categories, as clear plastic is most commonly seen in our world. As you can see in the following results, all 6 types of clear plastic show the same results. This means that all 6 types of clear plastic can be identified from my sensors.
LDPE Plastic (not under UV light)
|
R |
86 |
|
G |
98 |
|
B |
145 |
LDPE Plastic (under UV light)
|
R |
5 |
|
G |
251 |
|
B |
230 |
PET Plastic (not under UV light)
|
R |
96 |
|
G |
143 |
|
B |
122 |
PET Plastic (under UV light)
|
R |
6 |
|
G |
251 |
|
B |
232 |
PP Plastic (not under UV light)
|
R |
10 |
|
G |
96 |
|
B |
311 |
PP Plastic (under UV light)
|
R |
14 |
|
G |
253 |
|
B |
230 |
PVC Plastic (not under UV light)
|
R |
86 |
|
G |
211 |
|
B |
289 |
PVC Plastic (under UV light)
|
R |
5 |
|
G |
249 |
|
B |
230 |
HDPE Plastic (not under UV light)
|
R |
62 |
|
G |
131 |
|
B |
187 |
HDPE Plastic (under UV light)
|
R |
6 |
|
G |
251 |
|
B |
230 |
PS Plastic (not under UV light)
|
R |
41 |
|
G |
32 |
|
B |
99 |
PS Plastic (under UV light)
|
R |
5 |
|
G |
250 |
|
B |
227 |
As you can see from these results, all of the 6 plastics without UV light shined onto them have drastically different values. But when UV light is shined on them, they all generally have the same average value: R-5, B-251, and C-230. I also tested this on various pieces of organic matter, and the results were very different!
Robot Filter
Researching, Designing, and Constructing the robot filter
- Current Filters
- Currently, there are many types of filters dedicated to both microplastics and larger plastics in the ocean. For example, the “manta trawl” microplastic filter is commonly seen. However, there are some design flaws in these filters. Firstly, these filters are open to anything; they have a wide open mouth and capture whatever goes into their nets. The problem with this is that unwanted material can go into the filter and get stuck. This material can only be taken out when somebody comes to check on the filter, and by then it might even be too late. Moreover, these filters aren’t effective at classifying the difference between microplastics and other unwanted matter. My final “Gill” design improves both of these problems.
- Filter no 1: Filter in Bot
- Originally, I wanted to put the filter inside the bot for a compact and easy-to-move design. It seemed good initially, but it didn't work out. The container was too small, and having the filter in the middle was risky—water could easily leak in, and replacing parts was tough. For future 3D-printed designs, I might try it again since it could make things more maneuverable. But for now, my current design, which I'll explain soon, still moves well enough to get the job done quickly and effectively. (Show pictures of filter)
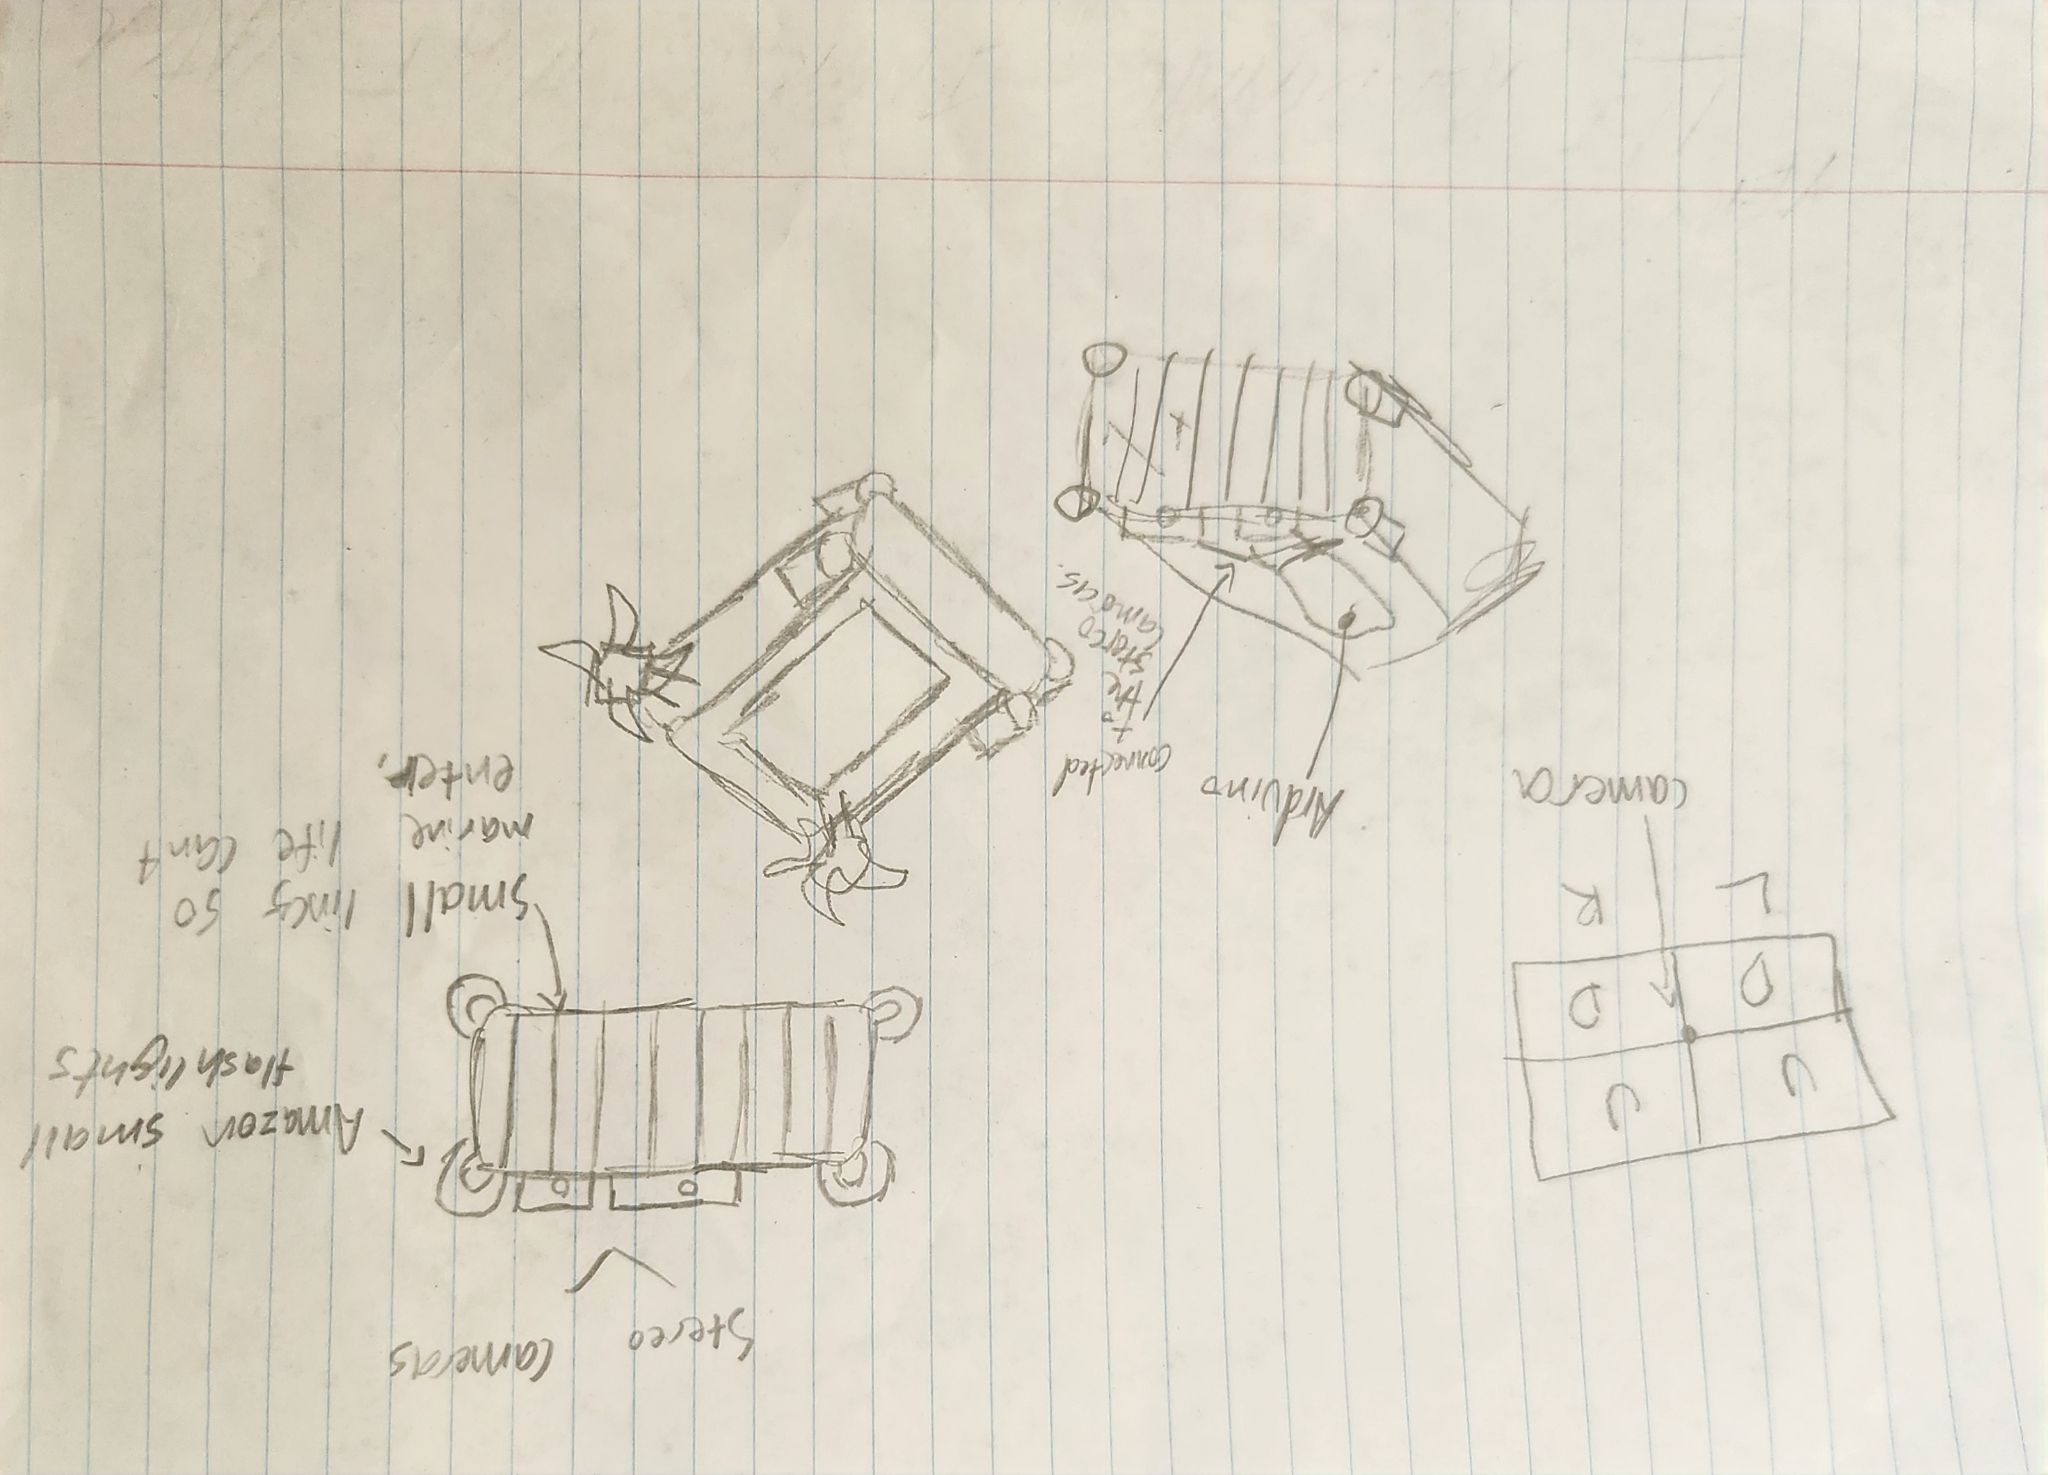
Figure 29. Sketches of the first filter prototype
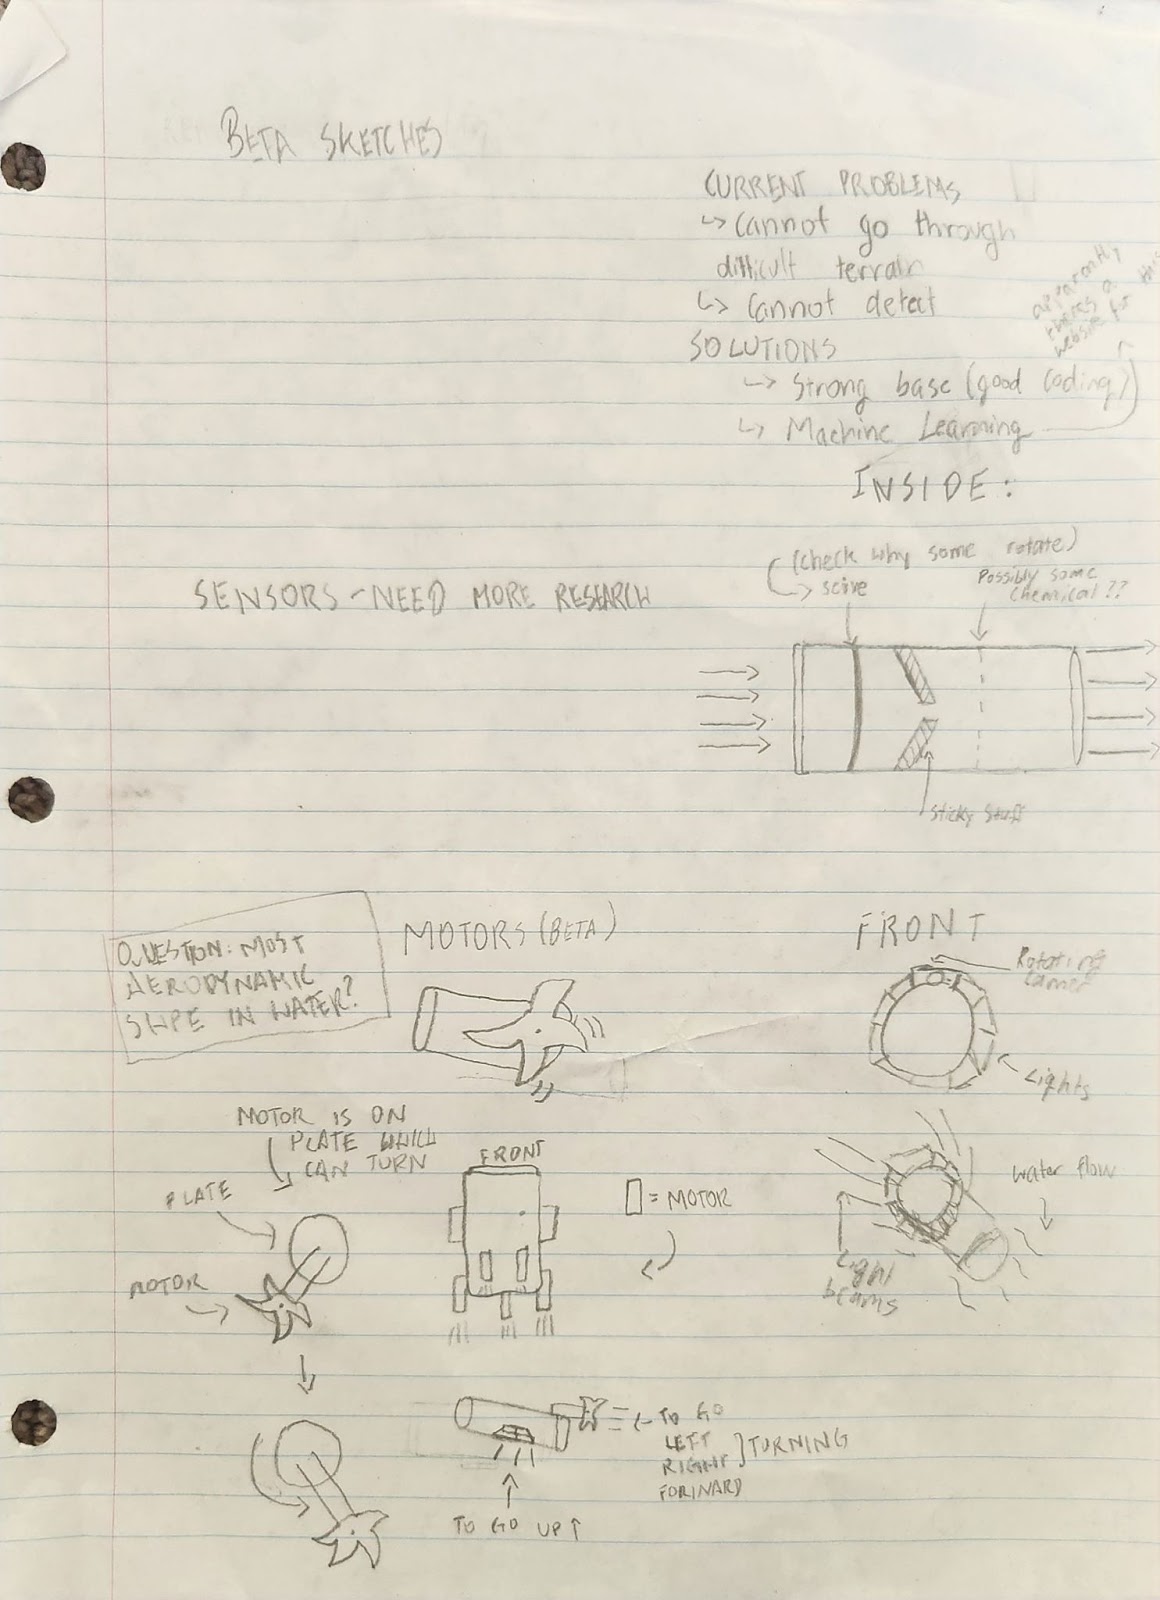
Figure 30. More sketches of the initial prototype
- Filter No. 2: Tube design
- After giving up on the idea of having a filter inside the bot, I opted for an external filter, though still close to the bot. My initial approach was straightforward—a tube with a mesh piece in the middle to let water through while catching plastic. Although the concept was right, using a small mesh made it prone to clogging easily, disrupting the robot's operation due to an excess load after being in the water for some time. In an attempt to refine the design, I explored electrostatic filters and even rotating filters with the idea of generating energy. However, upon revisiting my goals of simplicity and accessibility, these designs didn't align well. They were either too complex to construct or didn't fit into the overall objectives. While these features might find a place in future iterations, for now, they would add unnecessary complexity and pose potential safety risks. There were inherent limitations, like poor underwater aerodynamics, associated with rotating filters that made them less suitable for my current project.
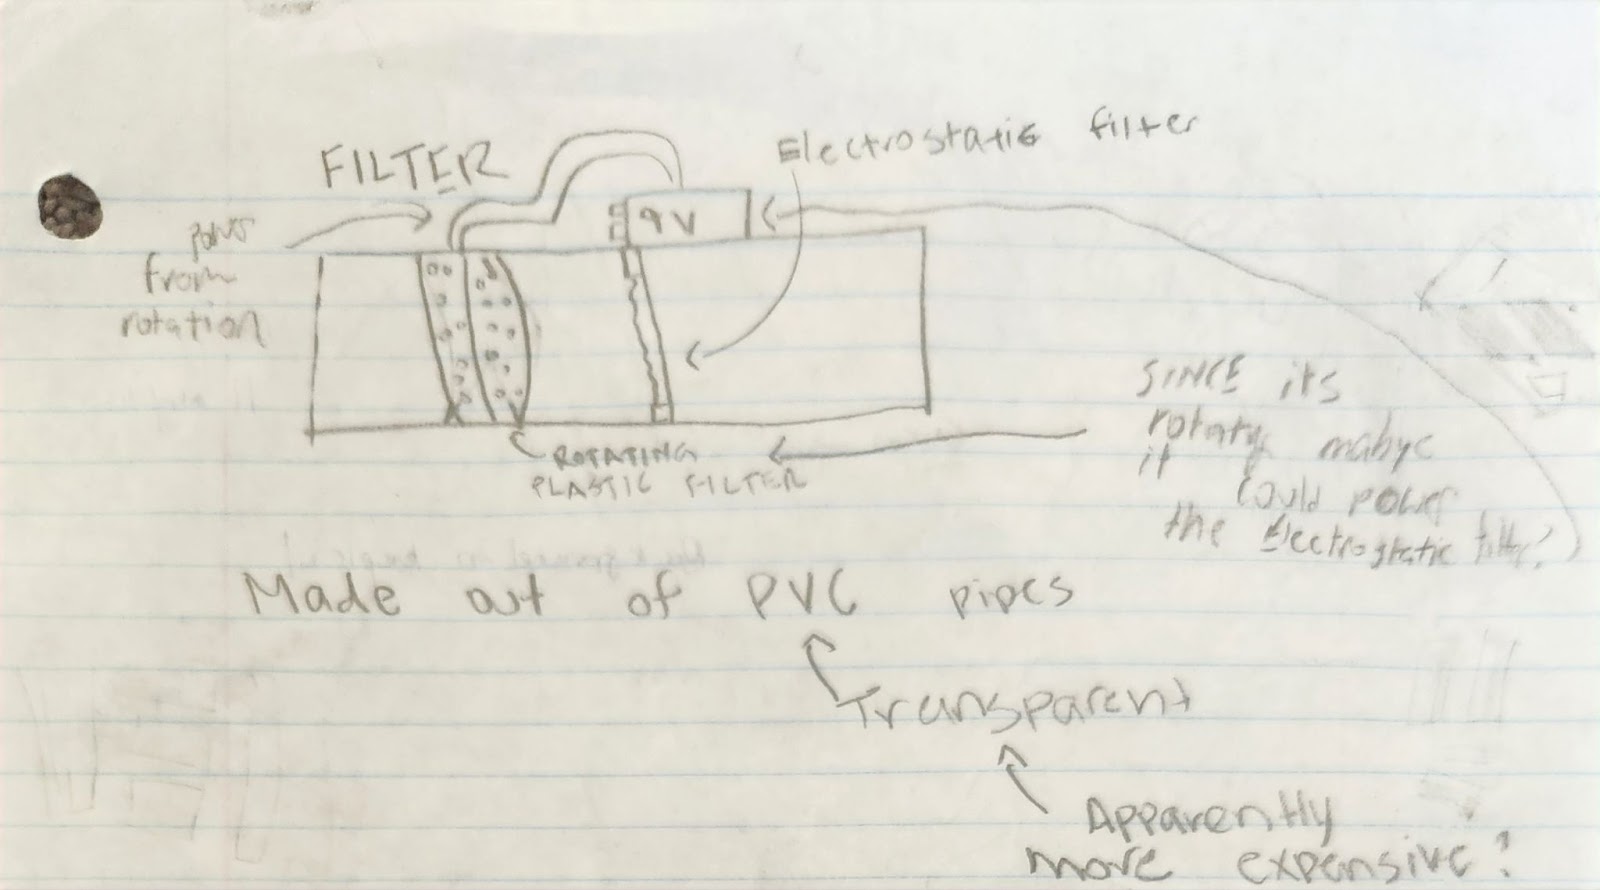
Figure 31. Electrostatic filter design
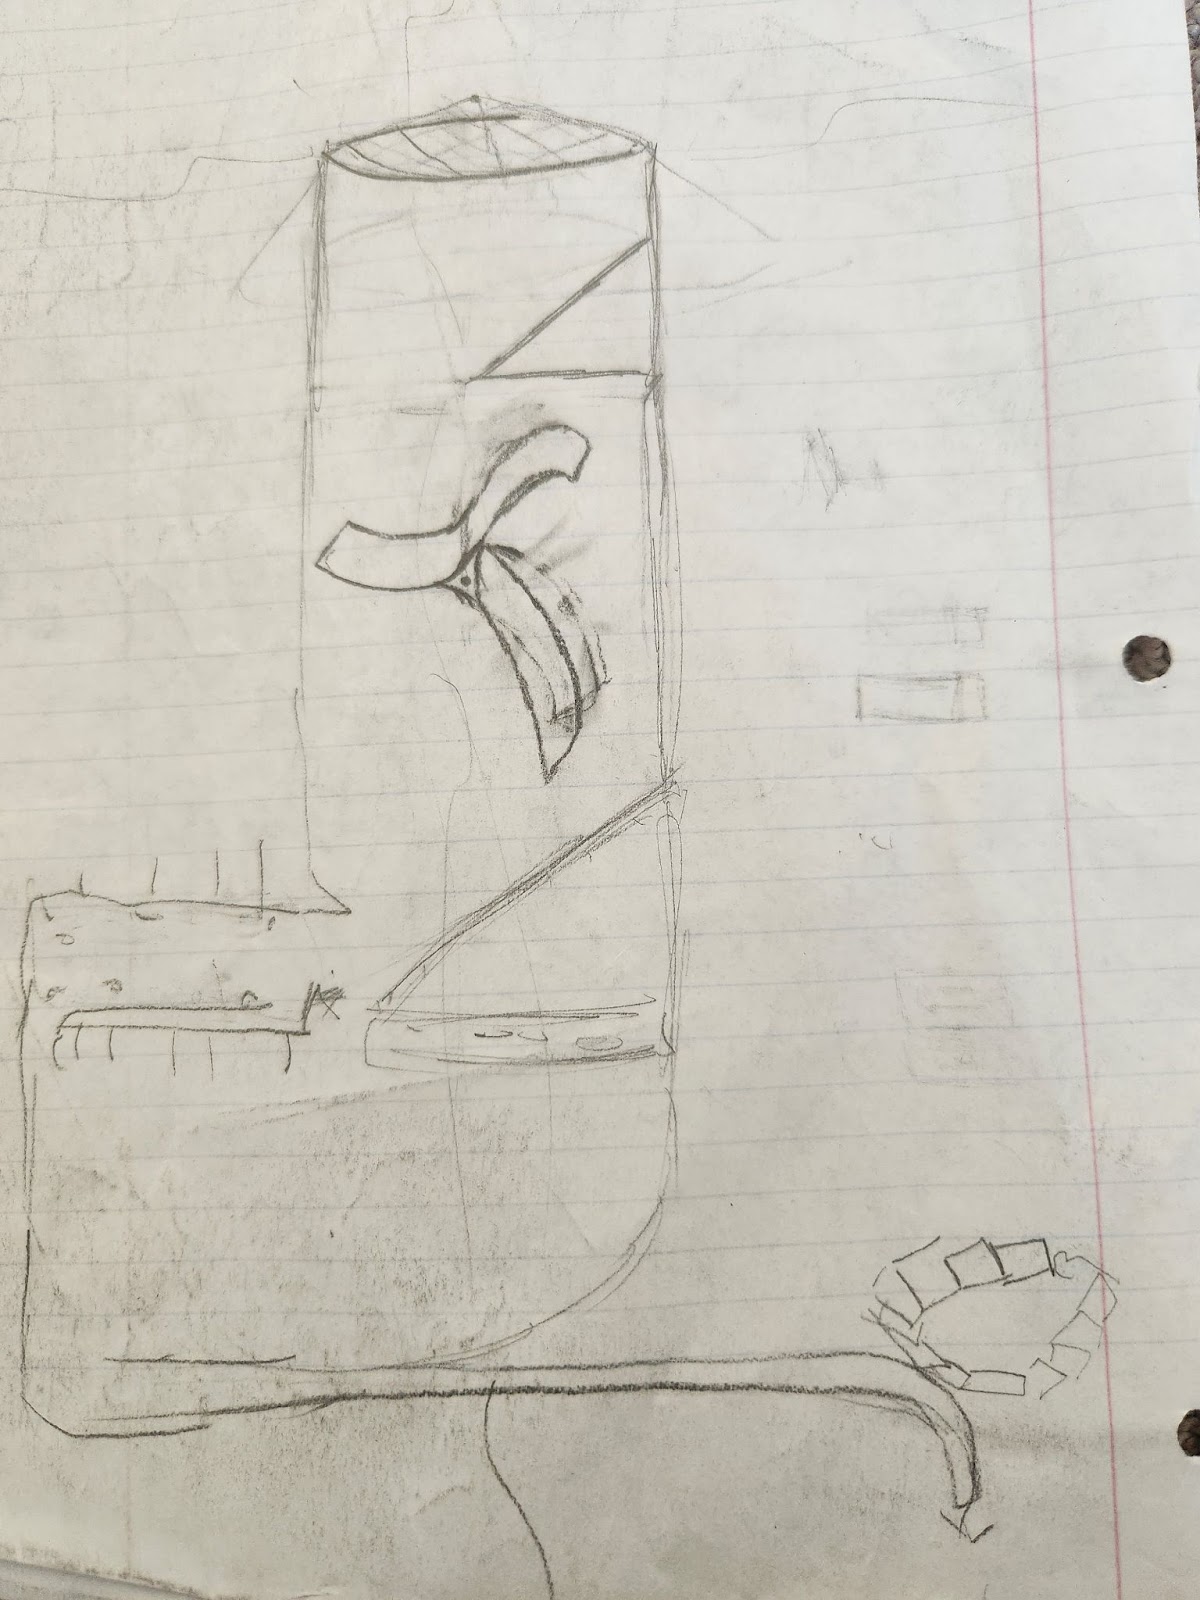
Figure 32. Another sketch of the rotating filter design
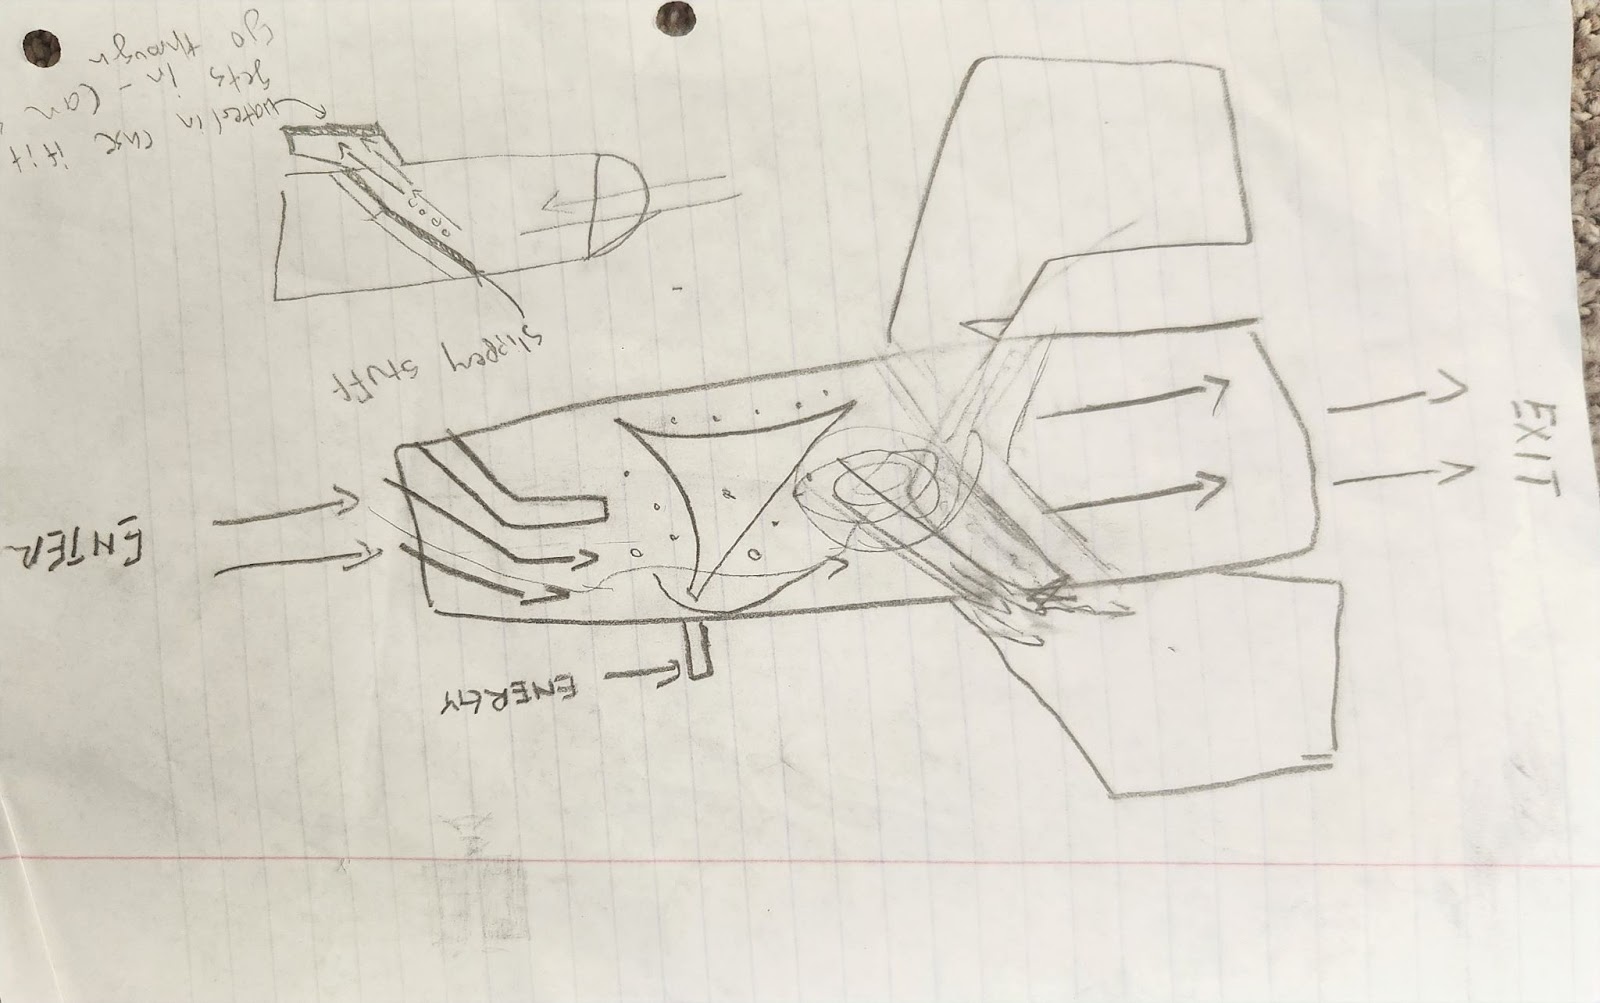
Figure 33. Rotating filter design with “wings” for microplastic collection
- Filter No. 3: Final “gill” Design
- After numerous attempts to perfect the filter, I circled back to my core objectives: simplicity and accessibility. I chose to retain a tube-like design but significantly enhance its effectiveness. The previous design was prone to clogging, a problem I aimed to solve while maintaining aerodynamic efficiency, requiring a compact and straightforward design. In the final iteration, I incorporated elements like mesh and 3D prints but with a novel approach. The design featured three pathways of increasing length, allowing plastics to travel through each one. This ingenious arrangement prevented clogging and, upon closer inspection, resembled a fish's gill—an inspiration drawn from their efficient aerodynamics. This redesigned filter not only excelled in aerodynamics but also efficiently collected microplastics. To optimize the mesh's effectiveness, I sized it to 1 mm, aligning with the typical size of many microplastics. Recognizing potential ecological concerns, particularly regarding organic matter, I sealed the filter entirely. Unwanted materials, if the filter were left open, could enter and be released only when the filter drained. To address this, I sealed the filter and incorporated a servo mechanism to open it only when a plastic was detected by the main body machine. This not only prevented the entry of undesired materials but also maintained the filter's aerodynamic efficiency. Strategically placing the filter on the left side of the sensors addressed limitations in the detection area. Although I couldn't place a filter on the other side due to the robot's design, I envision overcoming this constraint in the future with a rotating sensor. A 360-degree detection angle would undoubtedly enhance efficiency, speed, and effectiveness. For the code implementation, I devised a simple algorithm: if plastics were detected by the machine, the servo would open, prompting the machine to move right and forward for two seconds. This brief maneuver ensured that microplastics were collected effectively, allowing the machine to seamlessly resume its regular tasks.
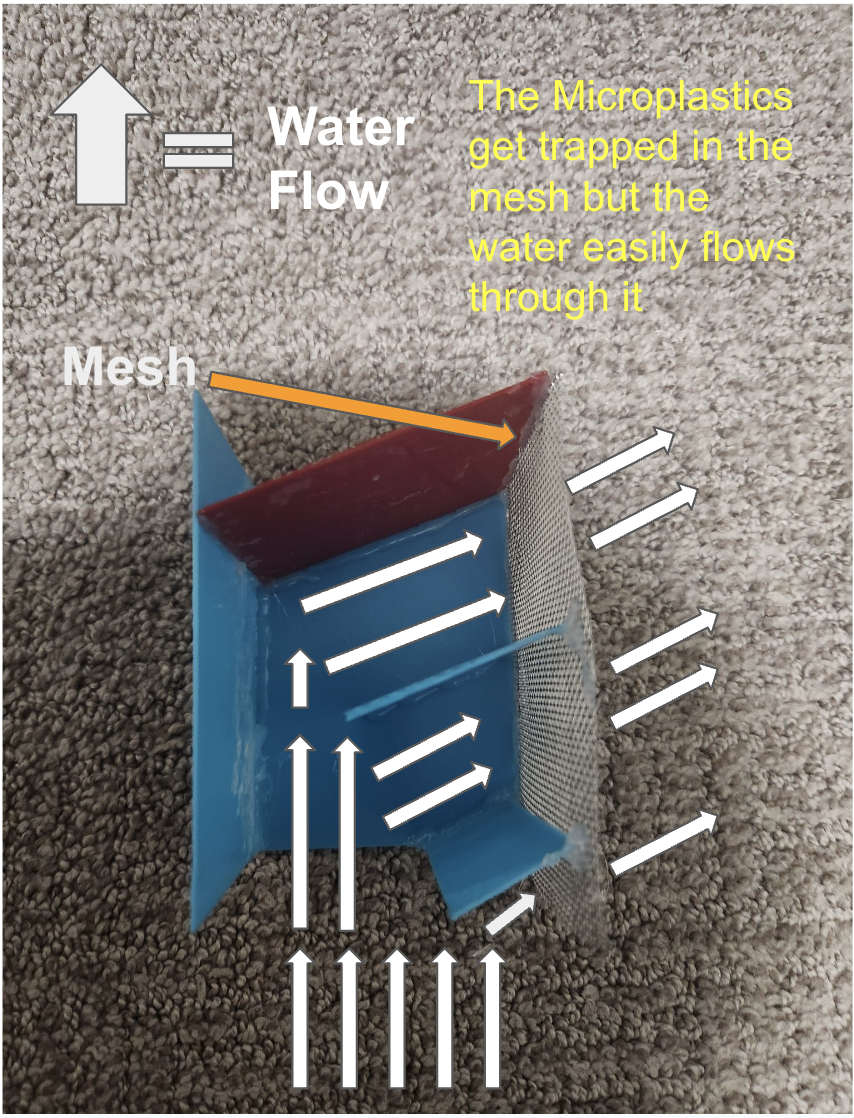
Figure 34.
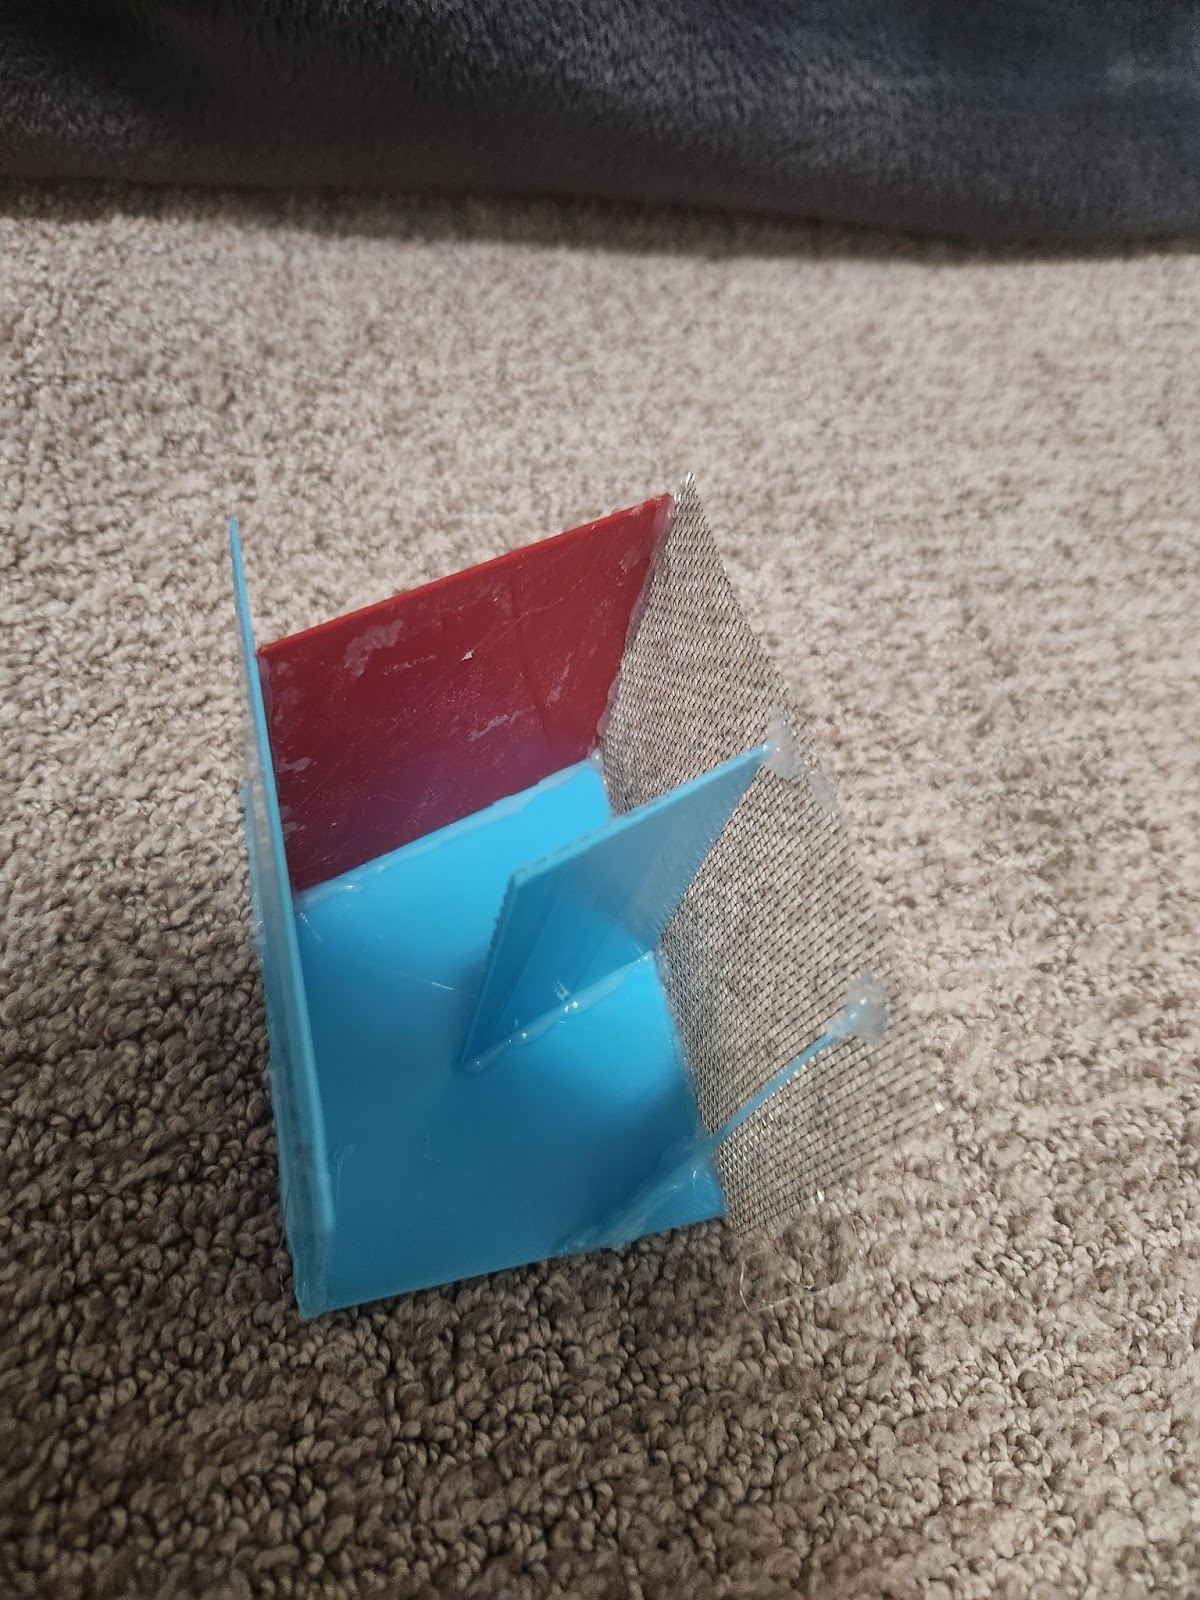
Figure 35.
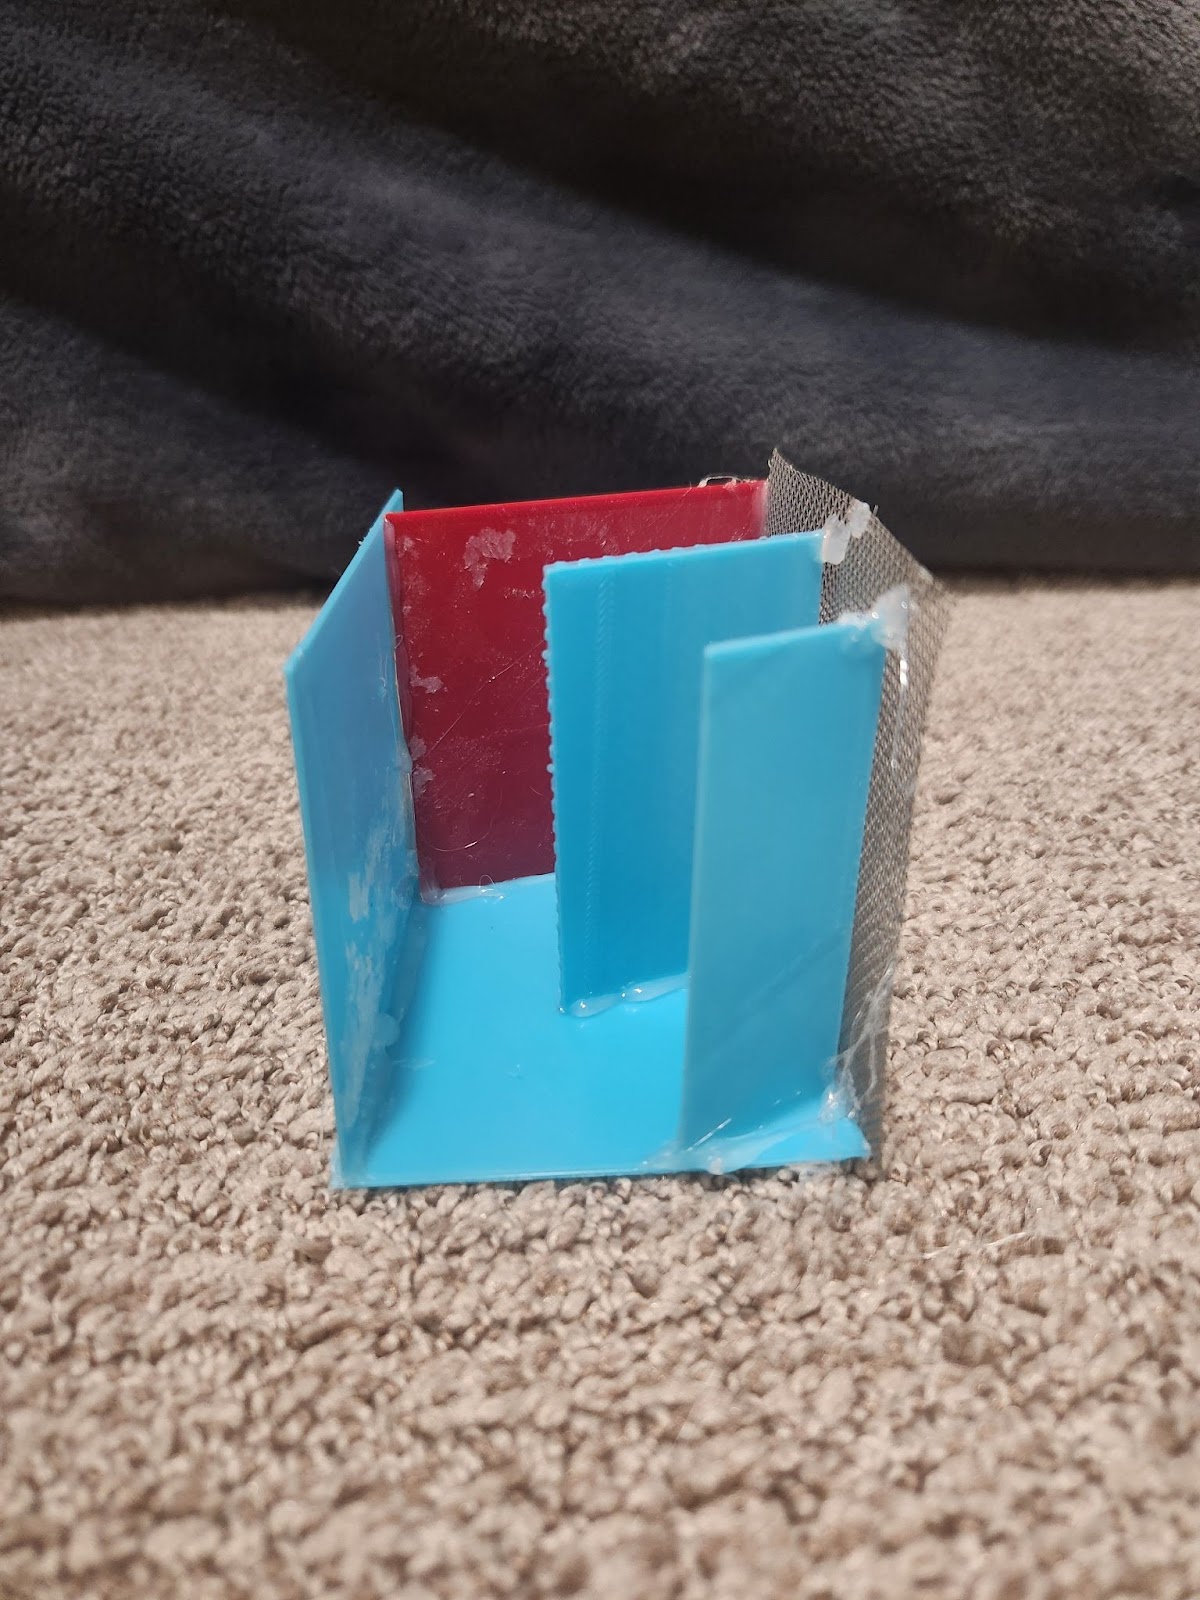
Figure 36.
Method for final “gill” design
Materials:
- 6 custom 3D prints
- 10 by 7 centimetre 1mm flexible mesh
- Flex Seal’s Flex Glue
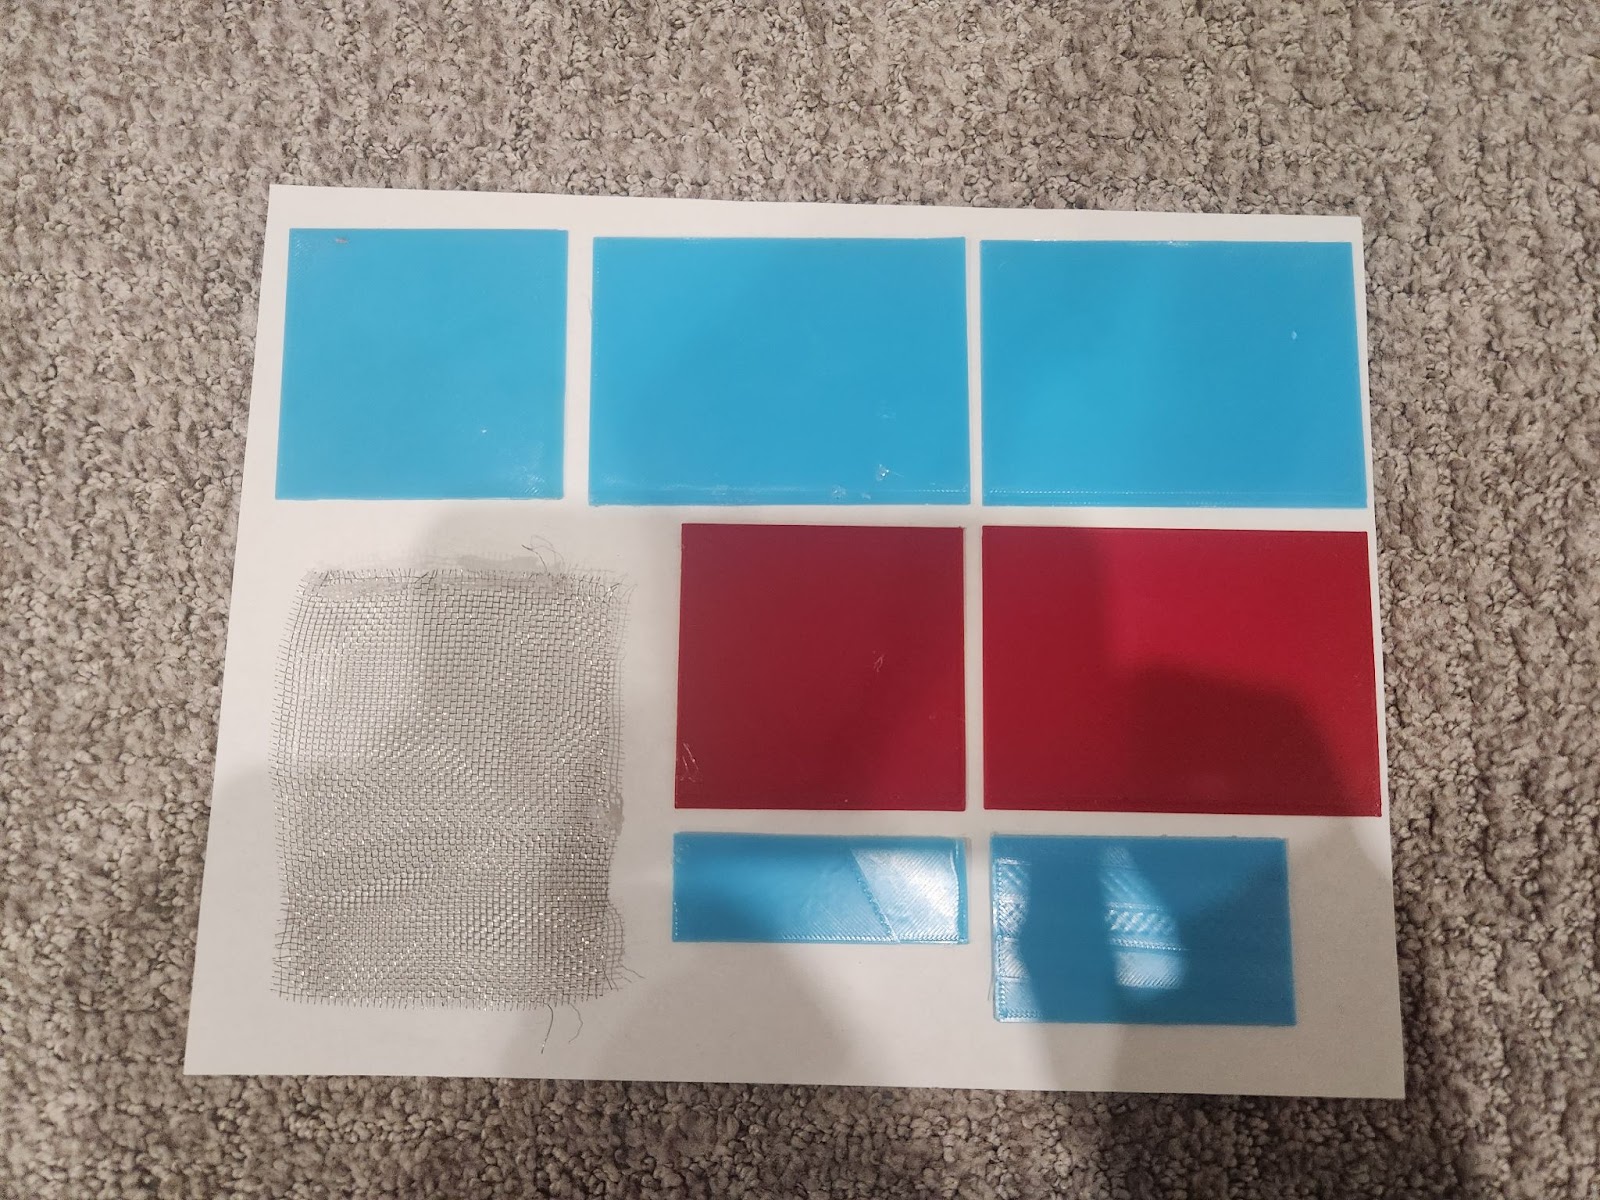
Figure 37. 6 custom 3D prints for the final filter design, along with a 10 by 7 cm 1mm flexible mesh
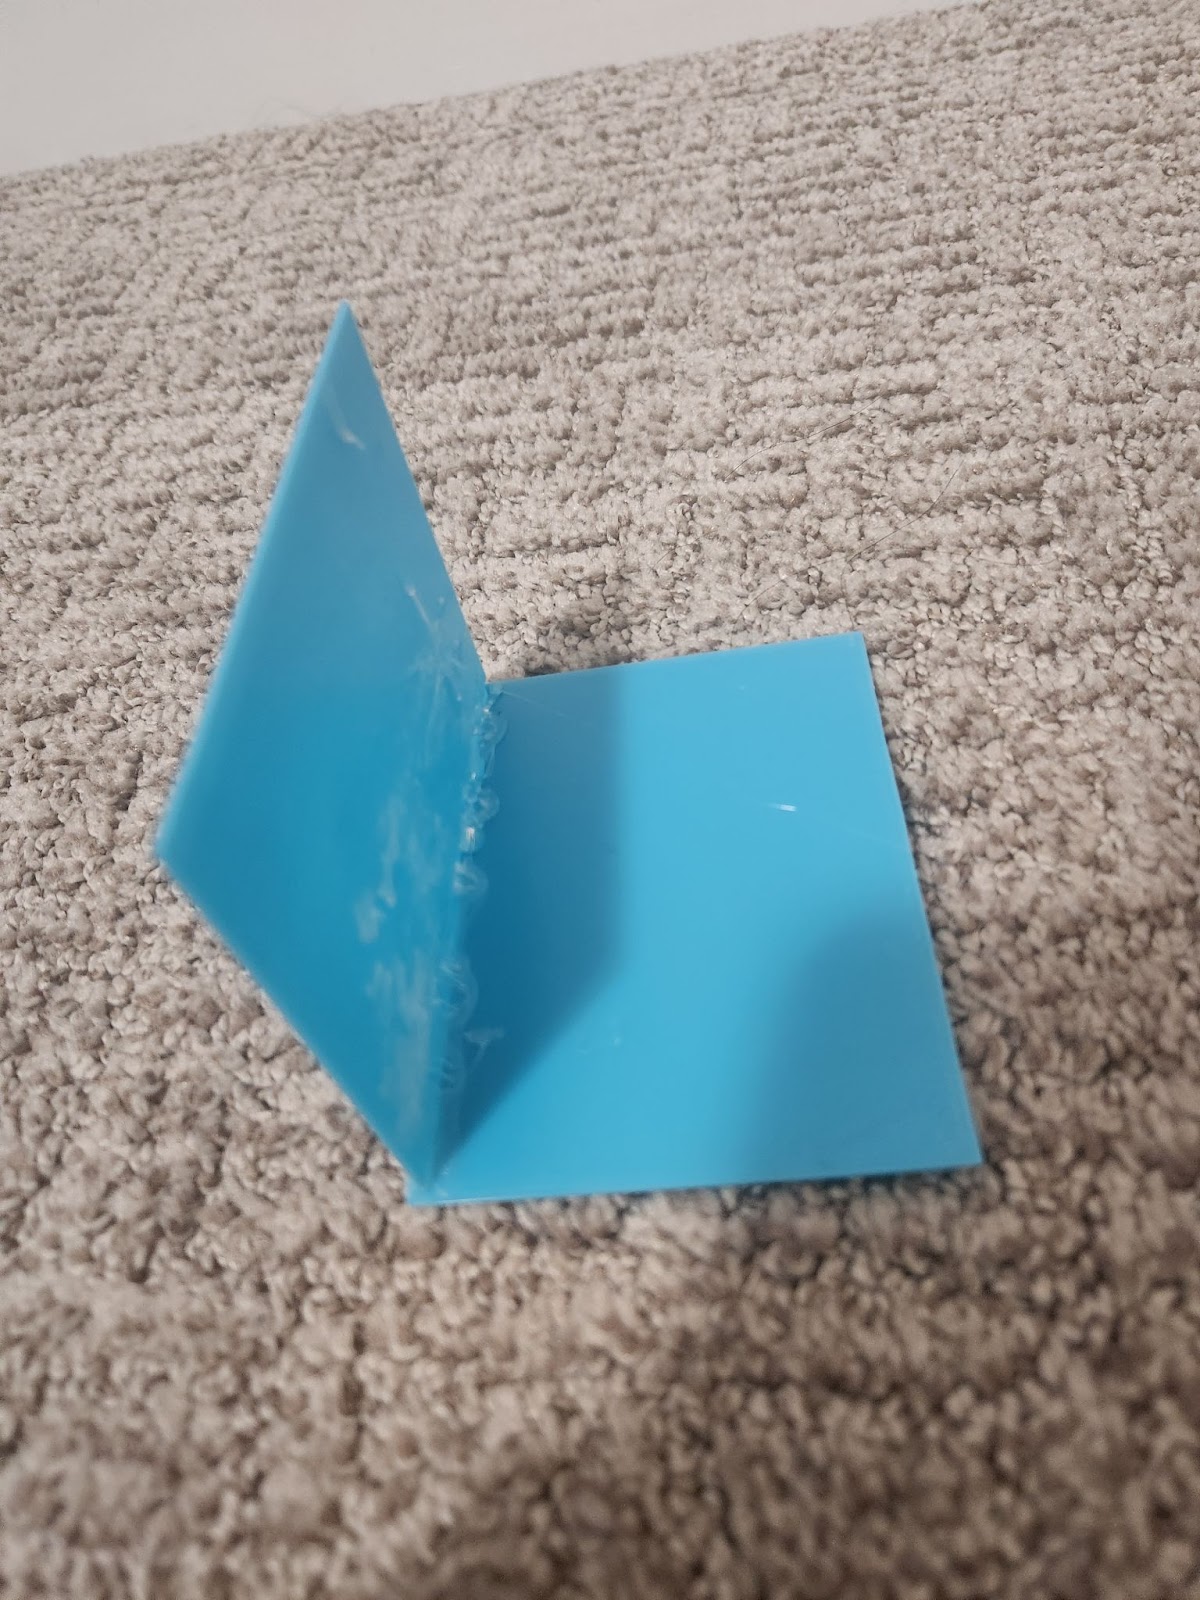
Figure 37a. Step 1
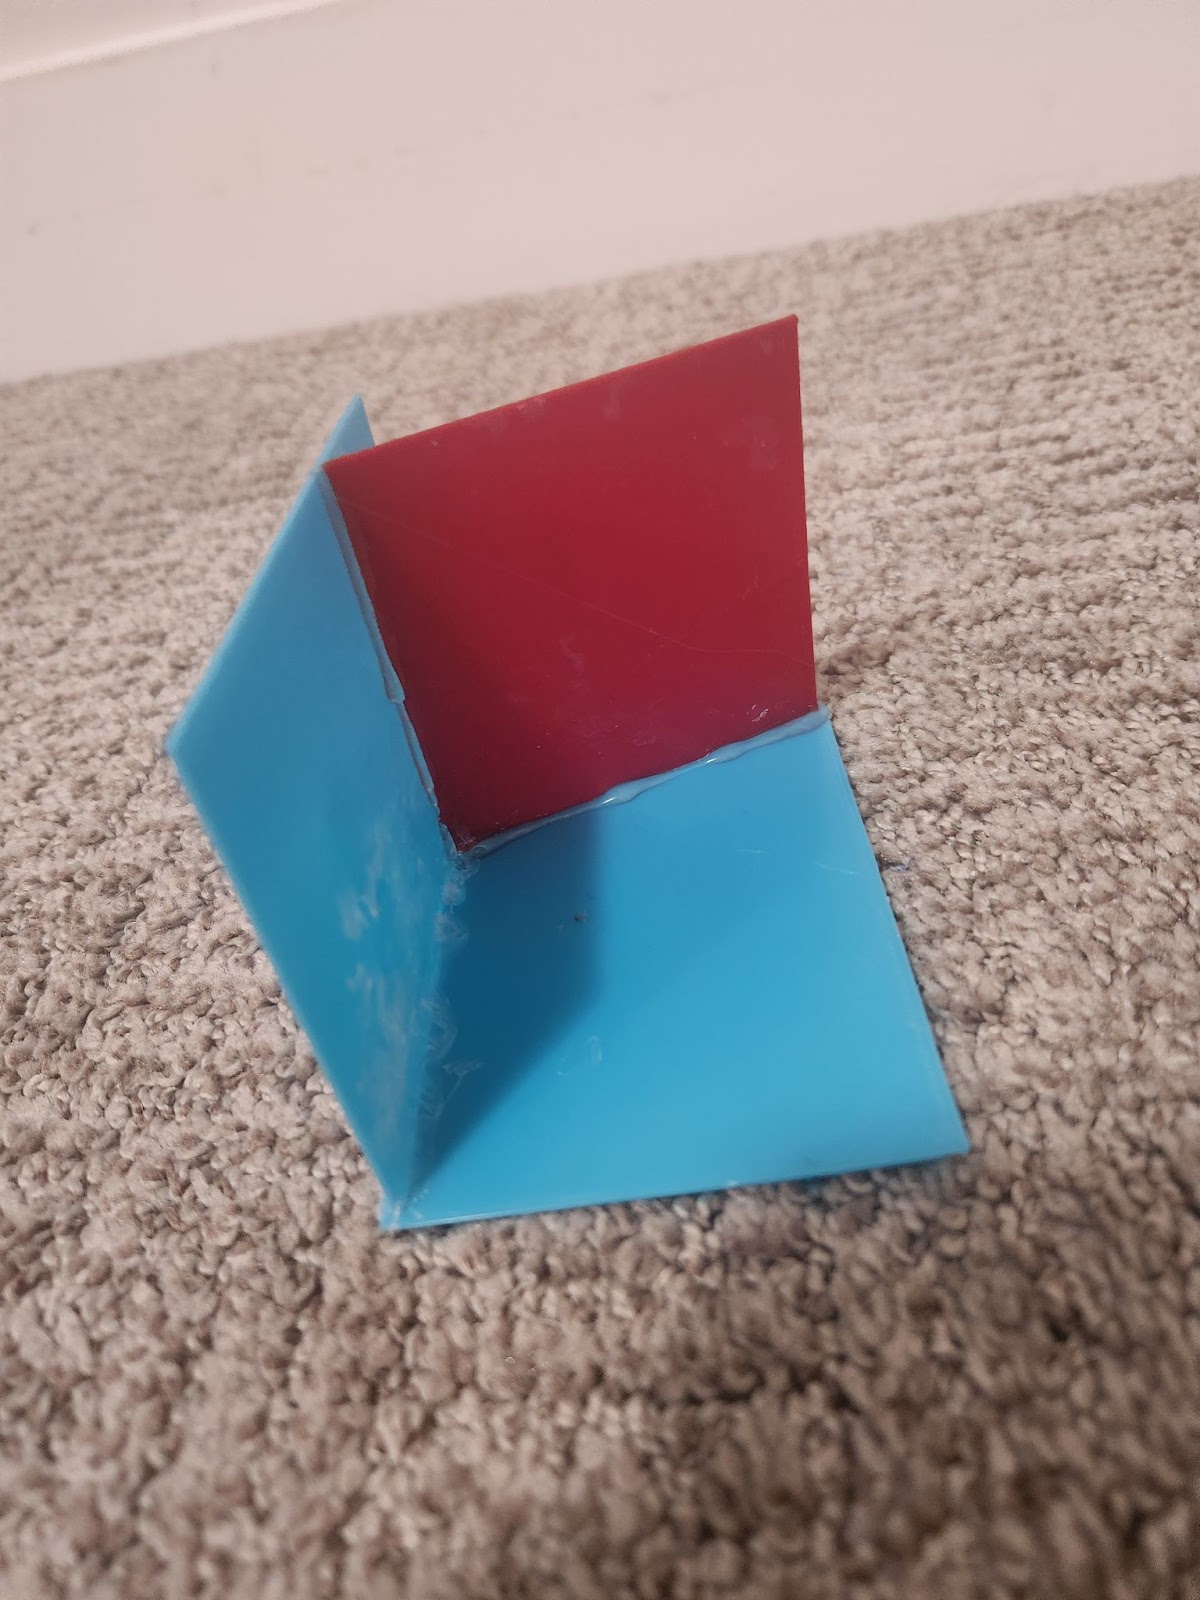
Figure 37b. Step 2
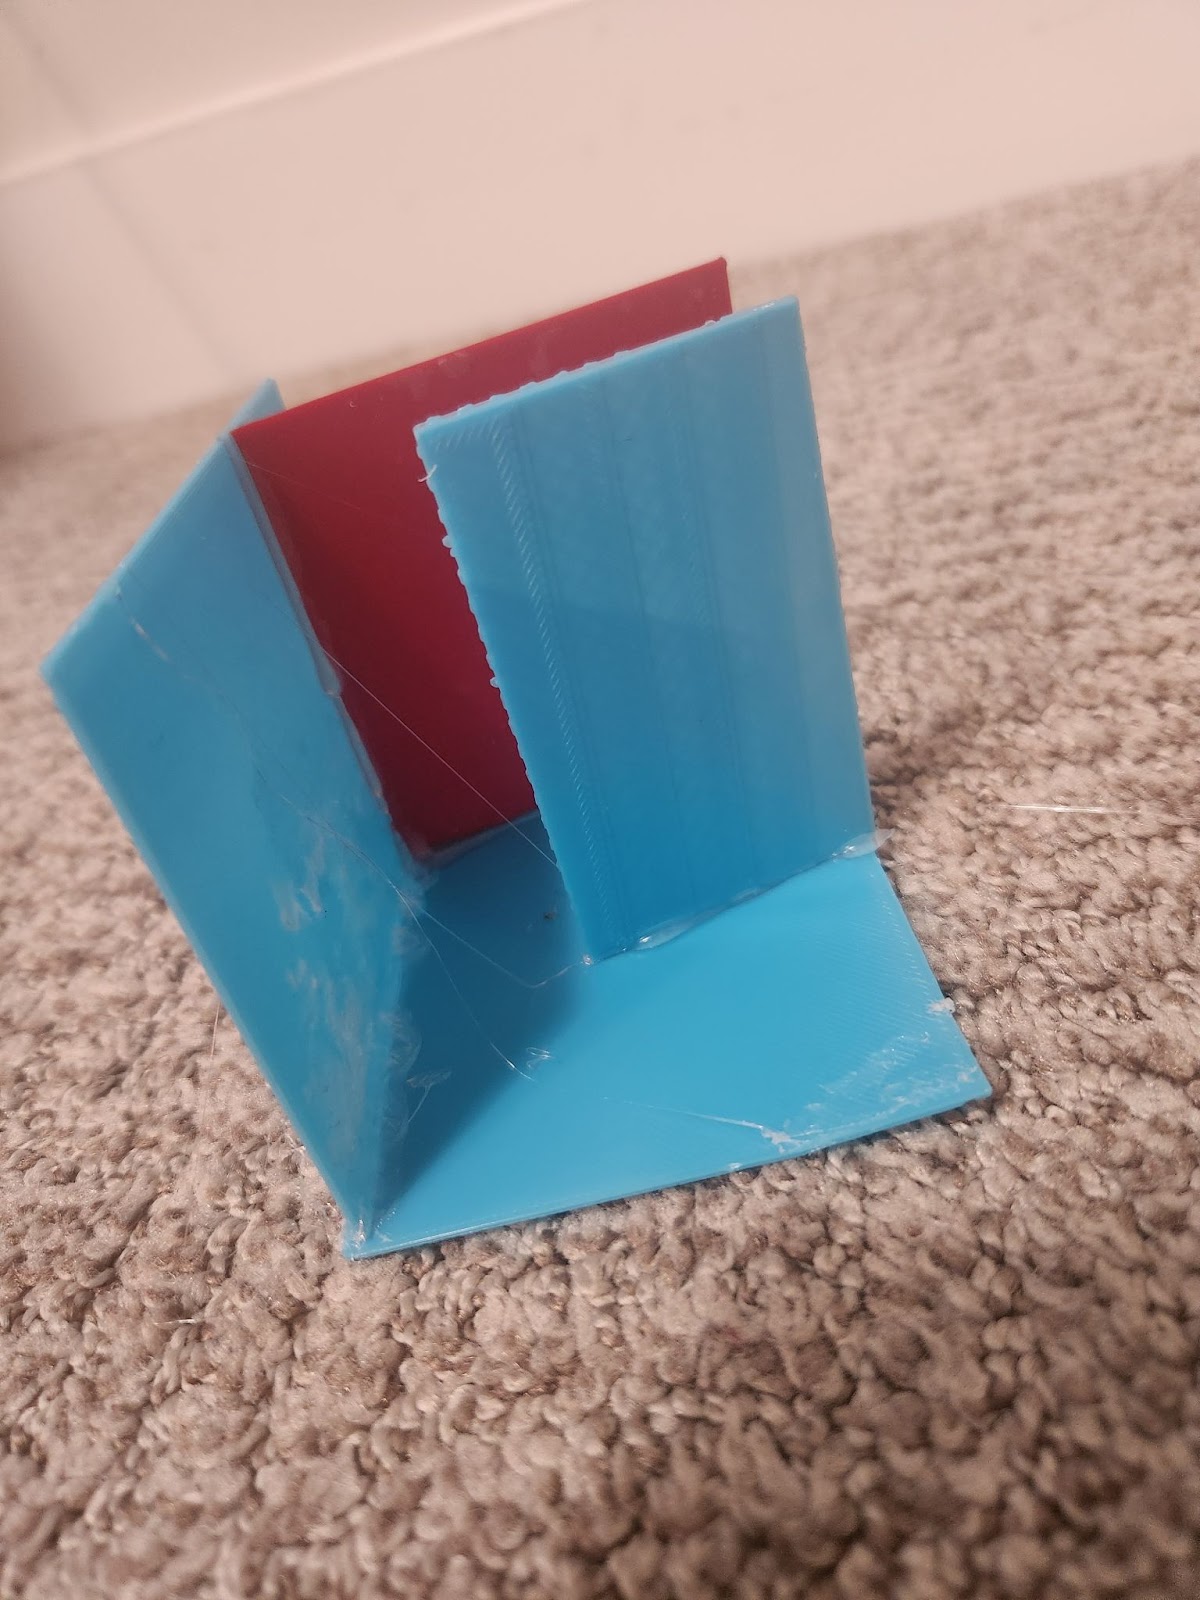
Figure 37c. Step 3
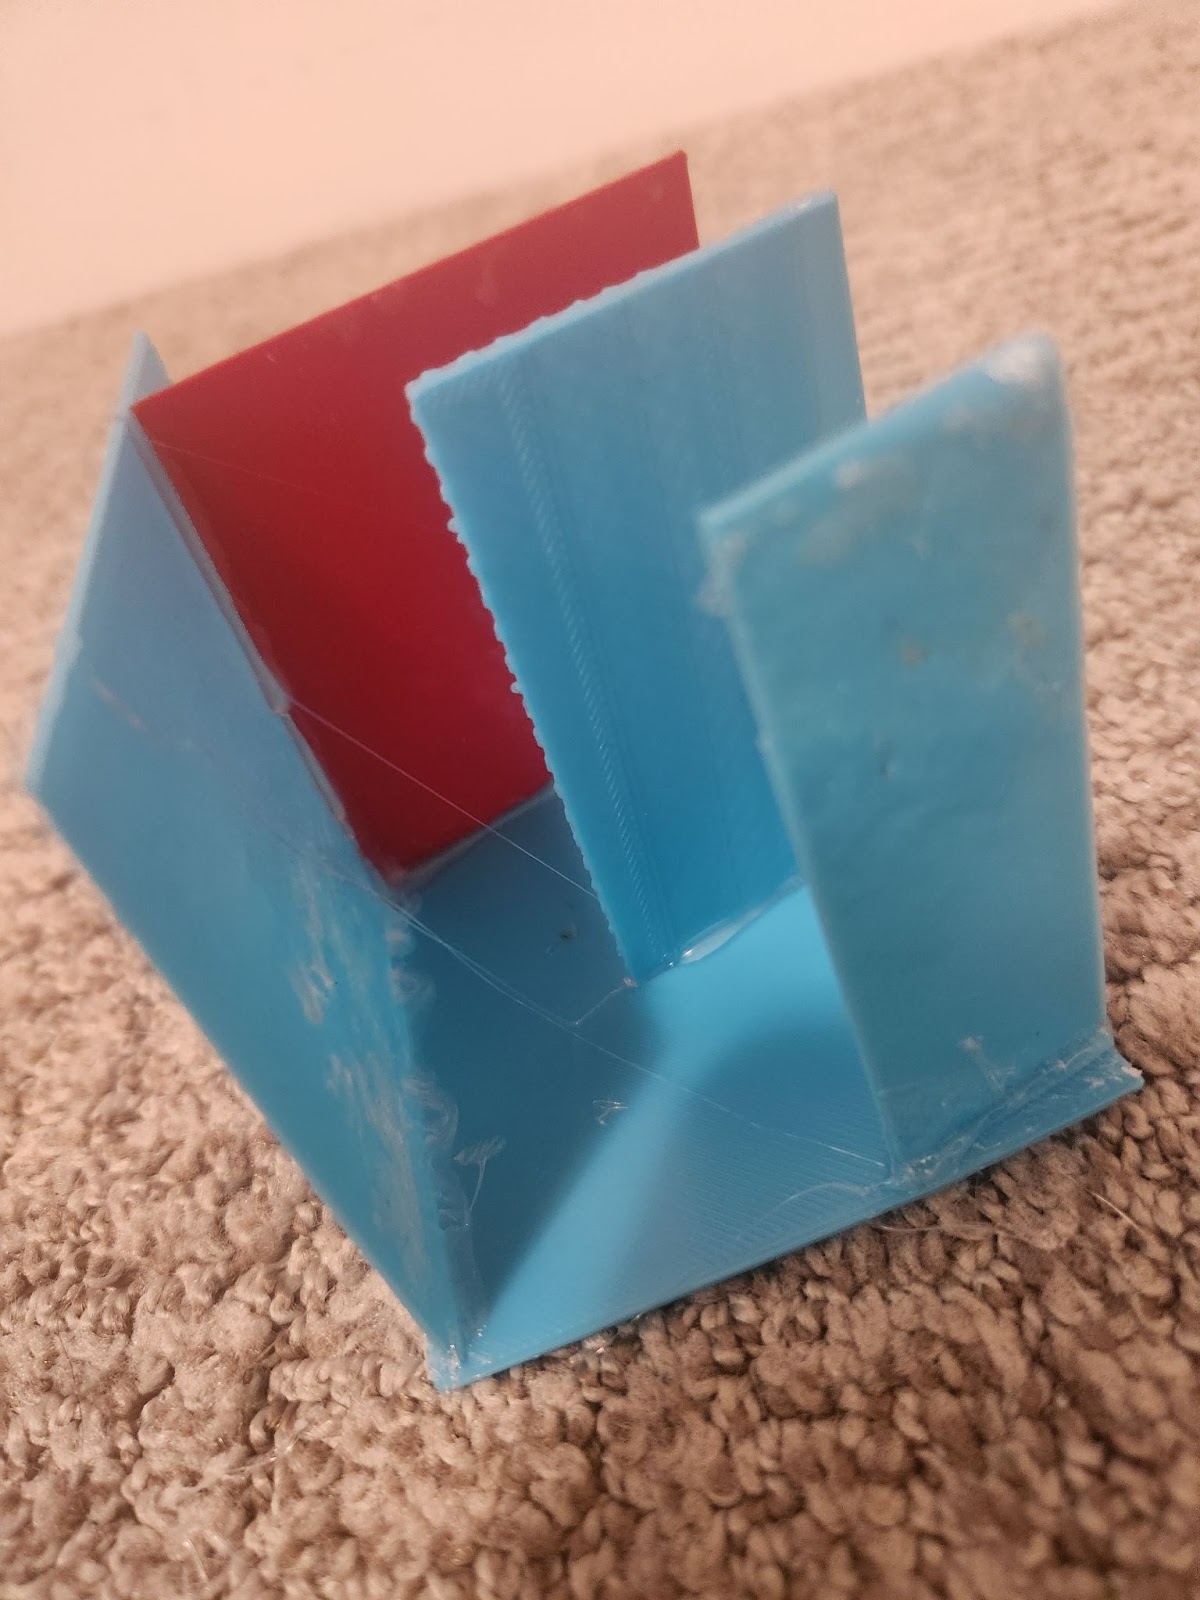
Figure 37d. Step 4
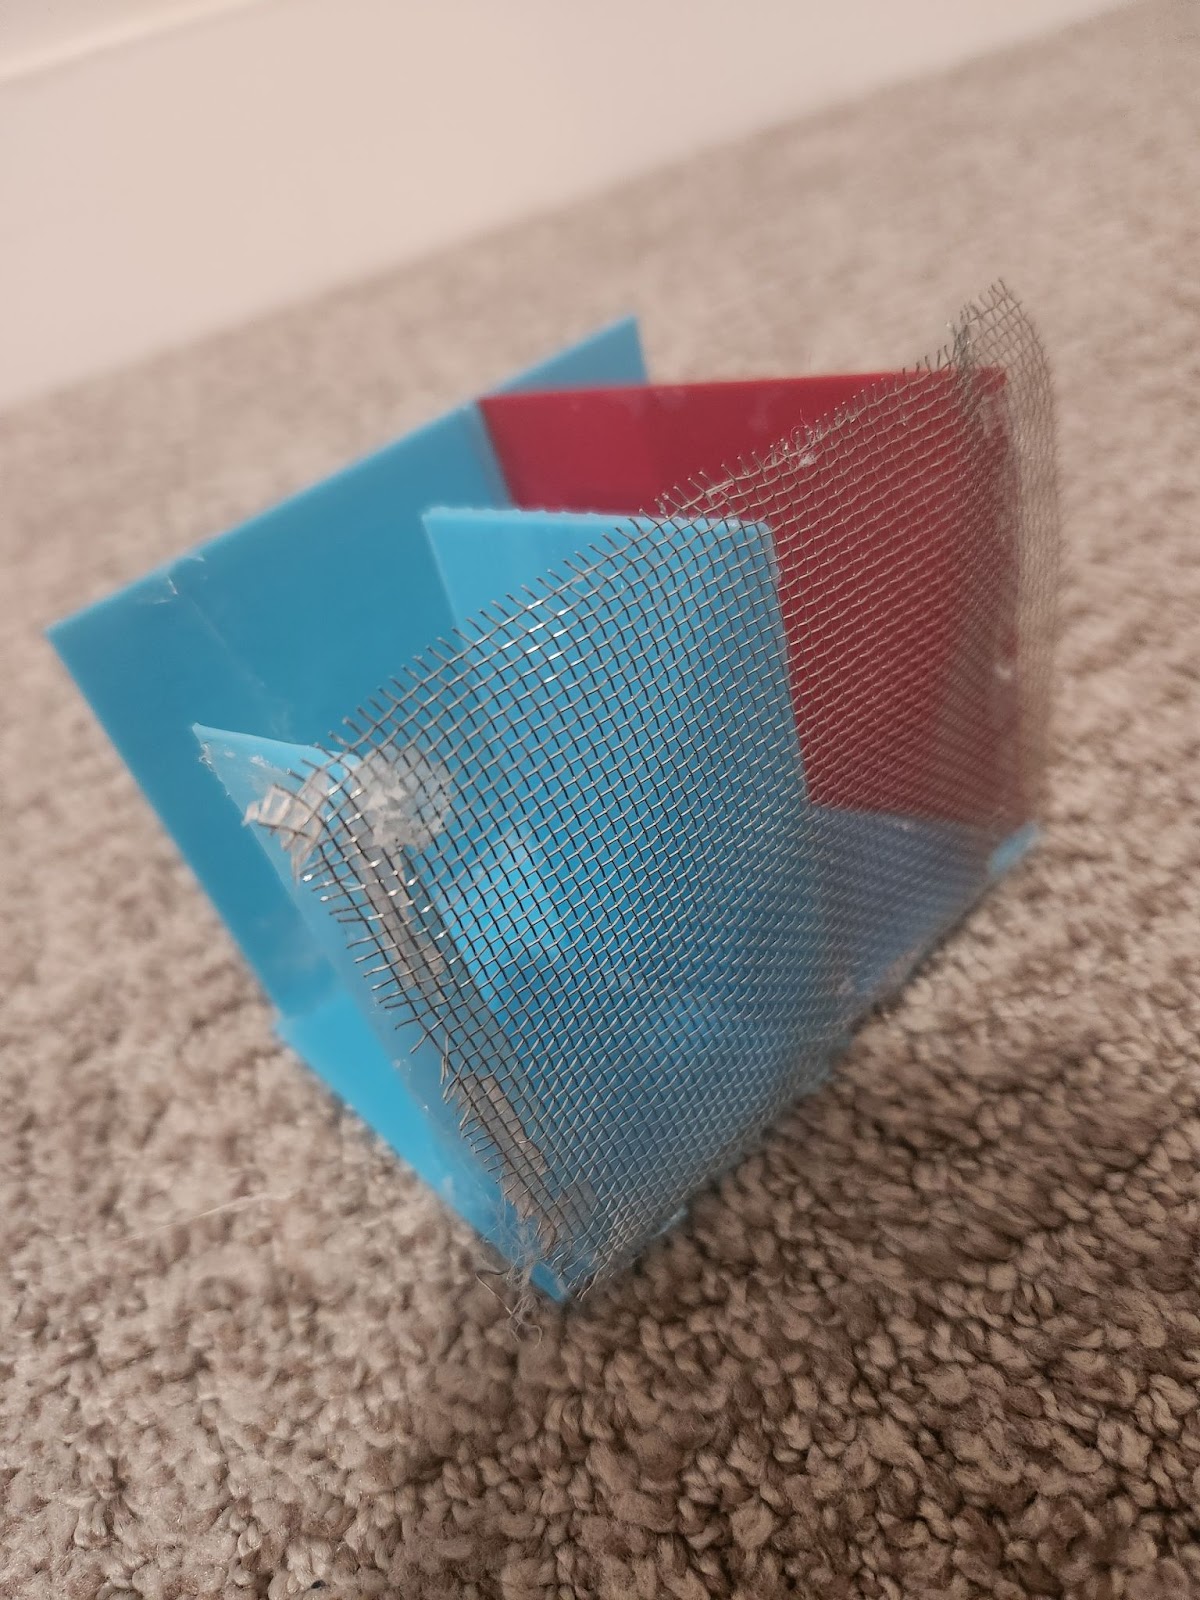
Figure 37e. Step 5
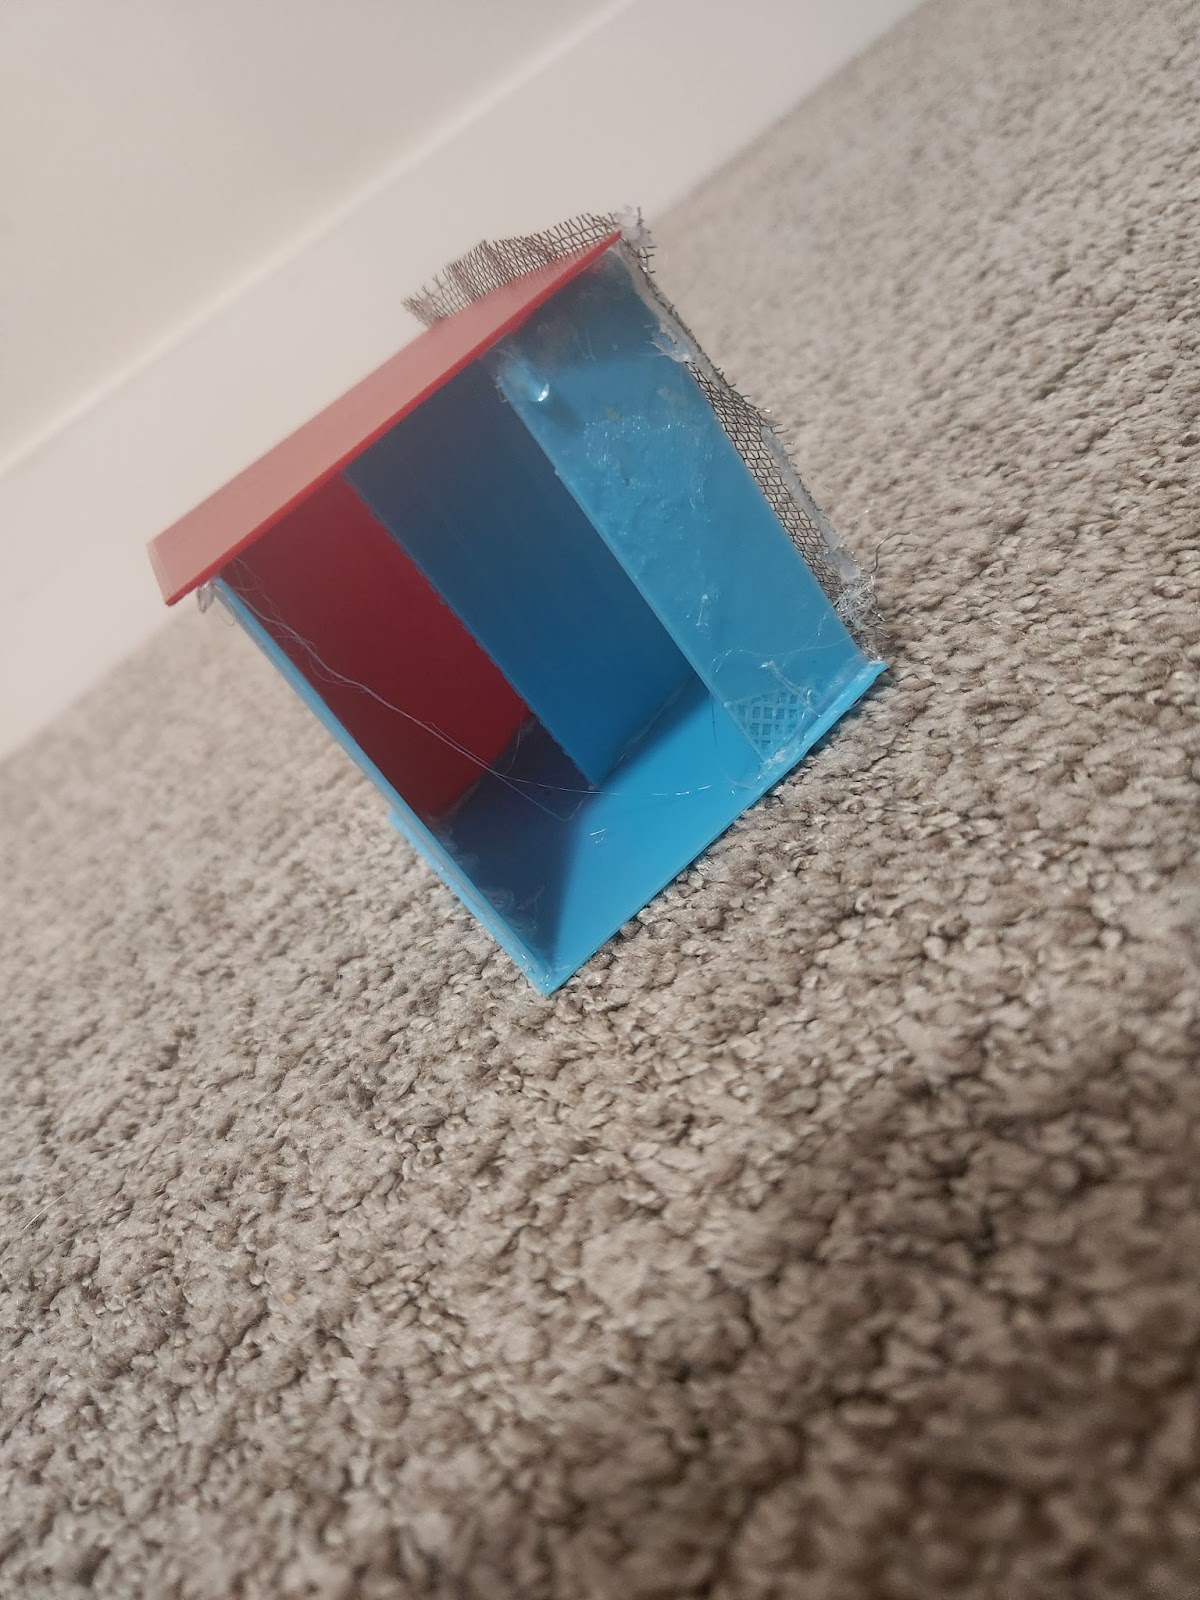
Figure 37f. Step 6
Analysis
Analysis of the Robot
Results from TF-Luna Lidar Distance Sensor
Results from the TF-Luna Lidar Sensor
I tested the sensor my bathtub filled with water since none of the ponds or lakes in Calgary had yet thawed at the time. However, I still tried to imitate a pond-like water environment in my bathtub even in this scenario. I added dirt, sticks, stones, etc. Of course, I did not add any animals because I had access to none. The hull was pressed against the water's surface so that no air was in between plastic and water. I lowered a robot into the water and started moving it up and down to try different distances.
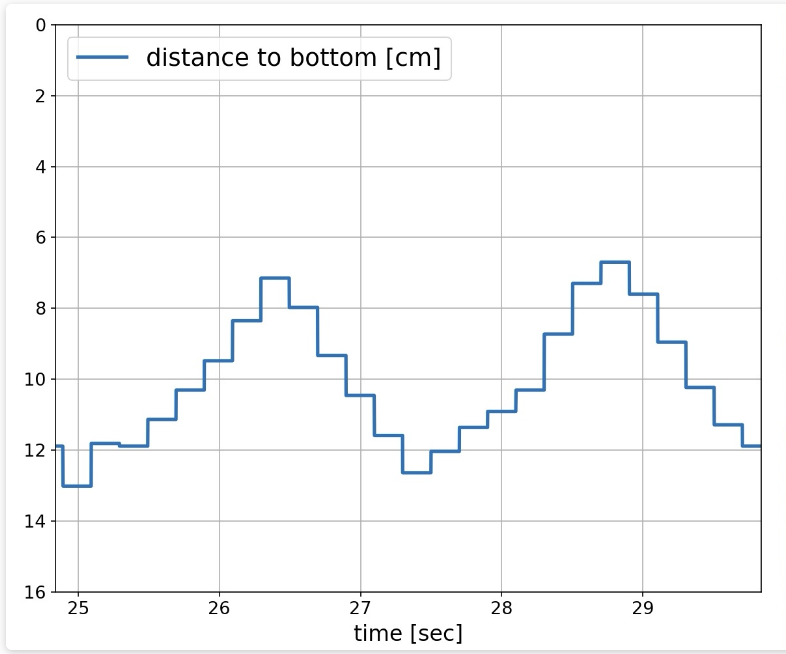
Figure 1. Testing depth accuracy in the TF-Luna Lidar Distance Sensor. I went for about 30 seconds until I stopped.
Beside me was a ruler, so I could see the distances it should be going to. The data looked accurate! I made sure the data was fully accurate by making a graph of the depths I put it into and the depths the sensor picked up.
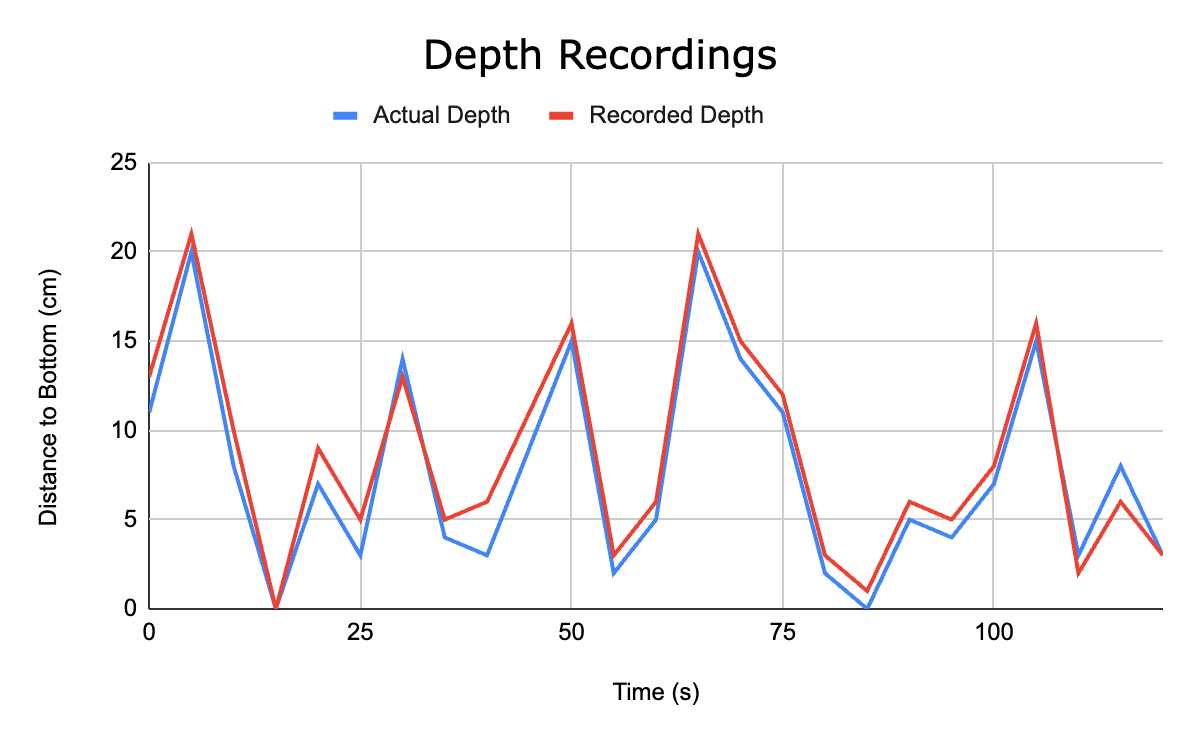
Figure 2. Relationship between actual distance vs. sensed distance to the bottom of the bathtub
In this graph, you can see the relationship between the actual distance and the recorded distance to the bottom of the bathtub. The actual distance was pre-planned, and so I went up and down according to the planned sequence in my bathtub. I wanted to see not only if the results were similar to what I planned, but also if the sensor can handle quick and high-pressure environments, where there are obstacles everywhere. You can see the sensor has performed very well in these tests, as the red and blue values are very close to each other. In a real-life situation, I am very sure this robot will easily be able to navigate the waters autonomously.
Then I tested the robot to see how well it responds. I coded the sensor so that if it detects an object that is 20 centimetres or less away, then it turns left for as much time as it gets a value that is higher than 20 cm. I tested this by putting it into a tub and making it go forward until one of the walls was 20 cm away. The bot turned left and since the wall beside it was very close it kept on turn for 180 degrees. This proved my code worked out well!
I only could show you the results for the TF-Luna sensor because the ultrasonic distance sensor didn't even work underwater! As I saw in my observations, normal non-waterproof ultrasonic distance sensors can't produce strong enough sound waves to go through objects, and waterproof ones don't even work. This was a downfall of my project, but in the end, it opened up new doors for me to experiment with new sensors!
Code for distance sensors (with explanation):
HC-SR04 & A02YYUW
Code Explanation - HC-SR04 & A02YYUW
First, the Trig and Echo pins need to be defined. In this instance, they are known as trigPin and echoPin and are located on pins 3 and 2 of the Arduino board. Next, we require an integer variable for the distance and a Long variable called "duration" for the travel time that we will obtain from the sensor.
// defines pins numbers
const int trigPin = 3;
const int echoPin = 2;
// defines variables
long duration;
int distance;
To display the results on the serial monitor, we must define the trigPin as an output and the echoPin as an input in the setup. We also need to initiate serial communication.
void setup() {
pinMode(trigPin, OUTPUT); // Sets the trigPin as an Output
pinMode(echoPin, INPUT); // Sets the echoPin as an Input
Serial.begin(9600); // Starts the serial communication
}
You must set the trigPin to LOW State for a brief period of time (two seconds) in order for us to verify that it is clear at the beginning of the loop. We now need to set the trigPin to HIGH State for 10 µs in order to generate the Ultra sound wave.
// Clears the trigPin
digitalWrite(trigPin, LOW);
delayMicroseconds(2);
// Sets the trigPin on HIGH state for 10 micro seconds
digitalWrite(trigPin, HIGH);
delayMicroseconds(10);
digitalWrite(trigPin, LOW);
The travel time is read using the pulseIn() function, and the value is entered into the "duration" variable. The name of the Echo pin is the first parameter in this function, and the second is the pulse's current state (High or Low).
// Reads the echoPin, returns the sound wave travel time in microseconds
duration = pulseIn(echoPin, HIGH);
Since the HC-SR04 sensors set the Echo pin to High after transmitting an 8-cycle ultrasonic burst from the transmitter, we must set this to HIGH in this instance. The timing is actually started by this, and it is stopped when the Echo pin goes to Low after we receive the reflected sound wave. The function will finally return the pulse's duration in microseconds.
As we previously explained, we will multiply the duration by 0.034 and divide the result by 2 to get the distance.
// Calculating the distance
distance= duration*0.034/2;
// Prints the distance on the Serial Monitor
Serial.print("Distance: ");
Serial.println(distance);
At the end we will print the value of the distance on the Serial Monitor(a place where you can see all the values the sensor is getting).
TF-Luna Lidar Code
/*
Code to control an ROV with left and right motors
using "tank" steering with two joysticks
*/
// define pins
const int testLED = 13; // Testing if TF Luna Sensor works with built in LED (It does work)
const int joyLpin = A0; // left joystick
const int joyRpin = A1; // right joystick
const int motorLfwd = 7; // left motor forward pin
const int motorLbck = 8; // left motor backward pin
const int motorLen = 10; // left motor enable pin
const int motorRfwd = 9; // right motor fwd pin
const int motorRbck = 12; // right motor backward pin
const int motorRen = 11; // right motor enable pin
// variables
int joyL; // left joystick reading (0-1023 from ADC)
int joyR; // right joystick reading (0-1023 from ADC)
int joyLneutral; // left joystick neutral position
int joyRneutral; // right joystick neutral
const int deadzone = 20; // joystick "dead zone" to prevent drift
int motorLspeed; // left motor speed (0-255 for PWM)
int motorRspeed; // right motor speed (0-255 for PWM)
// Define color sensor pins
#define S0 3
#define S1 4
#define S2 5
#define S3 6
#define sensorOut 7
// Calibration Values
// Get these from Calibration Sketch
int redMin = 24; // Red minimum value
int redMax = 269; // Red maximum value
int greenMin = 10; // Green minimum value
int greenMax = 1320; // Green maximum value
int blueMin = 4; // Blue minimum value
int blueMax = 250; // Blue maximum value
// Variables for Color Pulse Width Measurements
int redPW = 0;
int greenPW = 0;
int bluePW = 0;
// Variables for final Color values
int redValue;
int greenValue;
int blueValue;
void setup() { // code that only runs once
// set motor control pins as outputs
pinMode(motorLfwd,OUTPUT);
pinMode(motorRfwd,OUTPUT);
pinMode(motorLbck,OUTPUT);
pinMode(motorRbck,OUTPUT);
pinMode(motorLen,OUTPUT);
pinMode(motorRen,OUTPUT);
// Initialize the onboard LED pin as an output
pinMode(13, OUTPUT);
// calibrate joysticks
joyLneutral = analogRead(joyLpin);
joyRneutral = analogRead(joyRpin);
Serial.begin(115200);
// Set S0 - S3 as outputs
pinMode(S0, OUTPUT);
pinMode(S1, OUTPUT);
pinMode(S2, OUTPUT);
pinMode(S3, OUTPUT);
// Set Sensor output as input
pinMode(sensorOut, INPUT);
pinMode(13, OUTPUT);
//Turn off LED'S
digitalWrite(13, LOW);
// Set Frequency scaling to 20%
digitalWrite(S0,HIGH);
digitalWrite(S1,HIGH);
// Setup Serial Monitor
}
void loop() { // code that loops forever
// read joysticks
joyL = analogRead(joyLpin);
joyR = analogRead(joyRpin);
int isinput =0;
// set left motor direction and speed
if((joyL-joyLneutral) < -deadzone){ // joystick pushed forward
digitalWrite(motorLfwd,HIGH);
digitalWrite(motorLbck,LOW);
motorLspeed = constrain(map(joyL,joyLneutral,580,0,255),0,255);
isinput =1;
}
else if((joyL-joyLneutral) > deadzone){ // joystick pushed backward
digitalWrite(motorLfwd,LOW);
digitalWrite(motorLbck,HIGH);
motorLspeed = constrain(map(joyL,joyLneutral,815,0,255),0,255);
isinput =1;
}
else{
digitalWrite(motorLfwd,LOW);
digitalWrite(motorLbck,LOW);
motorLspeed =0;
}
// set right motor direction and speed
if((joyR-joyRneutral) < -deadzone){ // joystick pushed forward
digitalWrite(motorRfwd,HIGH);
digitalWrite(motorRbck,LOW);
motorRspeed = constrain(map(joyR,joyRneutral,570,0,255),0,255);
isinput =1;
}
else if((joyR-joyRneutral) > deadzone){ // joystick pushed backward
digitalWrite(motorRfwd,LOW);
digitalWrite(motorRbck,HIGH);
motorRspeed = constrain(map(joyR,joyRneutral,790,0,255),0,255);
isinput =1;
}
else{
digitalWrite(motorRfwd,LOW);
digitalWrite(motorRbck,LOW);
motorRspeed =0;
}
if(isinput ==0) {
digitalWrite(motorRfwd, 255);
digitalWrite(motorLfwd, 255);
if (Serial.available()) {
// Read distance from TF Luna
int distance = readDistance();
if (distance != 1) {
// Check if the object is closer than 20 cm
if (distance < 20) {
digitalWrite(motorLfwd,HIGH); // Turn the motor on
digitalWrite(motorLbck,LOW); // Turn the motor off
digitalWrite(motorRbck,HIGH); // Turn the motor on
digitalWrite(motorRfwd,LOW); // Turn the motor off
(motorLspeed = 250);
(motorRspeed = 250);
} else {
digitalWrite(motorLfwd,LOW);
digitalWrite(motorLbck,LOW);
digitalWrite(motorRbck,LOW);
digitalWrite(motorRfwd,LOW);
}
}
}
}
digitalWrite(motorLen, HIGH);
digitalWrite(motorRen, HIGH);
}
int readDistance() {
if (Serial.available() >= 9) {
byte received[9];
Serial.readBytes(received, 9);
// Check header bytes
if (received[0] == 0x59 && received[1] == 0x59) {
int distance = received[2] + received[3] * 256;
return distance;
}
}
return -1; // Return -1 if valid data is not received
TF-Luna Lidar Code - Explanation
Essentially, what I did here was add the TF Luna code close to the bottom. If the sensor reads 20 centimetres or less on the serial monitor, then it would turn the robot left until it can read a value of more than 20 centimetres. Note that the motor control can override the autonomous control command (as I did not take the robot's controller - it would be too hard). Essentially this means that when I am not using the controller, the Arduino switches to turn on the TF-Luna sensor, and when I am using the controller, the Arduino turns off the TF-Luna Sensor. Also, when the controllers are not being pushed, there is an automatic motor rotation, meaning that the robot will be constantly going into the water. So when I put the robot into the water, then it will begin going straight until it detects a plastic or it detects an object 20 cm or less away from it.
Results from the Detection Sensors
The microplastic Sensing consisted of two modules. The first is machine learning and the second is UV sensing. In conclusion, UV sensing was far more effective than machine learning. In my tests of machine learning, I made a model that could detect bigger pieces of plastic such as milk cartons cans or plastic bottles. However, I tried to take the challenge of actually taking specks of these pieces and trying to use them to detect if it was a microplastic or not. In my research and testing, I realized that machine learning wasn't a very feasible option as it couldn't tell the difference when they got smaller. The mean accuracy for bigger pieces of plastic was 98%, however, for microplastics, it was only a whopping 33%. After this, I went on to do UV sensing, and in the end, I could detect all six types of plastic: PS plastic, HDPE plastic, LDPE plastic, PET plastic, PVC plastic, and finally PP plastic. Putting into comparison with machine learning, not only could the UV sensors detect far more plastics than machine learning (machine learning could only detect plastic bags, cans, and milk cartons), but they also have a very high accuracy of detecting them in comparison to organic matter.
How does UV even work?
UV light comes in three types: UV-A, UV-B, and UV-C. Plastics typically respond more to UV-A light, although UV-B and UV-C, found in sunlight, can also affect them differently. UV-A light is gentler, making it suitable for controlled experiments without causing significant plastic degradation. When exposed to UV-A light, plastics display fluorescence, absorbing it and emitting longer-wavelength light, often visible as a glow. Different plastics emit distinct colors or patterns, aiding in their identification.
Plastics consist of long polymer chains with various chemical bonds, including carbon-carbon and carbon-hydrogen bonds. When exposed to UV light, particularly UV-A, energy from photons prompts electronic transitions within these molecular structures. UV photons carry more energy than visible light photons, leading to electron excitation within the polymer chains. Upon returning to their original states, the excited electrons release excess energy as visible light, a process known as fluorescence.
Colored plastics contain compounds called chromophores, which absorb specific light wavelengths, enhancing their color appearance. When exposed to UV light, fluorescence can intensify, resulting in vibrant neon-like colors.
Photodetectors function by absorbing photons and converting them into electrical signals. When light strikes a photodetector, it creates electron-hole pairs within the material, separated by an electric field, generating an electrical current proportional to the incident light. Different types of photodetectors are used to detect specific light spectrum regions.
In summary, UV light induces fluorescence in plastics by exciting electrons within their molecular structures, producing characteristic glows or colors. Photodetectors then detect this fluorescence, allowing for the identification of different types of plastics based on their unique responses to UV illumination.
Light Intensity Sensor Code:
// Define color sensor pins
#define S0 4
#define S1 5
#define S2 6
#define S3 7
#define sensorOut 8
// Calibration Values
// Get these from Calibration Sketch
int redMin = 24; // Red minimum value
int redMax = 269; // Red maximum value
int greenMin = 10; // Green minimum value
int greenMax = 1320; // Green maximum value
int blueMin = 4; // Blue minimum value
int blueMax = 250; // Blue maximum value
// Variables for Color Pulse Width Measurements
int redPW = 0;
int greenPW = 0;
int bluePW = 0;
// Variables for final Color values
int redValue;
int greenValue;
int blueValue;
void setup() {
// Set S0 - S3 as outputs
pinMode(S0, OUTPUT);
pinMode(S1, OUTPUT);
pinMode(S2, OUTPUT);
pinMode(S3, OUTPUT);
// Set Sensor output as input
pinMode(sensorOut, INPUT);
pinMode(13, OUTPUT);
//Turn off LED'S
digitalWrite(13, LOW);
// Set Frequency scaling to 20%
digitalWrite(S0,HIGH);
digitalWrite(S1,LOW);
// Setup Serial Monitor
Serial.begin(9600);
}
void loop() {
// Read Red value
redPW = getRedPW();
// Map to value from 0-255
redValue = map(redPW, redMin,redMax,255,0);
// Delay to stabilize sensor
delay(200);
// Read Green value
greenPW = getGreenPW();
// Map to value from 0-255
greenValue = map(greenPW, greenMin,greenMax,255,0);
// Delay to stabilize sensor
delay(200);
// Read Blue value
bluePW = getBluePW();
// Map to value from 0-255
blueValue = map(bluePW, blueMin,blueMax,255,0);
// Delay to stabilize sensor
delay(200);
// Print output to Serial Monitor
Serial.print("Red = ");
Serial.print(redValue);
Serial.print(" - Green = ");
Serial.print(greenValue);
Serial.print(" - Blue = ");
Serial.println(blueValue);
}
// Function to read Red Pulse Widths
int getRedPW() {
// Set sensor to read Red only
digitalWrite(S2,LOW);
digitalWrite(S3,LOW);
// Define integer to represent Pulse Width
int PW;
// Read the output Pulse Width
PW = pulseIn(sensorOut, LOW);
// Return the value
return PW;
}
// Function to read Green Pulse Widths
int getGreenPW() {
// Set sensor to read Green only
digitalWrite(S2,HIGH);
digitalWrite(S3,HIGH);
// Define integer to represent Pulse Width
int PW;
// Read the output Pulse Width
PW = pulseIn(sensorOut, LOW);
// Return the value
return PW;
}
// Function to read Blue Pulse Widths
int getBluePW() {
// Set sensor to read Blue only
digitalWrite(S2,LOW);
digitalWrite(S3,HIGH);
// Define integer to represent Pulse Width
int PW;
// Read the output Pulse Width
PW = pulseIn(sensorOut, LOW);
// Return the value
return PW;
}
Light Intensity Sensor Code - Explanation
The pins that connect the TCS230 are defined at the beginning of the sketch. You will need to adjust these definitions if you utilise other pins. The pulse widths of the red, green, and blue sensors are then represented by a few predetermined variables. The S0-S3 pins are designated as outputs in the arrangement. We will choose the frequency scaling and the colour we want to address using these pins. The square wave will be received at the sensor's output pin, which the Arduino recognizes as an input. The frequency scaling is then adjusted to 20% using the S0 and S1 pins, which is a standard setting when utilising an Arduino with this colour sensor. We configured the serial monitor at last. To obtain the pulse width, we call three functions inside the loop. First, let's look at one of these roles. The red pulse width is obtained by the getRedPW function. To pick the red output, the S2 and S3 pins are first set. The only way this function is different from its corresponding blue and green functions is in this regard. The pulse width is then defined as an integer. The Arduino pulseIn function is then used to calculate the pulse width. The way this function is designed, it measures the width of the LOW portion of the pulse in addition to the pulse width. The result is the time in milliseconds. This value is then returned and the function ends. Back in the loop, we call the three functions to read the colour pulse widths, adding a 200 ms delay between them to allow the sensor to stabilize. We then print the values to the serial monitor and repeat the loop.
Results from the Final Robot
After testing everything by itself, I decided to put it all together and test my whole robot. The best way to do this is to see how well and fast it can collect microplastics. For this test, I filled my bathtub up with water (no ponds in Calgary had thawed yet), and began to add many items that simulated a pond or lake-like environment. I did not add any animals as I did not have access to any. However, when the water bodies in Calgary thaw out I will get my robot there. After replicating my setting as best as I could, I began adding microplastics in the tub. For my first test, I put 5 types of microplastic in a straight line. I wanted to see if my robot could detect and collect all 5 types of plastic. All of these plastics were clear. I turned my robot on and put it into the tub, and it went on to detect and collect all 5 of the microplastics, in only 60 seconds! I also made sure to include many other pieces of organic matter, such as algae and sticks, so I could see if the robot would detect those as plastics. It didn’t, and only chose the right materials to filter! This was a huge success in my project. And so I went on to test further. I then tested on 10 and 15 microplastics in the water. And while the robot could differentiate between the plastics and the non-plastics, it did take more time to find them, as I expected.
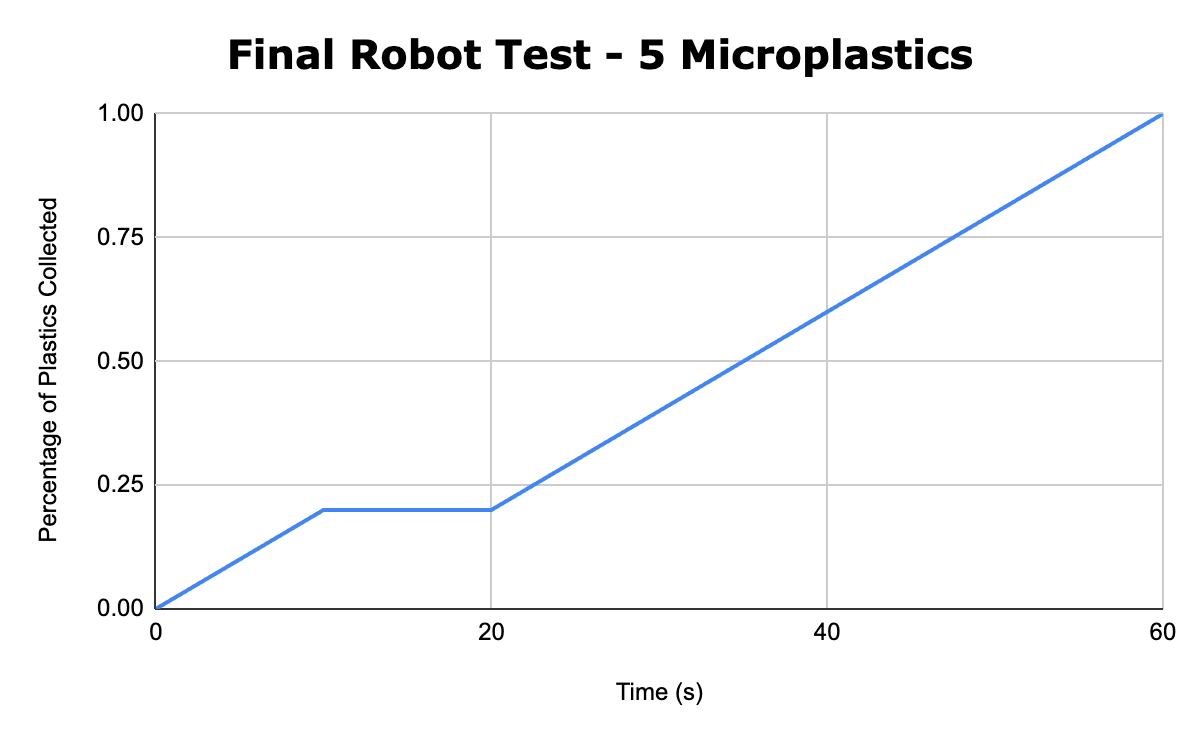
Figure 3. 5 microplastics
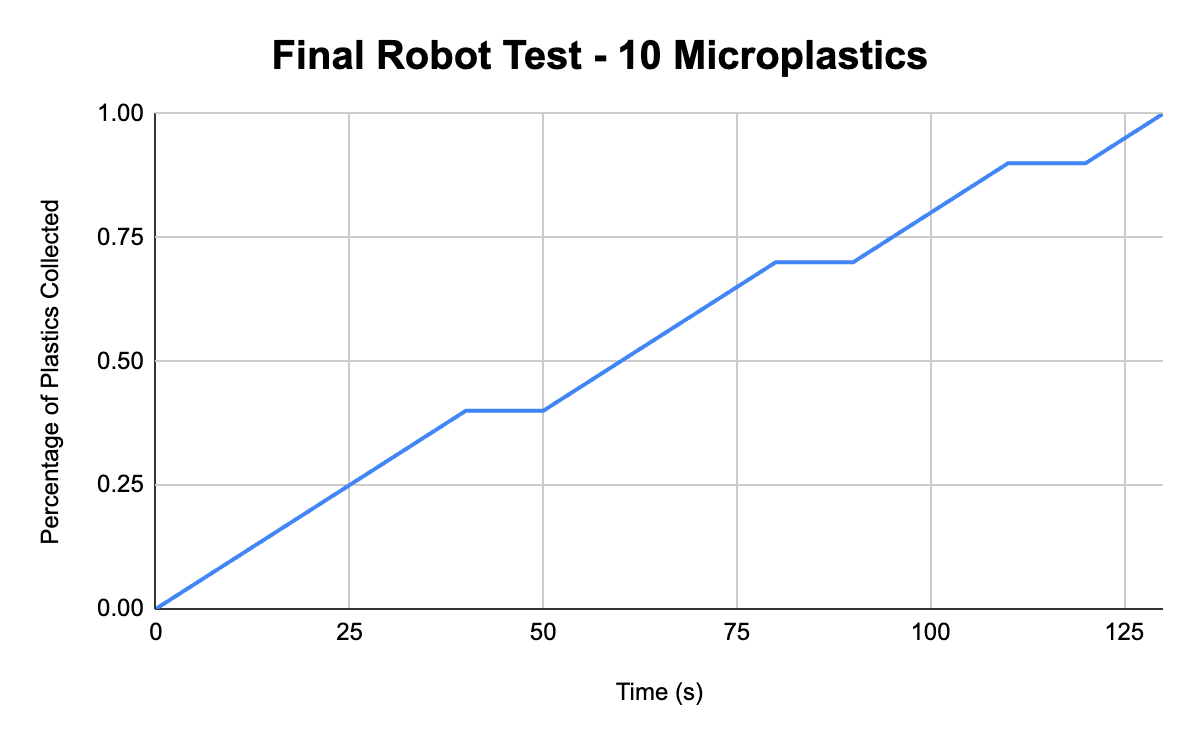
Figure 4. 10 microplastics
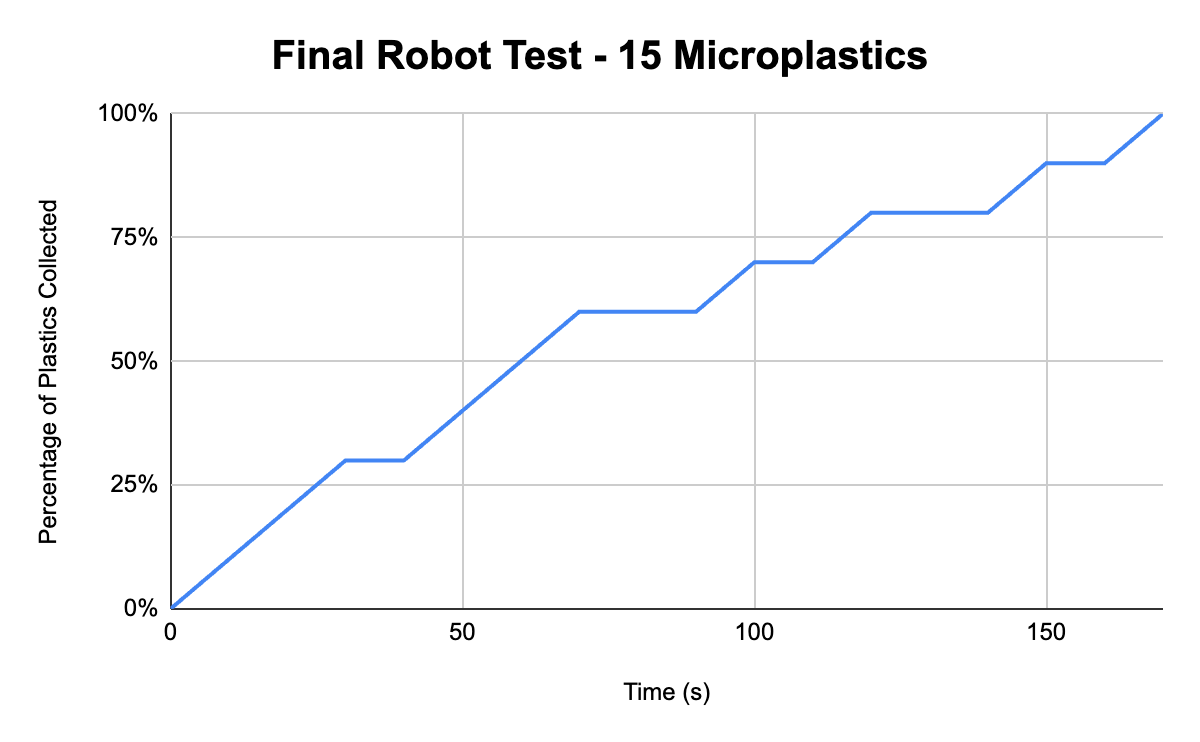
Figure 5. 15 microplastics
My current robot is very helpful because it can do things other filtering robots can not. There are many great aspects to other robots in the world, however, I add real-time use, autonomous control, and low cost.
Conclusion
Concluding Statement:
The purpose of this project was to make a low-cost and autonomous underwater robot that can detect and collect microplastic in water bodies in real-time. After significant testing and variations throughout each of the 4 modules (Detection, Robot, Autonomous Control, Filtering), I have successfully created an underwater robot (ROV) that is $484 CAD, fully autonomous, and can detect all 6 types of plastic (LDPE, HDPE, PVC, PP, PE, PET) in real time.
Practical Applications:
Essentially my robot is the practical application. As I've proven to you by solving my three objectives: my first one being autonomous control, the second one being real time efficiency, and the third one being cost-effectiveness. Now with this robot, I plan to go and navigate Calgary's Waters once they thought out and try to take microplastics out of them. I have already tested my robot in my bathtub environment where I simulated a pond/lake like environment. The robot is equipped with sensors that analyze and detect these microplastics in real time. Now, I will go into real environments where there are animals and I can test out the full capabilities of my robot. This way I can expand to industrializing my robot and bringing it around the world to solve the microplastic pollution problem around the world. My robot can contribute to environmental cleanups and can provide data for future researchers. I hope my robot can be improved on and ultimately help save the world’s marine microplastic pollution problem!
Future Improvements
- Making my Robot more aerodynamic
Although the robot that I made in this project was generally aerodynamic, it wasn't the best. In rough waters, the ROV could get entangled and broken. To solve this issue in the future, I am planning to create 3D models that are aerodynamically efficient and are generally better as a design for my ROV.
- Even more range to detect
In my robot, I could detect microplastics only in the top left corner range of my robot. This range bands 15 cm in height. Although it could detect plastics from that area, in the future, I will plan to make sure that the whole front side of my robot is filled with sensors so I can detect it in every way in that scenario. This will make it way more effective because it can detect far more plastics and make my robot more efficient.
- Soldering
I used a breadboard to connect all the wires. Breadboarding is an effective method because small mistakes can be tolerated. However, in my future design, I will solder my circuit. Soldering essentially makes the circuit so that the wires are actually fully connected to the sensors and they cannot be taken apart. Of course, this will only happen when I'm fully sure how the circuit will work. I already have a lot of knowledge on soldering and I can execute this part pretty easily. This way my ROV could bounce in very rough water and still not be affected.
Citations
Bibliography:
- Amazon. (n.d.). Rubbermaid Brilliance Food Storage Container [Container]. https://www.amazon.com/Rubbermaid-Brilliance-Storage-Container-1991157/dp/B01JCNEK24/ref=sr_1_9?keywords=Clear%2C%2Bairtight%2Bplastic%2Bfood%2Bstorage%2Bcontainer&qid=1703206813&refinements=p_n_feature_fifteen_browse-bin%3A16533388011%2Cp_n_feature_nine_browse-bin%3A72479132011%7C78742892011%7C78742900011%2Cp_n_feature_seven_browse-bin%3A24084104011%2Cp_n_material_browse%3A335850011&rnid=335840011&sa=kitchen&sr=1-9&th=1
- Amazon.ca. (n.d.). Teyleten Robot TCS230 TCS3200 Color Recognition Sensor Module for Arduino [Product description]. https://www.amazon.ca/Teyleten-Robot-TCS230-TCS3200-Recognition/dp/B08HH8QYF8/ref=sr_1_5?crid=36VGJDLU543GL&keywords=arduino+colour+sensor&qid=1706221387&sprefix=arduino+colour+sesnor%2Caps%2C118&sr=8-5
- Amazon.ca. (n.d.). Gorilla 100% Silicone Sealant Caulk, Waterproof and Mold & Mildew Resistant, 2.8 ounce Squeeze Tube, Clear, (Pack of 1) [Product description]. https://www.amazon.ca/Gorilla-Percent-Silicone-Sealant-Squeeze/dp/B01M2AAHBV/ref=sr_1_6?crid=WY6TYU5B85LK&keywords=gorilla%2Bglue%2Bsilicone%2Bsealant&qid=1706221229&sprefix=gorilla%2Bglue%2Bsillicone%2Bselant%2Caps%2C123&sr=8-6&th=1
- Amazon.ca. (n.d.). 4 Pack Stainless Steel Woven Wire Mesh, 30 Mesh Metal Mesh Sheet, 30 Mesh Screen Replacement Mesh for Home Kitchen Cooking Baking [Product description]. https://www.amazon.ca/Pack-Stainless-Screen-Multiple-Resistant/dp/B08FRNZ9CL/ref=sr_1_6?crid=13FIME2U4G51A&keywords=mesh&qid=1706220998&sprefix=mes%2Caps%2C548&sr=8-6
- MDPI. (2021). Application of Terrestrial LiDAR Data for Detection and Classification of Submerged Microplastics in Aquatic Environments. Remote Sensing, 14(8), 2360. https://www.mdpi.com/2227-9717/11/8/2360
- Essentra Components. (n.d.). UV and Plastics: An Overview. https://www.essentracomponents.com/en-us/news/manufacturing/injection-molding/uv-and-on-plastics-an-overview
- Instructables. (n.d.). A DIY Imaging Fluorometer. https://www.instructables.com/A-DIY-Imaging-Fluorometer/
- YouTube. (2019, August 21). Terrestrial LIDAR vs SLAM: A Robotic Showdown [Video]. https://www.youtube.com/watch?v=o4_6yu-GIDU
- YouTube. (2019, October 9). Tutorial: Working with LiDAR data in ArcGIS [Video]. https://www.youtube.com/watch?v=YDM7Ezb_vN0
- Visionify. (n.d.). How Can Machine Learning Detect Microplastic in Ocean? https://visionify.ai/how-can-machine-learning-detects-microplastic-in-ocean/
- Towards Data Science. (n.d.). Interoperability Data & IoT: How to Send and Receive Data and Take Control of Your Arduino from R. https://towardsdatascience.com/interoperability-data-iot-how-to-send-and-receive-data-and-take-control-of-your-arduino-from-r-eb83005bff87
- YouTube. (n.d.). Search results for "Lidar" [Video playlist]. https://www.youtube.com/@sparkfun/search?query=Lidar
- YouTube. (2019, October 4). How to Detect Objects Using OpenCV and Deep Learning (Yolo) [Video]. https://www.youtube.com/watch?v=A1SPJSVra9I&t=61s
- Rhodes, C. (2019, September 26). New Detection Devices Could Record Microplastic Pollution Levels in Real Time. Mongabay. https://news.mongabay.com/2019/09/new-detection-devices-could-record-microplastic-pollution-levels-in-real-time/
- YouTube. (2018, May 18). Introduction to LiDAR [Video]. https://www.youtube.com/watch?v=CAVYHlFGpaw
- Rosebrock, A. (2016, March 28). Measuring the size of objects in an image with OpenCV. PyImageSearch. https://pyimagesearch.com/2016/03/28/measuring-size-of-objects-in-an-image-with-opencv/
- GIS Geography. (n.d.). LiDAR (Light Detection and Ranging). https://gisgeography.com/lidar-light-detection-and-ranging
- Advanced Navigation. (n.d.). Hydrus Micro AUV. https://www.advancednavigation.com/robotics/micro-auv/hydrus#Documentation
- Hackaday. (n.d.). ROV. https://hackaday.com/tag/rov/
- Blueye Robotics. (n.d.). Pioneer. https://www.blueyerobotics.com/products/pioneer
Acknowledgement
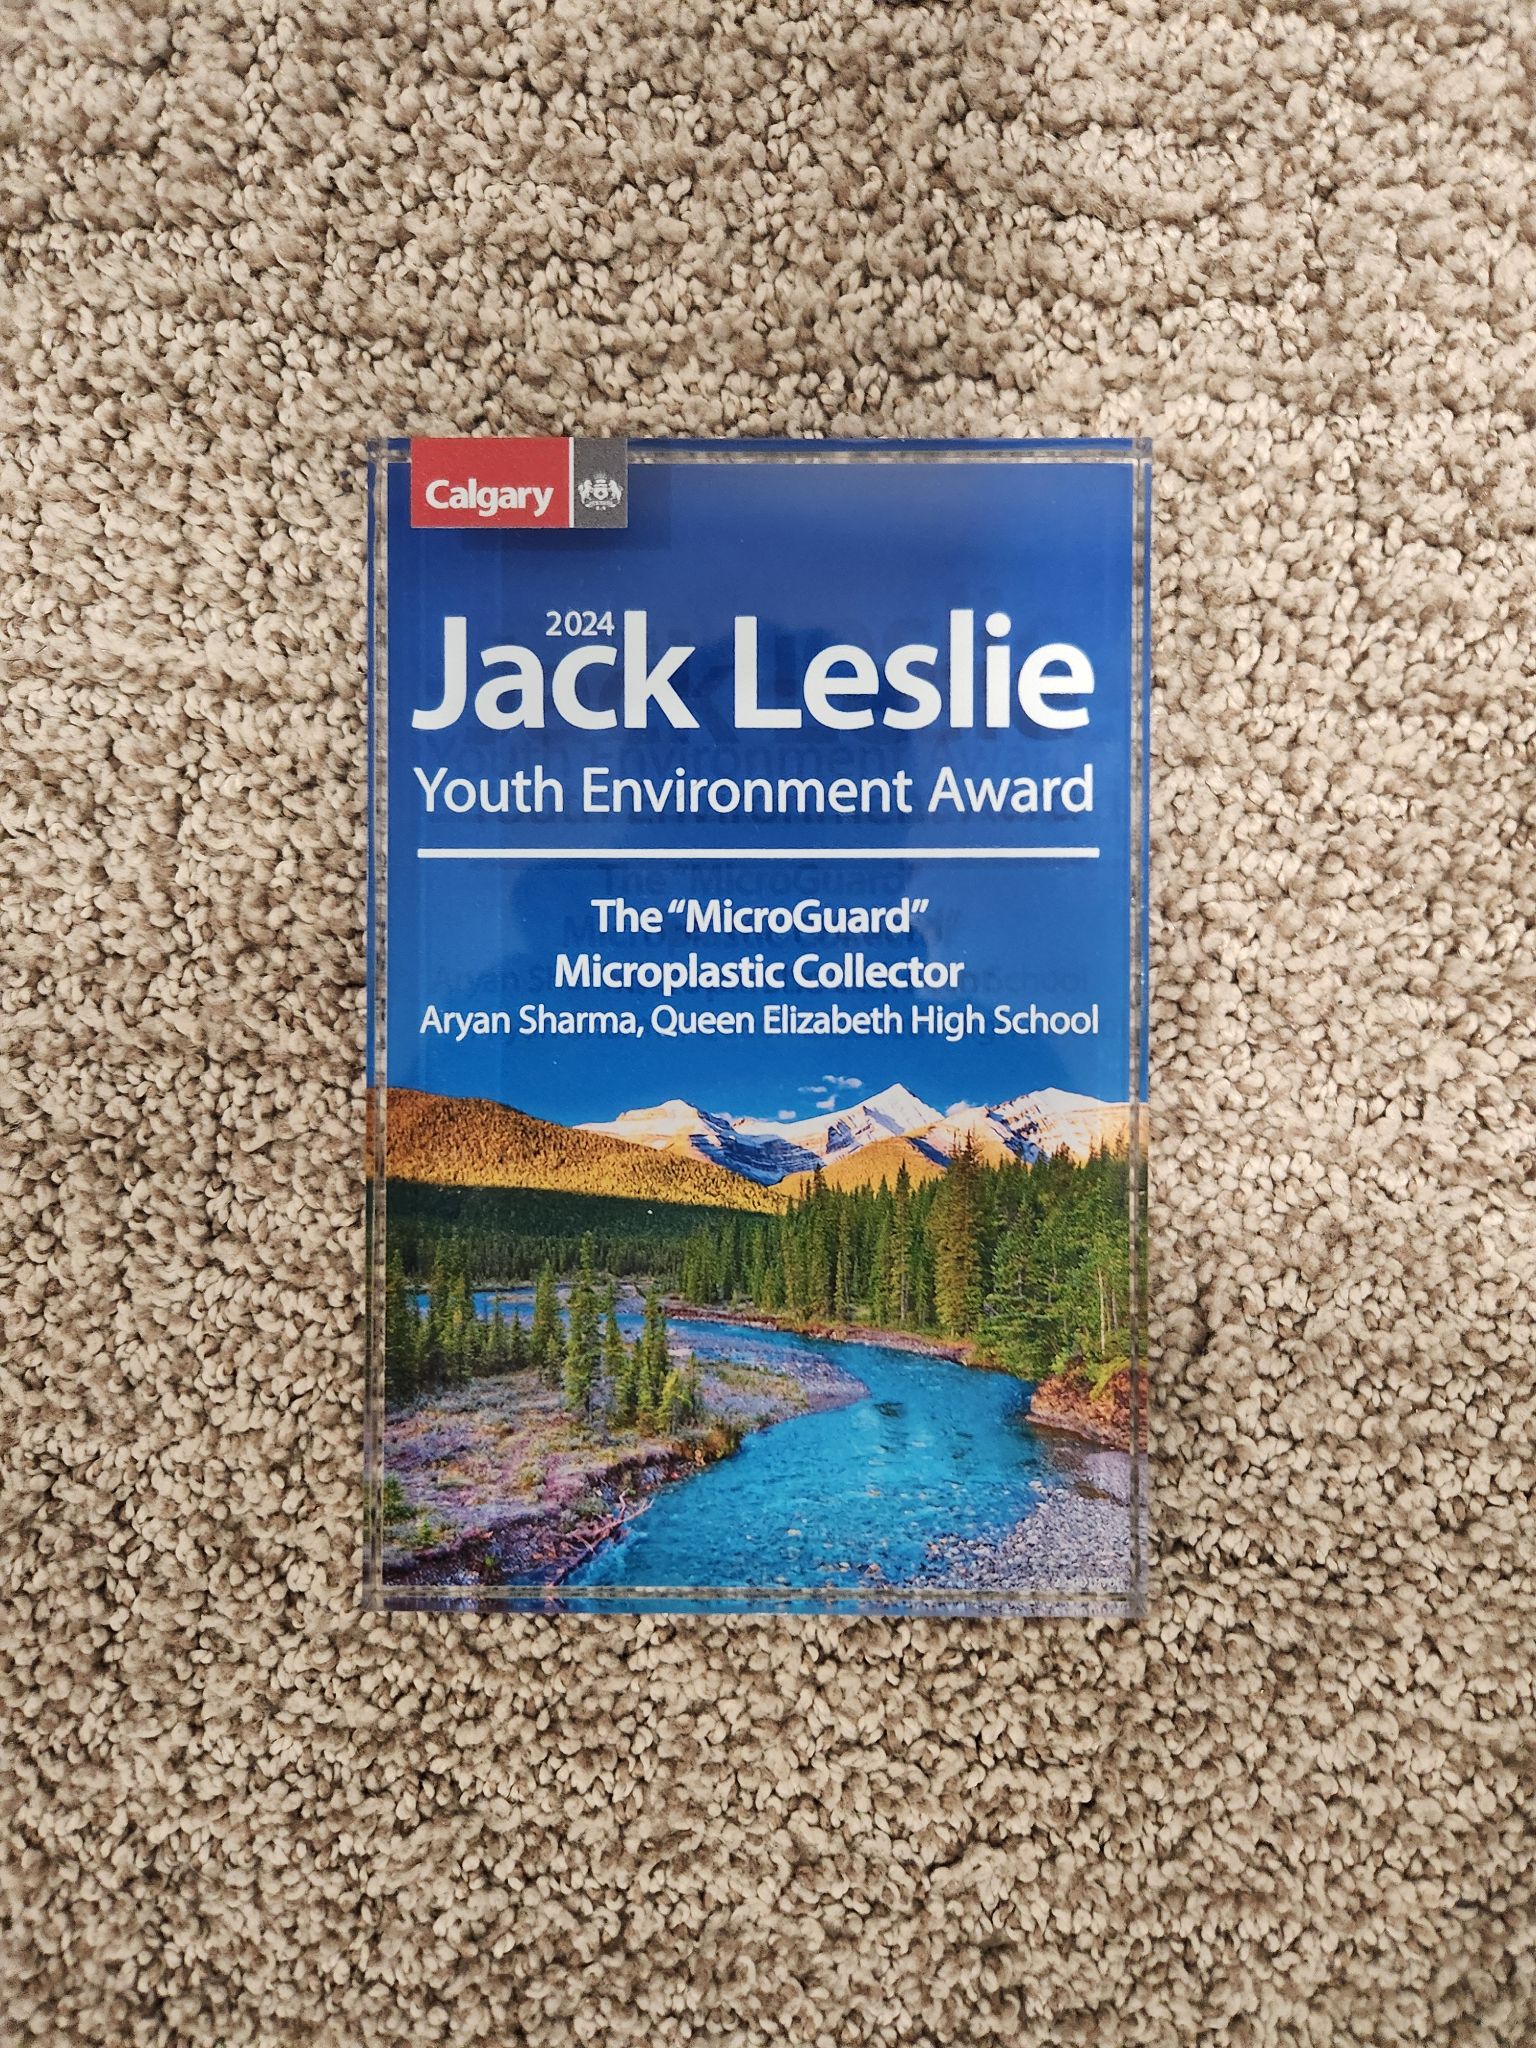
I would like to give a huge thanks to my sponsors at Youth Central. The Jack Leslie Youth Environmental Grant had gave me $500 in cash to fund my supplies and materials I needed for my project. I also would like to thank my school science fair coordinator for helping me organize my project so I could submit it to such an amazing event.