Phosphate Trouble: Bridging the Gap Between Increasing Salinity and Magnetite Nanocoat Loading to Maintain Constant Phosphate Adsorption
Yatharth Trivedi
Dr. E. P. Scarlett High School
Grade 10
Presentation
Hypothesis
If an increment of 2.00g is applied to the loading of magnetite nanocoat starting from 0.50g for every 100mg/L increase in salt concentration, then the phosphate adsorption percentage will remain constant because although salt induced electric double layer compression drastically reduces the Debye length, the resultant destabilization of the exerted electrostatic gradient can be offset by incrementally elevating the local density of Fe-OH binding sites which reinforces the surface potential of the magnetite nanocoat and allows attracted phosphates to establish inner-sphere complexes through ligand exchange. Thereby preserving the phosphate adsorption percentage while remaining below the threshold at which excessive magnetite loading would trigger nanoparticle aggregation and pore clogging driven by van der Waals forces that would otherwise suppress adsorption.
Research
Research of the Issue: Eutrophication is a rising concern across the globe, leading to ongoing detrimental impacts to aquatic ecosystems. It is characterized by excessive algal blooms as a result of nutrients like phosphate being released into water bodies in the form of municipal or industrial wastewater. Although procedures are implemented for the removal of phosphate, these measures are often generalized to consider the presence and quantity of phosphate only in order to set filtration requirements accordingly. By doing so, wastewater treatment facilities often oversee total dissolved solids. In the case of wastewater, total dissolved solids are primarily composed of salts, and the level of salts present can significantly obstruct how much phosphate is removed. Similarly to phosphate, salt levels vary between wastewater samples. Thus, using generalized procedures that only account for phosphate quantity can potentially lead to inconsistent levels of phosphate being released back into water bodies. In terms of applicable filtration systems, magnetite treated biochar has been proved an effective method to adsorb phosphate out of wastewater. The process utilizes composite biochar nanocoated with magnetite, in which the biochar quantity remains controlled but magnetite loading varies. Because the biochar serves as a chemical scaffold for the magnetite and contributes insignificantly to adsorption, it is the magnetite quantity that primarily alters adsorption rates. However, excess magnetite loading will lead to aggregation as it forms clusters near the bottom. In the context of filtration systems, increased salt concentration translates into increased magnetite quantity. This project aims to bridge that gap from generalized phosphate removal procedures, into specifying the quantitative relationship between incrementing salt concentrations and the required increase in magnetite loading (safely without aggregation). Overall, based on the given time and resources, the objective is to develop a relationship between the two variables that municipal wastewater facilities can use to accurately adjust the filtration system’smagnetite in response to varying concentrations of salt in wastewater containing phosphate. Hence, ensuring that phosphate levels stay constant to minimize the rate of potential eutrophication. For clarity, it is important to note that salt levels in municipal wastewater are approximately in the range of 100 mg/L–1000 mg/L depending on a variety of factors such as seasonal de-icing runoff, industrial discharge, sewer inflow sources, etc. Thus, 0.00 mg/L will be set as the control value for the project and scaled by 100 mg/L ten times to simulate the typical salinity range of 100 mg/L–1000 mg/L. By defining how incremental increases in salinity alter the required magnetite loading, this project ultimately seeks to provide a quantitative guideline that treatment facilities can incorporate into real-time filtration adjustments. This supports a more stable phosphate removal performance, even under fluctuating wastewater compositions, thereby reducing nutrient discharge and mitigating eutrophication risk.
Research of the Project-Related Scientific Concepts: Magnetite (Fe₃O₄) is an magnetite naturally containing Fe²⁺ and Fe³⁺ and are nanocoated onto biochar due to biochar’s large surface area including micropores and mesopores combined with magnetite’s reactive sites to provide maximum adsorption efficiency. The outermost surface layer of magnetite is characterized by unsatisfied iron atoms called surface coordination sites and the surrounding H₂O molecules are polar. Therefore, the positive Fe attracts oxygen (negative component of H₂O) and initiates the transfer of electrons while linking to the resultant hydroxyl groups. Considering the pH of wastewater being in the range of 5–7, the hydroxylated magnetite surface groups (Fe–OH₂⁺) will primarily be protonated, paving the path for phosphate adsorption by creating the proximity required for adsorption. Now due to the transfer of electrons yielding a net positive charge on the hydroxyls, the overall protonated surface groups can electrostatically maintain a minimized proximity between the negative phosphate ions (HPO₄²⁻) based on given wastewater pH levels. Additionally, phosphate possesses a much higher affinity for iron compared to the hydroxyls. When it approaches the magnetite surface groups, the phosphate, serving as a Lewis base, donates electron density from its oxygen to the Fe. Hence, Fe–OH₂⁺ bonds are destabilized and the OH₂⁺ is detached as phosphate is a much stronger ligand than hydroxyls. Next, in a process called ligand exchange, the phosphate forms a direct bond with the surface Fe atom and is considered to be a chemical coordination bond because the Fe atom shares electrons with the oxygen atom in the phosphate. As a result, yielding stable Fe–O–P linkages called inner-sphere complexes. Inner-sphere complexes allow magnetite to firmly attach onto the surface, driving phosphate adsorption onto magnetite nanocoated biochar. Furthermore, not only does adsorption occur on the outer surface, but also within biochar’s micropores and mesopores that are nanocoated. Through pore diffusion, phosphate can reach these internal binding sites to repeat inner-sphere complexation and form additional Fe–O–P linkages. The concentration of salt present in the water plays an impactful role in the adsorption process. To begin, prior to the formation of Fe–O–P linkages when phosphate was not yet adsorbed and the outermost layer was composed of magnetite surface groups (Fe–OH₂⁺), the phosphate ions were the sole anions being attracted. When you increase salt concentrations though, chloride, sulfate, and nitrate anions (primarily chloride anions for this project) increase, meaning you have additional anions competing with phosphate to bond to limited positively charged surface groups. Although phosphate possesses a higher affinity for iron compared to other salts, the main issue lies in the transport of phosphate anions to the surface. As an increased quantity and variety of phosphate anions occupy the surface, fewer Fe atoms reach binding sites, fewer binding sites are vacant, and congestion is increased near the surface. Furthermore, the transport of phosphate is controlled by the electric double layer composed of the Stern and diffuse layer. The Stern layer facilitates the ligand exchange process and, in this case, hosts a tightly bound layer of anions (e.g., phosphate and chloride) directly bound to the magnetite surface. The diffuse layer is characterized by ions loosely arranged in an outward cloud extending into the solution. The distance that the ionic cloud extends into the solution is called the Debye length. At low salt concentrations, the diffuse layer is relatively wide and contains few competing anions, allowing phosphate to move toward the surface efficiently and approach the Stern layer to undergo inner-sphere complexation via ligand exchange with the protonated magnetite surface groups. However, as salt concentration increases, chloride and other anions begin filling the Stern layer while the diffuse layer becomes compressed and reduces the distance of ions being extended outward into the solution. This means that phosphate must reach a closer proximity to the surface before it experiences the electrostatic attraction, reducing adsorption efficiency. In essence, phosphate reaches the surface less frequently. Lastly, the salts present are a contributor to magnetite nanoparticle aggregation because with increased salt concentrations, the ions further shield the surface charge while weakening the separation forces that once maintained distance between the Fe atoms. Without this separation, minor attractive forces such as van der Waals start to dominate by gradually clustering the magnetite nanoparticles as a result of momentary shifts in electrons creating temporary dipoles (characterized by two sides of a molecule constantly alternating between a positive or negative charge). As aggregation progresses, the previously exposed nanocoated surface area starts to become buried in clusters, making numerous magnetite surface groups inaccessible for phosphate binding. Therefore, drastically reducing adsorption capacity with incrementing salt if nanocoat quantity remains controlled.
Variables
Manipulated Variable:
Magnetite increment applied to initial loading quantity
-Each increment will be individually applied to the initial loading quantity ten times to correspond to the ten 100mg/L increases in salt concentration. The increments being manipulated are as follows:
-0.50g
-1.00g
-1.50g
-2.00g
-2.50g
Responding Variable:
Phosphate adsorption Percentage
-The percentage of phosphate adsorbed will respond to the incremental change in magnetite loading quantity. Because the initial concentration of phosphate in the solution will be controlled, the measured phosphate adsorption percentage will automatically indicate the remaining phosphate concentration. The remaining phosphate concentration will be measured in parts per million (ppm) by a digital phosphate test meter and then divided by the initial phosphate quantity. After multiplying by 100, subtract this percentage from 100% to find the phosphate adsorption percentage.
Controlled Variables
-The pH levels of the phosphate solution will be controlled at a pH of 6 (typical pH level range of wastewater is 5–7) because pH controls the surface charge of magnetite. For example, higher pH could negatively charge magnetite (Fe–O⁻), potentially repelling the phosphate instead of adsorbing due to both components exhibiting the same charge. However, by controlling the pH at 6, the magnetite can maintain a constant positive surface charge (Fe–OH₂⁺) each trial. This allows the magnetite to exert a consistent electrostatic force that attracts the phosphate because both components exhibit opposite charges.
-The range of salt levels tested will remain controlled throughout each trial and manipulation of the project at a range of 0 mg/L–1000 mg/L as referenced by the Food and Agriculture Organization’s (FOA) report on domestic wastewater composition. The salt concentration will start at 0 mg/L and increase ten times by 100 mg/L, each time, requiring the magnetite loading to be increased by the set increment. Thus it is crucial for the range and set increases in salt concentration to be controlled, because this ensures that, regardless of the selected magnetite loading increment, any changes in phosphate adsorption can be attributed directly to the effects of salinity rather than uncontrolled variability. For example, for one adsorption test, if the range of salt concentration is increased beyond 1000 mg/L, then the required ten set increments (in salt concentration starting from 0 mg/L) also increases. This means that more salt will be present at each corresponding magnetite loading level, which makes phosphate adsorption more difficult due to increased ionic competition and the compression of the electric double layer.
-Temperature levels of the solution and testing site will be controlled as accurately as possible to ensure consistent rates of diffusion, facilitating the binding process. By maintaining consistent temperature, the transport of phosphate particles can efficiently progress towards lower concentration regions around the nanocoat. If the temperature were too low, the phosphate particles would retain less energy, and thus, exhibit insufficient momentum to maneuver past the obstructing Na⁺ and Cl⁻ ions.
-The amount of biochar provided to chemically support the magnetite nanocoat will be controlled to ensure consistency in the initial exposed surface area. For example, if I include additional biochar, then the amount of accessible binding sites would increase alongside higher risks of magnetite aggregation. Overall, impacting the phosphate adsorption capacity.
-Quantity of water will be controlled to ensure the consistent application of magnetite nanoparticles on the biochar via the establishment of strong bonds. Additionally, water will allow for the equal dispersion of initial Na⁺ and Cl⁻ ions, and hence keeping the water quantity controlled is necessary to preventing weak nanocoats and varied ionic concentration amongst different increments being tested.
-The salt concentration increases are controlled. For example, the salt concentration will always be increased by 100mg/L when an increment is applied to the magnetite loading quantity, regardless of the increment applied. Without salt concentration being controlled at a strict 100mg/L increase, the phosphate can experience stronger or weaker interference each, leading to fluctuations in phosphate adsorption capacity.
-The initial phosphate amount for each of the adsorption tests will be controlled at 1000 mg/L phosphate. Otherwise, for example, if the initial phosphate amount was different for another trial with the same loading increment and salt concentration, then the adsorption percentage could comparatively drop. This is the case because a lower phosphate amount to start with simply means fewer phosphate ions within the solution will be attracted towards the biochar sample. In turn, ultimately yielding a lower phosphate adsorption percentage.
Procedure
Part A-Magnetite Nanocoat Application Process for Control Value Testing
- Using an electronic balance, measure 5.00g of sieved biochar into a 120mL glass beaker.
- Record the mass, as biochar quantity will be controlled at 5.00g throughout the testing of manipulated coating quantities.
- Using graduated cylinder, measure 10mL of distilled water into the 20mL glass vial.
- To establish the control value set of the experiment, add 0.500g of magnetite loading into the glass vial which corresponds to the biochar control value in order to maintain the constant target of a phosphate adsorption percentage of >90% at 0.00mg/L salt concentration
- Stir with stirring rod until fully dissolved to ensure formation of uniform coating solution without chunks.
- Gradually pour the entire magnetite solution over the 5.00g biochar in the glass beaker.
- Stir with the stirring rod to uniformly wet and dissolve the biochar, forming a consistent slurry mixture.
- Allow the mixture to settle at room temperature for 5 minutes to ensure proper formation of the magnetite nanocoat on the biochar.
- Transfer the moist mixture entirely onto a ceramic dish and spread uniformly with a butter knife.
- Load the dish into an oven at 105 °C for 45 minutes to eliminate moisture.
- Allow the dish to cool at room temperature for 20 minutes prior to handling.
- Rinse the previously used stirring rod with and dry.
- Position sieve directly on top of a ziploc bag.
- To ensure uniform particle sizing throughout, transfer coated biochar into the sieve and gradually sift to separate loose powder.
- If lumps of biochar still remain, gently crush with the stirring rod and repeat the sifting process until all the biochar is transferred into the ziploc bag.
- Securely seal the ziploc bag and label accordingly (in this case, since the amount of magnetite translated into the amount of magnetite needed to maintain >90% phosphate adsorption capacity at 0.00mg/L, we will label as control-1.
- Repeat steps 1-16 another two times as the same configuration will be tested three times in total to ensure consistency in results for accurate data collection. Subsection Part A-Magnetite Nanocoat Application Process for Incremental Increases in Magnetite Loading
- Using an electronic balance, measure 5.00g of sieved biochar into the 120 mL glass beaker.
- Record the mass, as biochar quantity will be controlled at 5.00g throughout the testing of manipulated coating quantities.
- Using the graduated cylinder, measure 10mL of distilled water into the 20mL glass vial.
- Add to the control magnetite loading value of 0.500g once by the selected increment, which in this case will be 1.00g, making the first required loading amount 1.50g (1.00g + 0.500g).
- Measure out the new magnetite quantity and transfer into the glass vial.
- Stir with stirring rod until fully dissolved to ensure formation of uniform coating solution without chunks.
- Repeat steps 6-17 from Part A once, but each time changing step 16 to ensure appropriate labels on the Ziploc bags. Labels should be in the format: (increment, salt concentration, trial number). The salt concentration will be tested up to 1000mg/L, and thus applying the selected loading increment once indicates a 100.00mg/L increase in salt concentration. In this case, the salt concentration increased 100.00mg/L from 0.00mg/L, while the increment and trial number are 1.00g and 1 respectively.
- Nine more times, repeat steps 18-24, but each time changing step 21 so that the selected increment is applied an additional time. For example, for the first repetition of steps 6-8, apply the increment of 1.00g twice to 0.500g (twice because we already applied it once), and thus label the ionic strength as 200.00mg/L since the magnetite quantity is incremented an additional time by the same increment each time the salt concentration increases by 100mg/L. In this case, there should be a total of 30 samples created as the same loading increment will be applied 10 times to the control magnetite loading quantity to compensate for 10 increases of 100mg/L in salt concentration, and there will be three trials for each sample. Hence, equating to 30 total samples for each increment (10x3).
- Repeat steps 18-25 four more times, but each time replacing the selected increment until all the increments: 0.500g, 1.000g, 1.500g, 2.000g, and 2.500g have been prepared. (1.000g) has already been tested, so the remaining increments to test are 0.500g, 1.500g, 2.000g, and 2.500g) Part B-Bulk Preparation of Phosphate Solutions with Different Salt Concentration Levels
- Gather the eleven, 1.5L bottles and and assign each bottle one label representing the eleven salt concentration values being simulated: 0.000mg/L, 100.00mg/L, 200.00mg/L, 300.00mg/L, 400.00mg/L, 500.00mg/L, 600.00mg/L, 700.00mg/L, 800.00mg/L, 900.00mg/L, 1000.00mg/L. Label accordingly with a sharpie marker.
- In each of the bottles, pour in 1.00L of distilled water.
- Because the phosphate concentration testing is controlled at a concentration of 1.00 gram per liter, measure out 1.00 gram of phosphate into each of the eleven 1.5L bottles containing 1.00L of distilled water. Because the MW12 Phosphate Tester measures in parts per million (ppm), it is important to translate these measurements into ppm. 1.00 gram of phosphate equals 1000 milligrams, and 1.00L translates to 1000000 milligrams, thus the initial concentration of phosphate is 1000ppm (1000 milligrams of phosphate in every 1000000 milligrams of distilled water).
- Modification of salt concentration across the phosphate solutions (using sodium chloride) to simulate a range of natural environments
- Leave the 0.000mg/L bottle unmodified to serve as the control solution for the controlled biochar samples with no magnetite coating.
- Assign each of the ten 1.5L bottles to a different one out of the ten salt concentrations being simulated. The ten salt concentrations being tested include 100.00mg/L, 200.00mg/L, 300.00mg/L, 400.00mg/L, 500.00mg/L, 600.00mg/L, 700.00mg/L, 800.00mg/L, 900.00mg/L, 1000.00mg/L.
- Accordingly measure and transfer the milligrams of salt assigned to the respective bottle. Because each of the ten bottles already contains 1L of phosphate solution, no conversions are required on the measured salt in milligrams.
- Securely fasten the lid on each 1.5L bottle.
- Vigorously shake each bottle for 30 seconds and then invert three times to ensure complete dissolution of the solute (sodium chloride).
- Store the eleven bottles in a dry environment at room temperature. Part C-Testing Control Values to Determine Baseline Phosphate Adsorption in 0.00mg/L Salt Conditions
- Gather the three 120mL glass beakers.
- Serving as the control samples, gather the three biochar samples consisting of a 0.500g magnetite nanocoat and completely empty out each ziploc bag containing the sample into a different 120mL glass beaker.
- From the phosphate solution bottle labelled 0.00mg/L, measure out 100 mL of phosphate solution and gradually pour entirely into one of the three beakers.
- Repeat step 39 two more times, but each time changing the beaker that the phosphate solution is poured into. Thus, ensuring that 100 mL of phosphate solution is present in each of the 3 beakers.
- Gently mix each of the solutions with the stirring rod for 15 seconds and then remove the stirring rod.
- Rinse the stirring rod and set to dry.
- Completely cover all 3 of the beakers with Parafilm to limit evaporation and contamination while allowing the solution to equilibrate at room temperature (approximately 22 degrees Celsius) for 10 minutes.
- Every 2 minutes, one by one, gently swirl the beakers by hand for 5 seconds to maintain uniform contact between the coated biochar and phosphate.
- After the 10 minute period, inspect the beaker to ensure all the coated biochar particles have settled at the bottom. If not, then wait until the full settlement is complete.
- Remove Parafilm from each of the 3 beakers.
- With the 3mL eyedropper, carefully measure out a complete obtainment of 3mL of the remaining clear phosphate solution near the top of the beaker. When performing this step, it is important to position the eyedropper so that it is shallowly dipped just below the surface to ensure only clear phosphate solution is obtained and no coated biochar particles.
- Using the eyedropper, transfer the obtained solution from one of the beakers into the rinsed out glass vial.
- Switch on the digital phosphate test meter and position directly into the vial so that it is shallowly dipped just below the surface of the transferred solution.
- Take measurement to determine the remaining phosphate concentration in the solution and record in the tables shown further.
- Repeat steps 47-50 for the other two beakers as each beaker simulates an additional trial, equating to a total of 3 trials.
- Fully rinse out all testing equipment and containers used including the three 50mL glass beakers, glass test vial, and stirring rod, and set to dry. For the digital phosphate test meter, use a disinfectant wipe to gently clean the tip of the device that was in contact with the solution and set to dry. Part D-Testing Biochar Samples with Incremented Magnetite Nanocoating in Increasing Salt Concentration Conditions
- Gather the three 120 mL glass beakers.
- From the collection of Ziploc bags containing the coated biochar samples, gather all the Ziploc bags labelled with the same increment value. For demonstration purposes, the increment value of 1.000g will be chosen.
- Since the salt concentrations will be tested sequentially in ascending value, first measure and gradually pour 100 mL of phosphate solution into each of the 3 beakers from the phosphate solution bottle labelled 100mg/L.
- From the previously gathered biochar samples all assigned a 1.000 increment value, locate the three samples labelled 100mg/L in the salt concentration section.
- Completely empty the coated biochar samples one by one from each of the 3 Ziploc bags into a different glass beaker.
- Gently mix each of the solutions with the stirring rod for 15 seconds and then remove the stirring rod.
- Repeat steps 43-52 (from Part-C) once.
- Repeat steps 55-59 nine more times, but for each repetition, incrementing the salt concentration value by 100mg/L (to simulate the 100mg/L-1000mg/L range in salt concentration). Thus, for now, the increment remains at 1.000 but the salt concentration label required for each repetition increases by 100mg/L until 1000mg/L is tested. For example in the next step, three bags labelled 1.000 for the increment and 200mg/L for the salt concentration will be gathered and tested similarly (while still collecting data from 3 trials per configuration).
- Repeat steps 53-60 four more times, but each time manipulating the increment value until the four remaining values 0.500g, 1.500g, 2.000g, and 2.500g have been tested (not 1.000g as it has already been tested as a demonstration for the procedure).
Observations
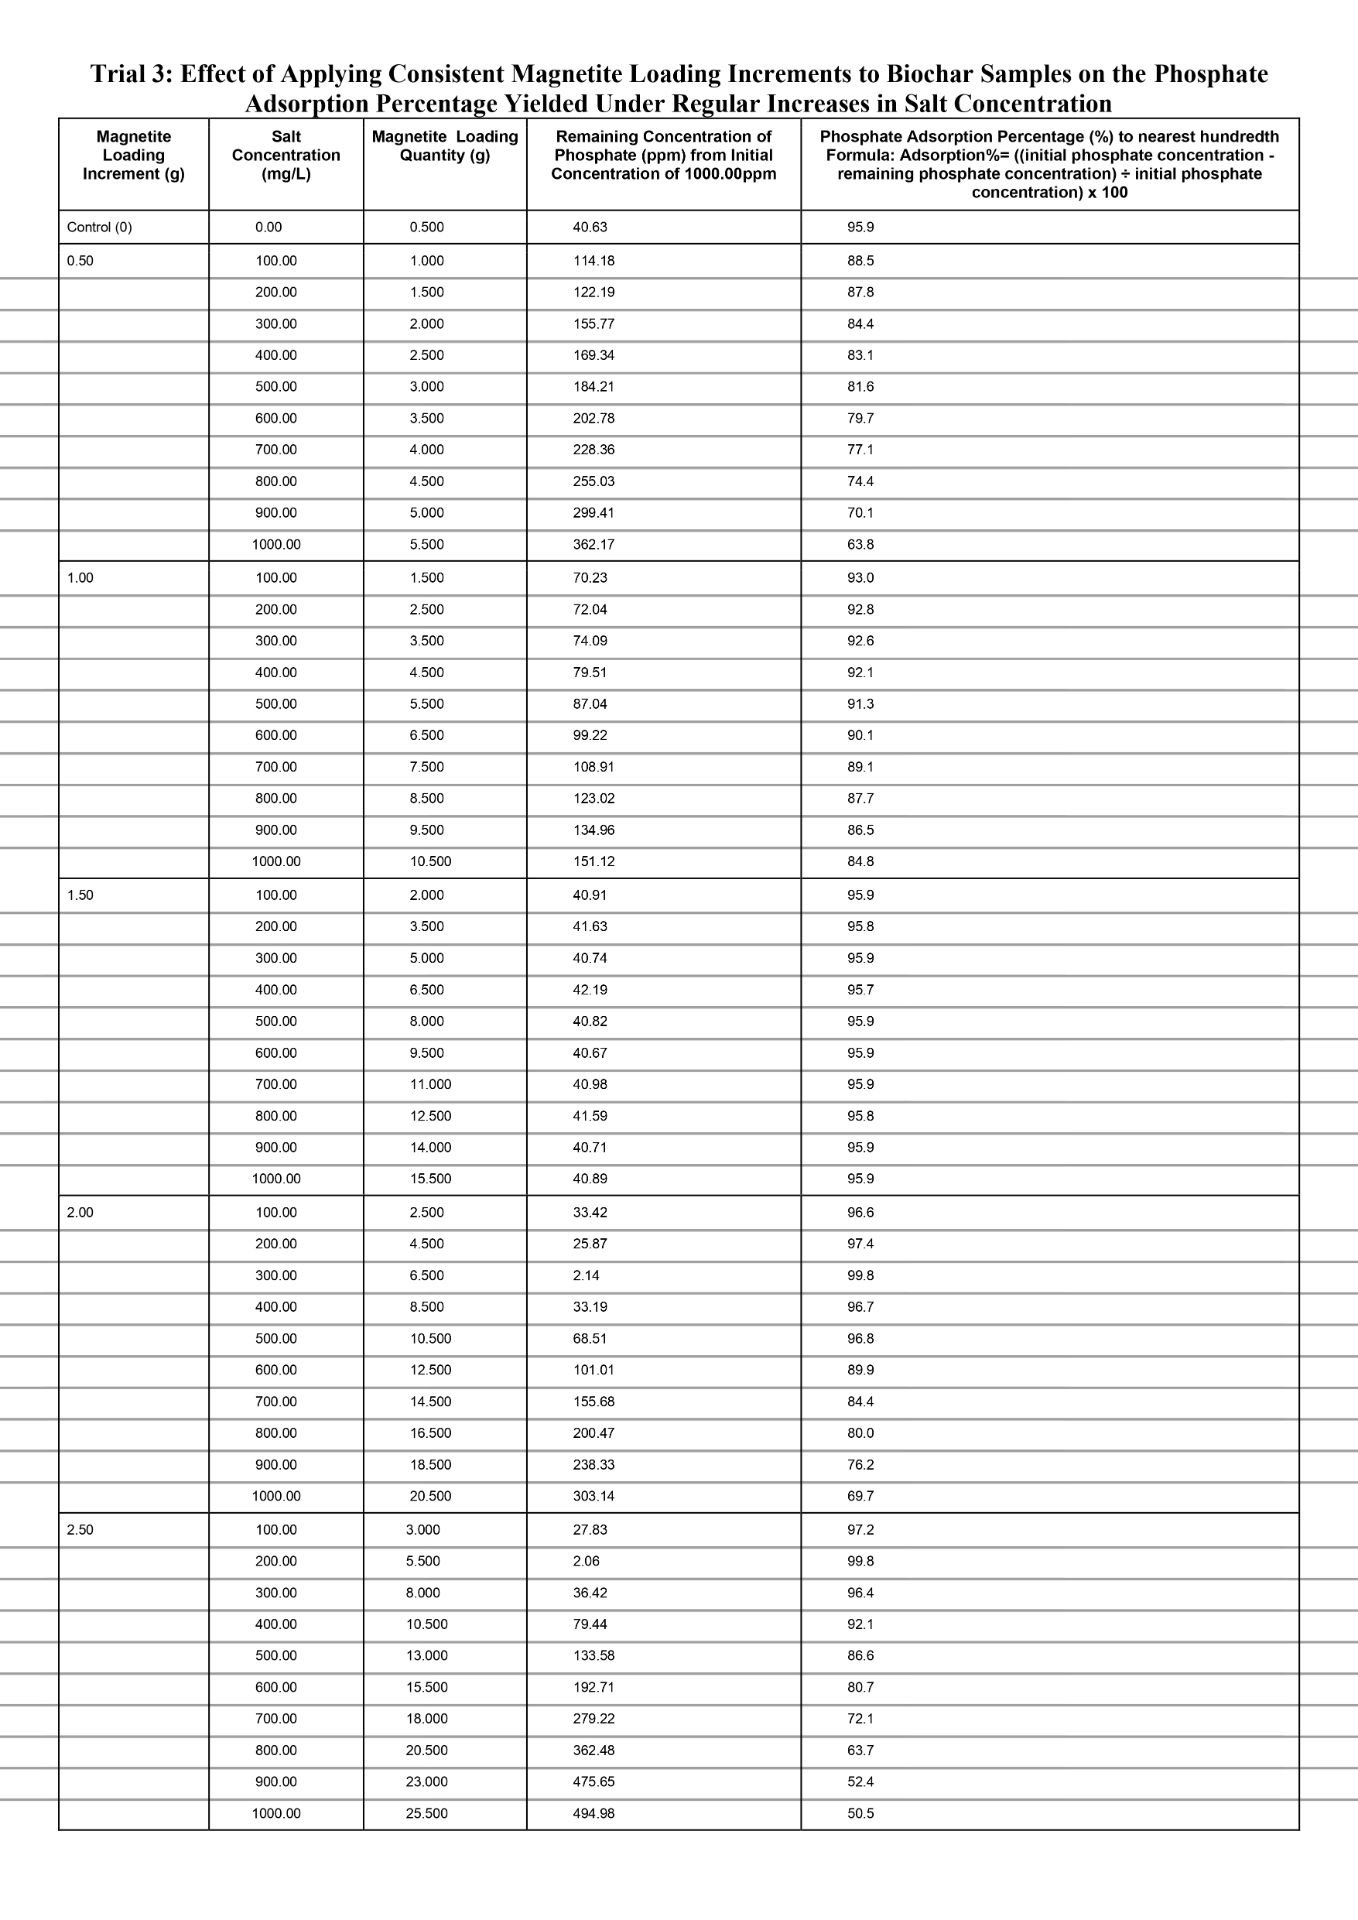
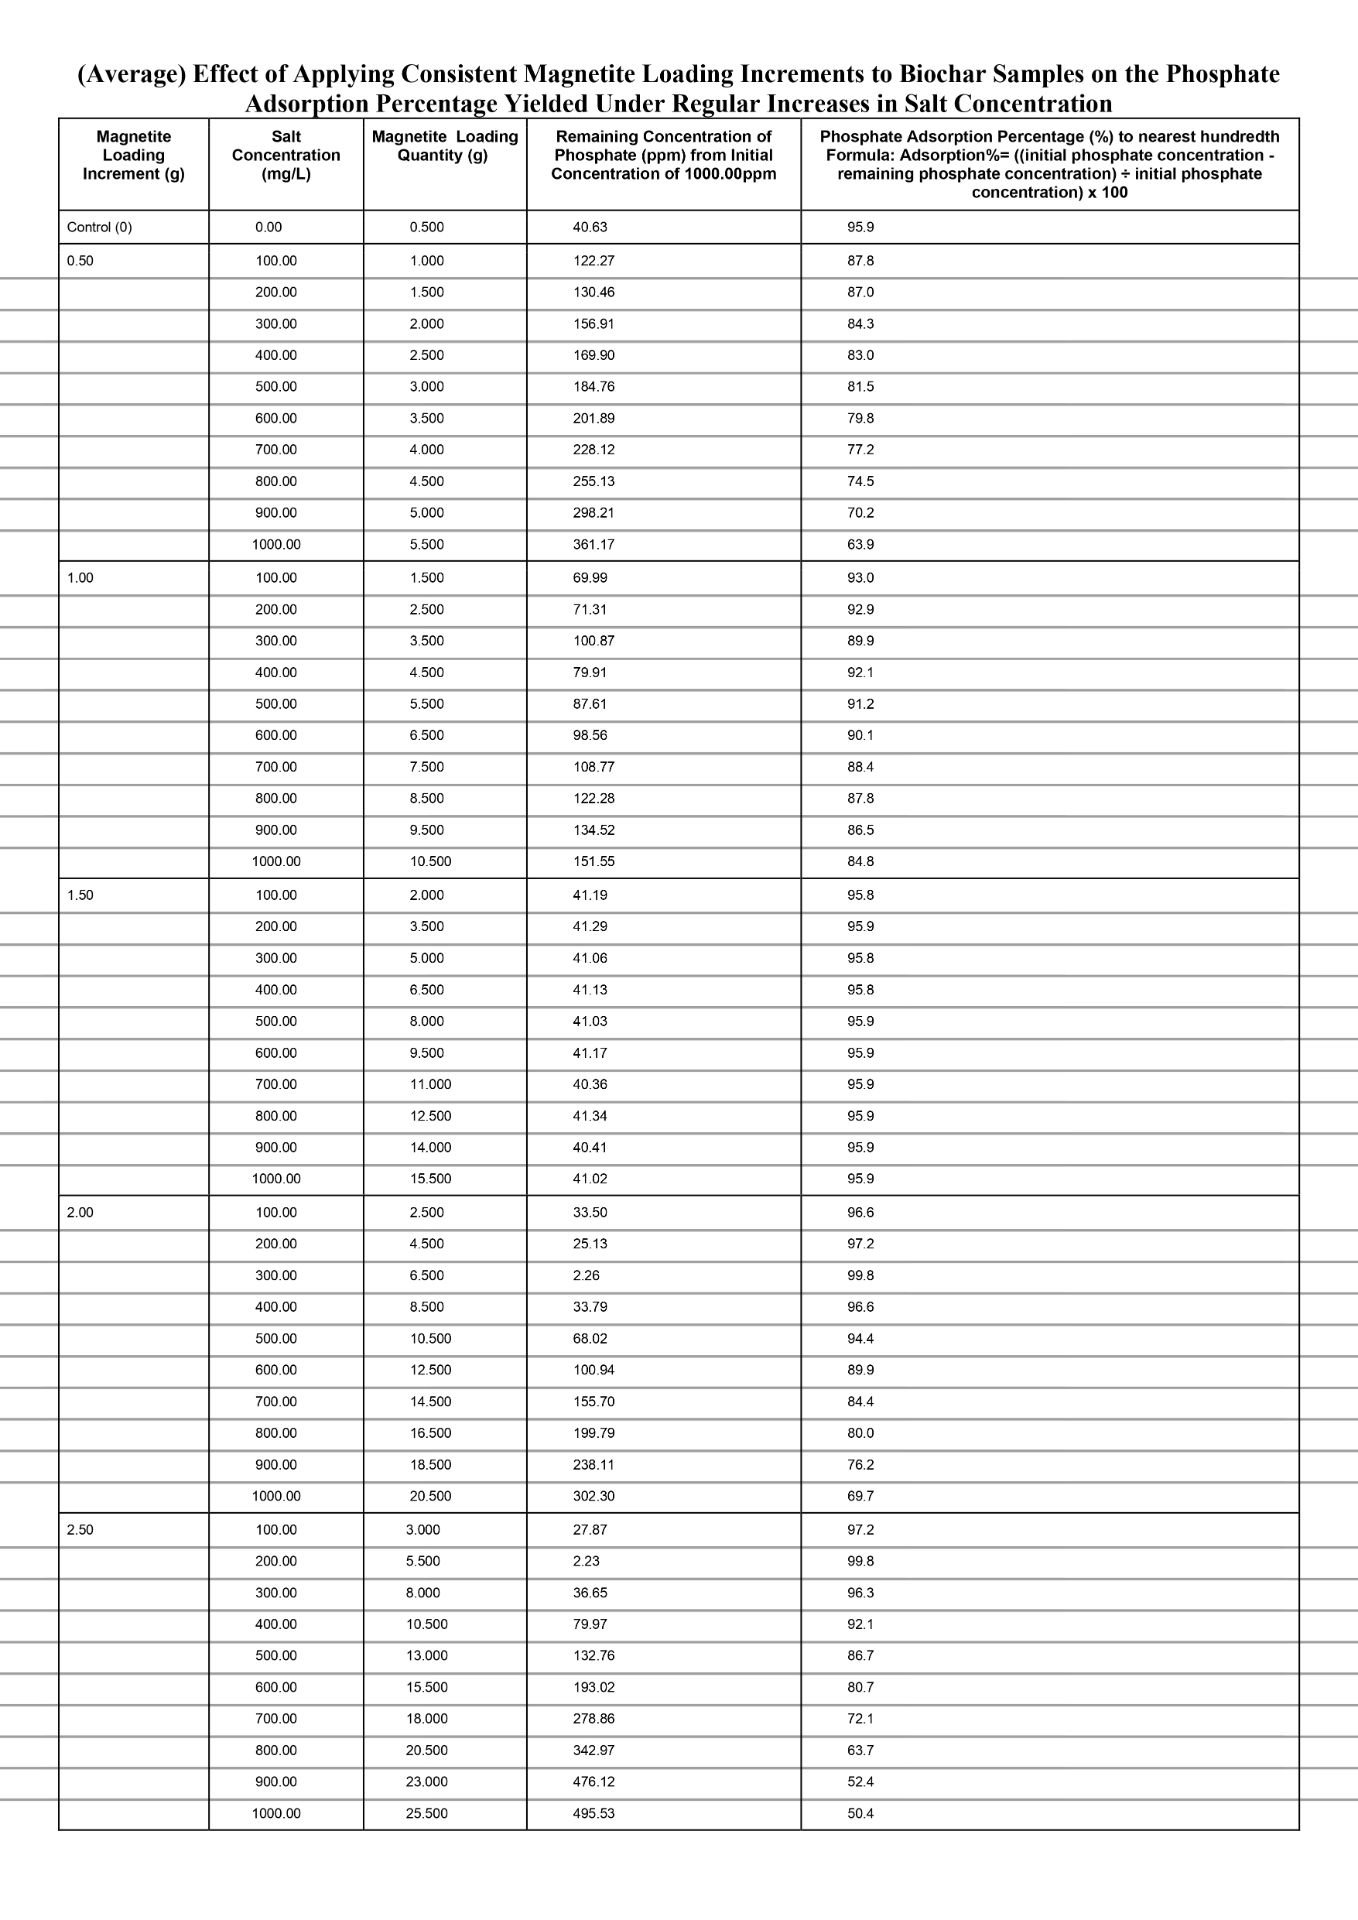
Quantitative Observations

Qualitative Observations
-The 3 mL phosphate solution samples extracted from all trials prepared with the 0.500g magnetite loading increment showed a progressive decrease in clarity as ionic strength increased. -Across all three trials using the 0.500g magnetite loading increment, no physical iron-oxide aggregation was observed at any given ionic strength values. -The 3 mL phosphate solution samples extracted from all trials prepared with the 1.000g magnetite loading increment showed a progressive but comparatively gradual decrease in clarity than all trials prepared with the 0.500g magnetite loading increment as salt concentration increased. -Across all three trials using the 1.000g magnetite loading increment, no physical iron-oxide aggregation was observed at any given ionic strength values. -The 3 mL phosphate solution samples extracted from all trials prepared with the 1.500g magnetite loading increment exhibited consistency in clarity as salt concentration increased. -Across all three trials using the 1.500g magnetite loading increment, no physical iron-oxide aggregation was observed at any given ionic strength values. -The 3 mL phosphate solution samples extracted from all trials prepared with the 2.000g magnetite loading increment exhibited a progressive increase in clarity as the salt concentration increased from 100mg/L-300mg/L. -The 3 mL phosphate solution samples extracted from all trials prepared with the 2.000g magnetite loading increment exhibited a progressive decrease in clarity as the salt concentration increased from 300mg/L-1000mg/L. -Across all three trials using the 2.000g magnetite loading increment, solid black magnetite aggregates were observed suspended in the phosphate solutions at ionic strength values ranging from 300mg/L-1000mg/L. The aggregates observed got progressively larger with higher salt concentration values. -The 3 mL phosphate solution samples extracted from all trials prepared with the 2.500g magnetite loading increment exhibited a progressive increase in clarity as the salt concentration increased from 100mg/L-200mg/L. -The 3 mL phosphate solution samples extracted from all trials prepared with the 2.500g magnetite loading increment exhibited a progressive decrease in clarity as the salt concentration increased from 200mg/L-1000mg/L. -Across all three trials using the 2.500g magnetite loading increment, solid black magnetite aggregates were observed suspended in the phosphate solutions at salt concentration values ranging from 200mg/L-1000mg/L. The aggregates observed got progressively larger with higher salt concentration values.
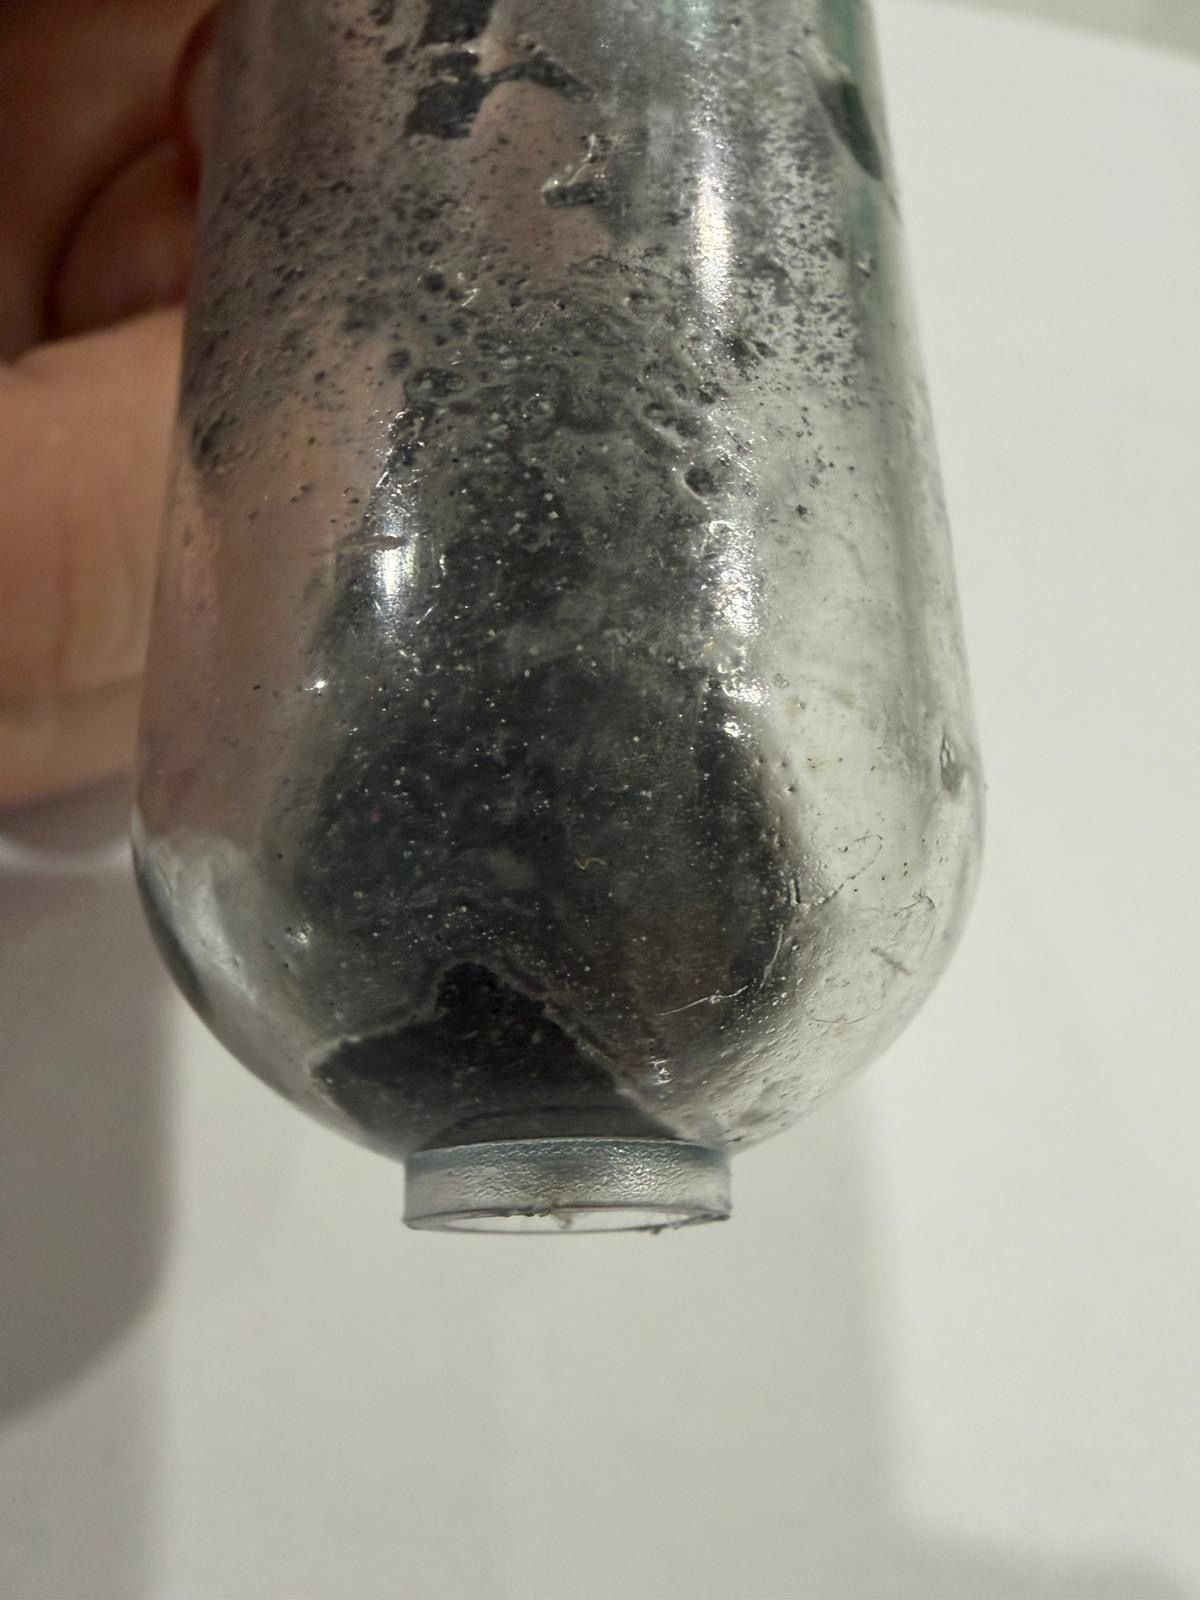
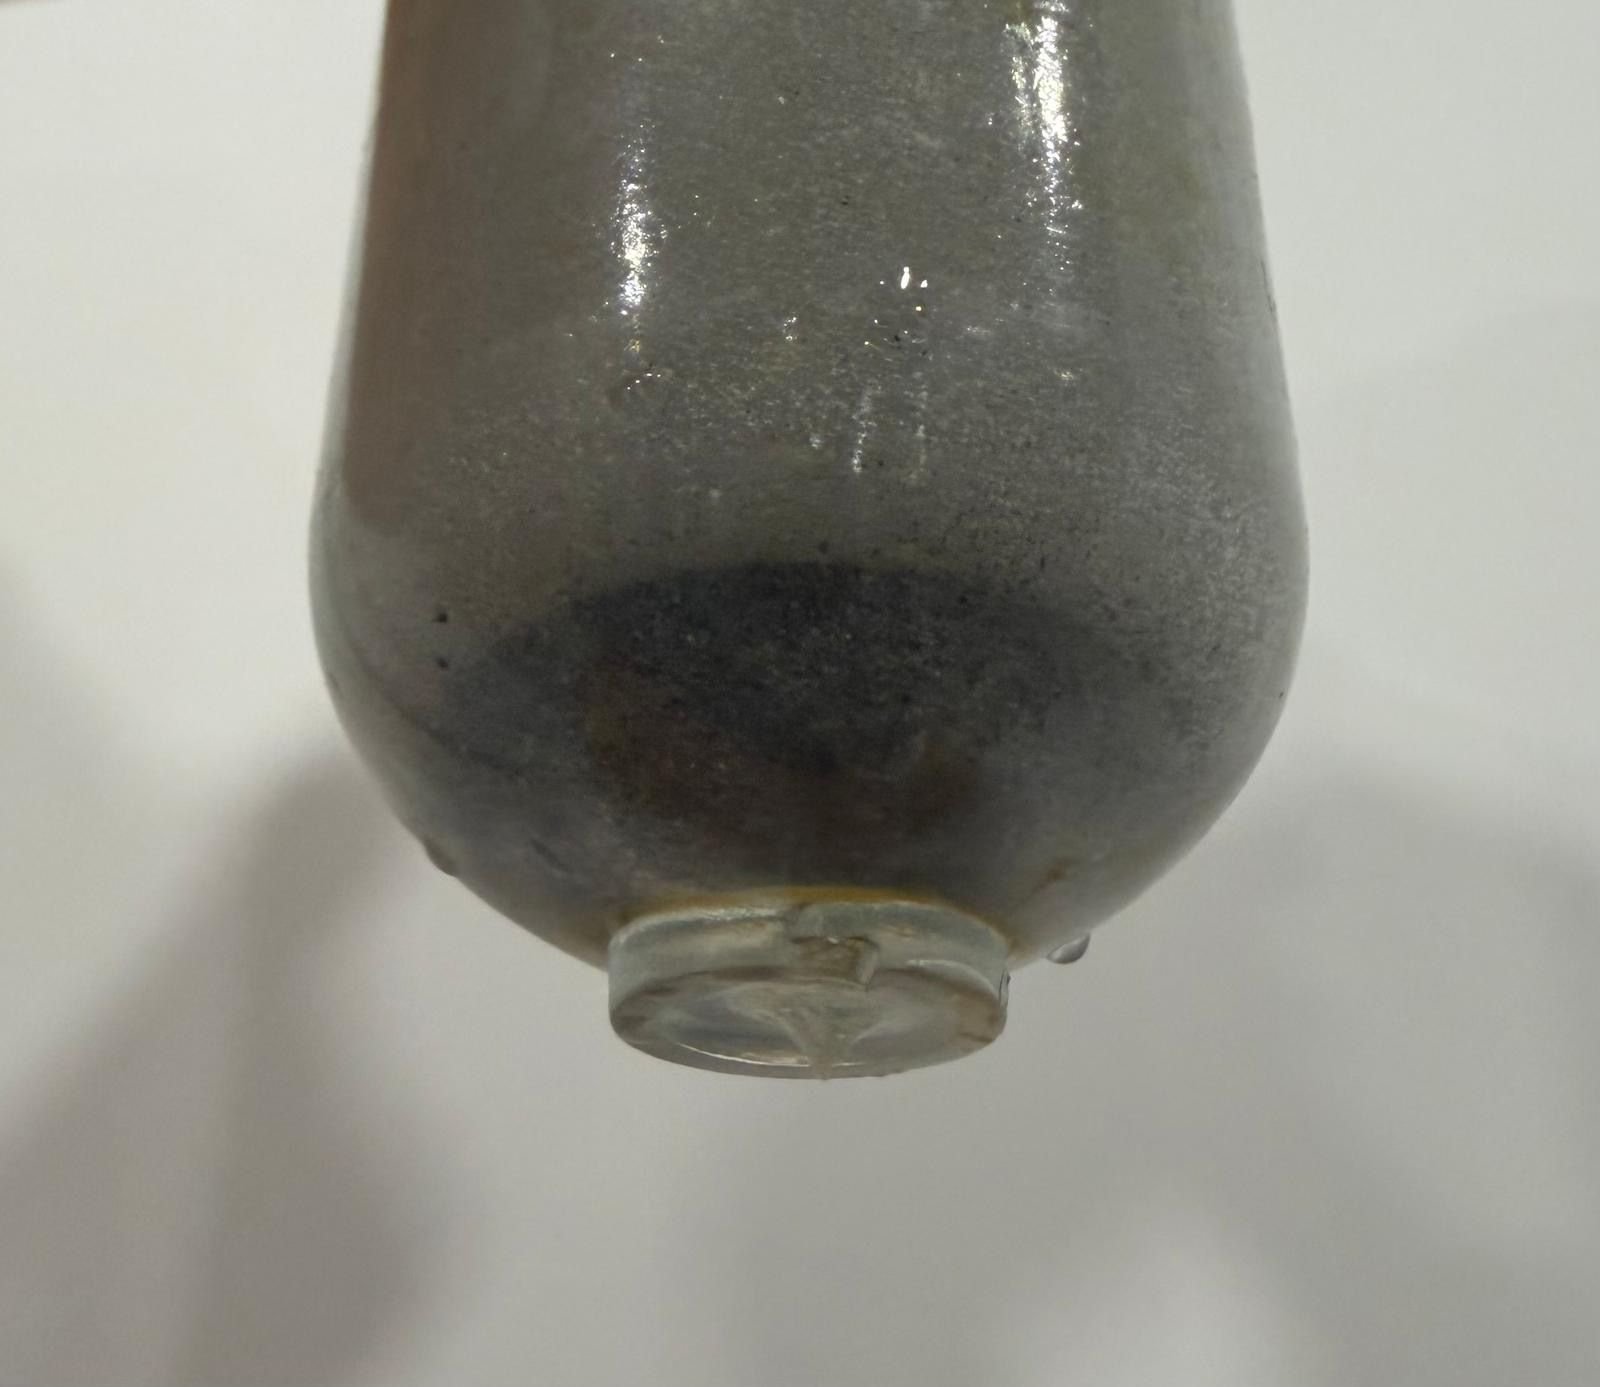
Pictures
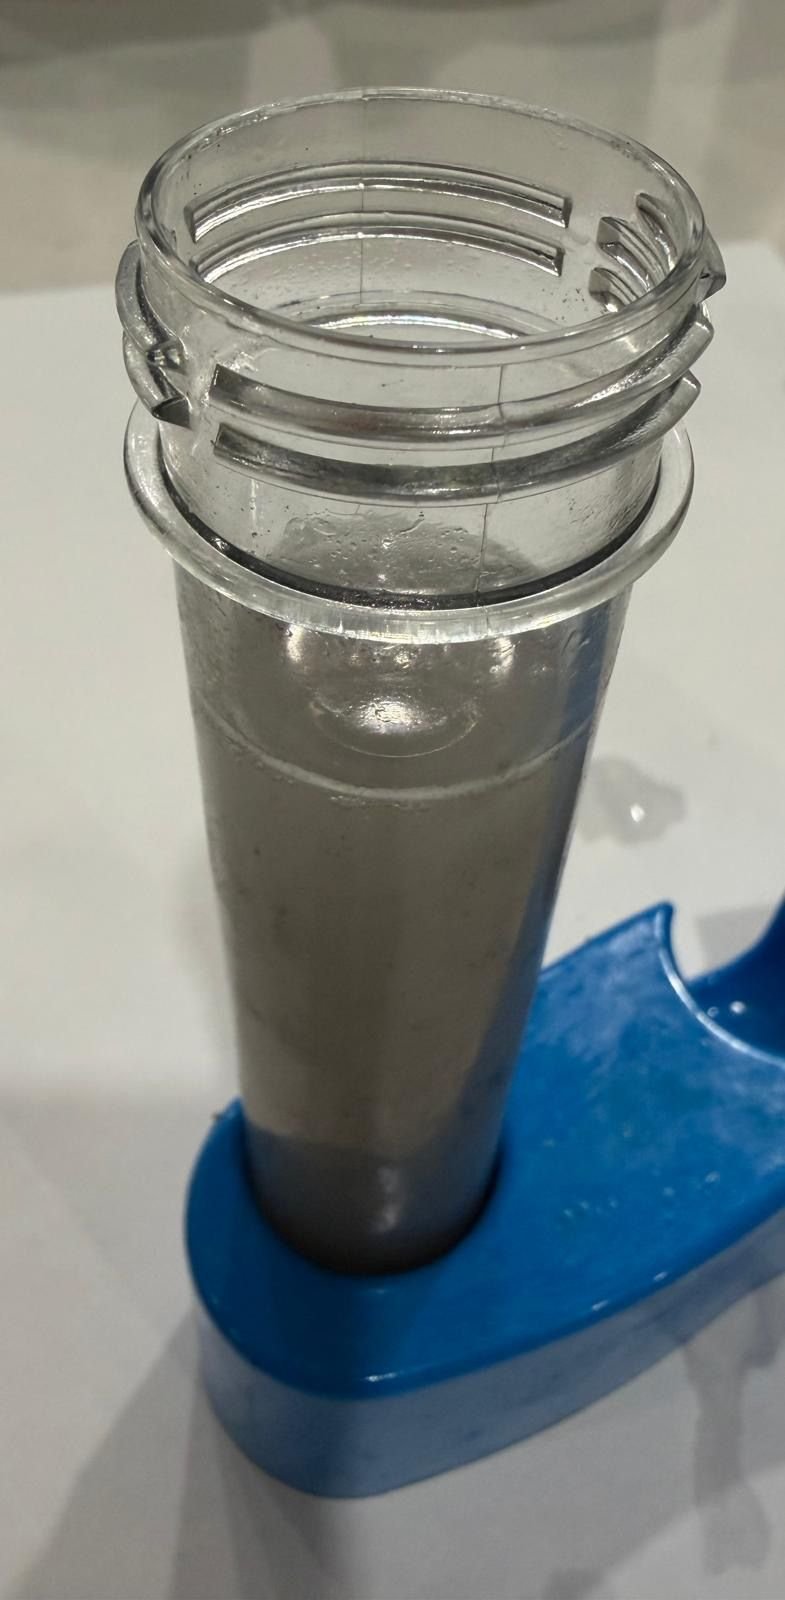
View of solution consisting biochar nanocoated by the 2.50g increment
View of extracted solution with 95.8% of phosphate removed (originally consisting biochar nanocoated by the 1.50g increment)
The following five pictures are views of the resultant magnetite nanoparticle aggregation. Aggregation, as shown in the following pictures, was observed in the form of black deposits sunken to the bottom which became noticeable when the solution is carefully drained and the nanocoated biochar sample is removed from the solution.
Analysis


Trends and Evaluation
When comparing the separate magnetite loading increments of 0.50g and 1.00g to the control value for every 100mg/L increase in salt conconcentration, both increments produced noticeably reduced phosphate adsorption percentages, with the amount that is reduced becoming larger each time. The data for both increments exhibits a non-linear change in the phosphate adsorption percentage, especially for the 0.50g magnetite loading increment for which the decrease in percentage largens significantly more each time in comparison to the 1.00g magnetite loading increment. First, the phosphate adsorption percentage dropped from 87.8% at salt concentration of 100mg/L to 63.9% at salt concentration of 1000mg/L (23.9% total decrease) for the magnetite loading increment of 0.50g. Second, the phosphate adsorption percentage dropped from 93.0% at salt concentration of 100mg/L to 84.8% (8.2% total decrease) at salt concentration of 1000mg/L for the magnetite loading increment of 1.00g. In general, based on the overall evidence for the magnetite loading increments 0.50g and 1.00g, the decrease in the percentage of phosphate adsorbed will experience a magnitudinal decrease for each 100mg/L increase in salt concentration compared to the control value. This is because the increments in magnetite loading are insufficient to effectively compensate for the additional anionic chloride ions causing increased competition in the Stern layer for the anionic phosphate to locate surface binding sites. As the reduction in the percentage of phosphate adsorbed magnifies, the loaded nanocoat for either increment approaches a point at which the physical obstructions posed by the chloride ions obstruct the transport of phosphate, despite it possessing a higher affinity for the protonated magnetite. With increasing salt concentration, the severity of this obstruction continues to intensify. This is because the sodium and chloride ions further decrease the Debye length by compressing the diffuse layer which potentially lowers the amount of phosphate ions experiencing electrostatic attraction because the distance that the ion cloud extends outwards is increasingly limited. As a result, similarly to the diffuse layer compression, the amount of phosphate ions channeled towards the Stern layer is significantly lowered. When fewer phosphate ions are present in the Stern layer the ligand exchange occurrence is limited and reduces inner sphere complexation due to reduced phosphate ions available to displace the hydroxyl in the surface groups (Fe-OH2+). Hence, Fe-O-P linkages cannot be established since chemical coordination bonds are not initiated as phosphate, the lewis base, is not present to donate electron density from its oxygen to the Fe.
Specifically, for each 100mg/L increase in salt concentration, the magnitude of decline in the phosphate adsorption percentage was lower at the magnetite loading increment of 1.00g compared to 0.50g. Evidently, at a salt concentration of 100mg/L, the phosphate adsorption percentage for the magnetite loading increment of 0.50g and 1.00g was already below the control yield of 96.0%, at 87.8% (dropping to 63.9%) and 93.0% (dropping to 84.8%) respectively. Based on the data, the increments of 0.50g and 1.00g in magnetite loading were not sufficient to offset the compressed diffuse layer by reinforcing electrostatic attraction. For the magnetite loading increment of 1.00g, compared to 0.50g, greater surface binding sites were formed, due to more magnetite nanoparticles introducing Fe which created direct bonds with the oxygen from the surrounding H2O and hydroxylated the positively charged magnetite (Fe-OH2+). And when more hydroxylated magnetite groups compose the surface, the space restriction within the Stern layer can be mitigated to a greater extent opposed to if the magnetite loading increment was 0.50g at which fewer magnetite surface groups are established. Because a higher number of protonated magnetite surface groups are present, the Debye length will increase at control conditions because the ionic cloud can extend a greater distance into the solution. Hence, when the salt concentration increases, the Debye length will be reduced to a lesser extent as to if the magnetite loading increment was 0.50g, since there will be comparatively more magnetite surface groups offsetting the reduced distance spanned by the diffuse layer. Ultimately, the magnetite loading increment of 1.00g will experience a lower magnitude of decline in phosphate adsorption for each 100mg/L increase in salt concentration compared to the increment of 0.50g. This is because a comparatively higher amount of phosphate ions can be channeled towards the Stern layer to undergo ligand exchange and establish inner sphere complexes (Fe-O-P linkages).
When comparing the magnetite loading increment of 1.50g to the control value for each 100mg/L increase in salt concentration, a relatively constant phosphate adsorption percentage was maintained with minor discrepancies. As greater magnetite nanoparticles are loaded in proportion to increasing salt concentrations, it was evident in the data as the average phosphate adsorption percentage primarily remained fixed at 95.9% and the highest difference recorded from the controlled value of 95.9% was 95.8 (-0.01%). This is because incrementing the magnetite loading quantity by 1.50g causes the higher electrostatic attraction to fully offset the reduced Debye length due to more concentrated magnetite surface groups collectively exerting a stronger electrostatic gradient within the diffuse layer. Thus, although the diffuse layer could not significantly extend the ionic cloud outwards, the higher level of distinction in the electrostatic gradient facilitates ligand exchange by efficiently transporting the phosphate ions towards the Stern layer. Once the phosphate ions settle into the Stern layer, they serve as a lewis base and transfer electron density from phosphate’s oxygen to the Fe on surface groups, forming chemical coordination bonds to establish inner sphere complexes (Fe-O-P linkages). Compared to the magnetite loading increments of 0.50g and 1.00g, the increment 1.50g strikes a relatively stable balance between the Debye length reductions and the strong electrostatic gradient; thus, the phosphate adsorption percentage remains more resilient against salinity. This is because, at the 1.50g loading increment, the number of magnetite surface groups remains sufficiently high in proportion to each increased salt concentration, whereas at the 0.50g and 1.00g increments the effective number of available magnetite surface sites decreases as salt concentration rises. Since the quantity of surface sites directly correlates with the percentage of phosphate adsorbed, the 1.50g loading is better able to preserve adsorption performance under ionic compression. Additionally, magnetite nanoparticle aggregation did not occur at any given ionic strength of the 1.50g magnetite loading increment. This was qualitatively observed as no irregular black clusters formed near the bottom of the test vial. This is due to non-excessive loading of magnetite leaving sufficient spacing between Fe at which van der Waals could not trigger the momentary shift in electron polarity, and hence, the temporary dipoles driving aggregation could not be established. Effectively, with the aggregation process obstructed, the magnetite surface sites do not internally agglomerate into clusters, thus paving the path for optimal phosphate adsorption due to maximized exposed binding sites on the biochar surface.
When comparing the separate magnetite loading increments of 2.00g and 2.50g to the control value for every 100mg/L increase in salt conconcentration, both increments initially produced a spike in the phosphate adsorption percentage and then dipped significantly, with a greater magnitude of decline each time. Firstly, both the loading increments initially spiked phosphate adsorption above the control value of 95.9. Evidently, at a salt concentration of 100mg/L, the magnetite loading increments of 2.00g and 2.50g yield a phosphate adsorption percentage of 96.6% and 97.2% respectively, yet both peaked at a maximum percentage of 99.8%. This is because when the magnetite loading increment is increased, more of the nanoparticles can become hydroxylated to establish magnetite surface sites. With such a quantity of binding sites on the biochar, the collective electrostatic gradient exerted fully offsets the reduced Debye length against comparatively stronger phosphate attraction. Thus, although the diffuse layer limits coverage of phosphate ions through reduced ionic cloud extension, the loss is compensated for by attracting significantly higher amounts of phosphate ions within the ionic cloud than the amount that were excluded due to limitations on the Debye length. And since the phosphate ions experience stronger electrostatic attraction within the ionic cloud, an increased amount will be channeled towards the Stern layer to initiate ligand exchange and form inner sphere complexes with the magnetite surface sites. Therefore, boosting the percentage of phosphate adsorbed. Aside from the increase compared to the control value, the magnetite loading increment 2.50g, reached the peak before the increment 2.00g. As evident in the data, the common maximum phosphate adsorption percentage of 99.8% was reached at a salt concentration of 200mg/L and 100mg/L at the magnetite loading increments of 2.50g and 2.00g respectively. This is because the larger increment of 2.50g will ultimately load a greater quantity of magnetite nanoparticles compared to the increment 2.00g. Hence, the increment of 2.50g will compensate to a comparatively larger degree for the excluded phosphate ions due to reduced Debye length. Ultimately, with greater phosphate ions being channeled towards the Stern layer, the rate of inner sphere complexation would proportionally increase, which directly correlates to a greater phosphate adsorption percentage. Second, as the loading increments are continuously applied after the spike in phosphate adsorption, the percentage only dropped from the maximum of 99.8%. Compared to the control value of 95.9%, the percentage declined in a non-linear manner to 69.7% and 50.4% at a salt concentration of 1000mg/L for the loading increments 2.50g and 2.00g respectively. Based on the qualitative observations, small black clusters formed near the bottom of the test vial and progressed in quantity for each 100mg/L salt concentration increase past 100mg/L and 200mg/L for the increments 2.50g and 2.00g respectively. Overall, the phosphate adsorption percentage at the maximum (99.8%) was relatively close to 100%, thus applying the loading increment an additional time would leave excess magnetite nanoparticles. While the magnetite nanocoat will physically remain on the biochar, the nanoparticles protonate upon placement in the phosphate solution around pH 6. Simultaneously, the Fe hydroxylates via donation of electrons from the surrounding oxygen form H2O that donates electrons to establish Fe-OH2+. The Fe-OH2+ groups left exposed on the surface serve as phosphate binding sites, and with increased magnetite loading the number of exposed magnetite surface sites increases. However, as observed, with excessive magnetite loading through high increments, the surface sites become more saturated and drive aggregation due to reduced distance between the sites. During, aggregation van der Waals forces dominate and gradually produce temporary dipoles by momentarily shifting electron placement to alter polarity. The rapid alteration triggers a minor attractive force amongst adjacent magnetite surface sites. On a relatively larger scale with greater saturation, the exposed sites detach from the biochar and become buried within clusters called aggregates that appear as small black irregular precipitates. The aggregates still consist of magnetite surface sites, but the overall structure is not supported by a chemical scaffold like biochar and many sites become inaccessible internally. Thus, if the amount of magnetite surface sites on the biochar are reduced, a weaker electrostatic gradient will be exerted, directly translating to a diminishing phosphate adsorption percentage due to fewer ions being channeled towards the Stern layer to establish the inner sphere complexes. Aside from aggregation, the initially saturated Fe-OH2+ on the biochar surface further obstruct phosphate adsorption by concentrating over the mesopores and micropores. The mesopores and micropores on the biochar host internal magnetite surface sites and provide additional transport pathways to phosphate ions locating binding sites, facilitating inner sphere complexation by fixing sites for ligand exchange. Hence, at the magnetite loading increment of 2.50g the magnitude of decline is comparatively larger than the one recorded at 2.00g. Evidently from the maximum of 99.8% to the phosphate adsorption at a salt concentration of 1000mg/L, the percentage drops 30.1% and 49.4% given the increments 2.00g and 2.50g respectively. With larger increments in magnetite loading, despite the phosphate adsorption initially increasing at a comparatively quicker rate, the percentage will also drop at a comparatively quicker rate after the peak. This is because the increment of 2.50g loads comparatively greater magnetite nanoparticles each time, meaning aggregation occurs at a quicker rate than it would at the 2.00g increment. Furthermore, the surface becomes initially saturated within a shorter time, thus accelerating both site saturation and interparticle aggregation. As a result, the exposed functional groups capable of ligand exchange diminish more rapidly, producing a comparatively steeper post-peak decrease in phosphate uptake. Thus, at the magnetite loading increment of 2.50g, the larger percentage of phosphate adsorption reduced each time compounds to a drop of 49.4% measured at the salt concentration of 1000mg/L which is greater in comparison to the drop of 30.1% measured at the same salinity but with the 2.00g increment.
Outliers
The first outlier observed in the data was noted during trial 1 when the 1.00g magnetite loading increment yielded a phosphate adsorption percentage of 84.5% at a salt concentration of 300mg/L. For example, this is considered to be an outlier because 84.5% is closer to the phosphate adsorption percentage 84.1% yielded at the same salt concentration 300mg/L when the magnetite loading increment was 0.50g. Furthermore, in comparison, the phosphate adsorption percentages for the same 1.00g increment at the same 300mg/L salt concentration were 92.6% and 92.6% for trial 2 and trial 3 respectively, far less than 84.5% observed. A potential reason for this outlier could be that when incrementing the magnetite nanoparticle load by 1.00g during the preparation of the nanocoated biochar samples, weight measurements could have been inaccurately stated on the scale. Thus, despite having a sufficient nanocoat, if the scale understated the quantity of the nanocoat, then potentially additional magnetite nanoparticle loads would have been applied on the biochar. And greater magnetite nanoparticles on the pre-soaked biochar surface means increased opportunities to establish magnetite surface sites upon hydroxylation in the solution. Hence, in proportion to the 300mg/L salt concentration, the biochar could have been over-coated, leading to the creation of possible aggregates. This is because minor attractive forces pull the magnetite surface sites into clusters, due to van der Waals forces producing temporary dipoles. In summary, due to the misinterpretation of the actual nanocoat quantity on the biochar, additional unnecessary magnetite nanoparticle amounts could have been loaded, leading to aggregation which ultimately causes the unexpected decline in the phosphate adsorption percentage.
The second outlier observed in the data was noted during trial 3 when the 1.5g magnetite loading increment yielded a phosphate adsorption percentage of 96.8% at a salt concentration of 500mg/L. For example, considering the 1.5g increment, this is considered to be an outlier because 96.8% increased by 0.1% from the previous phosphate adsorption percentage of 96.7% at 400mg/L salt concentration. In comparison, at the same 1.5g increment and the same 500mg/L salt concentration during trial 1 and trial 2, the phosphate adsorption percentage decreased as expected from the previous percentage of 96.5% and 96.7% by 3.3% and 3.5% respectively. Considering that the increase in the phosphate adsorption percentage was relatively minor at 96.8%, a potential reason for this unexpected increase instead of decrease in the phosphate adsorption percentage could be due to minor fluctuations in the temperature of the solution, biochar, and surrounding environment. This is because higher temperatures contribute to the weakening of the bonds between the magnetite surface sites and phosphate, while lower temperatures can reduce molecular motion. For example, despite taking measures to avoid temperature fluctuations, minor temperature increases enable the phosphate ions to gradually gain energy required for transport to the Stern layer. And with greater energy, the more efficient the transport process to the Stern layer becomes as the phosphate ions can travel at a faster rate. Thus, ultimately resulting in a minor increase in the phosphate adsorption percentage as more inner sphere complexes are established due to greater opportunities for ligand exchange.
Conclusion
In conclusion, the hypothesis stating “If the nanocoat loading of magnetite is incremented by 2.00g, starting from 0.50g for each +100mg/L increase in salt concentration, then the phosphate adsorption percentage will remain constant” was proven incorrect. As supported by the data, the average phosphate adsorption percentage at the magnetite loading increment of 2.00g heavily fluctuated. Initially yielding 96.6% at 100mg/L, then reaching a maximum of 99.8% at 300mg/L, and dropping to 69.7% at 1000mg/L, the magnetite loading increment of 2.00g did not consistently yield a phosphate adsorption percentage controlled around 95.9% when compared the increment of 1.50g. Evidently, the phosphate adsorption percentage maintained with the increment of 1.50g can be compared to the control value of 95.9% due to the percentage primarily controlled at 95.9% with minor fluctuations of, at most, –0.1% yielding 95.8% observed at the salt concentrations of 100mg/L, 300mg/L, and 400mg/L. Therefore, to most accurately answer the initial question, by what loading increments does the magnetite nanocoat quantity on biochar need to be adjusted with increasing salinity to maintain a constant phosphate adsorption percentage, it is evident that 1.50g loading increments in magnetite nanocoat for each 100mg/L increase in salt concentration will maintain a similar phosphate adsorption percentage compared to the control value as supported. Although the percentage is not exactly 95.9% at every given salt concentration, the maximum recorded fluctuation measures –0.1%, yielding 95.8% at 100mg/L, 300mg/L, and 400mg/L and 95.9% at the remaining salt concentrations. This is the greatest consistency in comparison to the phosphate adsorption percentages yield by other tested magnetite loading increments. To elaborate, regardless of the increasing salt concentrations of the phosphate solution, the incremental 1.50g loading fully offset the reduction of the Debye length because the biochar surface, optimally saturated with magnetite surface sites, establishes a stable electrostatic gradient. Due to a consistent electrostatic force exerted within the diffuse layer, the quantity of phosphate ions channeled towards the Stern layer remains relatively constant. This is because despite the reduced ionic cloud distance covering fewer phosphate ions, the stronger electrostatic gradient attracts greater phosphate ions physically within the ionic cloud to compensate for the amount excluded due to limitations on the extension of the diffuse layer into the solution. As a result, the quantity of phosphate ions channeled towards the Stern layer remains constant in proportion to the salt concentration. Once within the Stern layer, the negatively charged phosphate ions serve as a Lewis base locating directly exposed magnetite surface sites or sites within the nanocoated mesopores and micropores of the biochar. The magnetite surface sites will be protonated at a pH of 6, and from the phosphate’s oxygen, electron density is donated to the Fe from Fe–OH₂⁺. Thus, since the phosphate possesses a stronger affinity for Fe, the hydroxyl ligand, OH₂⁺, is destabilized and detached from the Fe–OH₂⁺, paving the path for ligand exchange requiring chemical coordination bonds to be initiated prior to the sharing of electrons between Fe and phosphate. Taking the chemical structure of Fe–O–P linkages, inner sphere complexes are established to lock the phosphate in place on surface binding sites and exposed binding sites within the mesopores and micropores of the biochar. Unlike higher magnetite loading increments like 2.00g and 2.50g, aggregation did not occur at 1.50g, significantly helping to maintain a constant phosphate adsorption percentage relatively controlled at the control value of 95.9%. For example, increasing the increment value above 1.50g would cause the phosphate adsorption percentage to initially spike and then drop substantially below the control value of 95.9%. The progressive percentage drop represents higher rates of aggregation because with increased addition of magnetite nanoparticles, the resultant surface sites form with less separation between each. Therefore, van der Waals forces dominate to trigger momentary attractive forces between the surface sites as temporary dipoles are created. The attractive forces, through aggregation, eventually pull adjacent surface sites into clusters and sink to the bottom of the test vial as observable black irregular precipitates. These aggregates ultimately reduce phosphate adsorption since the magnetite surface sites structurally reorganize, which decreases the collective electrostatic force exerted within the diffuse layer from the nanocoated biochar surface. And the overall weaker electrostatic gradient directly correlates to reduced adsorption due to fewer phosphate anions within the given Debye length channeled toward the Stern layer to establish inner sphere complexes. However, by using the 1.50g increment, the magnetite surface groups will not extensively saturate the biochar surface and drive aggregation, nor obstruct the entry pathways to the internally exposed sites within the biochar’s mesopores and micropores. Otherwise, decreasing the increment value below 1.50g translates to fewer magnetite surface sites because of less nanoparticle interactions with H₂O leading to the formation of hydroxylated surface groups (Fe–OH₂⁺). Hence, the collective force exerted by the nanocoated biochar surface is comparatively weaker and the quantity of phosphate ions attracted within the Debye length is substantially lower than the quantity of phosphate ions excluded due to Debye length reductions. As well, the phosphate adsorption percentage progressively drops with the magnitude of decline growing larger for each 100mg/L increase in salt concentration. To sum it up, by applying the magnetite loading increment of 1.50g, the quantity of additional phosphate ions attracted within the Debye length is relatively equal to the quantity of phosphate ions excluded due to Debye length reductions. Furthermore, with increasing salt concentration, the proportional balance is maintained, yielding a constant quantity of phosphate ions channeled towards the Stern layer to undergo ligand exchange to form inner sphere complexes. To conclude based on the data collected, if the nanocoat loading of magnetite is incremented by 1.50g, starting from 0.50g for each +100mg/L increase in salt concentration, then the phosphate adsorption percentage will remain constant.
Application
Applications
Municipal and Industrial Wastewater Treatment: Depending on the source ranging from food processing brines, textile dyeing effluent, fertilizer manufacturing runoff, or mixed sewage with road salts, municipal and industrial wastewater treatment plants frequently encounter wastewater streams containing highly variable salinity. Although traditional phosphate removal systems are primarily designed to respond solely to the concentration of phosphate, fluctuations in salinity drastically obstruct the adsorption processes by competing for common binding sites on adsorbent materials. This means that wastewater treatment systems calibrated for low-salinity influent may remove significantly less phosphate during unexpected rises, resulting in inconsistent removal efficiency. Magnetite nanocoated biochar, compared to traditional methods, has been proven a cost effective and promising adsorbent for large-scale phosphate treatment, but its performance directly correlates to the amount of magnetite applied to the biochar surface. To maintain the same percentage of phosphate adsorbed, higher salinity wastewater requires proportionally higher magnetite loading since salinity reduces the quantity of available binding sites. However, excessive loading quantities lead to nanoparticle aggregation and filter malfunction due to clogging, meaning facilities must increase magnetite amounts precisely, not arbitrarily. This project directly supports wastewater plant and treatment optimization by providing the quantitative data stating the required increment of magnetite loading for each increase in salinity, while additionally identifying the loading increment threshold where nanoparticle aggregation becomes unsafe. Treatment operators could integrate the provided datasets into dosing models or operational guidelines, allowing real time adjustments in filtration media based on ionic conductivity or measures of total dissolved solids. With this relationship established, municipal and industrial plants can maintain constant phosphate removal efficiency despite fluctuating salt concentrations, resulting in more reliable treatment performance, lower material waste, and improved environmental compliance. In broader terms, preventing the excessive release of phosphate back into the environment is critical for reducing the risk of eutrophication. By keeping phosphate levels stable even under high-salinity conditions, this approach helps limit harmful algal blooms and the subsequent oxygen depletion that can devastate aquatic ecosystems.
Agriculture Industry: Agriculture soils in coastal regions, arid climates, and areas dependent on heavy irrigation often experience drastic and unpredictable changes in water salinity potentially due to fertilizer accumulation, seawater intrusion, repeated irrigation cycles, and evaporation. Thus, to improve crop growth, phosphate based fertilizers are applied. However, elevated salinity obstructs phosphate interaction with soil particles by competing for the same binding sites, decreasing the amount of phosphate available to plants as more of the phosphate is mobile. Consequently, farmers may unintentionally lose phosphate via leaching or runoff. This reduces the overall efficiency of applied fertilizers and increases environmental contamination. Recently, emerging as an effective tool for soil amendment, magnetite treated biochar ensures phosphate remains within plant accessible zones and provides stable binding sites to boost overall phosphate retention. However, how efficiently the phosphate binds to the provided sites is significantly impacted by the salinity of the soil. Insufficient magnetite loading yields poor phosphate retention and excessive loading triggers nanoparticle aggregation after certain thresholds which ultimately diminishes phosphate retention as well. This means that in order to sustain a constant performance within the system, the optimal magnetite loading must increment proportionally to the increasing salinity. This project supports agricultural optimization by setting out the quantitative data representing the required increment in magnetite loading for each increase in soil salinity. Having this relationship, farmers, agronomists, and soil scientists can accurately identify and correlate biochar formulations to practical salinity conditions instead of using traditional generalized amendments. Such data could be integrated into soil treatment guidelines or fertilizer management plans, allowing growers to maintain consistent phosphate availability to crops which reduces fertilizer loss, and limits nutrient runoff into nearby water bodies. In broader terms, maintaining consistent phosphorus retention in agricultural soils is essential for both crop productivity and environmental protection. When salinity reduces adsorption efficiency, more fertilizer is lost to leaching and runoff, driving up costs for farmers and increasing nutrient pollution in nearby waterways. By providing a precise relationship between salinity levels and the required magnetite loading on biochar, this approach allows growers to keep soil phosphate availability stable, improve fertilizer efficiency, and reduce the risk of downstream eutrophication.
Aquaculture Facilities: Aquaculture facilities ranging from artificial recirculating aquaculture system (RAS) to natural brackish fish farms and hatcheries often undergo drastic fluctuations in water salinity. Simultaneously, through circumstances involving uneaten feed, fish excretion, metabolic waste, organic breakdown, etc, the presence of phosphate continues to intensify. Traditional phosphate removal methods in aquaculture are primarily calibrated to solely phosphate concentrations, enabling substantial reductions in phosphate adsorption due to spikes in water salinity increasing competition for binding sites. For example, phosphate adsorption systems performing efficiently under low salinity conditions typically tend to remove less phosphate when the salt concentration increases. This poses the issue of inconsistent nutrient control that jeopardizes the health of the aquatic organisms and increases maintenance. Magnetite nanocoated biochar at a rough pH of , due to biocompatibility, cost effectiveness, and strong affinity for phosphate has emerged as a reliable water quality test material in aquaculture. Yet, the performance depends directly on the amount of magnetite loaded onto the biochar samples. This means that in order to sustain the constant phosphate adsorption percentage, proportionally greater magnetite loading is required for each increase in the salt concentrations. However, it is important to note that excessive magnetite nanocoating triggers nanoparticle aggregation, creating unfavourable conditions leading to filter clogging and impaired water circulation. This project directly supports aquaculture system optimization by establishing the quantitative magnetite loading increments required to maintain constant phosphate adsorption for each measurable rise in salinity. Hatchery technicians, aquaculture engineers, and water-quality managers could integrate these results into filtration design, automated dosing systems, or salinity-responsive operational protocols that adjust filter media based on conductivity or total dissolved solids readings. These datasets can be applied to RAS filters, brackish grow-out ponds, effluent polishing units, or side-stream nutrient removal columns, ensuring stable phosphate control throughout salinity changes associated with species shifts or seasonal evaporation. With this optimized relationship in place, aquaculture operations can prevent phosphate spikes that lead to algal blooms, bacterial instability, biofilter overload, or water-quality crashes, ultimately improving animal welfare, system reliability, and production efficiency. In broader terms, maintaining consistent phosphate removal in aquaculture systems is essential for both environmental protection and farm productivity. When salinity disrupts adsorption efficiency, more phosphate accumulates or is discharged into surrounding waterways, increasing the risk of eutrophication and regulatory non-compliance. By providing a precise, evidence-based relationship between salinity level and required magnetite loading, this project enables aquaculture operations to keep nutrient levels stable, reduce waste discharge, and maintain healthier, more sustainable aquatic ecosystems.
Extension and Project Improvements
-A major extension of this project would be to examine whether magnetite nanocoated biochar can additionally maintain stable adsorption of PFAS (per- and polyfluoroalkyl substances) under increasing salinity. PFAS, also known as “forever chemicals” are used in firefighting foams, textiles, coatings, and industrial applications and frequently contaminate wastewater streams containing high salt concentrations from landfill leachate, chemical manufacturing effluent, and coastal municipal wastewater. Because PFAS are extremely resistant to natural degradation and tend to persist in aquatic environments, the development of robust adsorption materials is crucial. Thus, investigating how salinity affects PFAS binding mechanisms, and determining the optimal adjustments to the magnetite loading to ensure constant PFAS removal, would build upon the core thesis of the project around maintaining stable adsorption under fluctuating ionic conditions. Exploration in this technology could ultimately benefit society by improving the purification of contaminated drinking water sources and reducing the accumulation of toxic PFAS in the environment. Consequently, communities could face fewer long-term health risks associated with PFAS exposure, such as immune dysfunction, hormonal disruptions, and increased cancer risk. In broader terms, advancing materials that remain effective despite salinity fluctuations strengthens our ability to manage emerging contaminants that pose global public health challenges.
-Future research could additionally investigate how changes to the physical structure and chemical composition of the biochar base material influence adsorption under salinity stress. For example, different types of biomass such as coconut shells, agricultural residues, or hardwoods produce biochars with distinct pore structures, surface functional groups, and internal geometries. And researchers could identify which biochar frameworks maximize magnetite dispersion without causing aggregation at higher loadings by experimenting with these variations. Next, studying how different nanocoating techniques such as solvothermal deposition or layer-by-layer assembly affect the stability of the magnetite layer in saline conditions, could lead to materials being selected that maintain their performance for longer operational lifetimes. Additionally, it would also be valuable to explore how different forms of magnetite nanocoats such as magnetite, maghemite, or mixed-phase coatings alter adsorption efficiency, salinity tolerance, and aggregation behaviour. Optimizing these structural parameters could create filtration systems that require fewer replacements, therefore reducing maintenance costs for industrial uses and municipalities. In broader terms, engineering more stable and efficient adsorption materials contributes to more sustainable water treatment practices by improving the long term operational reliability.
-Another area of study that could significantly advance this project involves designing a fully automated control system capable of regulating the magnetite loading in real time based on fluctuating salinity and phosphate levels in municipal wastewater. In real treatment operations, the concentration of total dissolved salts can vary drastically throughout the course of the day, making it challenging for plant operators to manually adjust magnetite dosing with enough precision and speed to maintain consistent phosphate removal. Hence, by developing an integrated sensing and control platform equipped with tools like inline conductivity probes to detect salinity, photometric analyzers to measure phosphate concentration, and microprocessor-based feedback algorithms, the filtration unit can autonomously calculate the exact increment or decrement of magnetite nanocoating required at any given moment. The system could then deliver these adjustments using micro-actuated dosing pumps or automated regeneration modules that renew and recalibrate the nanocoating layer without the need for manual intervention. Overall, this automated approach would eliminate errors caused by delayed human responses and could ensure that adsorption performance remains stable despite wastewater chemistry changing unexpectedly and sharply. Over time, municipalities could minimize labour requirements by reducing operational costs, while simultaneously increasing reliability through continuous monitoring and automatic correction. Lastly, integrating a final verification sensor that measures phosphate levels in the treated effluent before release would create an added layer of environmental protection by preventing inadequately treated water from entering natural ecosystems.
Project Improvements: If this experiment were to be performed again, several aspects would be altered to improve the project outcomes. Given unlimited time and resources, firstly, more magnetite loading increments would be tested for more frequent increases in the salt concentration. For example, instead of a 0.50g gap between the magnetite loading increments, a shorter gap such as 0.25g could be incorporated to mitigate the minor adsorption fluctuations seen at the 1.5g increment. This is because separating the distinct magnetite loading increments between 0.00g to 2.50g, by something like 0.25g would allow 10 separate increments to be tested opposed to only the 5 increments (0.50g, 1.00g, 1.50g, 2.00g, 2.50g) tested with a 0.50g gap. Thus, improving the overall outcome with a greater number of increments tested due to a further refined and specified magnetite loading increment yielding constant phosphate adsorption. Second, given unlimited time and resources, the salt concentration increases of 100mg/L starting from 0.00mg/L would increase beyond 1000mg/L rather than stopping at 1000mg/L. Extending the salinity range opens possibilities to characterize the phosphate adsorption behavior under high salt concentration conditions that better simulate industrial brines and severe wastewater scenarios. And hence, provide valuable insight for the project by revealing whether the observed adsorption trends persist, plateau, or deteriorate at higher ionic strengths. Although the batteries were replaced once per trial, to further improve the experiment, more frequent battery changes would be performed on the digital phosphate meter to ensure consistent functioning of the electronic device. Otherwise, because of the digital phosphate meter using slightly weaker batteries on some trials, the phosphate measurements taken for certain trials may have been inaccurate due to the device not functioning at its maximum capabilities. Lastly, the number of trials performed on the experiment could be extended beyond three to potentially four or five given unlimited time and resources. Including data from a greater number of trials significantly improves the results of the experiment by allowing for more comprehensive averages when analyzing the overall data collected. Thus, the identification of major outliers and trends within the data can be reinforced simply due to more trials presenting data that supports or conflicts with the existing outliers and trends.
Sources Of Error
Minor Inconsistencies in Magnetite Nanocoating Between Biochar Samples -Despite the weight measures performed on the final nanocoated biochar samples, small lumps may form within the biochar-magnetite slurry prior to drying. Thus, once dried, the distribution of the magnetite may contain minor imbalances. Prior to mixing with the biochar, the magnetite powder was sifted to ensure consistency in the fine-grained powder. Yet, extremely minor lumps within the sample may remain and eventually become mixed with the biochar, meaning that specific batches of the biochar are more likely to experience aggregation. This is because the lumps within specific regions on the biochar cause greater concentration of magnetite in some areas. And overall, these specific areas are more likely to experience aggregation since upon interaction with H₂O, hydroxylated magnetite surface sites are established with minimal separation between each other. Consequently, due to aggregation, the collective electrostatic gradient initially exerted is relatively weaker and unable to maximize the attraction of phosphate, thus slightly lowering phosphate adsorption.
Cross-Contamination Between Samples -Despite rinsing the stirring rod between trials and handling each beaker carefully, there exists the possibility that trace amounts of phosphate or nanocoated biochar may be unintentionally transferred between samples. For instance, residual biochar particles adhering to the stirring rod or small droplets of phosphate solution may enter subsequent beakers. This can slightly alter the phosphate concentration in the solution, either increasing it if phosphate is added or decreasing it if magnetite nanocoated biochar is transferred. Consequently, the measured adsorption percentages for the affected samples may not fully represent the true adsorption capacity of the intended biochar loading. In cases with the stirring rod transferring small solution droplets containing phosphate into other test vials, the total dissolved phosphate present in the new test vial increases. This directly elevates phosphate adsorption for that specific trial because the exerted electrostatic gradient reaches slightly more phosphate ions, meaning a greater number of phosphate ions channeled towards the Stern layer. Therefore, slightly more inner sphere complexes can be established that lock the phosphate into Fe-O-P linkages, directly correlating to minor increase in the phosphate adsorption percentage. Even though the transfers are minor, the cumulative effect over multiple trials can slightly shift the apparent relationship between ionic strength and the required magnetite loading, potentially causing a minor overestimation or underestimation.
Minor Inconsistencies in Measuring Instrument Function -Although the digital phosphate meter was calibrated according to the manufacturer’s guidelines, minor fluctuations in measurement are possible due to rare malfunctions in the precision limits of the device. The quantity of the remaining phosphate within the extracted sample solution is measured by the digital test meter in parts per million which directly correlates to mg/L. For example, slight inconsistencies may arise if the probe is not positioned exactly at the same depth in each sample, or if ambient electrical interference occurs near the meter during readings. These variations can result in small deviations in the measured phosphate concentration, even when the actual solution composition is identical. Consequently, the adsorption percentage recorded may slightly differ from the true value, which could affect the calculated magnetite loading required to maintain constant phosphate adsorption. Over multiple trials and across the full range of ionic strengths, these minor deviations can create subtle inconsistencies in the data, due to extremely minor malfunctions in the functioning of the device.
Minor Fluctuations in Temperature Between Tests -Regardless of ensuring that the nanocoated biochar samples were stored at consistent temperatures, minor fluctuations in the temperature of the solution are possible. For example, higher temperatures will transfer greater energy to the phosphate ions and sodium chloride ions. Thus, due to minor changes in surrounding external conditions or the testing environment, the rate of phosphate adsorption can shift with higher temperatures speeding up the adsorption process. This is because when the phosphate ions contain more energy, the ions excite quickly. This means that the phosphate ions undergo ligand exchange at a quicker rate because when channeled towards the Stern layer due to electrostatic attraction, the phosphate ions approach and fill up the Stern layer faster. Hence, with quicker ligand exchange, more inner sphere complexes can be established as Fe-O-P linkages because the phosphate forms direct bonds with the surface Fe called chemical coordination bonds to share electrons from a common oxygen attached to the phosphate. In summary, some tests throughout the experiment have the possibility of yielding slightly higher or lower actual phosphate adsorption percentages despite measures being taken to mitigate the impact of fluctuating temperature such as not leaving the solution test vials directly open, double checking the temperature of the solution with a thermometer twice per test, avoiding direct exposure to sunlight for glass test vial containing phosphate, etc.
Citations
1. Wastewater characteristics and effluent quality parameters. (n.d.). https://www.fao.org/4/T0551E/t0551e03.htm#1.2%20characteristics%20of%20wastewaters
Alam, M. S., Bishop, B., Chen, N., Safari, S., Warter, V., Byrne, J. M., Warchola, T., Kappler, A., Konhauser, K. O., & Alessi, D. S. (2020). Reusable magnetite nanoparticles–biochar composites for the efficient removal of chromate from water. Scientific Reports, 10(1), 19007. https://doi.org/10.1038/s41598-020-75924-7
Alshehri, M. A., & Pugazhendhi, A. (2024). Biochar for wastewater treatment: Addressing contaminants and enhancing sustainability: Challenges and solutions. Journal of Hazardous Materials Advances, 16, 100504. https://doi.org/10.1016/j.hazadv.2024.100504
Ambaye, T. G., Vaccari, M., Van Hullebusch, E. D., Amrane, A., & Rtimi, S. (2020). Mechanisms and adsorption capacities of biochar for the removal of organic and inorganic pollutants from industrial wastewater. International Journal of Environmental Science and Technology, 18(10), 3273–3294. https://doi.org/10.1007/s13762-020-03060-w
Biochar’s secret power could change clean water forever. (2025, September 25). ScienceDaily. https://www.sciencedaily.com/releases/2025/09/250926035019.htm
Daou, T. J., Begin-Colin, S., Grenèche, J. M., Thomas, F., Derory, A., Bernhardt, P., Legaré, P., & Pourroy, G. (2007). Phosphate adsorption properties of Magnetite-Based nanoparticles. Chemistry of Materials, 19(18), 4494–4505. https://doi.org/10.1021/cm071046v
Guo, B., Kan, E., & Zeng, S. (2024). Enhanced adsorption of aqueous perfluorooctanoic acid on iron-functionalized biochar: elucidating the roles of inner-sphere complexation. The Science of the Total Environment, 955, 176926. https://doi.org/10.1016/j.scitotenv.2024.176926
Hou, L., Liang, Q., & Wang, F. (2020). Mechanisms that control the adsorption–desorption behavior of phosphate on magnetite nanoparticles: the role of particle size and surface chemistry characteristics. RSC Advances, 10(4), 2378–2388. https://doi.org/10.1039/c9ra08517c
Joseph, S., Cowie, A. L., Van Zwieten, L., Bolan, N., Budai, A., Buss, W., Cayuela, M. L., Graber, E. R., Ippolito, J. A., Kuzyakov, Y., Luo, Y., Ok, Y. S., Palansooriya, K. N., Shepherd, J., Stephens, S., Weng, Z., & Lehmann, J. (2021). How biochar works, and when it doesn’t: A review of mechanisms controlling soil and plant responses to biochar. GCB Bioenergy, 13(11), 1731–1764. https://doi.org/10.1111/gcbb.12885
Kang, K., Hu, Y., Khan, I., He, S., & Fatehi, P. (2023). Recent advances in the synthesis and application of magnetic biochar for wastewater treatment. Bioresource Technology, 390, 129786. https://doi.org/10.1016/j.biortech.2023.129786
Kumar, R., Lamba, J., Adhikari, S., Kasera, N., & Torbert, H. A. (2024). Influence of iron-modified biochar on phosphate transport and deposition in saturated porous media under varying pH, ionic strength, and biochar dosage. Chemosphere, 370, 143932. https://doi.org/10.1016/j.chemosphere.2024.143932
Liu, L., He, N., Borham, A., Zhang, S., Xie, R., Zhao, C., Hu, J., & Wang, J. (2023). The Effect of Iron-Modified Biochar on Phosphorus Adsorption and the Prospect of Synergistic Adsorption between Biochar and Iron-Oxidizing Bacteria: A Review. Water, 15(18), 3315. https://doi.org/10.3390/w15183315
Mahmoud, E., Baroudy, A. E., Ali, N., & Sleem, M. (2020). Spectroscopic studies on the phosphorus adsorption in salt-affected soils with or without nano-biochar additions. Environmental Research, 184, 109277. https://doi.org/10.1016/j.envres.2020.109277
Sonowal, S., Koch, N., Sarma, H., Prasad, K., & Prasad, R. (2023). A Review on Magnetic Nanobiochar with Their Use in Environmental Remediation and High-Value Applications. Journal of Nanomaterials, 2023, 1–14. https://doi.org/10.1155/2023/4881952
Wang, D., Root, R. A., & Chorover, J. (2021). Biochar-templated surface precipitation and inner-sphere complexation effectively removes arsenic from acid mine drainage. Environmental Science and Pollution Research, 28(33), 45519–45533. https://doi.org/10.1007/s11356-021-13869-8
Wu, L., Zhang, S., Wang, J., & Ding, X. (2020). Phosphorus retention using iron (II/III) modified biochar in saline-alkaline soils: Adsorption, column and field tests. Environmental Pollution, 261, 114223. https://doi.org/10.1016/j.envpol.2020.114223
Zach-Maor, A., Semiat, R., & Shemer, H. (2011). Adsorption–desorption mechanism of phosphate by immobilized nano-sized magnetite layer: Interface and bulk interactions. Journal of Colloid and Interface Science, 363(2), 608–614. https://doi.org/10.1016/j.jcis.2011.07.062
Zeng, S., Lan, X., Liu, P., Zhang, Z., Cheng, X., Xu, N., & Yin, H. (2024). Removal of Phosphate from Water by Iron/Calcium Oxide-Modified Biochar: Removal Mechanisms and Adsorption Modeling. Water, 16(22), 3245. https://doi.org/10.3390/w16223245
Zhang, Z., Yu, H., Zhu, R., Zhang, X., & Yan, L. (2020). Phosphate adsorption performance and mechanisms by nanoporous biochar–iron oxides from aqueous solutions. Environmental Science and Pollution Research, 27(22), 28132–28145. https://doi.org/10.1007/s11356-020-09166-5
Zhao, Q., Xu, T., Song, X., Nie, S., Choi, S., & Si, C. (2021). Preparation and application in water treatment of magnetic biochar. Frontiers in Bioengineering and Biotechnology, 9, 769667. https://doi.org/10.3389/fbioe.2021.769667
Zhou, Z., Lu, M., Huang, Y., Zhao, C., Wang, Y., Pidou, M., Wu, M., Chen, Q., Jeffrey, P., & Pan, B. (2025). Molecular mechanistic insights towards aggregation of nano-biochar moderated by aromatic components in dissolved organic matter. Environment International, 197, 109350. https://doi.org/10.1016/j.envint.2025.109350
Acknowledgement
Firstly, I would like to acknowledge my parents for their incredible support throughout the project. Their guidance and continued support is of great significance towards this project. My parents connected me various experts in the field while also funding all of my materials cost for carrying out the experimentation. All in all, I am truly grateful to have my parents support with me throughout each stage of this project.
Next, I would like to sincerely thank Dr. Tejas Oza, an expert in the field of my project. During the research stage and planning out the experimental design, Dr. Oza kindly provided insight alongside suggestions around different methods for conducting the testing procedures. He also helped by clarifying any scientific concepts I had questions around, and for that, I am forever grateful.
Lastly, I would like to acknowledge Mr. Buhler for coordinating the science fair process. He has guided me throughout the timelines for the fair and provided helpful suggestions for a successful project. Mr. Buhler was there to answer any questions and also ensure that the project was being completed as per the timeline. Without his ongoing support, this project would not have been possible.